Article

Genetic Diversity and Fine-Scale Spatial Genetic Structure of the Endangered Shrub Birch (Betula humilis Schrk.) Populations in Protected and Unprotected Areas

by
Agnieszka Bona
1,*,
Damian Brzeziński
2 and
Katarzyna A. Jadwiszczak
1
1
Faculty of Biology, University of Białystok, Ciołkowskiego 1J, 15-245 Białystok, Poland
2
Doctoral School of Exact and Natural Sciences, University of Białystok, Ciołkowskiego 1K, 15-245 Białystok, Poland
*
Author to whom correspondence should be addressed.
Diversity 2022, 14(8), 684; https://doi.org/10.3390/d14080684
Submission received: 26 July 2022 / Revised: 17 August 2022 / Accepted: 18 August 2022 / Published: 20 August 2022
(This article belongs to the Special Issue State-of-the-Art Biodiversity Research in Poland)

Abstract

:
The genetic diversity of natural populations is a key factor in the success of long-term ecosystem protection. We studied the genetic diversity and spatial genetic structure (SGS) in three endangered shrub birch (Betula humilis) populations using seven nuclear microsatellite loci. The highest genetic variation was found in the restored Szuszalewo population in Biebrza National Park, where active prevention of thicket forest succession was recently conducted. The results of bottleneck tests were not statistically significant in each locality, although a genetic indication for population reduction was detected in the Rospuda stand, which is not actively protected. The Bayesian clustering, principal coordinates analysis, and FST estimates revealed the greatest difference between Magdzie Bagno and Rospuda samples. SGS was found in all B. humilis stands; however, it was the strongest in the Rospuda locality, where pollen and seed dispersal was limited by dense clusters of shrub birch ramets scattered among forest and brushwood plants. The weakest SGS, also supported by finding some sibling pairs in distant locations, was observed in the Szuszalewo population. The aforementioned results indicate that the active protection practices may impose an immediate beneficial effect on the restoration and maintenance of the B. humilis populations.

1. Introduction

Wetland complexes are remarkably vital because they serve as reservoirs of biodiversity and are involved in nutrient recycling, drought resistance, water purification, water storage, and minimising flood risks [1]. However, wetland areas in Europe declined continuously due to drainage for agricultural use, urban development, and forestation [2,3]. At present, wetland services are threatened by changes in water and soil biochemistry resulting from rising temperatures and changed hydrology [4]. Anthropogenic and climatic changes are affecting habitats, especially wetlands, and therefore affect the natural populations as well.
Habitat disruption and habitat loss are the key drivers of population fragmentation and reductions in population size and density [5]. As a consequence of habitat fragmentation, the genetic structure of a population is strongly influenced by genetic drift, inbreeding, and limited gene flow, which may compromise long-term population maintenance [6,7]. In small, marginal and isolated populations, habitat fragmentation can result in a reduction in genetic diversity and effective population size, as well as an enhancement of the spatial genetic structure (SGS), i.e., the non-random spatial distribution of genotypes [8,9,10]. In populations where kinship is higher among neighbouring specimens than among distant specimens, there is an increased risk of self-fertilisation and fertilisation between genetically related individuals (biparental inbreeding). Biparental inbreeding reduces the fitness of offspring through the expression of deleterious alleles, leading to inbreeding depression [11]. In self-incompatible plants, proximity of related individuals can significantly decrease reproductive performance since pollination with incompatible pollen completely prevents offspring production [12]. For these reasons, habitat degradation significantly elevates extinction rates. Because wetlands harbour unique habitats and species, their loss causes a disproportionate decline in the abundance of faunal and floral populations. Approximately one quarter of inland wetland-dependent species are currently considered globally threatened [1].
The shrub birch Betula humilis Schrk. is among the threatened wetland plant species in Europe [13]. The shrub birch is a boreal species and a glacial relict in West and Central European countries. Poland was colonised by birches originating from two distinct refugia, with the formation of an admixture zone stretching from northeastern Poland to central Belarus [14]. Analyses of cpDNA and nuclear microsatellite markers revealed a substantial level of genetic variation in northeastern Polish shrub birch populations [14,15,16], which is congruent with the observation that admixture zones of divergent lineages represent higher levels of genetic diversity than refugial areas [17]. Notwithstanding this, a significant decrease in the shrub birch population was noted during the twentieth century in Poland [13]. Betula humilis does not have strict habitat requirements, although as a poor competitor, it grows mostly on alkaline fens and wet meadows, where habitat conditions for the development of other species are unfavourable [13,18]. Melioration treatments and drainage of wetlands conducted in the twentieth century led to a decrease in groundwater levels in natural shrub birch habitats and overgrowth by competitive forest and scrub plants, which seems to be the principal cause for the decrease in generative reproduction parameters and subsequent shrub birch decline [13,18,19,20].
Life history traits influencing pollen and seed dispersal (mating systems, population density, and overlapping generations) are the strongest determinants of SGS [8]. The shrub birch is wind-pollinated, and its seeds are wind-dispersed. In general, species with extensive dispersal of propagules through wind or biotic vectors are expected to have weaker SGS or even a lack of spatial structure compared to species with gravity dispersal [8]. Nevertheless, populations of wind-pollinated species can also show significant SGS due to limitations in pollen and seed movement [21,22,23]. Low (but significant) SGS was found in some populations of Betula pubescens ssp. tortuosa in northern Sweden [24]. In the B. humilis localities, both dense clumps of shoots and other coexisting tree and scrub species can function as a barrier, hindering the dispersion of pollen and seeds. However, the existence of a spatial genetic structure in B. humilis populations was not studied thus far. In fact, inbreeding, decrease in genetic variability, and low sexual reproduction performance were recorded in some Polish shrub birch localities [16,19,20].
The goal of this study was to compare the genetic diversity and spatial distribution of genotypes in B. humilis populations of different sizes, found in three wetland areas differentiated with respect to habitat protection (one population assigned as unprotected, one as passively protected and one as actively protected), and the degree of overgrowth by other scrub and trees. The results obtained are essential for understanding factors shaping gene flow, and thus SGS patterns, in endangered shrub birch populations; hence, they can be used in the future for effective conservation of the species’ genetic resources.

2. Materials and Methods
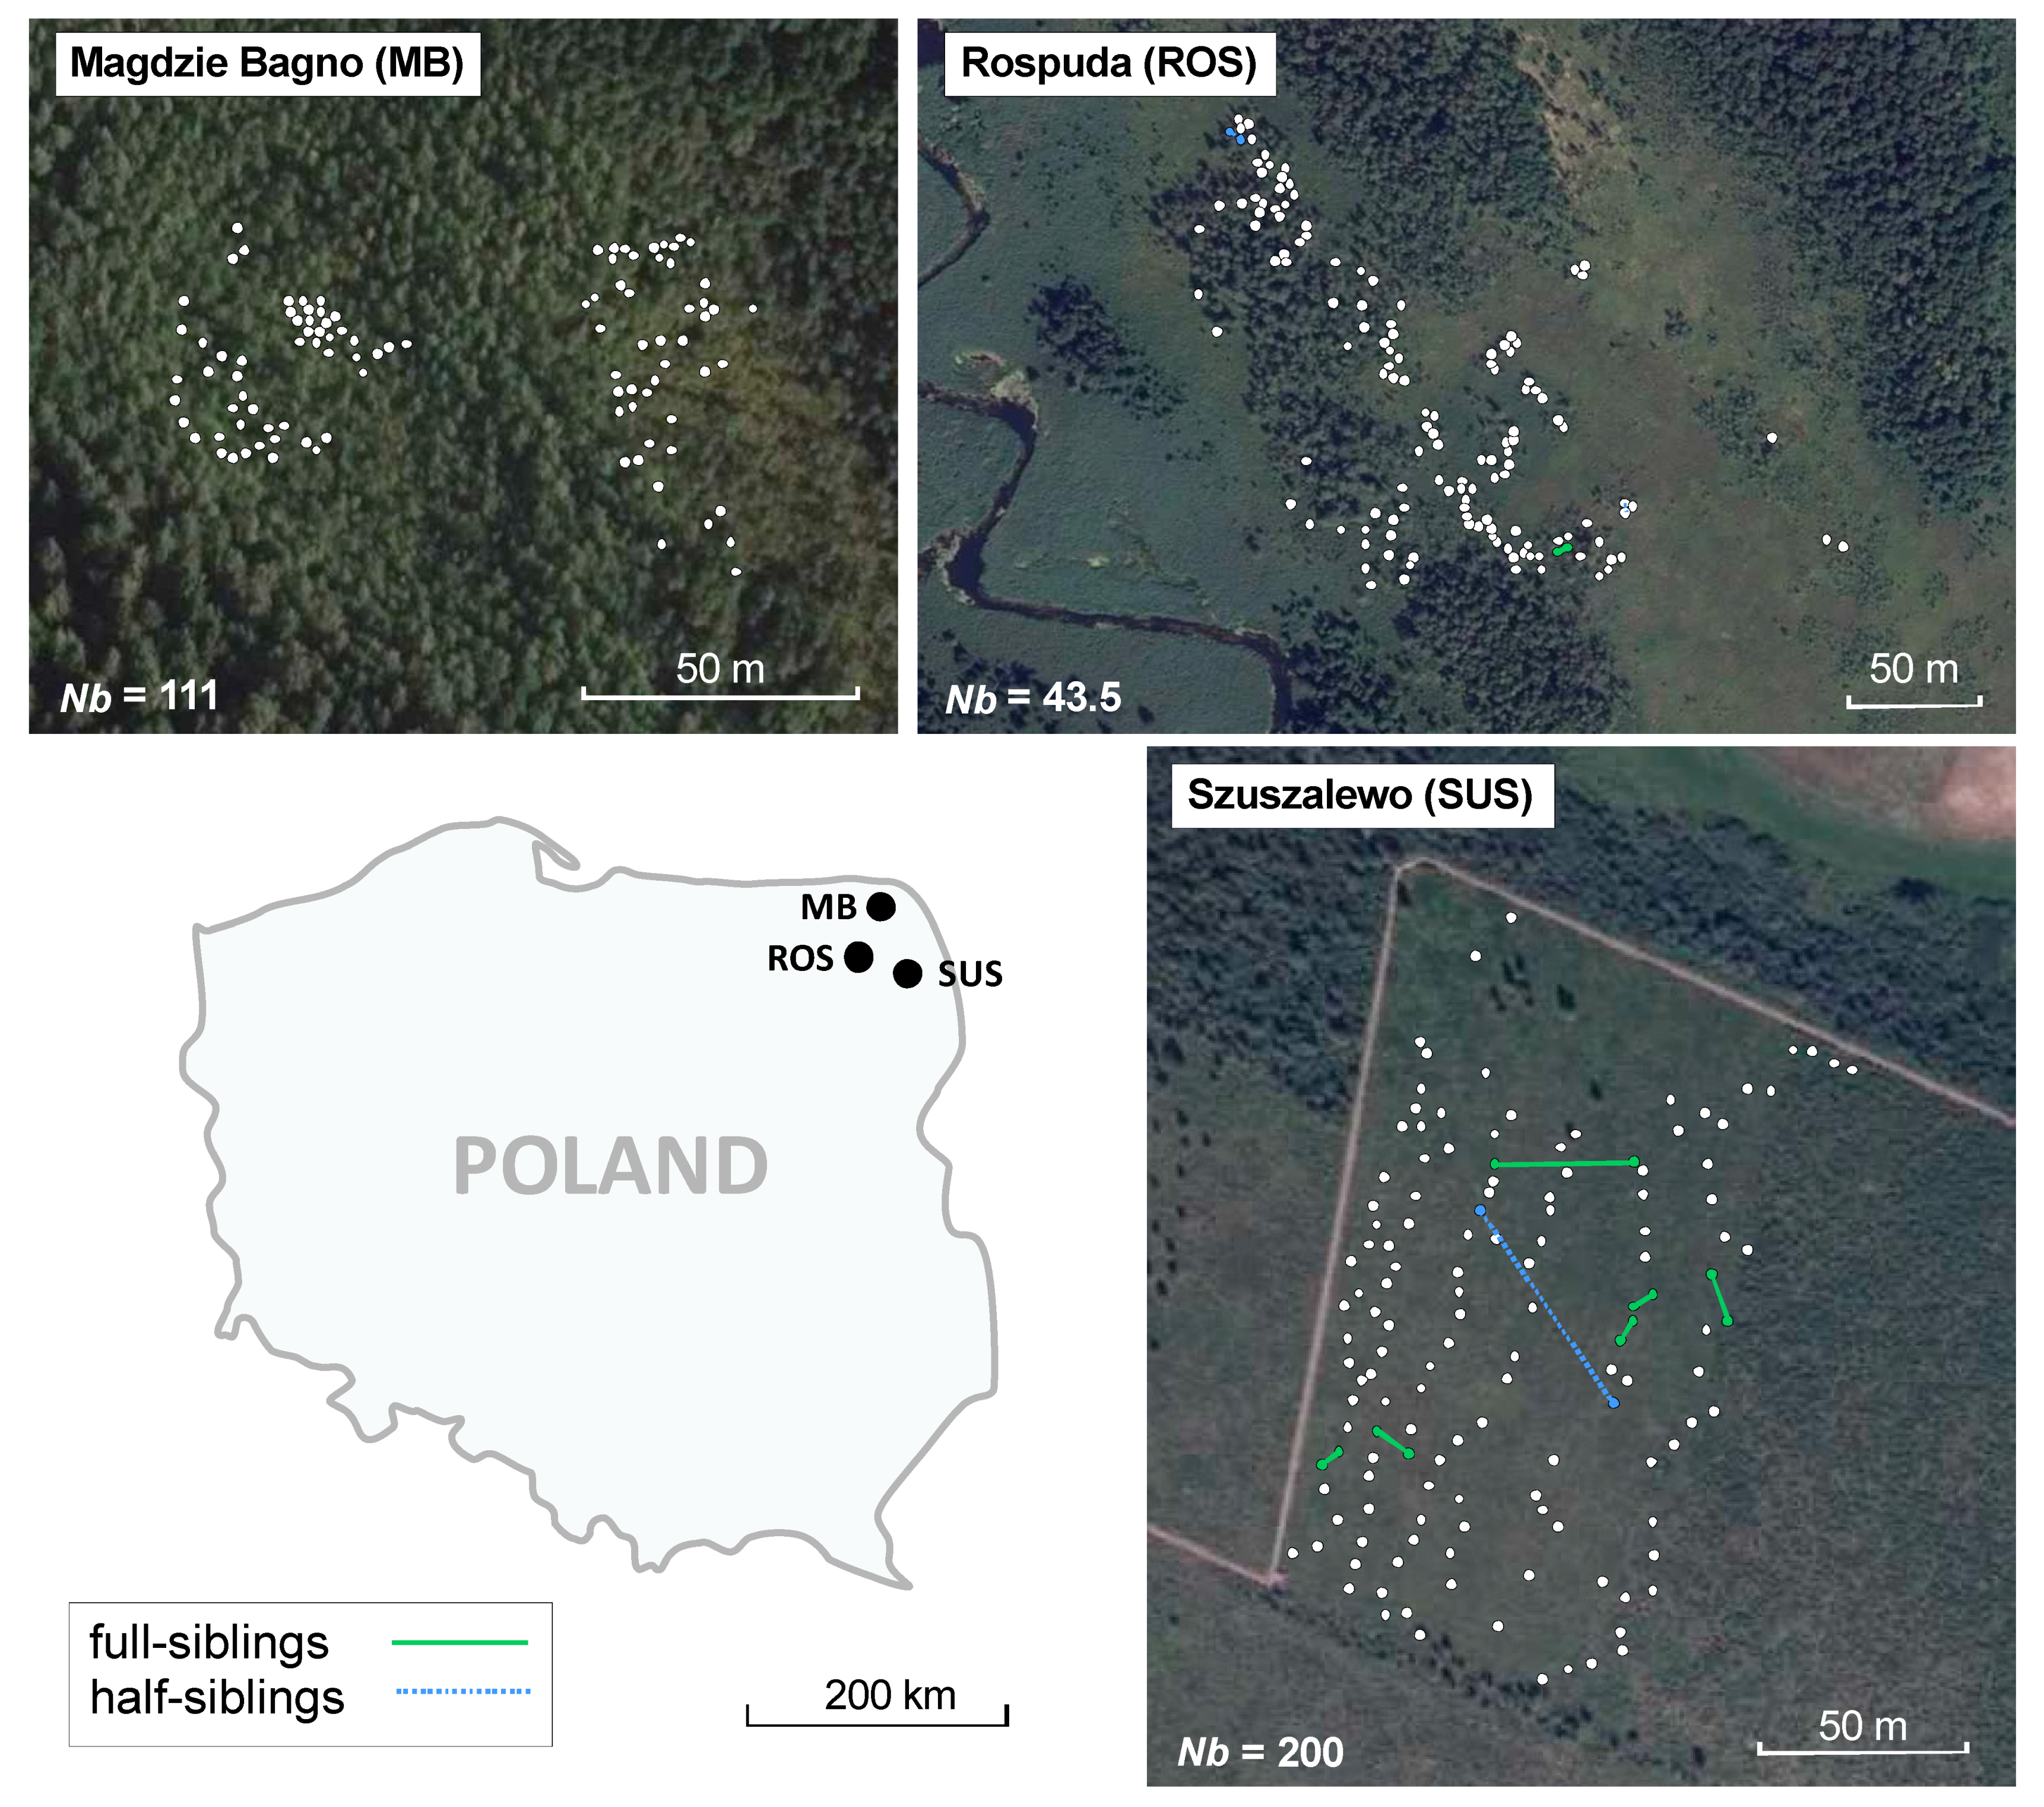
2.1. Study Area

The study was conducted in three populations of B. humilis situated in northeastern Poland, which are among the most abundant populations in the southwestern edge of the species’ range. (Table 1; Figure 1). The Magdzie Bagno (MB) population inhabits a small, brown moss, sub-neutral sedge fen, surrounded by mixed forest (alder, birch, willow, and spruce) on the west bank of Płaskie Lake. A belt of tall trees divides the mire into eastern and western sections, and the shrub birch population forms two compacted groups, inhabiting an area of 0.35 ha and 0.26 ha of the fen. The environmental conditions in the fen seem to be optimal for B. humilis, with groundwater levels visible around the peat surface and PO43− concentrations of 0.16 mg L−1 [18,19,20]. The fen is not a protected area, but it also is not directly disturbed by people.
The second population of B. humilis is in the pine–birch fen shrubland, which is part of an extensive percolation fen in the southern region of the Rospuda River valley [25], included in the Natura 2000 network (Habitat Directive; PLH200022). The Rospuda (ROS) population of B. humilis is dispersed over an area of approximately 3.5 ha. It is one of the most abundant shrub birch populations in Poland, although the habitat conditions significantly deteriorated during recent decades. In the Rospuda valley, the lowering of the groundwater table and the substantially increased concentrations of PO43− ions (e.g., 3.57 mg L−1, [20]) enable the expansion of forest and brushwood plants that began overgrowing the light-demanding B. humilis. The potential impact of human activity is negligible in this territory, as the ROS population occupies an inaccessible area that is distant from the nearest village and fields. There are no active protection activities in this area, either.
The last B. humilis population under study is that from the Szuszalewo (SUS) site in the upper Biebrza River valley, within Biebrza National Park. This is the most abundant shrub birch locality in Poland, occupying an area of 2.2 ha. The shrub birch populates a vast and mostly natural soligenic mezotrofic fen with groundwater levels visible around the peat surface and PO43− concentrations reaching 0.15 mg L−1 [18,20]. Hydrological monitoring conducted in 2013–2018 as part of the LIFE+ project “Preservation of wetland habitats in the upper Biebrza Valley” [26] revealed that the peat layer was still supplied by groundwaters in the SUS locality, presenting a great opportunity for preserving the soligenic character of this fen. The expansion of Betula pubescens and Salix rosmarinifolia into the area covered by sedges and mosses was observed in the late twentieth and early twenty-first centuries [27]. Within the LIFE+ project, cutting was conducted to recover quickly natural vegetation to the SUS fen, making space for the development of B. humilis, as well as other rare and endangered plants (e.g., Liparis loeselii, Dactylorhiza incarnata, Epipactis palustris, and Dianthus superbus) and birds (e.g., Circus pygargus, Gallinago media, and Acrocephalus paludicola). Moreover, seven valves with movable damming, three thresholds, three palisade partitions, and two culverts with damming were built to improve and preserve natural hydrological conditions in the upper Biebrza River valley in the long term [28].

2.2. Sample Collection

Fresh B. humilis leaves showing no visible damage were sampled from branches at least 2 m apart. Sampled branches were mapped using the Dakota 10 (Garmin) handheld navigation system. A total of 386 samples were collected in three populations.

2.3. Molecular Laboratory Analyses

The leaf material was homogenised with a TissueLyser mill (Qiagen, Hilden, Germany). DNA was extracted from the homogenate with an AX Plant kit (A&A Biotechnology, Gdansk, Poland) following the manufacturer’s instructions. Total DNA was used for genotyping, using seven nuclear simple sequence repeats (SSRs) originally developed for Betula pendula Roth (L1.10, L5.1, L5.4, L022) [29] and Betula pubescens Ehrh. (L021, Bo.F394, Bo.G182) [30]. Proportions of the PCR components and amplification programs were the same as described previously by Jadwiszczak et al. [15]. Primers were combined into three PCR multiplexes with varied cycles according to Bona et al. [31]. PCR was conducted in a Labcycler Basic (SensoQuest, Göttingen, Germany). PCR products were separated on an ABI PRISM 3130 Genetic Analyser (Applied Biosystems, Foster City, CA, USA) with a Gene Scan-500 LIZ size standard (Applied Biosystems, Foster City, CA, USA) and scored manually using GeneMapper 4.0 (Applied Biosystems, Foster City, CA, USA).

2.4. Genetic Diversity Analyses

A Monte Carlo procedure was used in the GenClone 2.0 program [32] to define the number of loci sufficient to allow the discrimination of genotypically unique individuals (genets) in each sample. The same program was used to identify ramets having the same genotype (clones) in each population. All calculations within and between populations were performed excluding clonal individuals from the analyses.
MICRO-CHECKER 2.2.3 [33] was used to find the null alleles, large allele dropouts, and stutter picks by checking each locus for deviations from Hardy–Weinberg equilibrium (HWE). The frequency of null alleles was estimated using a maximum likelihood estimator based on 10,000 Monte Carlo randomisations implemented in the ML-NullFreq software [34,35]. In every population, genotypic linkage disequilibria (LD) between all pairs of loci and deviations from the HWE for loci and populations were assessed using GENEPOP 4.7 with 1000 iterations [36,37]. Sequential Holm–Bonferroni correction was calculated manually for all multiple comparisons according to the formula of Rice [38].

2.5. Genetic and Spatial Genetic Structure Analyses

GenAlEx 6.5 software [39] was used to estimate the allele frequencies, mean number of alleles per locus (A), observed heterozygosity (HO), and expected heterozygosity (HE) in each locus and population, as well as to calculate genetic distances between all genotypes. Based on a matrix of genetic distances, principal coordinates analysis (PCoA) was conducted to visualise genetic relationships between individuals. To ensure robustness for the presence of null alleles, we calculated a mean inbreeding coefficient (Fi) for each population using an individual inbreeding model (IIM) implemented in INEST 2.2 software [40]. Each calculation consisted of 50,000 burn-in cycles, followed by 500,000 MCMC iterations, while the thinning parameter was set to 5000.
Assuming the two-phase model of microsatellite mutations (TPM) [41], two methods were used to investigate potential signals of genetic bottlenecks in the B. humilis populations. First, the observed value for the ratio of the number of alleles (A) to the total range in allele size (R) (MR = A/R) [42] was estimated in every population using INEST software with its default settings [40]. Then, the deficiency of an MR value in relation to the ratio expected in a population at demographic equilibrium (MReq) was calculated (ΔMR = MReq − MR) and tested using the Wilcoxon signed-rank test. In a bottlenecked population, the observed MR ratio is significantly smaller than in an equilibrium population [42]. The second method was implemented in the BOTTLENECK 1.2.02 software [43,44], which computed the distribution of heterozygosity expected from the observed number of alleles (k), given the sample size (n), under the assumption of mutation-drift equilibrium (Heq). In the study on a bottleneck population, Piry et al. [44] reported that as the number of alleles decreased faster than the heterozygosity level (He), the value of He was higher than that of Heq. The probability for the heterozygosity excess was assessed assuming 78% single-step mutations in the TPM model and was evaluated using the Wilcoxon signed-rank test.
The Colony 2.0.6.7 software [45], employing locus-specific corrections of the significant null allele frequency estimated by ML-NullFreq, was used to show full- and half-siblings among the total number of possible pair combinations in each B. humilis population. The following settings were chosen to run the program: “monoecious species”, “without inbreeding and clones”, “polygamic females and males”, “full-likelihood method”, “medium length run”, “medium precision”, and “no updating of allele frequencies”. A probability level of ≥0.9 was selected to indicate the full-sibling (FS) and half-sibling (HS) pairs.
To determine the most likely number of genetic groups (K) in the B. humilis populations, the Bayesian cluster analysis implemented in STRUCTURE software 2.3.4 [46] was conducted. Using no prior information on the population origin, and based on the admixture model and correlated allele frequencies, 10 independent runs for each value of K (from K1 to K4) were done to examine the number of clusters with 50,000 burn-in periods and 500,000 iterations. To identify the number of clusters (K), the ad hoc statistic ΔK [47] was calculated using the software STRUCTURE HARVESTER v0.6.94 [48]. The results of the independent runs were matched by CLUMPP 1.1.2 [49] and visualised using DISTRUCT 1.1 [50].
Genetic differentiation (FST) between pairs of populations was assessed in the FreeNA program using the ENA (excluding null alleles) method [51]. In this method, calculations are limited to visible allele sizes only; thus, the result is corrected for the presence of null alleles [51]. Confidence intervals (95% CI) were estimated with 10,000 bootstrap replicates over all loci for FST values.
The spatial genetic structure (SGS) was assessed using two methods: spatial autocorrelation and Sp statistic. The calculations were performed in the SpaGeDi 1.5a program [52]. Spatial autocorrelation was computed as a multi-locus kinship coefficient Fij, according to Nason’s formula [53] for pairs of individuals, and averaged within ten spatial intervals. The program defined ranges of distance intervals such that the number of pairwise comparisons within each interval was near constant. Deviations from the null hypothesis, which assumed no spatial genetic structure, were assessed by randomly permuting spatial genotype distributions 10,000 times. The Sp statistic was calculated as Sp = −b-log/(1 − F(1)), where b-log is the regression slope of observed relatedness on the logarithm of distance between individuals, and F(1) is the average kinship coefficient of individuals belonging to the first distance class [8]. This ratio is less dependent on a sampling scheme than Fij; thus, the ratio is useful for comparing the extent of SGS among species or groups of organisms [8,54,55]. Then, the neighbourhood size (Nb), which is the estimator of gene dispersal, was calculated as the inverse of Sp [Nb = −(1 − F(1))/b-log] [8].

3. Results

3.1. Genetic Diversity

In total, 386 ramets were genotyped in seven nuclear microsatellite loci (Table 1), and 157 alleles were found. Among 109 ramets sampled in the MB population, 7 clonal ramets were detected; thus, the number of different studied genotypes in MB was 102. All sampled ramets collected in the ROS and SUS localities were genotypically different. The minimal number of loci allowing discrimination of all genotypes in B. humilis populations was four for ROS and six for SUS and MB. The mean number of alleles per locus was 22.6, with a range between 14 in Bo.G182 and 32 in Bo.F394. Out of 21 locus pairs tested for each population, significant linkage disequilibria were noted between Bo.F394 and Bo.G182 (p = 0.00109) in MB, as well as L022 and L5.1 (p = 0.00000) in ROS. No large allele dropouts or stutter picks were detected. However, a significant probability of the presence of null alleles was found in locus L021 in MB, as well as in the L021, L022, and L5.1 loci in SUS. Nevertheless, the contribution of null alleles in the above loci was low (from 0.0239 to 0.0660; Table 2).
The highest number of alleles, 145, was seen in SUS. Of them, 31 alleles (21.37%; with the mean value of 4.42 alleles per locus) were private (Table 2) and showed frequencies ≤ 0.05. Six private alleles were found in both MB and ROS (6.00% and 5.94%, respectively; with the mean value of 0.86 alleles per locus in both cases). Their frequencies did not exceed 0.047. In every population, Bo.G182 was the least variable locus. The mean number of alleles per locus ranged between 14.3 (MB) and 20.7 (SUS). The mean observed and expected heterozygosities were the lowest in MB (HO = 0.811 and HE = 0.816) and the highest in SUS (HO = 0.834 and HE = 0.874) (Table 2). Among the observed populations, significant deviation from HWE was found in MB (χ2 = 40.834 and df = 14, p < 0.0001) and SUS (χ2 = 79.052, df = 14, p < 0.0001). In general, low levels of inbreeding were seen, ranging from Fi = 0.0056 in MB to 0.0141 in ROS and SUS. The results of the two methods used to study indications of population bottlenecks based on heterozygosity excess and M-ratio were congruent and showed signals of genetic bottleneck in ROS only (Table 3). However, non-significant differences were observed in both tests after applying the Holm–Bonferroni correction.

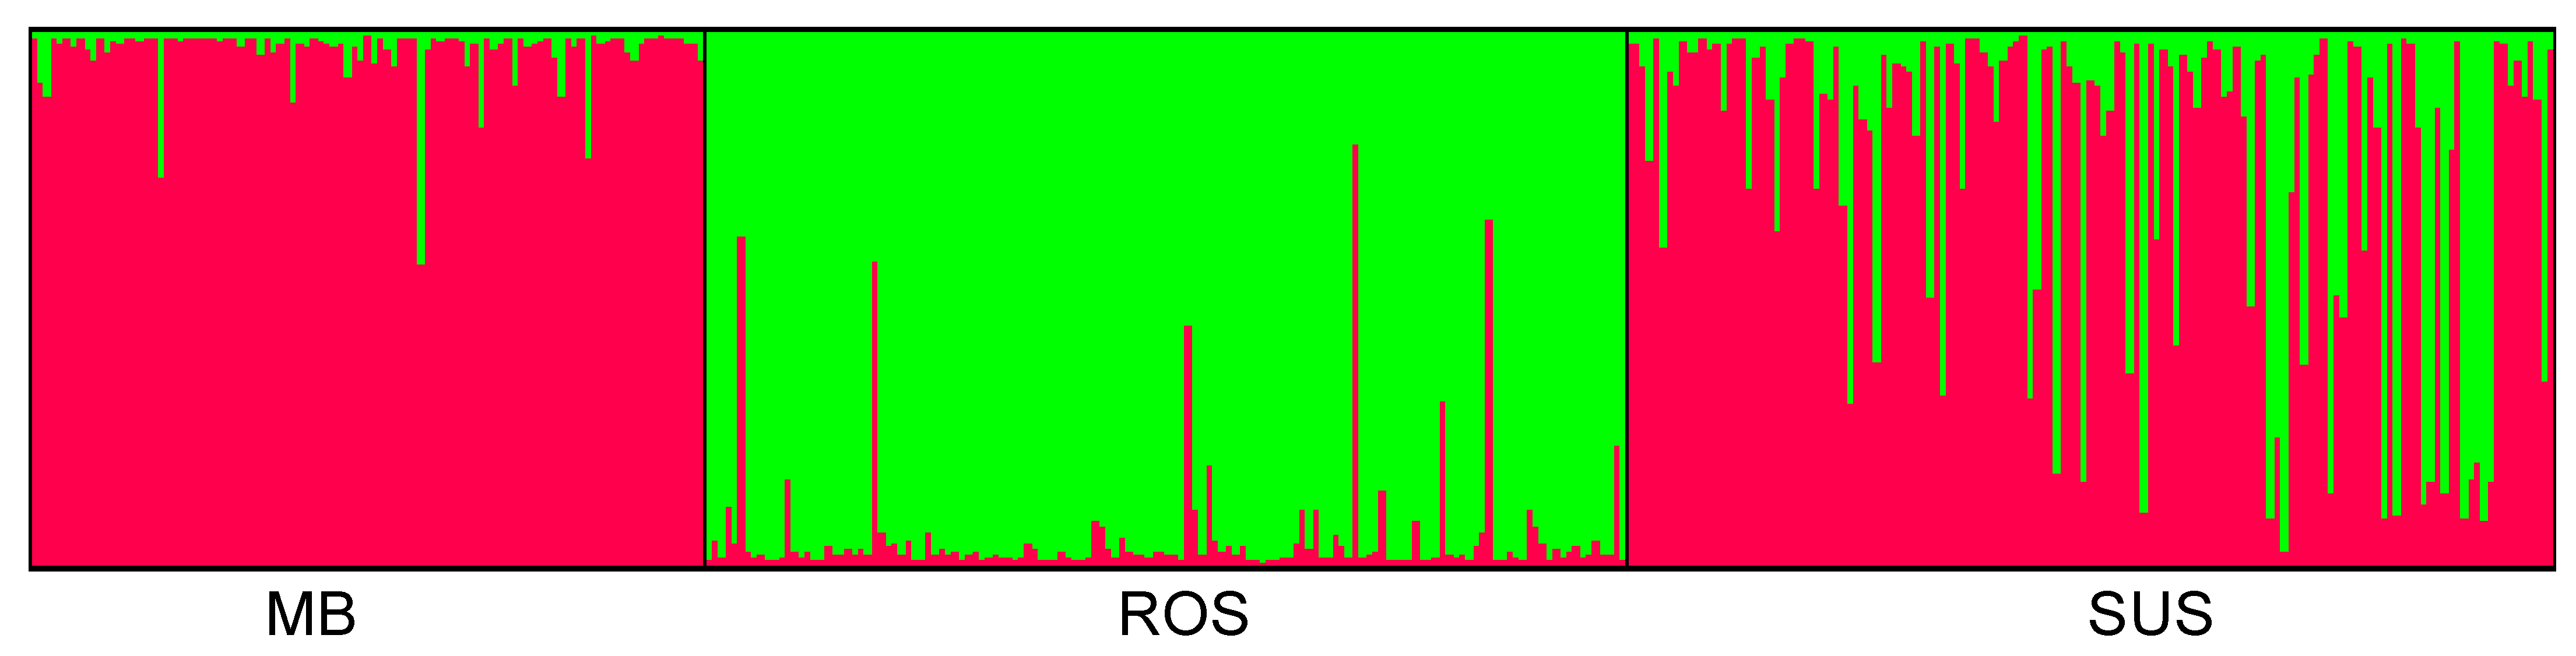
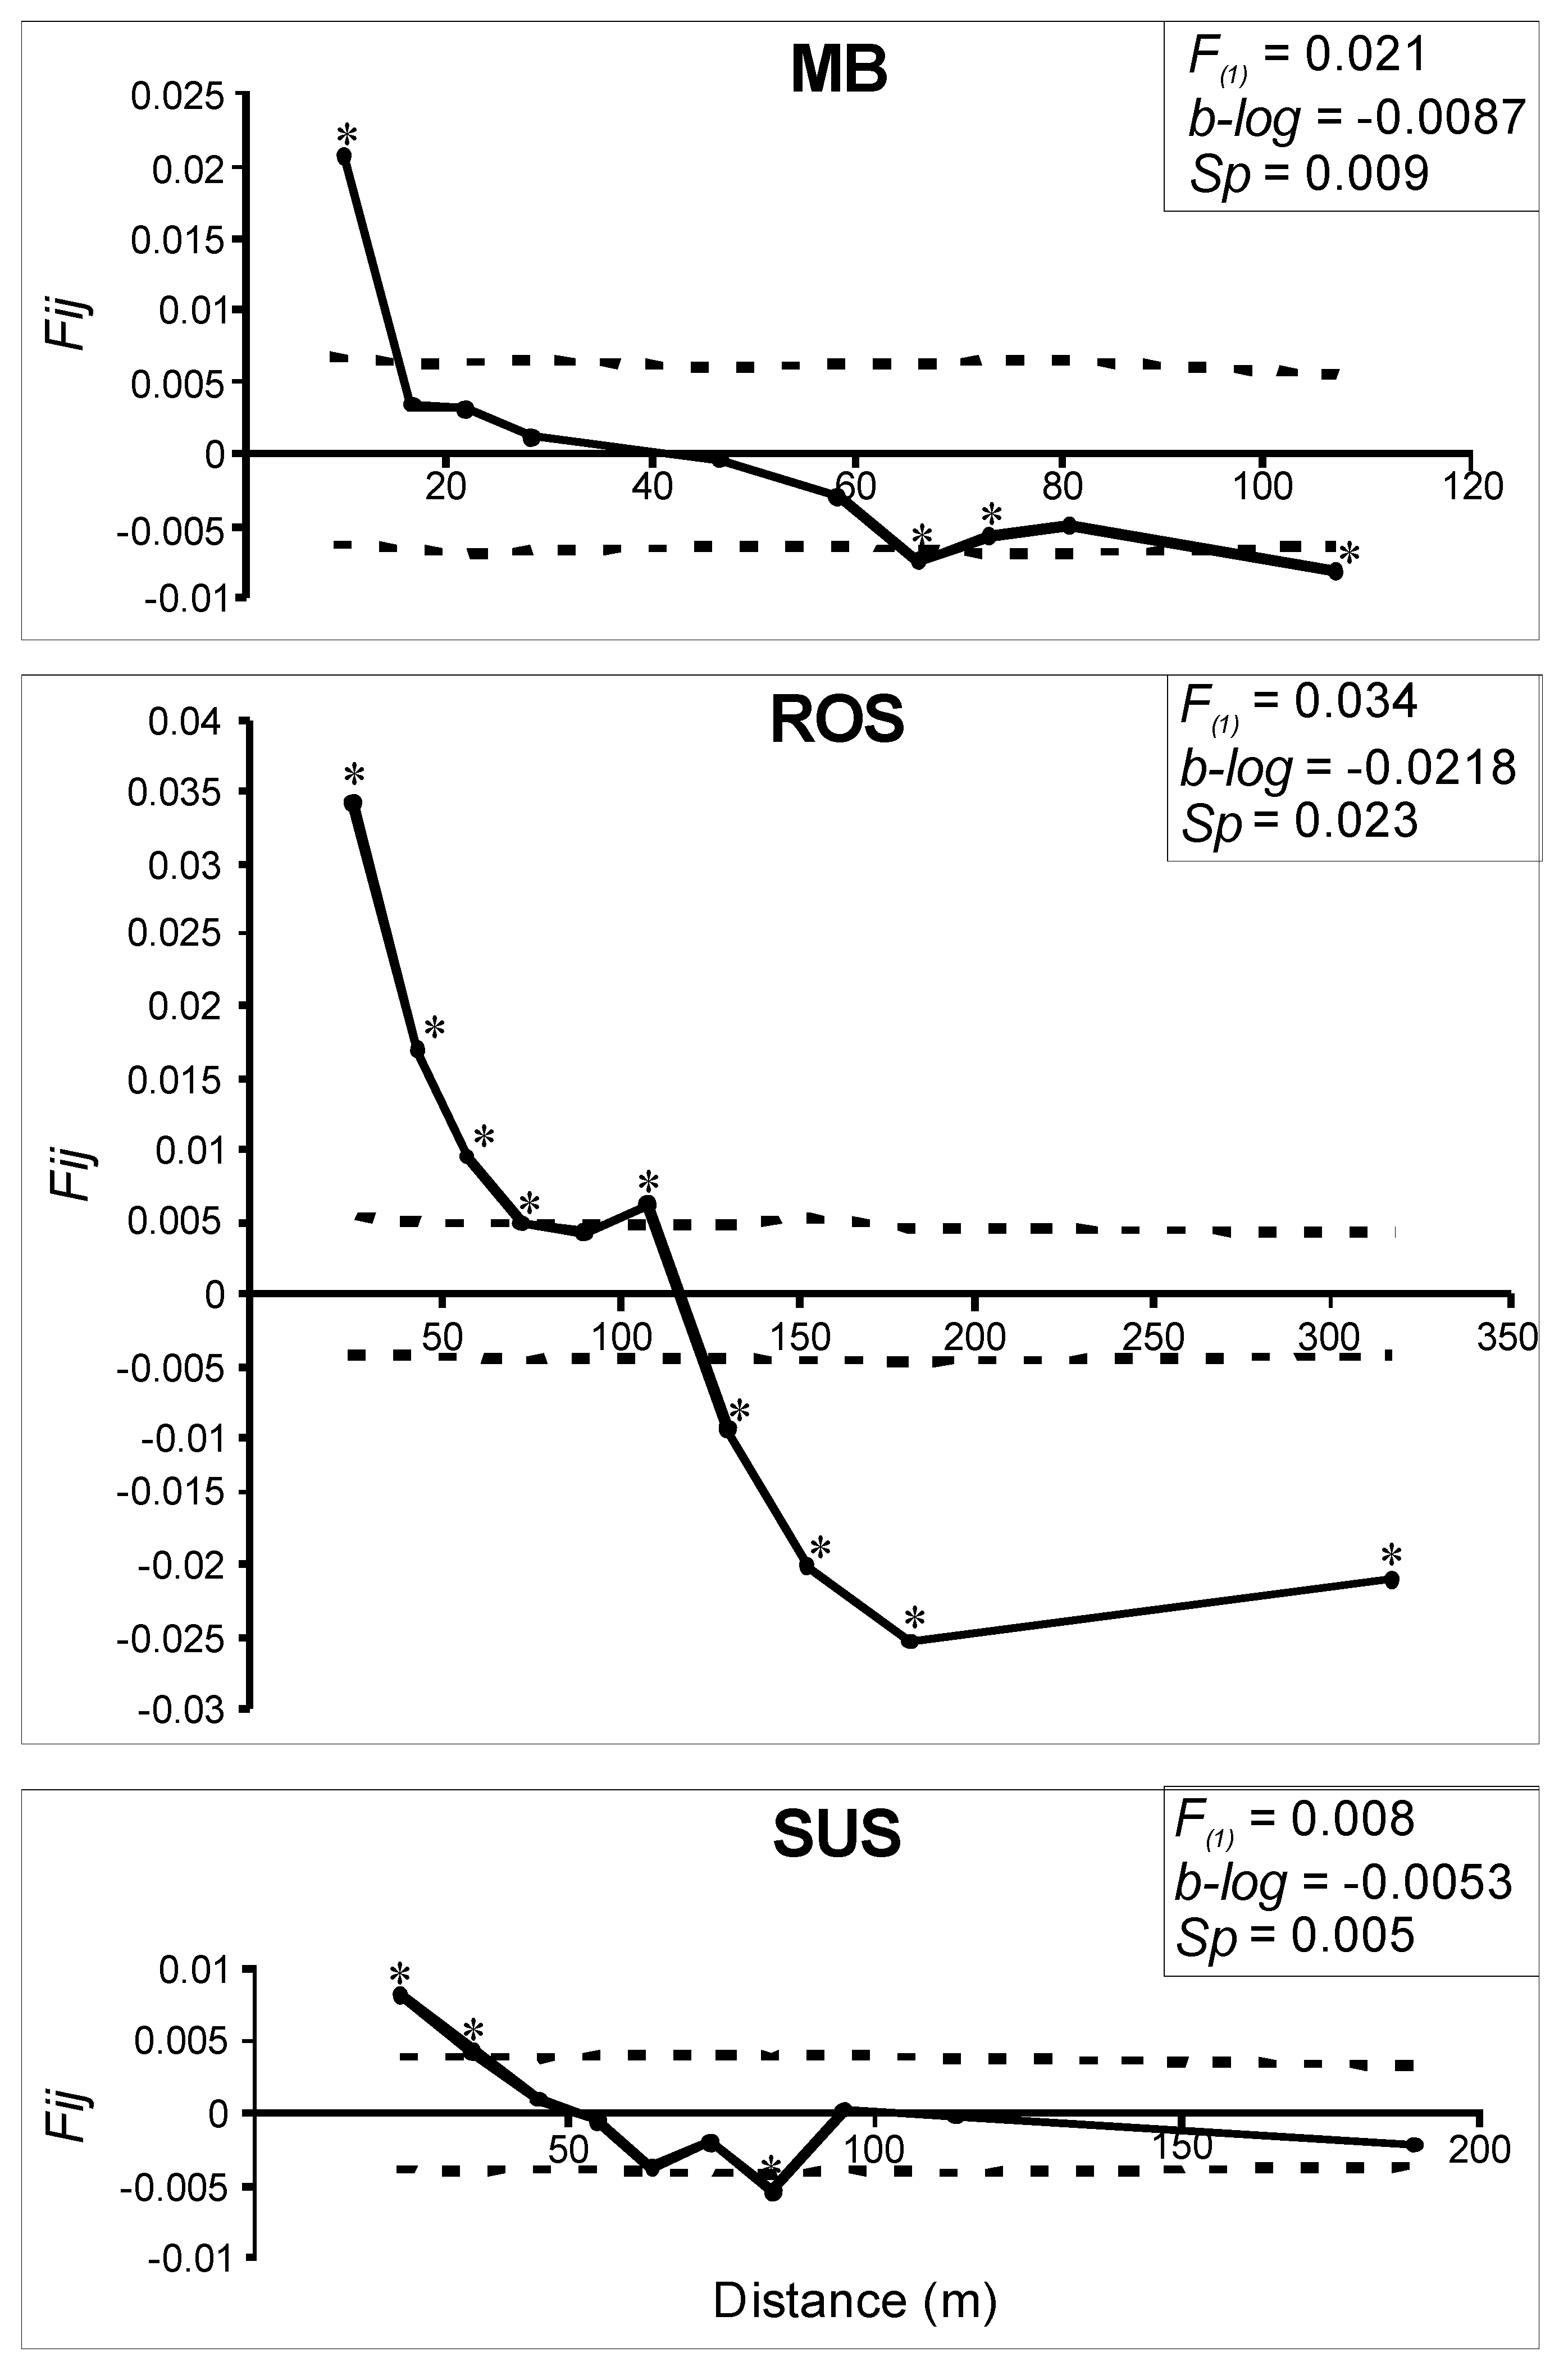
3.2. Genetic and Spatial Genetic Structure

Considering the significant contribution of null alleles in some loci in the MB and SUS samples, the full- and half-siblings were found to be highly infrequent. The share of FSs was 0.00% in MB, 0.01% (p = 0.949) in ROS, and 0.06% (0.91 ≤ p ≤ 0.99) in SUS. The HS contribution was also very low: 0.00% in MB, 0.01% (p = 0.903) in ROS, and 0.01% (p = 0.906) in SUS. All FS and HS pairs are shown in Figure 1.
Principal coordinates analysis (PCoA) did not group individuals into distinct clusters, although specimens from the MB and ROS localities were partially separated (Figure 2). The first and second axes showed 6.79% and 5.09% of the total variance in the PCoA distribution, respectively. The Bayesian approach using STRUCTURE revealed that analysed genotypes formed two genetic groups, as the peak of delta K (ΔK = 500.06) was observed at K = 2. The first cluster consisted of the MB and SUS individuals, while the ROS specimens were indicated as a distinct group (Figure 3). The analysis of genetic differentiation between populations showed slightly different results. The lowest genetic differentiation was found between ROS and SUS populations (FST = 0.033, 95% CI 0.019–0.054), while both populations showed greater differentiation in relation to the MB locality (ROS-MB: FST = 0.069, 95% CI 0.051–0.085 and SUS-MB: FST = 0.043, 95% CI 0.029–0.057).
All populations showed evidence of spatial genetic structure (SGS). Positive autocorrelation was found in all populations at the first distance classes, as the F(1) values were significantly higher than would be expected for a random distribution of ramets (Figure 4). The strongest SGS was detected in the ROS population, as the F(1) was the highest and almost all distance classes showed significant autocorrelation. The Sp values reflected the observed spatial genetic structure, as it was the highest in ROS (0.023), while in MB and SUS, it reached 0.009 and 0.005, respectively (Figure 4). The neighbourhood size (Nb) ranged from 43.5 individuals in ROS to 200 individuals in SUS (Figure 1).

4. Discussion

Substantial genetic variation in plant populations are acknowledged to be a very important factor in the success of efforts to restore self-sustainable ecosystems in the long term [56]. In this context, we used seven highly polymorphic nuclear microsatellite loci to compare genetic diversity and fine-scale spatial genetic structure in endangered B. humilis populations located in the wetlands of northeastern Poland. The highest values of genetic variation were revealed in the SUS (A = 20.7; HO = 0.834, and HE = 0.874), whereas these parameters were lowest in MB stand (A = 14.3; HO = 0.811, and HE = 0.816). The substantial genetic diversity in SUS was surprising to some extent because analyses of clonal growth conducted a few years ago showed that both clonal richness (C = 0.088) and Simpson’s diversity index (D = 0.814) were the lowest, and the mean number of alleles per locus (A = 8.29) and observed heterozygosity (HO = 0.746) were almost the lowest in the SUS, compared to five other localities in northeastern Poland [30]. This was the result of the sparse numbers of genets and clearly clumped genet structure (aggregation index AC = 0.947; [31]) occurring in the SUS population, which is characteristic of the phalanx pattern of growth [57,58]. At the same time, B. humilis showed lower aggregation of ramets in the MB (Ac = 0.594) and represented higher values of genetic diversity (A = 8.57, HO = 0.873) compared to the SUS population [31].
The maintenance of the genetic diversity of populations, which is responsible for their long-term survival and, consequently, ecosystem sustainability, requires gene exchange between localities within the species range [56,59]. Gene exchange between populations occurring in similar habitat conditions improved the germination rate and seedling survival of Mediterranean alpine Silene ciliata [60]. It seems that, among populations that we studied, there is a real chance to exchange pollen and seeds in SUS because B. humilis also occurs in some other locations in the Biebrza River valley [61]. MB and ROS populations are tens of kilometres distant from the remaining B. humilis stands. In general, genetic differentiation was statistically nonsignificant between the populations studied, but the highest FST = 0.069 was noted between MB and ROS. Individuals from these populations formed two partly overlapping groups in PCoA, while specimens from the SUS were placed in the intermediate position between MB and ROS. The STRUCTURE analysis showed quite similar results, as individuals from ROS belonged to a distinct cluster from SUS and MB, while some specimens from SUS showed mixed assignment. These observations are congruent with the results of cpDNA analysis performed by Jadwiszczak et al. [16], which reveal that MB and ROS belonged to different haplogroups, while SUS shared cpDNA haplotypes with ROS and MB. However, we found the mean number of 4.42 private alleles per locus in SUS compared to 0.86 private alleles per locus in both MB and ROS. The high contribution of private alleles can reflect the independent evolution of geographically isolated populations [62]. Indeed, private microsatellite alleles were found in the highly isolated populations of dwarf birch Betula nana in Poland, with frequencies reaching up to 0.91 [63]. However, the highest frequency of private allele was 0.05 (L5.1 locus) in the SUS stand of B. humilis; thus, it is difficult to speculate that this population differentiates independently from other sites of the species in Biebrza National Park. It is highly likely that substantial allelic richness in SUS can be either a typical phenomenon in the populations situated in the Biebrza River valley or the result of extensive clonal growth and accumulation of mutations after habitat restoration. The first hypothesis can be supported by the high values of genetic variation parameters in the B. humilis population located in the Czerwone Bagno reserve (Biebrza National Park) [15]. The second supposition is based on studies that showed the high number of somatic mutations in wild cherry Prunus avium [64] and seagrass Zostera marina [65] that propagate vegetatively. Further analyses at the regional and individual levels should be conducted at the B. humilis sites to resolve these possibilities.
The significant SGS, which implies a non-random distribution of genets, was seen in all shrub birch populations. The mean value of the Sp statistic of 0.0123 in the shrub birch was consistent with data of outcrossing plants (0.0126), with a tree form (0.0102) and wind-based seed dispersal (0.0120) [8]. However, this value was higher than that estimated for wind-pollinated species (Sp = 0.0064) [8]. Birches are both wind-dispersed and wind-pollinated, but long-range transport of B. humilis pollen and seeds is not likely, as the species is 1–3 m in height and most of its populations are surrounded by high forest trees. Moreover, because of intense vegetative growth, the shrub birch forms dense clumps; thus, it is likely that free movement of its pollen grains and seeds can be disturbed primarily by adjacent shoots. This can be confirmed by the values of neighbourhood size, which were lower in both overgrown populations ROS (Nb = 43.5) and MB (Nb = 111) compared to SUS located in the open fen (Nb = 200). In another anemochoric tree, Abies alba, collisions with dense canopy elements caused a substantial reduction in seed dispersal distance [66]. The value of the Sp statistic was the lowest (0.005) in the restored SUS population; however, it was quite similar to that calculated for MB (0.009), although these populations were very different with respect to shoot density and habitat conditions. It appears that different circumstances may shape similar Sp values in the SUS and MB. A low density of shoots in the SUS, as well as lack of other natural barriers, allow for gene flow over longer distances; thus, genotypically diverse individuals are evenly spread over the vast fen. In the MB, the genets are intermingled and close to one another [31], but it is probable that the very small area occupied by the shrub birch population prevents the development of a spatial genetic structure. However, we cannot exclude some restriction of gene flow in MB, as the pairwise kinship coefficient (Fij) was two and a half times higher in the first distance class in MB (0.021) than in SUS (0.008).
Nevertheless, it is crucial to remember that Fij values depend on the sampling pattern, selected distance intervals, and polymorphism level of the molecular markers used [8]. Based on the simulated distributions of alleles in codominant marker loci in a model population, Cavers et al. [67] showed that the lower limit was 100 individuals and 10 loci, while the upper limit was 200 individuals and 5 loci for the optimal sampling strategy for SGS estimation. The variation of seven microsatellite loci that were selected to study three B. humilis populations was suitable for finding SGS, as the calculated minimal number of loci that allowed us to distinguish all genotypes ranged from four in ROS to six in both SUS and MB. However, both the sampling scheme and distance intervals were dependent on the population area and density of individuals in particular habitat patches; hence, they can influence the Fij coefficient at least to some extent. The strongest SGS was revealed in the ROS population (Sp = 0.023), where shrub birch inhabits a large area and shoots are grouped into dense clumps. Consequently, the Fij parameter was the highest in the first distance class (0.034) and significantly positive up to 107 m. In general, significant SGS implies that stands are of natural origin [68]. Additionally, a higher Sp value can be revealed in an undisturbed population compared to a disturbed population, as was found in a study of the South American shrub, Acacia aroma, from natural and human-impacted territories [10]. In our opinion, the highest Sp value in the ROS population of B. humilis does not reflect the current optimal conditions for the plant, but results from the short period of unfavourable habitat alteration. We observed the first signs of genetic diversity decline in ROS, where lowering groundwater levels and substantial concentrations of PO43− ions recently occurred [20]. We found the same mean number of alleles per locus in ROS (A = 14.4) and MB (14.3), and the same mean number of private alleles (0.86) in both localities, although more genets were sampled in ROS than in MB. Heterozygosity values were slightly higher in ROS (HO = 0.821 and HE = 0.841) than in MB (HO = 0.811 and HE = 0.816). According to Nei et al. [69], the visible reduction in the number of alleles accompanied by substantial heterozygosity resulted from a bottleneck effect. Before applying Holm–Bonferroni correction, the results of both methods we used to study the bottleneck were statistically significant in the ROS. It is likely that further habitat deterioration in the Rospuda River valley will cause a spread of competitive plants and decrease the shrub birch density. Consequently, an increase in genetic drift and inbreeding is expected to be an effect of a reduced number of individuals and their genetic diversity. At present, the inbreeding coefficient is low and statistically nonsignificant (Fi = 0.0056–0.0141) in all B. humilis localities, showing that crosses between unrelated specimens are still frequent. In general, very low contributions of full- (0–0.06%) and half-siblings (0–0.01%) were found in all populations under study; however, quite distant locations of one FS and one HS pairs in the SUS may show that pollen and seeds are more likely to be dispersed over the area of this population. Moreover, the belt of forest trees in the middle of the MB fen seems to prevent gene flow at least to some extent, because there were no sibling pairs consisting of individuals from the western and eastern parts of the population.

5. Conclusions

We investigated the genetic variation and spatial genetic structure (SGS) of three populations of endangered B. humilis located in northeastern Poland using highly polymorphic nuclear microsatellites. We found the highest values of the mean number of alleles per locus, private alleles per locus, as well as observed and expected heterozygosities in the SUS, which is located in the open space of the restored fen. In turn, the mean number of alleles and the number of private alleles per locus were almost the same in MB and ROS, although different numbers of samples were collected at both sites. This may be a consequence of a reduction in numbers in ROS; however the values of bottleneck tests were non-significant after applying Holm–Bonferroni’s correction. The SGS was significant in all populations under study. The highest value of the Sp statistic was detected in ROS, suggesting considerable limitations in pollen and seed dispersion. However, the possibility of gene flow across the SUS area can be supported by finding some siblings in distant locations.
Maintaining B. humilis stands for a long time typically requires active protection, starting with restoration of hydrological conditions that prevent thicket forest succession in habitats impacted by anthropopression or climate change [70]. We cannot exclude that cutting and removing thicket forest vegetation conducted in the SUS population had a beneficial effect on the restoration and maintenance of B. humilis. In a short time period, removal of coexisting plants conducted in the shrub birch reserves near Mętne Lake (northern Poland) and Wiejki Lake (northeastern Poland) resulted in rapid expansion of the species, as well as more intensive flowering [14,71]. Similar practices are recommended for ROS and MB, as signs of limitations of propagules dispersion were found. Additionally, we are optimistic about the long-term maintenance of the shrub birch genetic resources in the SUS, as the hydrological conditions were significantly improved in the upper Biebrza River valley due to the construction of valves with movable damming, thresholds, palisade partitions, and culverts within the LIFE+ project [28]. When active protection is not undertaken in time, the shrub birch declines due to overgrowth by other more competitive plants. The onset of this phenomenon began to appear in the ROS population.

Author Contributions

Conceptualization and writing, A.B. and K.A.J.; field work, laboratory work and data analysis, A.B., D.B. and K.A.J. All authors have read and agreed to the published version of the manuscript.

Funding

This study has received financial support from the Polish Ministry of Science and Higher Education under subsidy for maintaining the research potential of the Faculty of Biology, University of Bialystok.

Institutional Review Board Statement

Not applicable.

Informed Consent Statement

Not applicable.

Data Availability Statement

The datasets analysed during the current study are available on the Zenodo: https://doi.org/10.5281/zenodo.6997915 (accessed on 16 August 2022).

Acknowledgments

We would like to thank Reviewers for their insightful, constructive comments on an earlier draft of the manuscript.

Conflicts of Interest

The authors declare no conflict of interest.

References

  1. Gardner, R.C.; Finlayson, C. Global Wetland Outlook: State of the World’s Wetlands and Their Services to People; Ramsar Convention Secretariat: Gland, Switzerland, 2018; pp. 1–89. Available online: https://ssrn.com/abstract=3261606 (accessed on 1 December 2021).
  2. Silva, J.; Jones, W.; Phillips, L. LIFE and Europe’s Wetlands: Restoring a Vital Ecosystem; Office for Official Publications of the European Communities: Luxembourg, 2008; pp. 1–68. [Google Scholar] [CrossRef]
  3. Verhoeven, J.T. Wetlands in Europe: Perspectives for restoration of a lost paradise. Ecol. Eng. 2014, 66, 6–9. [Google Scholar] [CrossRef]
  4. Salimi, S.; Almuktar, S.A.A.A.N.; Scholz, M. Impact of climate change on wetland ecosystems: A critical review of experimental wetlands. J. Environ. Manag. 2021, 286, 112160. [Google Scholar] [CrossRef]
  5. Mantyka-Pringle, C.S.; Martin, T.G.; Rhodes, J.R. Interactions between climate and habitat loss effects on biodiversity: A systematic review and meta-analysis. Glob. Chang. Biol. 2012, 18, 1239–1252. [Google Scholar] [CrossRef] [Green Version]
  6. Pimm, S.L.; Russell, G.J.; Gittleman, J.L.; Brooks, T.M. The future of biodiversity. Science 1995, 269, 347–350. [Google Scholar] [CrossRef] [PubMed] [Green Version]
  7. Hanski, I. Habitat loss, the dynamics of biodiversity, and a perspective on conservation. Ambio 2011, 40, 248–255. [Google Scholar] [CrossRef] [Green Version]
  8. Vekemans, X.; Hardy, O.J. New insights from fine-scale spatial genetic structure analyses in plant populations. Mol. Ecol. 2004, 13, 921–935. [Google Scholar] [CrossRef]
  9. Aguilar, R.; Quesada, M.; Ashworth, L.; Herrerias-Diego, Y.; Lobo, J. Genetic consequences of habitat fragmentation in plant populations: Susceptible signals in plant traits and methodological approaches. Mol. Ecol. 2008, 17, 5177–5188. [Google Scholar] [CrossRef]
  10. Pometti, C.; Bessega, C.; Cialdella, A.; Ewens, M.; Saidman, B.; Vilardi, J. Spatial genetic structure within populations and management implications of the South American species Acacia aroma (Fabaceae). PLoS ONE 2018, 13, e0192107. [Google Scholar] [CrossRef] [Green Version]
  11. Lynch, M.; Conery, J.; Burger, R. Mutation accumulation and the extinction of small populations. Am. Nat. 1995, 146, 489–518. [Google Scholar] [CrossRef] [Green Version]
  12. Barrett, S.C.H. The evolution, maintenance, and loss of self-incompatibility systems. In Plant Reproductive Ecology: Patterns and Strategies; Lovett Doust, J., Lovett-Doust, L., Eds.; Oxford University Press: New York, NY, USA, 1988; pp. 98–124. [Google Scholar]
  13. Załuski, T.; Jabłońska, E.; Pawlikowski, P.; Pisarek, W.; Kucharczyk, M. Betula humilis Schrank. In Polska Czerwona Księga Roślin (Polish Plant Red Book); Kaźmierczakowa, R., Zarzycki, K., Mirek, Z., Eds.; W. Szafer Institute of Botany, Polish Academy of Sciences: Kraków, Poland, 2014; pp. 92–95. [Google Scholar]
  14. Jadwiszczak, K.A.; Banaszek, A.; Jabłońska, E.; Sozinov, O.V. Chloroplast DNA variation of Betula humilis Schrk. in Poland and Belarus. Tree Genet. Genomes 2012, 8, 1017–1030. [Google Scholar] [CrossRef] [Green Version]
  15. Jadwiszczak, K.A.; Banaszek, A.; Jabłońska, E.; Sozinov, O.V. Could Betula humilis Schrk. have survived the last glaciation at a current margin of its distribution? Testing the hypothesis of glacial refugium using nuclear microsatellites. Plant Syst. Evol. 2011, 297, 147–156. [Google Scholar] [CrossRef]
  16. Jadwiszczak, K.A.; Banaszek, A.; Chrzanowska, A.; Kłosowski, S.; Sozinov, O.V. The admixture zone of Betula humilis Schrk. phylogenetic lineages follows the eastern central European suture zone. Plant Ecol. Divers. 2015, 8, 323–329. [Google Scholar] [CrossRef]
  17. Petit, R.J.; Aguinagalde, I.; de Beaulieu, J.; Bittkau, C.; Brewer, S.; Cheddadi, R.; Ennos, R.; Fineschi, S.; Grivet, D.; Lascoux, M.; et al. Glacial refugia: Hotspots but not melting pots of genetic diversity. Science 2003, 300, 1563–1565. [Google Scholar] [CrossRef] [Green Version]
  18. Jabłońska, E. Vegetation with Betula humilis in central Europe. Phytocoenologia 2012, 42, 259–277. [Google Scholar] [CrossRef]
  19. Chrzanowska, A.; Jadwiszczak, K.A.; Kłosowski, S.; Banaszek, A.; Sozinov, O.V. Sexual reproduction efficiency and genetic diversity of endangered Betula humilis Schrk. populations from edge and sub-central parts of its range. Folia Geobot. 2016, 51, 161–173. [Google Scholar] [CrossRef] [Green Version]
  20. Bona, A.; Kłosowski, S.; Jadwiszczak, K.A.; Petrova, G. Flowering and quality of seeds and pollen in endangered populations of Betula humilis. Trees 2022, 36, 313–324. [Google Scholar] [CrossRef]
  21. Smouse, P.E.; Dyer, R.J.; Westfall, R.D.; Sork, V.L. Two-generation analysis of pollen flow across a landscape. I. Male gamete heterogeneity among females. Evolution 2001, 55, 260–271. [Google Scholar] [CrossRef]
  22. Chybicki, I.J.; Oleksa, A. Seed and pollen gene dispersal in Taxus baccata, a dioecious conifer in the face of strong population fragmentation. Ann. Bot. 2018, 122, 409–421. [Google Scholar] [CrossRef] [Green Version]
  23. Șofletea, N.; Mihai, G.; Ciocîrlan, E.; Curtu, A.L. Genetic Diversity and Spatial Genetic Structure in Isolated Scots Pine (Pinus sylvestris L.) Populations Native to Eastern and Southern Carpathians. Forests 2020, 11, 1047. [Google Scholar] [CrossRef]
  24. Truong, C.; Palmé, A.E.; Felber, F. Recent invasion of the mountain birch Betula pubescens ssp. tortuosa above the treeline due to climate change: Genetic and ecological study in northern Sweden. J. Evol. Biol. 2007, 20, 369–380. [Google Scholar] [CrossRef]
  25. Jabłońska, E.; Pawlikowski, P.; Jarzombkowski, F.; Chormański, J.; Okruszko, T.; Kłosowski, S. Importance of water level dynamics for vegetation patterns in a natural percolation mire (Rospuda fen, NE Poland). Hydrobiologia 2011, 674, 105–117. [Google Scholar] [CrossRef] [Green Version]
  26. Bojsza, A.; Lićwinko, M.; Pińkowska, J. LIFE11/NAT/PL/422. Final Report—Results of Hydrological Monitoring Conducted in the Upper Basin of the Biebrza River Valley in 2013–2018. 2019. Available online: https://www.gorna.biebrza.org.pl/plik,4784,raport-koncowy-z-analizy-warunkow-meteorologicznych-i-stanow-wod-w-latach-hydrologicznych-2013-2018.pdf (accessed on 27 December 2021).
  27. Jarzombkowski, F. Torfowiska w basenie górnym Doliny Biebrzy (Peat bogs in the upper basin of the Biebrza river valley). In Z Mazowsza na Polesie i Wileńszczyznę. Zróżnicowanie i Ochrona Szaty Roślinnej Pogranicza Europy Środkowej i Północno-Wschodniej (From Mazovia to Polesie and the Vilnus Region. Diversification and Protection of Vegetation on the Border of Central and North-Eastern Europe; Obidziński, A., Ed.; Polish Botanical Society: Warsaw, Poland, 2010; pp. 331–340. [Google Scholar]
  28. Bojsza, A. LIFE11/NAT/PL/422 (Górna Biebrza–Upper Biebrza River). Final Report Covering the Project Activities from 01/09/2012 to 30/03/2019. 2019. Available online: https://www.gorna.biebrza.org.pl/plik,4836,raport-koncowy-life11-nat-pl-422.pdf (accessed on 27 December 2021).
  29. Kulju, K.K.M.; Pekkinen, M.; Varvio, S. Twenty-three microsatellite primer pairs for Betula pendula (Betulaceae). Mol. Ecol. Notes 2004, 4, 471–473. [Google Scholar] [CrossRef]
  30. Truong, C.; Palmé, A.E.; Felber, F.; Naciri-Graven, Y. Isolation and characterization of microsatellite markers in the tetraploid birch, Betula pubescens ssp. tortuosa. Mol. Ecol. Notes 2005, 5, 96–98. [Google Scholar] [CrossRef]
  31. Bona, A.; Kulesza, U.; Jadwiszczak, K.A. Clonal diversity, gene flow and seed production in endangered populations of Betula humilis Schrk. Tree Genet. Genomes 2019, 15, 50. [Google Scholar] [CrossRef] [Green Version]
  32. Arnaud-Haond, S.; Belkhir, K. GenClone: A computer program to analyse genotypic data, test for clonality and describe spatial clonal organization. Mol. Ecol. Notes 2007, 7, 15–17. [Google Scholar] [CrossRef]
  33. van Oosterhout, C.; Hutchinson, W.F.; Wills, P.M.; Shipley, P. MICRO-CHECKER: Software for identifying and correcting genotyping errors in microsatellite data. Mol. Ecol. Notes 2004, 4, 535–538. [Google Scholar] [CrossRef]
  34. Kalinowski, S.T.; Taper, M.L. Maximum likelihood estimation of the frequency of null alleles at microsatellite loci. Conserv. Genet. 2006, 7, 991–995. [Google Scholar] [CrossRef]
  35. Dąbrowski, M.J.; Bornelöv, S.; Kruczyk, M.; Baltzer, N.; Komorowski, J. ‘True’ null allele detection in microsatellite loci: A comparison of methods, assessment of difficulties and survey of possible improvements. Mol. Ecol. Resour. 2015, 15, 477–488. [Google Scholar] [CrossRef]
  36. Raymond, M.; Rousset, F. GENEPOP (version 1.2): Population genetics software for exact tests and ecumenicism. J. Hered. 1995, 86, 248–249. [Google Scholar] [CrossRef]
  37. Rousset, F. Genepop’007: A complete reimplementation of the Genepop software for Windows and Linux. Mol. Ecol. Resour 2008, 8, 103–106. [Google Scholar] [CrossRef]
  38. Rice, W.R. Analyzing tables of statistical tests. Evolution 1989, 43, 223–225. [Google Scholar] [CrossRef] [PubMed]
  39. Peakall, R.; Smouse, P.E. GENALEX 6: Genetic analysis in Excel. Population genetic software for teaching and research. Mol. Ecol. Notes 2006, 6, 288–295. [Google Scholar] [CrossRef]
  40. Chybicki, I.J.; Burczyk, J. Simultaneous estimation of null alleles and inbreeding coefficients. J. Hered. 2009, 100, 106–113. [Google Scholar] [CrossRef] [PubMed] [Green Version]
  41. Di Rienzo, A.; Peterson, A.C.; Garza, J.C.; Valdes, A.M.; Slatkin, M.; Freimer, N.B. Mutational processes of simple sequence repeat loci in human populations. Proc. Natl. Acad. Sci. USA 1994, 91, 3166–3170. [Google Scholar] [CrossRef] [Green Version]
  42. Garza, J.C.; Williamson, E.G. Detection of reduction in population size using data from microsatellite loci. Mol. Ecol. 2001, 10, 305–318. [Google Scholar] [CrossRef]
  43. Cornuet, J.-M.; Luikart, G. Description and power analysis of two tests for detecting recent population bottlenecks from allele frequency data. Genetics 1996, 144, 2001–2014. [Google Scholar] [CrossRef]
  44. Piry, S.; Luikart, G.; Cornuet, J.M. BOTTLENECK: A computer program for detecting recent reductions in the effective population size using allele frequency data. J. Hered. 1999, 90, 502–503. [Google Scholar] [CrossRef]
  45. Jones, O.R.; Wang, J. COLONY: A program for parentage and sibship inference from multilocus genotype data. Mol. Ecol. Resour. 2010, 10, 551–555. [Google Scholar] [CrossRef]
  46. Pritchard, J.K.; Stephens, M.; Donnelly, P. Inference of population structure using multilocus genotype data. Genetics 2000, 155, 945–959. [Google Scholar] [CrossRef]
  47. Evanno, G.; Regnaut, S.; Goudet, J. Detecting the number of clusters of individuals using the software STRUCTURE: A simulation study. Mol. Ecol. 2005, 14, 2611–2620. [Google Scholar] [CrossRef] [Green Version]
  48. Earl, D.A.; vonHoldt, B.M. STRUCTURE HARVESTER: A website and program for visualizing STRUCTURE output and implementing the Evanno method. Conserv. Genet. Resour. 2012, 4, 359–361. [Google Scholar] [CrossRef]
  49. Jakobsson, M.; Rosenberg, N.A. CLUMPP: A cluster matching and permutation programfor dealing with label switching and multimodality in analysis of population structure. Bioinformatics 2007, 23, 1801–1806. [Google Scholar] [CrossRef] [PubMed] [Green Version]
  50. Rosenberg, N.A. DISTRUCT: A program for the graphical display of population structure. Mol. Ecol. Notes 2004, 4, 137–138. [Google Scholar] [CrossRef]
  51. Chapuis, M.-P.; Estoup, A. Microsatellite null alleles and estimation of population differentiation. Mol. Biol. Evol. 2007, 24, 621–631. [Google Scholar] [CrossRef] [Green Version]
  52. Hardy, O.J.; Vekemans, X. SPAGeDi: A versatile computer program to analyse spatial genetic structure at the individual or population levels. Mol. Ecol. Notes 2002, 2, 618. [Google Scholar] [CrossRef] [Green Version]
  53. Loiselle, B.A.; Sork, V.L.; Nason, J.; Graham, C. Spatial genetic structure of a tropical understory shrub, Psychotria officinalis (Rubiaceae). Am. J. Bot. 1995, 82, 1420–1425. [Google Scholar] [CrossRef]
  54. Fenster, C.B.; Vekemans, X.; Hardy, O.J. Quantifying gene flow from spatial genetic structure data in a metapopulation of Chamaecrista fasciculata (Leguminosae). Evolution 2003, 57, 995–1007. [Google Scholar] [CrossRef]
  55. Dick, C.W.; Hardy, O.; Jones, F.; Petit, R. Spatial scales of pollen and seed-mediated gene flow in tropical rain forest trees. Trop. Plant Biol. 2008, 1, 20–33. [Google Scholar] [CrossRef]
  56. Aavik, T.; Helm, A. Restoration of plant species and genetic diversity depends on land scape-scale dispersal. Restor. Ecol. 2018, 26, 92–102. [Google Scholar] [CrossRef]
  57. Lovett-Doust, L. Population dynamics and local specialization in a clonal perennial (Ranunculus repens). I. The dynamics of ramets in contrasting habitats. J. Ecol. 1981, 69, 743–755. [Google Scholar] [CrossRef]
  58. Barrett, S.C.H. Influences of clonality on plant sexual reproduction. Proc. Natl. Acad. Sci. USA 2015, 112, 8859–8866. [Google Scholar] [CrossRef] [Green Version]
  59. Kettenring, K.M.; Mercer, K.L.; Adams, C.R.; Hines, J. Application of genetic diversity—Ecosystem function research to ecological restoration. J. Appl. Ecol. 2014, 51, 339–348. [Google Scholar] [CrossRef]
  60. Morente-López, J.; Lara-Romero, C.; García-Fernández, A.; Teso, M.L.R.; Prieto-Benítez, S.; Iriondo, J.M. Gene flow effects on populations inhabiting marginal areas: Origin matters. J. Ecol. 2021, 109, 139–153. [Google Scholar] [CrossRef]
  61. Jabłońska, E. Aktualny wykaz stanowisk Betula humilis (Betulaceae) w Polsce (Current list of localities of Betula humilis (Betulaceae) in Poland). Fragm. Flor. Geobot. Pol. 2014, 21, 77–90. [Google Scholar]
  62. Slatkin, M. Rare alleles as indicators of gene flow. Evolution 1985, 39, 53–65. [Google Scholar] [CrossRef]
  63. Jadwiszczak, K.A.; Drzymulska, D.; Banaszek, A.; Jadwiszczak, P. Population history, genetic variation and conservation status of the endangered birch species Betula nana L. in Poland. Silva Fenn. 2012, 4, 465–477. [Google Scholar] [CrossRef] [Green Version]
  64. Jarni, K.; Jakše, J.; Brus, R. Vegetative propagation: Linear barriers and somatic mutation affect the genetic structure of a Prunus avium L. stand. Forestry 2015, 88, 612–621. [Google Scholar] [CrossRef] [Green Version]
  65. Yu, L.; Boström, C.; Franzenburg, S.; Bayer, T.; Dagan, T.; Reusch, T.B.H. Somatic genetic drift and multilevel selection in a clonal seagrass. Nat. Ecol. Evol. 2020, 4, 952–962. [Google Scholar] [CrossRef]
  66. Paluch, J.; Zarek, M. Seed dispersal of anemochoric Abies alba Mill.: Lessons from seed tracking, seed trap experiments and the genetic parentage assignment of seedlings. Ann. For. Res. 2020, 63, 19–38. [Google Scholar] [CrossRef]
  67. Cavers, S.; Degen, B.; Caron, H.; Lemers, M.R.; Margis, R.; Salgueiro, F.; Lowe, A.J. Optimal sampling strategy for estimation of spatial genetic structure in tree populations. Heredity 2005, 95, 281–289. [Google Scholar] [CrossRef]
  68. Curtu, A.L.; Craciunesc, I.; Enescu, C.M.; Vidalis, A.; Sofletea, N. Fine-scale spatial genetic structure in a multi-oak-species (Quercus spp.) forest. iForest-Biogeosci. For. 2015, 8, 324–332. [Google Scholar] [CrossRef] [Green Version]
  69. Nei, M.; Maruyama, T.; Chakraborty, R. The bottleneck effect and genetic variability in populations. Evolution 1975, 29, 1–10. [Google Scholar] [CrossRef] [PubMed]
  70. Serafin, A.; Urban, D.; Bronowicka-Mielniczuk, U.; Szczurowska, A. To what degree can the specifics of occurrence of glacial relic Betula humilis Schrank be an indicator of habitat conditions of moderate climate peatlands? Water 2018, 10, 1062. [Google Scholar] [CrossRef] [Green Version]
  71. Kapowicz, E. Nowe stanowiska brzozy niskiej Betula humilis na terenie Niecki Gródecko-Michałowskiej (The new stands of shrubby birch Betula humilis in the area of Gródecko-Michałowska Basin). Przegląd Przyr. 2013, 24, 61–67. [Google Scholar]
Figure 1. Location of the studied B. humilis populations and the spatial distribution of individuals at each site. Nb—neighbourhood size. Orthophotomaps were acquired from the site geoportal.gov.pl (accessed on 16 August 2022).
Diversity 14 00684 g001
Figure 2. Principal coordinates analysis (PCoA) representing genetic distances between B. humilis individuals from the MB, ROS, and SUS populations.
Diversity 14 00684 g002
Figure 3. Clustering of B. humilis individuals from the MB, ROS, and SUS populations for K = 2 generated by STRUCTURE software.
Diversity 14 00684 g003
Figure 4. Spatial correlograms showing the relationship between the spatial distance and kinship coefficient of B. humilis individuals from the MB, ROS, and SUS populations. Dashed lines indicate 95% confidence intervals around the null hypothesis of randomly distributed genets. Statistically significant values are marked with an asterisk. Fij—kinship coefficient, F(1)—the average kinship coefficient of individuals belonging to the first distance class, b-log—the regression slope of observed relatedness on the logarithm of distance between individuals, and Sp—statistic describing spatial genetic structure.
Diversity 14 00684 g004
Table 1. Characteristics of the B. humilis populations studied in northeastern Poland. NR—number of ramets sampled, NG—number of genets.
Population NameCodeCoordinatesAltitudeNRNGHabitat Protection Type
LatitudeLongitude
Magdzie BagnoMB54°08′41″ N23°16′05″ E138 m109102No protection
Rospuda river valleyROS53°54′23″ N22°56′38″ E123 m138138Natura 2000 network
SzuszalewoSUS53°43′07″ N23°21′23″ E119 m139139Biebrza National Park
Table 2. Genetic diversity parameters and inbreeding coefficient in studied B. humilis populations. Pop—population, A—number of alleles, AP—number of private alleles, AN—frequency of null alleles, HO—observed heterozygosity, HE—expected heterozygosity, and P(HWE)—p value for HWE. Statistically significant values are marked with an asterisk.
PopLocusAAPANHOHEP(HWE)
MBL1.101400.00010.8730.8250.2617
L0211200.0526 *0.7160.8300.0000 *
L0221510.00010.8330.8510.1812
L5.41600.00000.8920.9000.1085
L5.11610.00130.9120.8470.0535
Bo.F3941810.00420.7450.7450.6725
Bo.G182930.00580.7060.7160.7330
14.3 ± 1.13 SE0.860.00190.811 ± 0.033 SE0.816 ± 0.024 SE<0.0001
ROSL1.101500.00000.8840.8780.1355
L0211100.00000.7610.8280.0228
L0221300.00180.8330.8620.6196
L5.41830.00350.9280.9170.5972
L5.11310.00120.8620.8100.0347
Bo.F3942320.02160.8910.9290.5092
Bo.G182800.05800.5870.6610.1553
14.4 ± 1.95 SE0.860.01230.821 ± 0.044 SE0.841 ± 0.034 SE0.0313
SUSL1.102040.00870.9060.8940.1613
L0212380.0660 *0.7840.8780.0000 *
L0221720.0239 *0.8270.9180.2888
L5.42230.02250.9350.9080.6367
L5.12470.0532 *0.8420.9050.0000 *
Bo.F3942850.02180.8710.9110.2300
Bo.G1821120.03460.6690.7050.0000 *
20.7 ± 2.07 SE4.420.02190.834 ± 0.033 SE0.874 ± 0.029 SE<0.0001
Table 3. Results of the bottleneck tests in B. humilis populations based on heterozygosity excess (TPM model with 78% of single step mutations) and M-ratio (the Garza–Williamson statistics). Pop—population. All P values are nonsignificant after applying Holm–Bonferroni’s correction.
Popp Value for TPMM-Ratio
MR∆MRp Value
MB0.85150.69540.09840.0543
ROS0.01950.66780.13650.0387
SUS0.76560.74690.05000.4066
Publisher’s Note: MDPI stays neutral with regard to jurisdictional claims in published maps and institutional affiliations.

