
The Contribution of Subtidal Seagrass Meadows to the Total Carbon Stocks of Gazi Bay, Kenya

 , and
, and
Abstract
:
1. Introduction
2. Materials and Methods
2.1. Description of the Study Area
2.2. Sampling Design
2.2.1. Measurement of Physicochemical Parameters
2.2.2. Determination of Seagrass Meadow Structure
2.2.3. Determination of above and belowground Carbon
2.2.4. Determination of Sediment Organic Carbon (Corg)
2.3. Data Analysis
3. Results
3.1. Physico-Chemical Properties in the Sub Tidal Area
3.2. Subtidal Seagrass Species Composition, Distribution and Structure within Gazi Bay
3.2.1. Seagrass Species Composition
3.2.2. Seagrass Species Distribution
3.2.3. Seagrass Meadow Structure
3.3. Vegetation Carbon Stocks of the Seagrasses
3.3.1. Above Ground Carbon of the Seagrasses
3.3.2. Belowground Carbon of the Seagrasses
3.4. Sediment Carbon of Seagrass Species
3.5. Total Carbon Stocks of the Subtidal Seagrass Meadows in Gazi Bay, Kenya
3.6. Relationship between Biomass and Meadow Structure Parameters
4. Discussion
4.1. Physico-Chemical Properties in the Sub Tidal Area
4.2. Species Composition Distribution and Abundance of Seagrasses
4.3. Seagrass above Ground Carbon
4.4. Belowground Carbon of Subtidal Seagrasses
4.5. Sediment Organic Carbon Stocks in the Subtidal Area of Gazi Bay
4.6. Total Carbon Stocks of the Seagrass Meadows in Gazi Bay
5. Conclusions
Author Contributions
Funding
Institutional Review Board Statement
Informed Consent Statement
Data Availability Statement
Acknowledgments
Conflicts of Interest
References
- Macreadie, P.I.; Costa, M.D.; Atwood, T.B.; Friess, D.A.; Kelleway, J.J.; Kennedy, H.; Lovelock, C.E.; Serrano, O.; Duarte, C.M. Blue carbon as a natural climate solution. Nat. Rev. Earth Environ. 2021, 2, 826–839. [Google Scholar] [CrossRef]
- Mcleod, E.; Chmura, G.L.; Bouillon, S.; Salm, R.; Björk, M.; Duarte, C.M.; Lovelock, C.E.; Schlesinger, W.H.; Silliman, B.R. A blueprint for blue carbon: Toward an improved understanding of the role of vegetated coastal habitats in sequestering CO2. Front. Ecol. Environ. 2011, 9, 552–560. [Google Scholar] [CrossRef]
- Nellemann, C.; Corcoran, E. (Eds.) Blue Carbon: The Role of Healthy Oceans in Binding Carbon: A Rapid Response Assessment; UNEP/Earthprint: Nairobi, Kenya, 2009. [Google Scholar]
- Duarte, C.M. The Role of Seagrass in Climate Change Mitigation and Adaptation; The University of Western Australia and Spanish National Research Council: Bonn, Germany, 2013. [Google Scholar]
- Fourqurean, J.W.; Duarte, C.M.; Kennedy, H.; Marbà, N.; Holmer, M.; Mateo, M.A.; Apostolaki, E.T.; Kendrick, G.A.; Krause-Jensen, D.; McGlathery, K.J.; et al. Seagrass ecosystems as a globally significant carbon stock. Nat. Geosci. 2012, 5, 505–509. [Google Scholar] [CrossRef]
- Lavery, P.S.; Mateo, M.Á.; Serrano, O.; Rozaimi, M. Variability in the carbon storage of seagrass habitats and its implications for global estimates of blue carbon ecosystem service. PLoS ONE 2013, 8, e73748. [Google Scholar] [CrossRef] [PubMed]
- Campbell, J.E.; Lacey, E.A.; Decker, R.A.; Crooks, S.; Fourqurean, J.W. Carbon storage in seagrass beds of Abu Dhabi, United Arab Emirates. Estuaries Coasts 2015, 38, 242–251. [Google Scholar] [CrossRef]
- Prentice, C.; Poppe, K.L.; Lutz, M.; Murray, E.; Stephens, T.A.; Spooner, A.; Hessing-Lewis, M.; Sanders-Smith, R.; Rybczyk, J.M.; Apple, J.; et al. A synthesis of blue carbon stocks, sources, and accumulation rates in eelgrass (Zostera marina) meadows in the Northeast Pacific. Glob. Biogeochem. Cycles 2020, 34, e2019GB006345. [Google Scholar] [CrossRef]
- Röhr, M.E.; Holmer, M.; Baum, J.K.; Björk, M.; Boyer, K.; Chin, D.; Chalifour, L.; Cimon, S.; Cusson, M.; Dahl, M.; et al. Blue carbon storage capacity of temperate eelgrass (Zostera marina) meadows. Glob. Biogeochem. Cycles 2018, 32, 1457–1475. [Google Scholar] [CrossRef]
- Green, A.; Chadwick, M.A.; Jones, P.J. Variability of UK seagrass sediment carbon: Implications for blue carbon estimates and marine conservation management. PLoS ONE 2018, 13, e0204431. [Google Scholar] [CrossRef]
- Gullström, M.; Lyimo, L.D.; Dahl, M.; Samuelsson, G.S.; Eggertsen, M.; Anderberg, E.; Rasmusson, L.M.; Linderholm, H.W.; Knudby, A.; Bandeira, S.; et al. Blue carbon storage in tropical seagrass meadows relates to carbonate stock dynamics, plant–sediment processes, and landscape context: Insights from the western Indian Ocean. Ecosystems 2018, 21, 551–566. [Google Scholar] [CrossRef]
- York, P.H.; Macreadie, P.I.; Rasheed, M.A. Blue Carbon stocks of Great Barrier Reef deep-water seagrasses. Biol. Lett. 2018, 14, 20180529. [Google Scholar] [CrossRef]
- Vanderklift, M.A.; Gorman, D.; Steven, A.D. Blue carbon in the Indian Ocean: A review and research agenda. J. Indian Ocean Reg. 2019, 15, 129–138. [Google Scholar] [CrossRef]
- Githaiga, M.N.; Kairo, J.G.; Gilpin, L.; Huxham, M. Carbon storage in the seagrass meadows of Gazi Bay, Kenya. PLoS ONE 2017, 12, e0177001. [Google Scholar] [CrossRef] [PubMed]
- Juma, G.A.; Magana, A.M.; Michael, G.N.; Kairo, J.G. Variation in seagrass carbon stocks between tropical estuarine and marine mangrove-fringed creeks. Front. Mar. Sci. 2020, 7, 696. [Google Scholar] [CrossRef]
- Serrano, O.; Lavery, P.S.; Rozaimi, M.; Mateo, M.Á. Influence of water depth on the carbon sequestration capacity of seagrasses. Glob. Biogeochem. Cycles 2014, 28, 950–961. [Google Scholar] [CrossRef]
- Serrano, O.; Ricart, A.M.; Lavery, P.S.; Mateo, M.A.; Arias-Ortiz, A.; Masque, P.; Rozaimi, M.; Steven, A.; Duarte, C.M. Key biogeochemical factors affecting soil carbon storage in Posidonia meadows. Biogeosciences 2016, 13, 4581–4594. [Google Scholar] [CrossRef]
- Mazarrasa, I.; Samper-Villarreal, J.; Serrano, O.; Lavery, P.S.; Lovelock, C.E.; Marbà, N.; Duarte, C.M.; Cortés, J. Habitat characteristics provide insights of carbon storage in seagrass meadows. Mar. Pollut. Bull. 2018, 134, 106–117. [Google Scholar] [CrossRef]
- Koch, E.W.; Sanford, L.P.; Chen, S.N.; Shafer, D.J.; Smith, J.M. Waves in Seagrass Systems: Review and Technical Recommendations. 2006. Available online: https://apps.dtic.mil/sti/pdfs/ADA458760.pdf (accessed on 7 August 2022).
- Palacios, M.M.; Waryszak, P.; de Paula Costa, M.D.; Wartman, M.; Ebrahim, A.; Macreadie, P.I. Literature Review: Blue Carbon Research in the Tropical Western Indian Ocean. 2021. Available online: https://seyccat.org/wp-content/uploads/2020/01/BlueCarbonLab_LitReport_Seychelles_20210301_final.pdf (accessed on 7 August 2022).
- Dahl, M.; Deyanova, D.; Gütschow, S.; Asplund, M.E.; Lyimo, L.D.; Karamfilov, V.; Santos, R.; Björk, M.; Gullström, M. Sediment properties as important predictors of carbon storage in Zostera marina meadows: A comparison of four European areas. PLoS ONE 2016, 11, e0167493. [Google Scholar]
- Mateo, M.; Cebrián, J.; Dunton, K.; Mutchler, T. Carbon Flux in Seagrass Ecosystems. In Seagrasses: Biology, Ecology and Conservation; Springer: Berlin/Heidelberg, Germany, 2006; pp. 159–192. [Google Scholar]
- Serrano, O.; Lavery, P.S.; Duarte, C.M.; Kendrick, G.A.; Calafat, A.; York, P.H.; Steven, A.; Macreadie, P.I. Can mud (silt and clay) concentration be used to predict soil organic carbon content within seagrass ecosystems? Biogeosciences 2016, 13, 4915–4926. [Google Scholar] [CrossRef]
- Kennedy, H.; Beggins, J.; Duarte, C.M.; Fourqurean, J.W.; Holmer, M.; Marbà, N.; Middelburg, J.J. Seagrass sediments as a global carbon sink: Isotopic constraints. Glob. Biogeochem. Cycles 2010, 24, 2010GB003848. [Google Scholar] [CrossRef]
- Orth, R.J.; Carruthers, T.J.; Dennison, W.C.; Duarte, C.M.; Fourqurean, J.W.; Heck, K.L.; Hughes, A.R.; Kendrick, G.A.; Kenworthy, W.J.; Olyarnik, S.; et al. A global crisis for seagrass ecosystems. Bioscience 2006, 56, 987–996. [Google Scholar] [CrossRef]
- Pendleton, L.; Donato, D.C.; Murray, B.C.; Crooks, S.; Jenkins, W.A.; Sifleet, S.; Craft, C.; Fourqurean, J.W.; Kauffman, J.B.; Marba, N.; et al. Estimating global “blue carbon” emissions from conversion and degradation of vegetated coastal ecosystems. PLoS ONE 2012, 7, e43542. [Google Scholar] [CrossRef]
- Macreadie, P.I.; Baird, M.E.; Trevathan-Tackett, S.M.; Larkum, A.W.D.; Ralph, P.J. Quantifying and model-ling the carbon sequestration capacity of seagrass meadows–a critical assessment. Mar. Pollut. Bull. 2014, 83, 430–439. [Google Scholar] [CrossRef]
- Githaiga, M.N.; Gilpin, L.; Kairo, J.G.; Huxham, M. Biomass and productivity of seagrasses in Africa. Bot. Mar. 2016, 59, 173–186. [Google Scholar] [CrossRef]
- Kitheka, J.U. Water circulation and coastal trapping of brackish water in a tropical mangrove-dominated bay in Kenya. Limnol. Oceanogr. 1996, 41, 169–176. [Google Scholar] [CrossRef]
- Coppejans, E.; Beeckman, H.; de Wit, M. The Seagrass and Associated Macroalgal Vegetation of Gazi Bay (Kenya). In The Ecology of Mangrove and Related Ecosystems; Springer: Dordrecht, The Netherlands, 1992; pp. 59–75. [Google Scholar]
- Bouillon, S.; Dehairs, F.; Velimirov, B.; Abril, G.; Borges, A.V. Dynamics of organic and inorganic carbon across contiguous mangrove and seagrass systems (Gazi Bay, Kenya). J. Geophys. Res. Biogeosci. 2007, 112, G02018. [Google Scholar] [CrossRef]
- Peel, M.C.; Finlayson, B.L.; McMahon, T.A. Updated world map of the Köppen-Geiger climate classification. Hydrol. Earth Syst. Sci. 2007, 11, 1633–1644. [Google Scholar] [CrossRef]
- McClanahan, T.R. Seasonality in East Africa’s Coastal Waters. 1988. Available online: https://www.int-res.com/articles/meps/44/m044p191.pdf (accessed on 7 August 2022).
- Hemminga, M.A.; Slim, F.; Kazungu, J.; Ganssen, G.M.; Nieuwenhuize, J.; Kruyt, N.M. Carbon outwelling from a mangrove forest with adjacent seagrass beds and coral reefs (Gazi Bay, Kenya). Mar. Ecol. Prog. Ser. 1994, 106, 291–301. [Google Scholar] [CrossRef]
- Signa, G.; Mazzola, A.; Kairo, J.; Vizzini, S. Small-scale variability in geomorphological settings influences mangrove-derived organic matter export in a tropical bay. Biogeosciences 2017, 14, 617–629. [Google Scholar] [CrossRef]
- Bouillon, S.; Dehairs, F.; Abril, G.; Borges, A. Distribution and Sources of Organic Carbon in a Mangrove Seagrass Ecosystem (Gazi Bay, Kenya). 2005. Available online: https://orbi.uliege.be/bitstream/2268/246507/1/EGU05-J-01904.pdf (accessed on 7 August 2022).
- Musembi, P.; Fulanda, B.; Kairo, J.; Githaiga, M. Species composition, abundance and fishing methods of small-scale fisheries in the seagrass meadows of Gazi Bay, Kenya. J. Indian Ocean. Reg. 2019, 15, 139–156. [Google Scholar] [CrossRef]
- Harcourt, W.D.; Briers, R.A.; Huxham, M. The thin (ning) green line? Investigating changes in Kenya’s seagrass coverage. Biol. Lett. 2018, 14, 20180227. [Google Scholar] [CrossRef]
- Howard, J.; Hoyt, S.; Isensee, K.; Telszewski, M.; Pidgeon, E. Coastal Blue Carbon: Methods for Assessing Carbon Stocks and Emissions Factors in Mangroves, Tidal Salt Marshes, and Seagrasses. 2014. Available online: https://www.cifor.org/publications/pdf_files/Books/BMurdiyarso1401.pdf (accessed on 7 August 2022).
- Intergovernmental Panel on Climate Change. Supplement to the 2006 IPCC Guidelines for National Greenhouse Gas Inventories: Wetlands; IPCC: Geneva, Switzerland, 2014. [Google Scholar]
- Short, F.T.; Koch, E.W.; Creed, J.C.; Magalhaes, K.M.; Fernandez, E.; Gaeckle, J.L. SeagrassNet monitoring across the Americas: Case studies of seagrass decline. Mar. Ecol. 2006, 27, 277–289. [Google Scholar] [CrossRef]
- Waycott, M.; McMahon, K.; Mellors, J.; Calladine, A.; Kleine, D. A Guide to Tropical Seagrasses of the Indo-West Pacific; James Cook University: Townsville, Australia, 2004. [Google Scholar]
- Duarte, C.M. Seagrass nutrient content. Mar. Ecol. Prog. Ser. 1990, 6, 201–207. [Google Scholar] [CrossRef]
- Marine, K. Current Status of Trawl Fishery of Malindi-Ungwana Bay Final Report December 2002; Kenya Marine and Fisheries Research Institute: Mombasa, Kenya, 2002. [Google Scholar]
- Serrano, O.; Almahasheer, H.; Duarte, C.M.; Irigoien, X. Carbon stocks and accumulation rates in Red Sea seagrass meadows. Sci. Rep. 2018, 8, 15037. [Google Scholar] [CrossRef]
- Pai, I.K.; Govekar, K. An Extensive Study on Physico-Chemical Parameters of Bay of Bengal and Central Indian Ocean Basin. 2016. Available online: http://medcraveonline.com/JAMB/JAMB-04-00097.pdf (accessed on 7 August 2022).
- Gullström, M.; de la Torre Castro, M.; Bandeira, S.O.; Björk, M.; Dahlberg, M.; Kautsky, N.; Rönnbäck, P.; Öhman, M.C. Seagrass ecosystems in the western Indian Ocean. AMBIO 2002, 31, 588–596. [Google Scholar] [CrossRef]
- Aller, E.A.; Eklöf, J.S.; Gullström, M.; Kloiber, U.; Linderholm, H.W.; Nordlund, L.M. Temporal variability of a protected multispecific tropical seagrass meadow in response to environmental change. Environ. Monit. Assess. 2019, 191, 774. [Google Scholar] [CrossRef]
- Dahl, M.; Deyanova, D.; Lyimo, L.D.; Näslund, J.; Samuelsson, G.S.; Mtolera, M.S.; Björk, M.; Gullström, M. Effects of shading and simulated grazing on carbon sequestration in a tropical seagrass meadow. J. Ecol. 2016, 104, 654–664. [Google Scholar] [CrossRef]
- Duarte, C.M.; Chiscano, C.L. Seagrass biomass and production: A reassessment. Aquat. Bot. 1999, 65, 159–174. [Google Scholar] [CrossRef]
- Bourque, A.S.; Kenworthy, W.J.; Fourqurean, J.W. Impacts of physical disturbance on ecosystem structure in subtropical seagrass meadows. Mar. Ecol. Prog. Ser. 2015, 540, 27–41. [Google Scholar] [CrossRef]
- Githaiga, M.N.; Frouws, A.M.; Kairo, J.G.; Huxham, M. Seagrass removal leads to rapid changes in fauna and loss of carbon. Front. Ecol. Evol. 2019, 7, 62. [Google Scholar] [CrossRef]
- Thom, R.M.; Borde, A.B.; Rumrill, S.; Woodruff, D.L.; Williams, G.D.; Southard, J.A.; Sargeant, S.L. Factors influencing spatial and annual variability in eelgrass (Zostera marina L.) meadows in Willapa Bay, Washington, and Coos Bay, Oregon, estuaries. Estuaries 2003, 26, 1117–1129. [Google Scholar] [CrossRef]
- Miyajima, T.; Hori, M.; Hamaguchi, M.; Shimabukuro, H.; Adachi, H.; Yamano, H.; Nakaoka, M. Geographic variability in organic carbon stock and accumulation rate in sediments of East and Southeast Asian seagrass meadows. Glob. Biogeochem. Cycles 2015, 29, 397–415. [Google Scholar] [CrossRef]
- Govindasamy, C.; Arulpriya, M.; Anantharaj, K.; Ruban, P.; Srinivasan, R. Seasonal variations in seagrass biomass and productivity in Palk Bay, Bay of Bengal, India. Int. J. Biodivers. Conserv. 2013, 5, 408–417. [Google Scholar]
- Huxham, M.; Whitlock, D.; Githaiga, M.; Dencer-Brown, A. Carbon in the coastal seascape: How interactions between mangrove forests, seagrass meadows and tidal marshes influence carbon storage. Curr. For. Rep. 2018, 4, 101–110. [Google Scholar] [CrossRef]
- Belshe, E.F.; Hoeijmakers, D.; Herran, N.; Mtolera, M.; Teichberg, M. Seagrass community-level controls over organic carbon storage are constrained by geophysical attributes within meadows of Zanzibar, Tanzania. Biogeosciences 2018, 15, 4609–4626. [Google Scholar] [CrossRef]
- Jankowska, E.; Michel, L.N.; Zaborska, A.; Włodarska-Kowalczuk, M. Sediment carbon sink in low-density temperate eelgrass meadows (Baltic Sea). J. Geophys. Res. Biogeosciences 2016, 121, 2918–2934. [Google Scholar] [CrossRef]
- Garcias-Bonet, N.; Delgado-Huertas, A.; Carrillo-de-Albornoz, P.; Anton, A.; Almahasheer, H.; Marbà, N.; Hendriks, I.E.; Krause-Jensen, D.; Duarte, C.M. Carbon and nitrogen concentrations, stocks, and isotopic compositions in Red Sea seagrass and mangrove sediments. Front. Mar. Sci. 2019, 6, 267. [Google Scholar] [CrossRef]
- Gorman, D.; Sumida, P.Y.; Figueira, R.C.; Turra, A. Improving soil carbon estimates of mudflats in Araçá Bay using spatial models that consider riverine input, wave exposure and biogeochemistry. Estuar. Coast. Shelf Sci. 2020, 238, 106734. [Google Scholar] [CrossRef]
- Asplund, M.E.; Dahl, M.; Ismail, R.O.; Arias-Ortiz, A.; Deyanova, D.; Franco, J.N.; Hammar, L.; Hoamby, A.I.; Linderholm, H.W.; Lyimo, L.D.; et al. Dynamics and fate of blue carbon in a mangrove–seagrass seascape: Influence of landscape configuration and land-use change. Landsc. Ecol. 2021, 36, 1489–1509. [Google Scholar] [CrossRef]


| Area | Depth (m) | Temp (°C) | Salinity (ppt) | pH | TDS (mg/L) |
|---|---|---|---|---|---|
| Zone A | 2.2 ± 0.6 | 28.9 ± 0.4 | 35.8 ± 0.5 | 7.8 ± 0.1 | 35,340.5 ± 370 |
| Zone B | 3.9 ± 0.9 | 28.7 ± 0.3 | 35.6 ± 0.2 | 7.8 ± 0.1 | 35,062.9 ± 163 |
| Zone C | 2.9 ± 1.2 | 28.5 ± 0.3 | 35.3 ± 0.2 | 7.8 ± 0.1 | 34,877.9 ± 185 |
| Zone D | 4.9 ± 1.3 | 28.2 ± 0.4 | 35.1 ± 0.1 | 7.7 ± 0.1 | 34,661.3 ± 46 |
| Species | Zone A | Zone B | Zone C | Zone D |
|---|---|---|---|---|
| C. serrulata | + | - | + | + |
| T. hemprichii | + | + | - | - |
| C. rotundata | - | + | - | - |
| H. uninervis | - | + | + | - |
| E. acoroides | - | + | - | - |
| S. isoetifolium | - | + | + | - |
| H. stipulacea | - | - | + | + |
| H. ovalis | - | - | + | - |
| Thalassodendron ciliatum | - | - | + | + |
| Species | Frequency | % Frequency |
|---|---|---|
| C. rotundata | 5 | 6.3 |
| C. serrulata | 12 | 15 |
| E. acoroides | 2 | 2.5 |
| H. uninervis | 8 | 10 |
| H. ovalis | 1 | 1.3 |
| H. stipulacea | 7 | 8.8 |
| S. isoetifolium | 8 | 10 |
| T. hemprichii | 23 | 28.7 |
| T. ciliatum | 14 | 17.4 |
| Species | Density/m2 | Canopy Height (cm) | % Cover |
|---|---|---|---|
| C. rotundata | 794 ± 42.9 | 16.5 ± 0.2 | 66.3 |
| C. serrulata | 523 ± 14.3 | 19.4 ± 0.1 | 55.4 |
| E. acoroides | 344 ± 19 | 49.2 ± 0.4 | 55.0 |
| H. uninervis | 758 ± 19.7 | 11.3 ± 0.1 | 65.0 |
| H. ovalis | 164 ± 31 | 5.0 ± 0.1 | 60.0 |
| H. stipulacea | 464 ± 30.9 | 4.7 ± 0.1 | 48.4 |
| S. isoetifolium | 580 ± 26.4 | 20.6 ± 0.1 | 64.3 |
| T. hemprichii | 611 ± 10.1 | 15.6 ± 0.1 | 53.8 |
| T. ciliatum | 350 ± 11 | 41.8 ± 0.8 | 53.5 |
| Species | AGC Mg C ha−1 (Mean ± SE) | AGC Mg C ha−1 (Range) |
|---|---|---|
| C. serrulata | 0.48 ± 0.2 | 0.19–0.7 |
| S. isoetifolium | 0.42 ± 0.3 | 0.25–0.7 |
| T. hemprichii | 0.35 ± 0.2 | 0.22–0.7 |
| T. ciliatum | 1.04 ± 0.4 | 0.63–2.1 |
| Habitat | Area (ha) | Aboveground Carbon | Belowground Carbon | Sediment Carbon | Total Ecosystem Carbon |
|---|---|---|---|---|---|
| (Mg C ha−1) | (Mg C ha−1) | (Mg C ha−1) | Mg C | ||
| Subtidal | 470 | 0.54 ± 0.1(1%) | 5.06 ± 0.7(2%) | 113 ± 8(97%) | 55,742 |
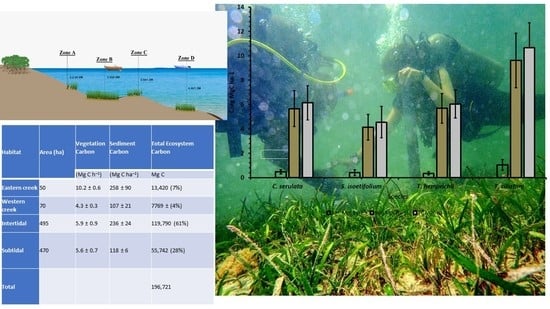
| Habitat | Area (ha) | Vegetation Carbon | Sediment Carbon | Total Ecosystem Carbon | Source |
|---|---|---|---|---|---|
| (Mg C h−1) | (Mg C ha−1) | Mg C | |||
| Eastern creek | 50 | 10.2 ± 0.6 | 258 ± 90 | 13,420 (7%) | [15] |
| Western creek | 70 | 4.3 ± 0.3 | 107 ± 21 | 7769 ± (4%) | [15] |
| Intertidal | 495 | 5.9 ± 0.9 | 236 ± 24 | 119,790 (61%) | [14] |
| Subtidal | 470 | 5.6 ± 0.7 | 118 ± 6 | 55,742 (28%) | This study |
| Total | 196,721 | This study |
Publisher’s Note: MDPI stays neutral with regard to jurisdictional claims in published maps and institutional affiliations. |
© 2022 by the authors. Licensee MDPI, Basel, Switzerland. This article is an open access article distributed under the terms and conditions of the Creative Commons Attribution (CC BY) license (https://creativecommons.org/licenses/by/4.0/).
Share and Cite
Omollo, D.J.; Wang’ondu, V.W.; Githaiga, M.N.; Gorman, D.; Kairo, J.G. The Contribution of Subtidal Seagrass Meadows to the Total Carbon Stocks of Gazi Bay, Kenya. Diversity 2022, 14, 646. https://doi.org/10.3390/d14080646
Omollo DJ, Wang’ondu VW, Githaiga MN, Gorman D, Kairo JG. The Contribution of Subtidal Seagrass Meadows to the Total Carbon Stocks of Gazi Bay, Kenya. Diversity. 2022; 14(8):646. https://doi.org/10.3390/d14080646
Chicago/Turabian StyleOmollo, Derrick Joannes, Virginia Wangeci Wang’ondu, Michael Njoroge Githaiga, Daniel Gorman, and James Gitundu Kairo. 2022. "The Contribution of Subtidal Seagrass Meadows to the Total Carbon Stocks of Gazi Bay, Kenya" Diversity 14, no. 8: 646. https://doi.org/10.3390/d14080646