Article

Detection of Large Herbivores in UAV Images: A New Method for Small Target Recognition in Large-Scale Images

1
College of Resource Environment and Tourism, Capital Normal University, Beijing 100048, China
2
Key Laboratory of Terrestrial Surface Pattern and Simulation, Institute of Geographic Sciences and Natural Resources Research, Chinese Academy of Sciences, Beijing 100101, China
3
University of Chinese Academy of Sciences, Beijing 100049, China
4
School of Environment, Beijing Jiaotong University, Beijing 100044, China
*
Author to whom correspondence should be addressed.
Diversity 2022, 14(8), 624; https://doi.org/10.3390/d14080624
Submission received: 31 May 2022 / Revised: 3 August 2022 / Accepted: 4 August 2022 / Published: 5 August 2022
(This article belongs to the Special Issue Ecosystem Observation, Simulation and Assessment)

Abstract

:
Algorithm design and implementation for the detection of large herbivores from low-altitude (200 m–350 m) UAV remote sensing images faces two key problems: (1) the size of a single image from the UAV is too large, and the mainstream algorithm cannot adapt to it, and (2) the number of animals in the image is very small and densely distributed, which makes the model prone to missed detection. This paper proposes the following solutions: For the problem of animal size, we optimized the Faster-RCNN algorithm in terms of three aspects: selecting a HRNet feature extraction network that is more suitable for small target detection, using K-means clustering to obtain the anchor frame size that matches the experimental object, and using NMS to eliminate detection frames that have sizes inconsistent with the size range of the detection target after the algorithm generates the target detection frames. For image size, bisection segmentation was used when training the model, and when using the model to detect the whole image, we propose the use of a new overlapping segmentation detection method. The experimental results obtained for detecting yaks, Tibetan sheep (Tibetana folia), and the Tibetan wild ass in remote sensing images of low-altitude UAV from Maduo County, the source region of the Yellow River, show that the mean average precision (mAP) and average recall (AR) of the optimized Faster-RCNN algorithm are 97.2% and 98.2%, respectively, which are 9.5% and 12.1% higher than the values obtained by the original Faster-RCNN. In addition, the results obtained from applying the new overlap segmentation method to the whole UAV image detection process also show that the new overlap segmentation method can effectively solve the problems of the detection frames not fitting the target, missing detection, and creating false alarms due to bisection segmentation.

1. Introduction

The term ‘herbivores’ refers to animals that live on the roots, stems, leaves, and seeds of grass [1]. Large herbivores have a large body size and consume huge amounts of grass, and their interaction with grassland plays a crucial role in maintaining the grassland ecosystem [2]. With the increase in protection efforts, the population of wild herbivores in the source region of the Yellow River has gradually increased, and the phenomenon of competition between wild herbivores and farm livestock for pasture has become increasingly prominent, even having some impact on the local grassland ecosystem and animal husbandry production [3]. Traditional grassland animal husbandry is facing development bottlenecks such as overgrazing, grassland degradation, and seasonal imbalance, which seriously threaten the service function of grassland ecosystems [4]. The key to solving these problems is to: find out the quantity and distribution of various large herbivores over time so as to provide a scientific basis for maintaining the balance between grassland and livestock, including wild animals and farm livestock; formulate scientific and effective grassland resource utilization plans; and maintain the cycle of the grassland ecosystem [5]. Animal survey is of great significance. In this paper, the large herbivores, including the large wild herbivores and the large domestic herbivores, were detected.
Animal survey methods include ground survey methods, satellite remote sensing survey methods, and aerial remote sensing survey methods (including manned aerial vehicle survey methods and unmanned aerial survey vehicle methods) [1]. The ground survey method takes a long time, and some animals are difficult for humans to approach. The satellite remote sensing survey method has the problems of the flight height being impossible to set according to real-time needs, the data resolution being low, and it being unable to identify a single animal. The manned aerial vehicle survey method has the problems of a high cost and high noise. Compared with these, the unmanned aerial vehicle survey method (UAV survey method) has the advantages of fast image acquisition, flexible and convenient operation, and low cost and risk, providing an effective and reliable tool for regional wildlife surveys [6]. Therefore, we detected large herbivores from the images obtained by UAV.
In recent years, machine learning, especially deep learning, has made many breakthroughs in target recognition, and the related detection algorithms have been gradually applied to the target detection task of images [7]. At present, target detection algorithms with good detection effects include Faster-RCNN, SSD, YOLO, and R-FCN [8]. Faster-RCNN [9] and R-FCN [10] generally accept 1000 × 600 pixel VOC data set images or 1388 × 800 pixel COCO data set images, SSD [11] usually uses 300 × 300 or 512 × 512 pixel input images, and YOLO [12] uses 416 × 416 or 544 × 544 pixel input images. The standard size of the UAV remote sensing images obtained in this paper was 6000 × 4000 pixel, meaning that the UAV images to be detected did not match the image size required by the model. Compared with the YOLO algorithm and the SSD algorithm, Faster-RCNN has a higher accuracy in small-target detection and the stages of feature extraction, detection, and classification are separated, meaning that they can be improved and optimized separately [13]. Therefore, we improved the Faster-RCNN algorithm in this paper. Aiming at the problem of the size of a single image being too large, a new solution is proposed: equal segmentation in training, overlapping segmentation in model detection, discarding the detection frame close to the edge, and then non-maximum suppression (NMS).
In addition, the proportion of large herbivores in UAV images is often very small, and the detection accuracy of small targets is often low due to the small proportion of images, the insignificant number of texture features, the insufficient semantic information of shallow features, the lack of high-level feature information, and other reasons [1]. We replace the feature extraction network in the Faster-RCNN algorithm with a feature extraction network that is more suitable for small-target detection. The feature extraction network used in the target detection algorithm is used to reduce the data dimension and extract effective features for subsequent use. Classical feature extraction networks include the following: the LeNet network [14], which applied the convolutional neural network to practical tasks for the first time; AlexNet [15], which used dropout to prevent over fitting and proposed a ReLU activation function; the VGG network [16], which used the idea of modularization to build the network model and applied a convolution layer using multiple smaller convolution filters to replace a convolution layer with a larger convolution filter; the ResNet network [17], which used a residual network to avoid the problems of gradient explosion and gradient disappearance caused by model deepening, meaning that the number of network layers can become very deep; GoogLeNet [18], which proposed the Inception module and used multiple branches and convolution kernels; the ResNext network [19], which combined Inception and ResNet; and SENet [20], which proposed a channel domain attention mechanism. HRNet [21] maintains the high-resolution representation by connecting high-resolution to low-resolution convolution in parallel and enhances high-resolution representation by repeating multi-scale fusion across parallel convolution, making it more suitable for the detection of small targets. Therefore, we selected the HRNet network as the feature extraction network in this paper. In addition, we used K-means clustering to obtain an anchor frame size that matches the experimental object and filtered out detection frames with sizes that do not fall within the range after the algorithm generated the detection frames so as to further improve the detection accuracy of large herbivores in UAV images.

2. Data and Relevant Technical Principles

2.1. Data Sources

Maduo County, the study area, belongs to the Golog Tibetan Autonomous Prefecture and is located in the south of the Qinghai Province at the north foot of Bayankala mountain. The land cover type of Maduo County is mainly grassland, and there are small areas of swamps, lakes, bare rock gravel, sandy land, rivers, etc. [22]. Maduo County is located in the Qinghai Tibet Plateau and belongs to the Qinghai Tibet Plateau climate system. It is a typical continental climate type on the plateau. The large wild herbivores in the study area include the Tibetan wild donkey, Tibetan gazelle, and rock sheep, whereas the large domestic herbivores in the area include the domestic yak, domestic Tibetan sheep, and horse [23]. In this paper, the Tibetan wild donkey was selected as a representative species of large wild herbivores, whereas the yak and Tibetan sheep were selected as representative species of large domestic herbivores to detect large herbivores in UAV images.
The UAV remote sensing image data used in this paper were obtained and provided by Shao Quanqin research group of the Institute of Key Laboratory of Terrestrial Surface Pattern and Simulation, Institute of Geographic Sciences and Natural Resources Research, Chinese Academy of Sciences. The remote sensing image acquisition platform of the UAV was an electric fixed-wing UAV (Figure 1). The fixed-wing UAV has the advantages of strong wind resistance, fast flight speed, high operation efficiency, and long endurance time, and it is suitable for information collection in large areas. The camera carried is a Sony ILCE-5100. A dual-camera system was used for aerial photography. The images were taken in Maduo County from 9–18 April 2017. The aerial shooting time was 7:00–11:00 every day. Those days were sunny or cloudy. There were 16 aerial sorties and 14 effective sorties. The shooting height was 200–350 m and the resolution was 4–7 cm. In total, 23,784 images were obtained, with an effective shooting area of 356 km2 (high resolution, large heading, and lateral overlap), and the effective utilization area was 326.6 km2 (excluding corners). In this paper, images taken on 9 April and 15 April were used to detect large herbivores including yaks, Tibetan sheep, and Tibetan wild asses.

2.2. Data Preprocessing

In this paper, the images obtained by the UAV were used for detection. With the help of python, each UAV remote sensing image was divided into 100 small images with heights of 600 pixels and widths of 400 pixels. Bisection segmentation may cause a target to be divided into two halves; in order to ensure the quality of model training, when selecting the segmented images for training samples, images containing half an animal were not selected. In order to enhance the robustness, 50 small images of Tibetan sheep, 50 small images of Tibetan wild donkeys, and 50 small images of yaks without half an animal were randomly selected to create the training samples. These images included 308 Tibetan sheep, 210 Tibetan wild asses, and 130 yaks. The production and selection methods applied to the test samples used for evaluation were the same as those applied to the training samples. In order to ensure the robustness of the evaluation, all test images were randomly selected and none of the test images or training images were the same image.
After randomly selecting all images that did not contain half an animal from the cropped images, they needed to be labeled to generate the training data set. The software tool LabelImg was used to label Tibetan sheep, yaks, and Tibetan wild donkeys. The labeling process is shown in Figure 2. In this process, a corresponding XML format file was established for each image, in which the category of each target animal in the image and its corresponding location information were recorded.
In the training process of a deep learning model, the more model parameters and the less data there are, the more likely the model is to experience the problem of over fitting [24]. Increasing the amount of data is the most effective way to solve the problem of over fitting. We observed targets on the ground from the angle of the UAV, where the observation angle was almost vertical. Therefore, we could use data enhancement to simulate the posture of various animals from an overhead view to expand the data. By observing the posture and behavior of large herbivores, we: expanded the training samples to 9 times the original through 90-, 180-, and 270-degree rotation; horizontally, vertically, and diagonally mirrored the image; and changed light and shade so as to improve the generalization ability of the model. In order to reduce the workload of annotation, after the randomly selected training samples were annotated, we performed data enhancement operations on the image and its corresponding XML annotation file at the same time, and then converted the data into the required COCO format and input them into the network for training.

2.3. Faster-RCNN Algorithm

Faster-RCNN is a two-stage target detection algorithm where VGG16 is used as the feature extraction network. VGG16 includes 13 convolution layers and 3 full connection layers, and the convolution kernel size is 3 × 3 [25]. The VGG network conducts several down sampling processes in the process of extracting feature information, resulting in the small targets in the feature map having basically only single digit pixel sizes, resulting in a poor detection effect for small targets. The reasoning speed reaches 5 fps on GPU (including all steps) [10]. The algorithm process can be divided into four steps. (1) Feature extraction network. We input the image into the feature extraction network to extract feature maps. (2) Region Proposal Network (RPN). The RPN generated 9 anchors with 3 box areas of 1282, 2562, and 5122 pixels and 3 aspect ratios of 1:1, 1:2, and 2:1 at each position of the feature map [26] and sampled 256 samples in all anchor boxes to train the RPN network, in which the ratio of positive to negative samples was 1:1. On the one hand, it judged whether the category of anchor boxes belonged to the foreground or background through softmax; on the other hand, it calculated the regression offset of the bounding box to obtain an accurate candidate box and eliminate candidate boxes that were too small or beyond the boundary. After screening, the RPN finally retained 2000 candidate frames and projected them onto the feature map to obtain the corresponding feature matrices. (3) Region of interest pooling (ROI pooling). The feature matrices obtained from the RPN layer were mapped into uniform size feature vectors by ROI pooling. (4) Classification and regression. The feature vectors obtained by ROI pooling were transmitted to the classifier through the full connection layer to judge the category. Additionally, the more accurate positions of the detection frames were regressed by the regressor. The flow chart is shown in Figure 3.

2.4. MMdetection

We used the MMdetection toolbox to optimize the Faster-RCNN to complete the detection of large herbivores in UAV images. MMdetection [27] is an open-source deep learning target detection toolbox based on pytorch from Shangtang technology. It adopts modular design to connect different components, and can easily build a customized target detection framework. It supports many classical target detection algorithm models, such as RPN, Fast-RCNN, Faster-RCNN, SSD, RetinaNet, etc., as well as toolkits of various modules. All basic box and mask operations now run on GPU, which has the characteristics of a slightly higher performance, faster training speed, and less video memory, which is conducive to experiments. Therefore, this paper improved the Faster-RCNN algorithm with the help of the MMdetection toolbox.

3. Improvement of Faster-RCNN Algorithm

In view of the problems mentioned above (in that the original Faster-RCNN model has low small target detection accuracy, the UAV single image is too large, and its size does not match the size required by the Faster-RCNN), this paper mainly improved the Faster-RCNN target detection algorithm in terms of the following aspects: (1) Replacing the feature extraction network: We selected HRNet, which is more suitable for small target detection, as the feature extraction network. The design details are shown in Section 3.1. (2) Optimizing the Region Proposal Network: We used the K-means algorithm to cluster the target size and set the anchor frame size and proportions suitable for large herbivores to improve the Region Proposal Network. The design details are shown in Section 3.2. (3) Post-processing optimization: After the detection frames were generated by the Faster-RCNN algorithm for classification and regression, post-processing was carried out, and NMS was used to eliminate the detection frames with scores lower than 0.5. By observing the results, we found that there were some cases where the background was incorrectly detected as a target, and the size of these backgrounds was usually different from the target. In this paper, we optimized the post-processing process by eliminating the detection frames that were inconsistent with the size range of the detection target. The details are shown in Section 3.3. (4) New detection method of overlap segmentation: When using the trained model to detect a whole UAV image, if a whole remote sensing image is evenly divided into small images directly, it may cause the problem of false alarm or missed detection. In this paper, we proposed a method of overlapping segmentation, removing the detection frame close to the edge, and then NMS. The details are shown in Section 3.4.

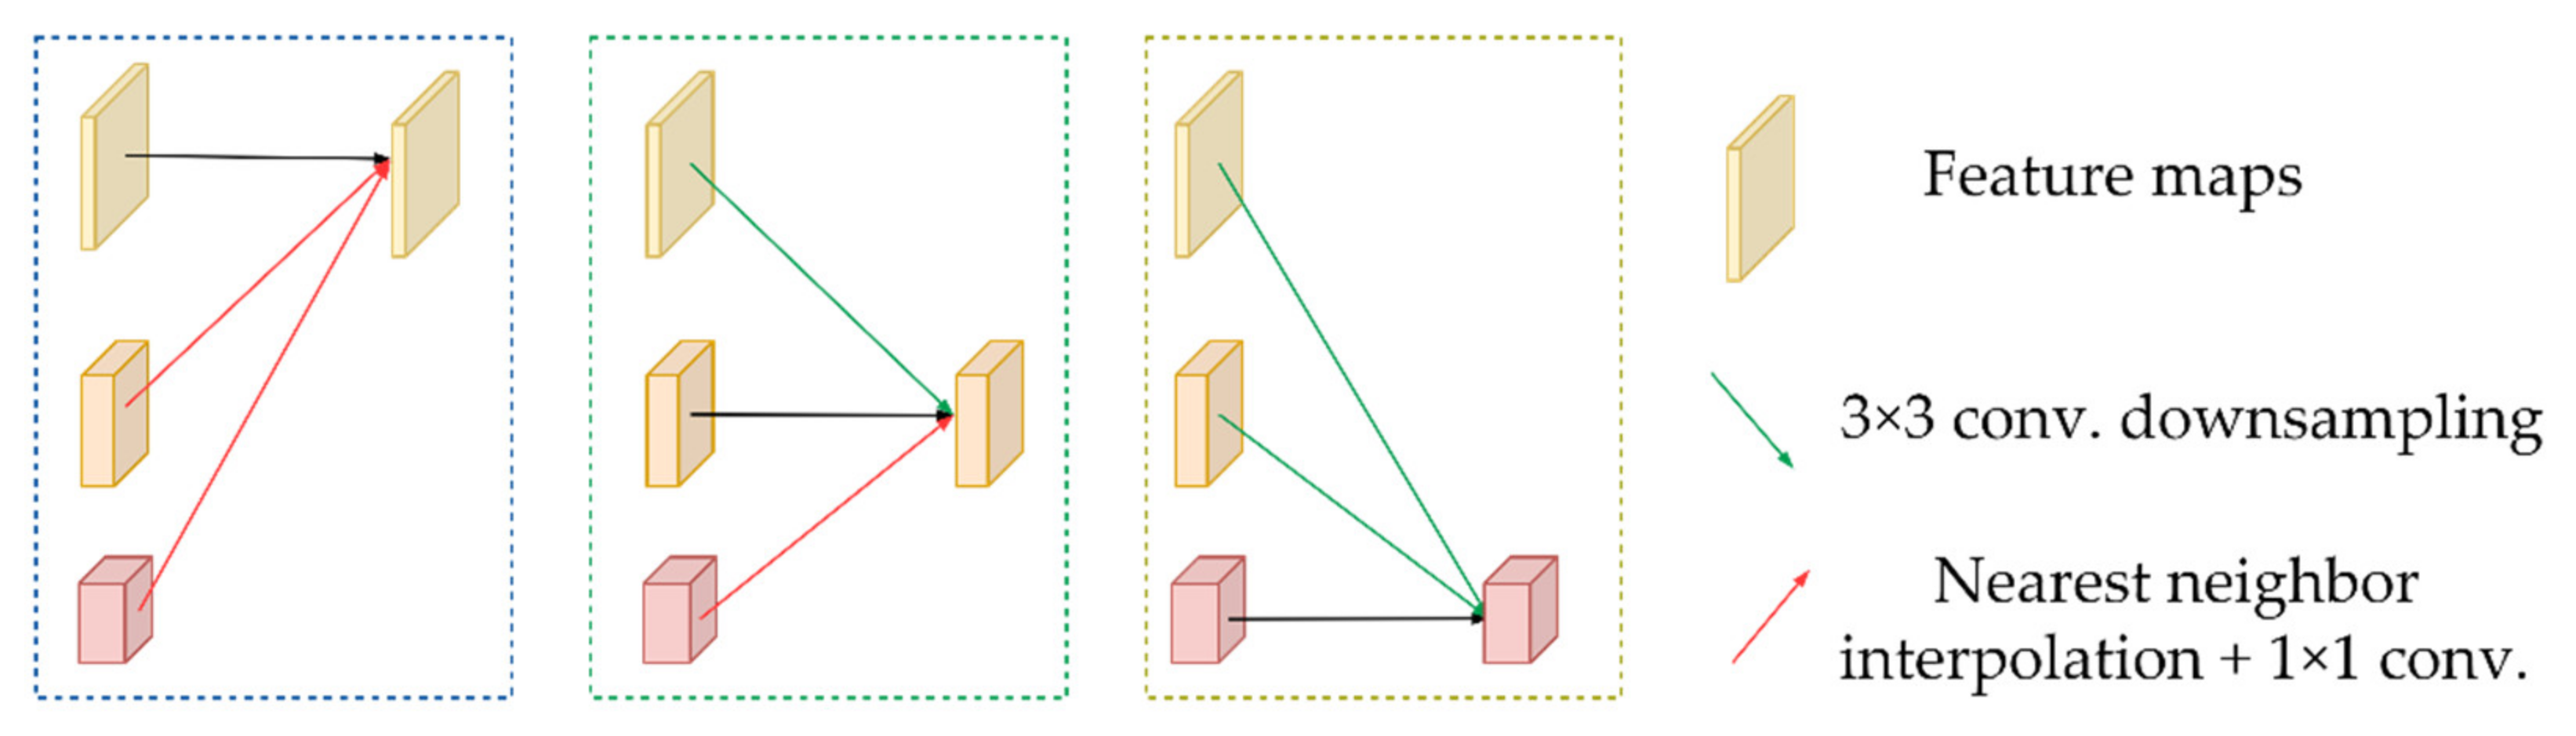
3.1. Replacing the Feature Extraction Network

The convolutional neural network near the input can extract the edges and corners, then the later convolutional neural network can extract the local details of the object, and the convolutional neural network near the output can extract the abstract object structure. The convolution layer usually contains five pooling layers to alleviate the problem of over fitting and reduce the amount of computation. Five down sampling will reduce the resolution of the feature map by 32 times. However, the length and width of the large herbivores to be detected only account for 5–50 pixels. After multiple instances of down sampling, the animals will disappear in the feature map or only have a very simple feature representation. Therefore, the conventional feature extraction network is not suitable for too-small targets.
In this paper, HRNet (High-Resolution Net) was used as the feature extraction network. HRNet was originally proposed by Sun K and used in human posture detection tasks [21]. It tends to generate high-resolution feature maps. Its advantage is that it not only maintains high-resolution feature maps, but also maintains the information interaction between different resolution feature maps in a unique parallel way. In this way, a high-quality feature map is generated, which not only covers the semantic information of feature maps at different levels, but also maintains the original resolution. The main structure of the network is shown in Figure 4. It can be seen from the figure that the network is divided into four stages, of which the third stage has three sizes of feature maps and the fourth stage has four sizes of feature maps. Each stage has a feature map of one size greater than the previous stage, and the feature maps of different levels repeatedly interact with each other in different stages. After reaching the last stage, there will be convolution streams with four resolutions. HRNetV1 only outputs the highest resolution feature map, which is often used for human posture estimation. Its output representation is shown in Figure 5a. HRNetV2 connects all low-resolution feature maps with the highest resolution feature map after up sampling, which is commonly used for semantic segmentation and face key point detection. Its output representation is shown in Figure 5b. HRNetV2p [28] is a new feature pyramid formed by down sampling the output representation of HRNetV2. It is predicted separately on each scale and is commonly used for target detection. Its output expression is shown in Figure 5c. In this paper, HRNetV2p was used as the feature extraction network, and the HRNet mentioned in this paper used as the feature extraction network refers to HRNetV2p. The down sampling shown in Figure 4 and Figure 5 was realized by many 3 × 3 convolution filters with stride 2, and the up sampling was realized by the nearest neighbor algorithm and 1 × 1 convolution, as shown in Figure 6.
As can be seen from Figure 4, Figure 5 and Figure 6, HRNet improves the resolution of feature maps and enriches the semantic information contained in feature maps by means of feature map fusion at different levels, which is similar to the idea of Feature Pyramid Networks (FPNs). FPNs [29] improve the detection effect of multi-scale targets by building feature pyramids and integrating feature maps of different levels, but HRNet was realized through a unique parallel mode. The high-resolution subnet of HRNet started as the first stage, gradually adding high-resolution to low-resolution subnets to form more stages and connecting the multi-resolution subnets in parallel. Through multiple multi-scale fusion, each high-resolution to low-resolution feature map repeatedly received information from other parallel representations so as to form rich high-resolution feature maps. Therefore, HRNet is more conducive for the detection of smaller targets. In this paper, HRNetV2p was used as the feature extraction network.

3.2. Optimizing the Region Proposal Network

The Region Proposal Network module of the original Faster-RCNN generates 9 anchor frames with 3 box areas of 1282, 2562, and 5122 pixels and 3 aspect ratios of 1:1, 1:2, and 2:1 at each position of the feature map [27]. We selected the correct detection boxes from these anchor frames and adjusted their position and size to finally complete the detection of the target. The size of large herbivores in the UAV images ranged from 5 pixels to 50 pixels. The anchor frame size generated by the original algorithm was not suitable for large herbivores. In this paper, the size of each training sample was calculated by reading the coordinates (xmin) and (ymin) in the lower left corner and (xmax) and (ymax) in the upper right corner of the target in the annotation file. Then, the K-means algorithm was used to cluster the sizes of all training samples to obtain the sizes of six clustering centers. The clustering results are shown in Figure 7, in which the abscissa is the height of the annotation box and the ordinate is the width of the annotation box.
The red pentagram is the final six cluster centers, with coordinates of [21.25, 16.27], [15.03, 20.54], [12.95, 12.38], [19.83, 26.99], [32.08, 32.08], and [26.72, 19.88]. The aspect ratios were 1.31, 0.73, 1.05, 0.96, 0.73, 1, and 1.39, respectively. It can be seen from the results of K-means clustering on the size of large herbivores that the aspect ratio was roughly clustered around 0.73, 1, and 1.35. We set the scale of detection frame to 0.75, 1.0, and 1.35 and set the basic size of anchor frame to 4 and the step sizes to 4, 8, 16, 32, and 64, so that the algorithm generated 15 anchor frames at each position on the feature map generated by HRNet.

3.3. Post-Processing Optimization

In the classification and regression phase of the original Faster-RCNN algorithm, after the detection frames were generated, the detection frames needed to be filtered again to eliminate some wrong detection frames. By observing the detection results, it was found that no matter whether the feature extraction network was replaced or the anchor frame size was modified, there were false detections in the detection results where snow was recognized as Tibetan sheep, rock, or shadow or where other backgrounds were recognized as Tibetan wild donkeys. Additionally, the size of these false detected backgrounds was usually inconsistent with the target. As shown in Figure 8, too-small and too-large detection frames were usually formed by the false detection of some confusing backgrounds. After screening, the detection accuracy could be improved. Therefore, we optimized the post-processing stage. With the help of python, we calculated that the size range of the target was between 5 pixels and 50 pixels. So, we eliminated the detection frames with a score of less than 0.5 and the detection frames with lengths or widths less than 3 pixels and lengths or widths greater than 55 pixels at the same time, so as to reduce the number of false alarms during detection. After screening, the detection accuracy could be improved.

3.4. New Detection Method of Overlap Segmentation

As the whole UAV image was too large, its size did not match the size required by the model. During training, we divided the image equally for training. When using the model to detect the whole UAV image, it was also necessary to divide the image into small blocks. After the detection frames of each block were obtained, these detection frames were mapped to the original image. The method of bisection segmentation was usually used for detection, but if a whole remote sensing image was evenly divided into small images for detection, this may cause the problem of false alarms or missed detection. As shown in Figure 9, if a yak is divided into two halves in the segmentation, both parts of the body may be detected or not detected, resulting in false alarms or missed detection.
Aiming at the problem of the detection method of bisection segmentation causing false alarms or missed detection, Adam van Etten proposed overlapping segmentation when improving the YOLO algorithm for satellite image detection [30]. Large-scale remote sensing images were overlapped and segmented, and then the NMS algorithm was used to eliminate the detection frame of repeated detection of a target. However, in some cases, this method would still detect a target repeatedly. As shown in Figure 10, a yak cut into a small half was detected in the upper right corner of the left figure, and the whole yak was detected in the right figure. It can be seen from the figure that the intersection of the two frames was relatively small. The NMS algorithm cannot suppress the redundant detection frames in the left figure, resulting in the problem of the multiple detection of a single target.
In order to further reduce the incidence of false alarms and missed detection, we proposed a detection method of overlapping segmentation and then discarding the detection frame close to the edge. The slice size was 600 pixels high and 400 pixels wide. For two adjacent slices, we made them overlap 100 pixels. The naming method of the slice was: Upper left row coordinates_Upper left column coordinates_Slice height_Slice width.jpg. For example, 1000_1800_600_400.jpg means that the slice is located in the third row and seventh column of the original image, and the slice size was 600 × 400 pixels. After each slice was detected, the detection frame within 50 pixels of the edge of each slice was discarded first, meaning that there will be no false alarm caused by a target being cut in half that cannot be filtered out by NMS. As shown in Figure 11, the detection frame with the center point in the orange area was directly eliminated. However, if the detection frame within 50 pixels of the edge of all slices was directly screened out, the detection frame of the edge of the original UAV image would also be removed. In order to avoid this situation, the edge detection frame was retained according to the slice name. For example, if the row coordinate of the upper left corner was 0 and the column coordinate of the upper left corner was 0, all detection frames with a center row coordinate between 0 and 350 pixels and a column coordinate between 0 and 550 pixels would be retained. Then, the position of the detection frame in the original image was obtained according to the slice name, and then the target detection frame of the original UAV image was obtained and mapped to the original image after NMS for all the detection frames.

4. Experimental Verification and Analysis

4.1. Experimental Configuration

All experiments described in this paper were carried out on the Linux platform, using the Ubuntu 20.04 system. The computer was configured as RTX3080, the V2 version of the MMdetection toolbox was used, and the programming language used was python. Data clipping, data enhancement, K-means clustering, size statistics of large herbivores, the elimination of detection frames that do not meet the range, the elimination of detection frames with the center within 50 pixels of the edge after overlapping segmentation, and NMS were all realized using python. The optimizer selected was SGD (Stochastic Gradient Descent). By default, the Faster-RCNN algorithm in the MMdetection toolbox uses eight GPUs, where each GPU processes two pictures, and the learning rate is 0.02. In this paper, two GPUs were used, each GPU processed two pictures, and the corresponding setting of the learning rate was 0.005. In total, 24 epochs were trained. The learning rate increased linearly in the first 500 iterations, the learning rate reduced at 18 to 22 epochs, and the momentum was set to 0.9. The weight attenuation was generally two to three orders of magnitude different from the learning rate. In this paper, the weight attenuation was set to 0.0001 [31]. After the image input, the size of the resize was set to 600 × 400—that is, the size of the input image was not changed.

4.2. Experimental Design and Evaluation Index

In order to verify the effectiveness of several improved methods used in this paper for the detection of large herbivores in UAV images, we designed four groups of experiments. In experiment 1, VGG16, ResNet50, ResNet101, and HRNet were, respectively, used as feature extraction networks for model training in the framework of Faster-RCNN so as to verify the impact of different feature extraction networks on the model training accuracy and the superiority of HRNet as the feature extraction network in small-target detection. In experiment 2, the Faster-RCNN algorithm was used as the framework, and HRNet was used as the feature extraction network. Different anchor frame sizes and proportions were used to train the model and the effect of modifying the anchor frame size according to the K-means clustering results was compared and verified. In experiment 3, Faster-RCNN was used as the framework and HRNet was used as the feature extraction network. NMS was used to eliminate detection frames that did not meet the scope under the conditions of modifying the anchor frame size and not modifying the anchor frame size in order to verify the impact of post-processing optimization on the experimental effect. In experiment 4, the whole UAV image was detected using bisection segmentation, original overlap segmentation, and the new overlap segmentation method proposed in this paper, and the experimental results were compared and analyzed.
The commonly used evaluation indicators for target detection are precision and recall. Precision refers to the proportion of the number of correct targets in the detection results, as shown in Formula (1). The recall rate refers to the proportion of the number of correct test results in the total number of targets to be tested, as shown in Formula (2) [32].
Precision                 P = T P T P + F P
Recall                 R = T P T P + F N
In this paper, TP represents the number of large herbivores that were correctly detected, FP represents the number of large herbivores that were incorrectly detected, and FN represents the number of large herbivores that were not detected. However, the precision and recall are in conflict under certain circumstances. This paper used each category of AP (average precision), the whole category of AR (average recall), and mAP (mean average precision) as evaluation indicators [33]. AP is the area under the curve of the precision–recall curve, AR is the maximum recall of a given number of detection results per image, and mAP is the average of all categories of AP.
When evaluating the accuracy of a target detection algorithm, different IoU values are usually selected to judge the correctness of the detection frame predicted by the algorithm. IoU represents the intersection and union ratio between the detection frame predicted by the algorithm and the ground truth, as shown in Formula (3).
IoU = a r e a   B o p     B g t a r e a   B o p     B g t
where Bop represents the prediction box, Bgt represents the ground truth, area (Bop ∩ Bgt) represents the intersection of the prediction box and the ground truth, and area (Bop ∪ Bgt) represents the union of the prediction box and the ground truth. The higher the IoU value is, the more accurate the detected box will be and the smaller the difference between the box and the ground truth will be. In this paper, PR curves constructed under different IoU values were compared. Finally, a threshold with an IoU of 0.5 was selected. If the IoU between the detection frame and the ground truth was greater than 0.5, the detection frame was considered to be the correct prediction frame.

4.3. Comparative Experimental Results and Analysis of Improved Faster-RCNN Algorithm

4.3.1. Experimental Results and Analysis of the Original Faster-RCNN Algorithm Using Different Feature Extraction Networks

A feature extraction network is used to extract or sort out effective features for subsequent use and plays an important role in the accuracy of a model. In order to verify the impact of different feature extraction networks on the accuracy of the model: we used the MMdetection toolbox; took Faster-RCNN as the framework; and used VGG16, ResNet50, ResNet101, and HRNet as the feature extraction networks, respectively, to train the model. The precision–recall curves (PR curve) of the four feature extraction network experiments are shown in Figure 12.
From the PR curves of the four feature extraction network experiments, it can be seen that, when taking the same IoU, the accuracy and recall rate of the HRNet feature extraction network were generally higher than those of the VGG16 feature extraction network, the ResNet50 feature extraction network, and the ResNet101 feature extraction network. The precision and recall of the four feature extraction networks were the highest when IOU was 0.5. The category AP, full category AR, and mAP of the four feature extraction networks when IoU was 0.5 are shown in Table 1.
By comparing the results of the four feature extraction networks, it was found that: the VGG16 network used by the original Faster-RCNN had a low accuracy; ResNet50, ResNet101, and HRNet had higher accuracies than VGG16; and the AP and AR of ResNet101 were slightly higher than those of ResNet50. It was found that the overall accuracy of HRNet was higher than that of VGG16, ResNet50, and ResNet101. The VGG network and ResNet performed five down sampling operations on the feature map when extracting features, which seriously affected the detection accuracy of the algorithm for small targets and overlapping targets [34], whereas HRNet realized the efficient detection of small targets and overlapping targets by generating a high-resolution feature map with a large amount of semantic information so as to achieve a high accuracy.

4.3.2. Experimental Results and Analysis of Optimizing Region Proposal Network

In the RPN module of the original Faster-RCNN algorithm, the anchor frame size was preset. In this paper, the objects needing to be detected were all small targets, so the original size and proportions were not necessarily suitable for the data set used in this paper. Therefore, in this paper we used K-means clustering to obtain the anchor frame size matching the detection target. To verify whether modifying the anchor frame size according to the results of K-means clustering can improve the experimental accuracy, we selected HRNet as the feature extraction network and set different anchor frame sizes according to the results obtained in Section 3.3. We set the anchor frame sizes to 8 and 4 and the anchor frame ratios to 0.5, 1.0, 2.0, and 0.75, 1.0, 1.35, respectively. The strides used in the four groups were 4, 8, 16, 32, and 64, and the PR curves of the four groups are shown in Figure 13.
It can be seen from the PR curves of the four groups of experiments that the precision and recall of the model were improved no matter whether the size or proportions of the anchor frame were modified. When the size and proportions of the anchor frame were modified at the same time, the precision and recall of the model were the highest, whereas the precision and recall of the four groups of experiments were the highest when the IoU was 0.5. The AP of each category and the AR and mAP of all categories in the four groups of experiments when IoU was 0.5 are shown in Table 2.
It can be seen from the experimental results that modifying the size and proportions of the anchor frame can improve the experimental accuracy. By modifying the size of the anchor frame, mAP was increased by 0.012; by modifying the proportions of the anchor frame, mAP was increased by 0.035; and by modifying the size and proportions of the anchor frame at the same time, mAP was increased by 0.037.

4.3.3. Test Results and Analysis of Post-Processing Optimization

After the algorithm generates the predicted detection frames through classification and regression, it is necessary to filter the detection frames and eliminate some wrong detection frames. The original Faster-RCNN algorithm will eliminate the detection frames with scores of less than 0.5. In the UAV images used in this paper, the size of large herbivores was between 5 pixels and 50 pixels, and the detection frames with too small or large lengths or widths generally presented a confusing background. Therefore, on the basis of eliminating the detection frames with scores of less than 0.5, we also eliminated detection frames with lengths or widths less than 3 pixels or with lengths or widths greater than 55 pixels. As for whether using NMS to eliminate anchor frames that do not fall within the range can improve the experimental accuracy, we used the HRNet feature extraction network to perform four groups of experiments under the conditions of modifying the anchor frame size and not modifying the anchor frame size. The PR curves of the four groups of experiments are shown in Figure 14.
From the PR curves of the four groups of experiments, it can be seen that the experimental accuracy can be improved by using NMS to eliminate detection frames that do not fall within the range, whether or not the anchor frame size was modified. The experimental accuracy of the four groups of experiments was the highest when IoU was 0.5. The AP of each category and the AR and mAP of all categories in the four groups of experiments when IoU was 0.5 are shown in Table 3.
It can be seen from the experimental results that whether the anchor frame size was the original size or the modified size, using NMS to eliminate the detection frames that did not fall within the range can improve the experimental accuracy. Among these, when the size and proportions of the anchor frames were modified at the same time and NMS was used to eliminate the detection frames that did not fall within the scope, the detection effect was the best. The mAP was 0.041 higher than that achieved before the improvement, and the APs of yaks, Tibetan wild donkeys, and Tibetan sheep were also improved.

4.3.4. Experimental Results and Analysis of Different Segmentation Methods

When training the model, we divided the image equally. When using the model to detect the whole UAV image, we also needed to divide the image into small blocks, and map back to the original image after obtaining the detection frames of each block. In order to verify the effectiveness of the proposed new overlapping segmentation method, we used the best model trained by modifying the size and proportions of the anchor frame and used NMS to eliminate the detection frames that did not fall within the range to detect the whole UAV image. The bisection segmentation, the original overlapping segmentation, and the overlapping segmentation method proposed in this paper were used to test the image. Figure 15 shows the result of detection conducted using bisection segmentation, Figure 16 shows the result of detection conducted using the original overlapping segmentation method, and Figure 17 shows the result of detection conducted using the new overlapping segmentation method.
It can be seen that after the image was detected by bisection segmentation, there were a large number of cases where the detection frame did not fit the target because the animal was divided into two halves, and there were also cases where the same target was detected twice. Using the original overlap segmentation method for detection reduced the incidence of situations where the detection frame did not fit the target and false alarm, but there were still cases where the target was detected twice because the coincidence degree was not high and it could not be suppressed by NMS, as shown in Figure 16. The overlapping segmentation detection method proposed in this paper can completely avoid the false alarms and missed detection events caused by the segmentation of animals, and it can prevent cases where the detection frame does not fit the target. In the detection result diagram obtained using the new overlap detection method, except that two backgrounds were mistakenly detected as yaks and one background was mistakenly detected as Tibetan sheep, the remaining large herbivores were correctly detected.

5. Conclusions

The size of UAV images is large and the proportion of large herbivores is very small. The current mainstream target detection algorithms cannot be directly used to identify large herbivores in UAV images. With the help of the MMdetection toolbox, after comparing different feature extraction networks, we selected HRNet, which has excellent performance in small- and medium-sized target detection, as the feature extraction network. Then we set a suitable anchor frame size and proportions for large herbivores according to the results of K-means clustering, and used NMS to eliminate the detection frames that did not fall within the range to improve the Faster-RCNN algorithm. The following conclusions were drawn:
(1)
Compared with the VGG16 network, ResNet50 network, and ResNet101 network, it was proven that the HRNet feature extraction network is more suitable for the detection of large herbivores in UAV images.
(2)
According to the results of K-means clustering, the size and proportions of the anchor frame were adjusted. AR was increased by 0.038 and mAP was increased by 0.037. This shows that setting sizes and proportions of anchor frames that are suitable for the target according to the results of K-means clustering can improve the accuracy.
(3)
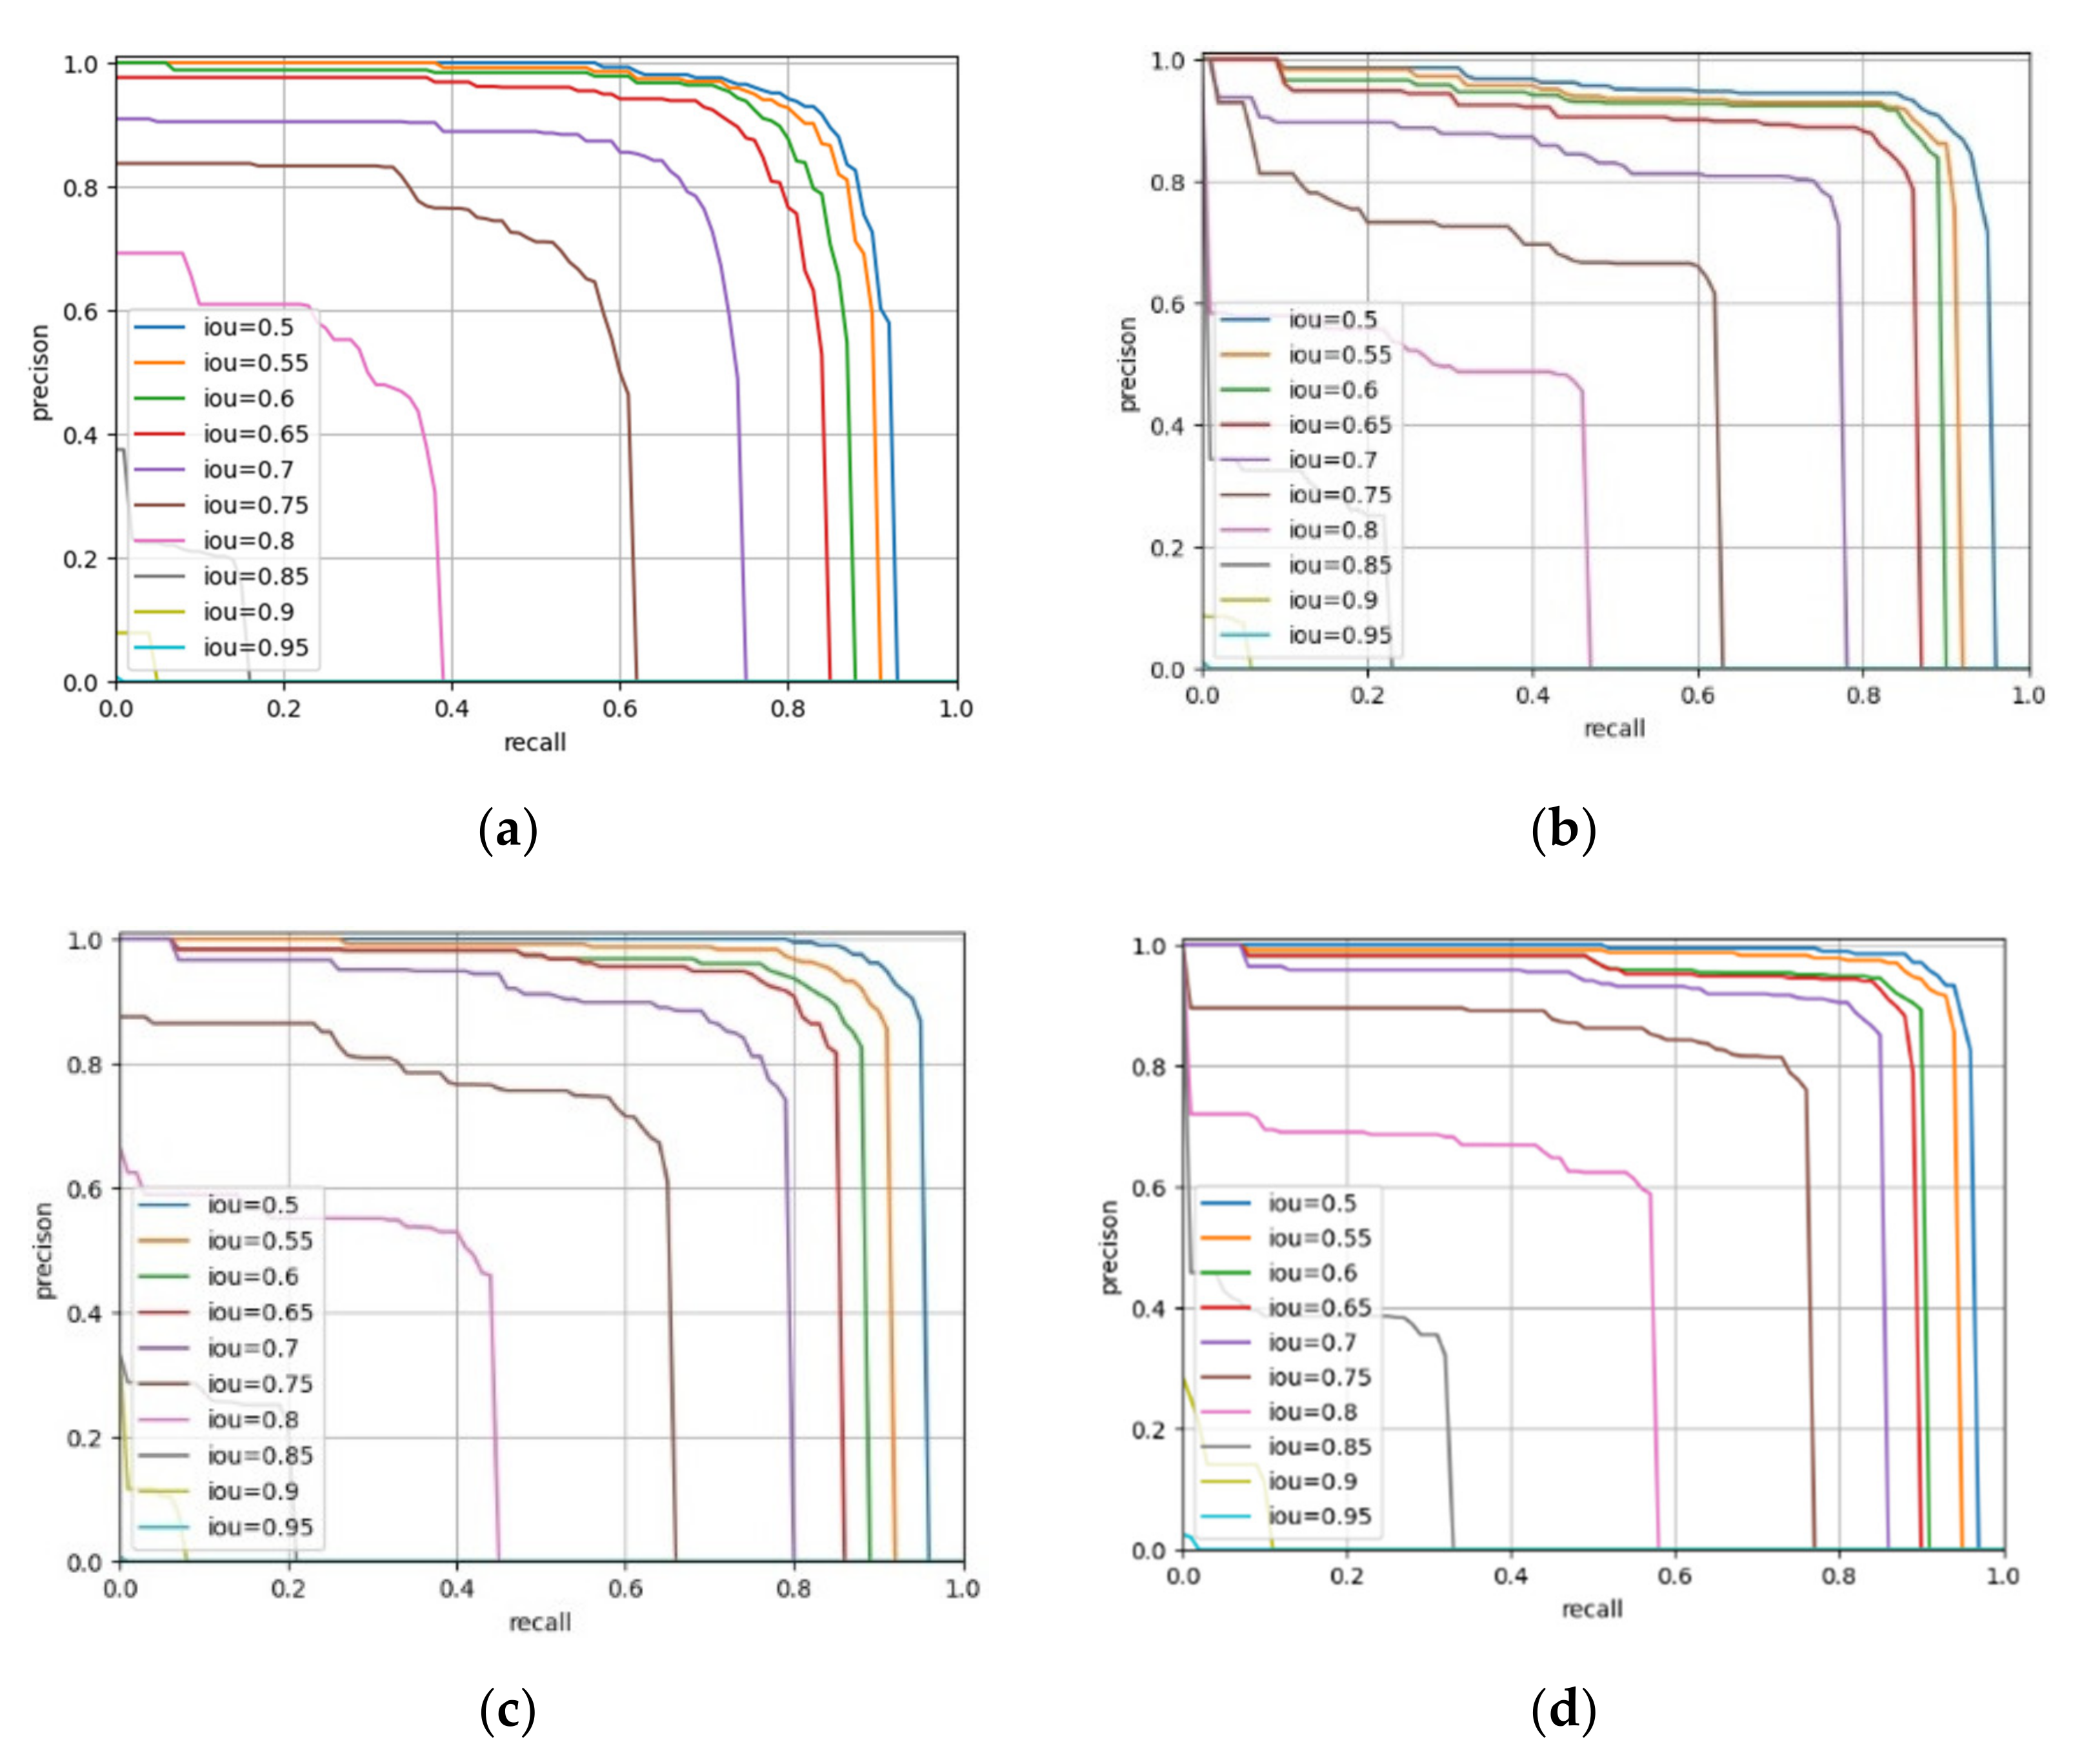
Using the results of K-means clustering to adjust the size and proportions of anchor frames and using NMS to eliminate the detection frames that did not fall within the range at the same time, the AP of yaks, Tibetan wild donkeys, and Tibetan sheep reached 0.971, 0.978, and 0.967, respectively, values which were 0.019, 0.005, and 0.099 higher than those obtained before the two improvements, whereas the mAP reached a value that was 0.972, and 0.041 higher than that obtained before the two improvements.
(4)
We used the detection method of overlapping segmentation first, removing the detection frame within 50 pixels of the edge, and then NMS could realize the high-precision detection of the whole UAV image, and there were no cases where the detection frame did not fit the target or where false alarms or missed detection were caused by the animals being divided into two halves.
In this paper, after using the improved Faster-RCNN algorithm, the mean average precision (mAP) and average recall (AR) were improved to varying degrees. Several optimized methods used in this paper can be used to detect small targets in other large-scale images. The optimized model reached a high level of precision and could be used to: more accurately count the number of large herbivores; estimate the proportions of wild herbivores and farm livestock; and further provide a scientific basis for maintaining the balance between grass and livestock, including wild animals and farm livestock. However, the anchor frame size designed according to this data set may not be suitable for use in other data sets. Then, we can further optimize the algorithm by adaptively calculating the K-means clustering results according to the data set to modify the anchor box size, and adaptively calculate the size range of the ground truth frames, and eliminate too-large and too-small detection frames. In addition, this method can be applied to more complex scenes, such as UAV images in different phases, more target types, and more easily confused distractors, in order to check the generalization ability of the scheme.

Author Contributions

Conceptualization, Z.H.; methodology, Z.H. and J.M.; validation, J.M., Y.Z. and Y.W.; formal analysis, Z.H.; resources, Q.S. and S.L.; data curation, J.M. and S.L.; writing—original draft preparation, J.M.; writing—review and editing, Z.H., Y.Z. and Y.W.; visualization, J.M.; supervision, J.L.; project administration, Z.H.; funding acquisition, Z.H. and Q.S. All authors have read and agreed to the published version of the manuscript.

Funding

This research was financially supported by the National Natural Science Foundation of China (No. 42071289) and the National Key Research and Development Program of China (grant no. 2018YFC1508902).

Institutional Review Board Statement

Ethical review and approval were waived for this study due to the UAV aerial photography taking place at an altitude of 200 to 350 m, meaning that it was far from the ground, with low noise, causing little or no interference to wildlife, and with none of the personnel involved in the aerial photography having direct contact with animals. We guarantee that the aerial photography was conducted under the guidance of relevant regulations, such as the “technical regulations for the second national terrestrial wildlife resources investigation” and “technical specifications for national terrestrial wildlife resources investigation and monitoring” of the State Forestry Administration.

Informed Consent Statement

Not applicable.

Data Availability Statement

Data are available from the corresponding authors upon request, because the data is provided by the Shao Quanqin research group of the Institute of Key Laboratory of Terrestrial Surface Pattern and Simulation, Institute of Geographic Sciences and Natural Resources Research, Chinese Academy of Sciences, and the data provider does not want the data to be made public.

Acknowledgments

We would like to thank the Shao Quanqin research group of the Institute of Key Laboratory of Terrestrial Surface Pattern and Simulation, Institute of Geographic Sciences and Natural Resources Research, Chinese Academy of Sciences, for obtaining and providing the UAV remote sensing image data.

Conflicts of Interest

The authors declare no conflict of interest. The funders had no role in the design of the study; in the collection, analysis, or interpretation of data; in the writing of the manuscript; or in the decision to publish the results.

References

  1. Song, Q.J. Unmanned Aircraft System for Surveying Large Herbivores—A Case Study in Longbao Wetland National Nature Reserve, Qinghai Province, China. Master’s Thesis, Lanzhou University, Lanzhou, China, 26 May 2018. [Google Scholar]
  2. Lu, W.J. Mechanisms of Carbon Transformation in Grassland Ecosystems Affected by Grazing. Master’s Thesis, China Agricultural University, Beijing, China, 4 December 2017. [Google Scholar]
  3. Zhang, S.; Shao, Q.Q.; Liu, J.Y.; Xu, X.L. Grassland Cover Change near the Source of the Yellow River: Case Study of Madoi County, Qinghai Province. Resour. Sci. 2008, 30, 1547–1554. [Google Scholar]
  4. Liu, J.Y.; Xu, X.L.; Shao, Q.Q. Grassland degradation in the “Three-River Headwaters” region, Qinghai Province. J. Geogr. Sci. 2008, 18, 259–273. [Google Scholar] [CrossRef]
  5. Yang, F.; Shao, Q.Q.; Guo, X.J.; Li, Y.Z.; Wang, D.L.; Zhang, Y.X.; Wang, Y.C.; Liu, J.Y.; Fan, J.W. Effects of wild large herbivore populations on the grassland-livestock balance in Maduo County. Acta Prataculturae Sin. 2018, 27, 1–13. [Google Scholar]
  6. Luo, W.; Shao, Q.Q.; Wang, D.L.; Wang, Y.C. An Object-Oriented Classification Method for Detection of Large Wild Herbivores: A Case Study in the Source Region of Three Rivers in Qinghai. Chin. J. Wildl. 2017, 38, 561–564. [Google Scholar]
  7. Wang, N.; Li, Z.; Liang, X.L.; Wu, X.N.; Lü, Z.H. Research on Application of UAV Autonomous Target Recognition and Positioning. Comput. Meas. Control 2021, 29, 215–219. [Google Scholar]
  8. Shi, L.; Jing, M.E.; Fan, Y.B.; Zeng, X.Y. Segmentation Detection Algorithm Based on R-CNN Algorithm. J. Fudan Univ. Nat. Sci. 2020, 59, 412–418. [Google Scholar]
  9. Ren, S.Q.; He, K.M.; Girshick, R.B.; Sun, J. Faster R-CNN: Towards Real-Time Object Detection with Region Proposal Networks. IEEE Trans. Pattern Anal. Mach. Intell. 2017, 39, 1137–1149. [Google Scholar] [CrossRef] [PubMed]
  10. Dai, J.F.; Yi, L.; He, K.M.; Sun, J. R-FCN: Object Detection via Region-based Fully Convolutional Networks. In Proceedings of the Thirtieth Conference on Neural Information Processing Systems, Centre Convencions Internacional Barcelona, Barcelona, Spain, 5 December 2016. [Google Scholar]
  11. Liu, W.; Anguelov, D.; Erhan, D.; Szegedy, C.; Reed, S.E.; Fu, C.Y.; Berg, A.C. SSD: Single Shot MultiBox Detector. IEICE Trans. Fundam. Electron. Commun. Comput. Sci. 2015, 9905, 21–37. [Google Scholar]
  12. Redmon, J.; Divvala, S.K.; Girshick, R.; Farhadi, A. You Only Look Once: Unified, Real-Time Object Detection. In Proceedings of the IEEE Conference on Computer Vision and Pattern Recognition, Las Vegas, NV, USA, 12 December 2016. [Google Scholar]
  13. Peng, H.; Li, X.M. Small target detection model based on improved Faster R-CNN. Electron. Meas. Technol. 2021, 44, 122–127. [Google Scholar]
  14. Lecun, Y.; Bottou, L. Gradient-based learning applied to document recognition. Proc. IEEE 1998, 86, 2278–2324. [Google Scholar] [CrossRef]
  15. Krizhevsky, A.; Sutskever, I.; Hinton, G. ImageNet Classification with Deep Convolutional Neural Networks. In Proceedings of the 26th Annual Conference on Neural Information Processing Systems 2012, Lake Tahoe, NV, USA, 3–6 December 2012. [Google Scholar]
  16. Simonyan, K.; Zisserman, A. Very deep convolutional networks for large-scale image recognition. Comput. Sci. Name 2014, arXiv:1409.1556. [Google Scholar]
  17. He, K.M.; Zhang, X.Y.; Ren, S.Q.; Sun, J. Deep Residual Learning for Image Recognition. In Proceedings of the IEEE Conference on Computer Vision and Pattern Recognition (CVPR), Las Vegas, NV, USA, 10 April 2016. [Google Scholar]
  18. Szegedy, C.; Liu, W.; Jia, Y.Q.; Reed, S.; Anguelov, D.; Erhan, D.; Vanhoucke, V.; Sermanet, P.; Rabinovich, A. Going Deeper with Convolutions. In Proceedings of the IEEE Conference on Computer Vision and Pattern Recognition (CVPR), Boston, MA, USA, 7–12 June 2015. [Google Scholar]
  19. Xie, S.N.; Girshick, R.; Dollar, P.; Tu, Z.W.; He, K.M. Aggregated Residual Transformations for Deep Neural Networks. In Proceedings of the IEEE Conference on Computer Vision and Pattern Recognition (CVPR), Honolulu, HI, USA, 25 July 2017. [Google Scholar]
  20. Hu, J.; Shen, L.; Sun, G. Squeeze-and-Excitation Networks. In Proceedings of the IEEE Conference on Computer Vision and Pattern Recognition (CVPR), Salt Lake City, UT, USA, 21 June 2018. [Google Scholar]
  21. Sun, K.; Xiao, B.; Liu, D.; Wang, J.D. Deep High-Resolution Representation Learning for Human Pose Estimation. In Proceedings of the IEEE/CVF Conference on Computer Vision and Pattern Recognition, Long Beach, CA, USA, 19 June 2019. [Google Scholar]
  22. Zhang, S. Analysis of Land Use/Cover Change and Driving Forces in Maduo County, the Source Region of the Yellow River. Master’s Thesis, Institute of Geographic Sciences and Natural Resources Research, CAS, Beijing, China, 6 July 2007. [Google Scholar]
  23. Shao, Q.Q.; Guo, X.J.; Li, Y.Z.; Wang, Y.C.; Wang, D.L.; Liu, J.Y.; Fan, J.W.; Yang, J.W. Using UAV remote sensing to analyze the population and distribution of large wild herbivores. J. Remote Sens. 2018, 22, 497–507. [Google Scholar]
  24. Xie, X.H.; Lu, J.B.; Li, W.T.; Liu, C.X.; Huang, H.M. Classification Model of Clothing Image Based on Migration Learning. Comput. Appl. Softw. 2020, 37, 88–93. [Google Scholar]
  25. Huang, Y.X.; Fang, L.M.; Huang, S.Q.; Gao, H.L.; Yang, L.B.; Lou, S.X. Research on Crown Extraction Based on lmproved Faster R-CNN Model. For. Resour. Manag. 2021, 1, 173–179. [Google Scholar]
  26. Cheng, Z.A. Automatic Recognition of Terrestrial Wildlife in Inner Mongolia based on Deep Convolution Neural Network. Master’s Thesis, Beijing Forestry University, Beijing, China, 12 June 2019. [Google Scholar]
  27. Chen, X.E.; Li, H.M.; Chen, D.T. Research and Implementation of Dish Recognition Based on Convolutional Neural Network. Mod. Comput. 2021, 27, 95–98. [Google Scholar]
  28. Sun, K.; Zhao, Y.; Jiang, B.; Cheng, T.H.; Xiao, B.; Liu, D.; Mu, Y.D.; Wang, X.G.; Liu, W.Y.; Wang, J.D. High-Resolution Representations for Labeling Pixels and Regions. arXiv 2019, arXiv:1904.04514. [Google Scholar]
  29. Lin, T.Y.; Dollar, P.; Girshick, R.; He, K.M.; Hariharan, B.; Belongie, S. Feature pyramid networks for object detection. In Proceedings of the IEEE Conference on Computer Vision and Pattern Recognition (CVPR), Honolulu, HI, USA, 9 November 2017. [Google Scholar]
  30. Van Etten, A. You Only Look Twice: Rapid Multi-Scale Object Detection In Satellite Imagery. arXiv 2018, arXiv:1805.09512. [Google Scholar]
  31. Tan, T. The Optimization Algorithm Research of Stochastic Gradient Descent Based on Convolutional Neural Network. Master’s Thesis, Southwest University, Chongqing, China, 18 April 2020. [Google Scholar]
  32. Wang, J.; Zhang, D.Y.; Kang, X.Y. Improved Detection Method of Low Altitude Small UAV by Faster-RCNN. J. Shenyang Ligong Univ. 2021, 40, 23–28. [Google Scholar]
  33. Long, J.H.; Guo, W.Z.; Lin, S.; Wen, C.W.; Zhang, Y.; Zhao, C.J. Strawberry Growth Period Recognition Method Under Greenhouse Environment Based on Improved YOLOv4. Smart Agric. 2021, 3, 99–110. [Google Scholar]
  34. Chen, Y.Z. Research on Object Detection algorithm Based on Feature fusion and Adaptive Anchor Framework. Master’s Thesis, Henan University, Kaifeng, China, 24 June 2020. [Google Scholar]
Figure 1. Figure of an electric fixed-wing UAV.
Diversity 14 00624 g001
Figure 2. Diagram of the training sample creation process (the boxes composed of green points and red lines are the ground truth frames of large herbivores we annotated).
Diversity 14 00624 g002
Figure 3. Flow chart of the Faster-RCNN algorithm.
Diversity 14 00624 g003
Figure 4. Schematic diagram of the HRNet network.
Diversity 14 00624 g004
Figure 5. Output representation of different versions of HRNet: (a) output representation of HRNetV1; (b) output representation of HRNetV2; (c) output representation of HRNetV2p.
Diversity 14 00624 g005
Figure 6. Up sampling and down sampling methods.
Diversity 14 00624 g006
Figure 7. Results of K-means clustering on the size of large herbivores.
Diversity 14 00624 g007
Figure 8. An example of where a detection frame obtained by mistakenly detecting snow as Tibetan sheep needs to be removed (the red boxes in the figure are the detection result boxes of the original Faster-RCNN model).
Diversity 14 00624 g008
Figure 9. Example diagram of bisection segmentation that may cause false detection or false alarms.
Diversity 14 00624 g009
Figure 10. Conventional overlap segmentation method (the green boxes in the figure are the detection result boxes of the original Faster-RCNN model using the original overlapping segmentation method).
Diversity 14 00624 g010
Figure 11. Overlapping segmentation method proposed in this paper (the green boxes in the figure are the detection result boxes of the original Faster-RCNN model using the original overlapping segmentation method).
Diversity 14 00624 g011
Figure 12. The PR curves of the original Faster-RCNN algorithm constructed using different feature extraction networks: (a) the PR curve of the VGG16 feature extraction network experiment; (b) the PR curve of the ResNet50 feature extraction network experiment; (c) the PR curve of the ResNet101 feature extraction network experiment; (d) the PR curve of the HRNet feature extraction network experiment.
Diversity 14 00624 g012
Figure 13. Modified anchor frame size experimental PR curves: (a) the PR curve of the experiment with anchor frame foundation size of 8, and proportions of 0.5, 1, and 2; (b) the PR curve of the experiment with anchor frame foundation size of 8, and proportions of 0.75, 1, and 1.35; (c) the PR curve of the experiment with anchor frame foundation size of 4, and proportions of 0.5, 1, and 2; (d) the PR curve of the experiment with anchor frame foundation size of 4, and proportions of 0.75, 1, and 1.35.
Diversity 14 00624 g013aDiversity 14 00624 g013b
Figure 14. The PR curves of the experiment of using NMS to eliminate the detection frames with sizes that did not meet the range: (a) the PR curve of the experiment performed without eliminating the non-conforming detection frame by NMS, with the anchor frame foundation size of 8 and proportions of 0.5, 1, 2; (b) the PR curve of the experiment performed eliminating the non-conforming detection frames by NMS, with the anchor frame foundation size of 8 and proportions of 0.5, 1, 2; (c) the PR curve of the experiment performed without eliminating the non-conforming detection frame by NMS, with the anchor frame foundation size of 4 and proportions of 0.75, 1, 1.35; (d) the PR curve of the experiment performed eliminating the non-conforming detection frames by NMS, with the anchor frame foundation size of 4 and proportions of 0.75, 1, 1.35.
Diversity 14 00624 g014
Figure 15. Result diagram of detection performed using bisection segmentation (the red boxes in the figure are the detection result boxes detected by the improved Faster-RCNN model using the bisection segmentation method).
Diversity 14 00624 g015
Figure 16. Result diagram of detection performed using original overlapping segmentation (the red boxes in the figure are the detection result boxes detected by the improved Faster-RCNN model using the original overlapping segmentation method).
Diversity 14 00624 g016
Figure 17. Result diagram of detection performed using new overlapping segmentation (the red boxes in the figure are the detection result boxes detected by the improved Faster-RCNN model using the new overlapping segmentation method proposed in this paper).
Diversity 14 00624 g017
Table 1. Experimental results of the original Faster-RCNN algorithm using different feature extraction networks when IoU was 0.5.
Feature Extraction NetworkAPARmAP
YakTibetan Wild AssTibetan Sheep
VGG160.8930.9030.7560.8870.851
ResNet500.9080.9510.8320.9210.897
ResNet1010.9440.960.8110.9250.905
HRNet0.9520.9730.8680.9420.931
Table 2. Test results before and after modifying the size and proportions of the anchor frame when IoU was 0.5.
Anchor Frame SizeAnchor Frame ScaleAPARmAP
YakTibetan Wild AssTibetan Sheep
80.5, 1.0, 2.00.9520.9730.8680.9420.931
80.75, 1.0, 1.350.9620.9660.9020.9470.943
40.5, 1.0, 2.00.9720.9770.9480.9740.966
40.75, 1.0, 1.350.9850.9630.9550.9800.968
Table 3. Test results before and after using NMS to eliminate the detection frames that did not fall within the scope when IoU was 0.5.
NMSAnchor Frame SizeAnchor Frame ScaleAPARmAP
YakTibetan Wild AssTibetan Sheep
No80.5, 1.0, 2.00.9520.9730.8680.9420.931
Yes80.5, 1.0, 2.00.9640.9620.9020.9580.942
No40.7, 1.0, 1.350.9850.9630.9550.9800.968
Yes40.7, 1.0, 1.350.9710.9780.9670.9820.972
Publisher’s Note: MDPI stays neutral with regard to jurisdictional claims in published maps and institutional affiliations.

