Article

Evidence for Genetic Hybridization between Released and Wild Game Birds: Phylogeography and Genetic Structure of Chukar Partridge, Alectoris chukar, in Turkey

1
Department of Biology, Science and Art Faculty, Burdur Mehmet Akif Ersoy University, 15100 Burdur, Turkey
2
Instituto de Investigación en Recursos Cinegéticos IREC (CSIC-UCLM-JCCM), Ronda de Toledo s/n, 13071 Ciudad Real, Spain
3
Department of Pathology, Faculty of Veterinary Medicine, Burdur Mehmet Akif Ersoy University, İstiklal Yerleşkesi, 15030 Burdur, Turkey
4
Department of Animal Science, Faculty of Agriculture, University of Yüzüncü Yıl, 65080 Van, Turkey
5
Department of Biology, Science Faculty, Ege University, 35040 İzmir, Turkey
6
Institute of Pharmacy and Molecular Biotechnology, Heidelberg University, 69120 Heidelberg, Germany
*
Author to whom correspondence should be addressed.
Diversity 2022, 14(7), 571; https://doi.org/10.3390/d14070571
Submission received: 31 May 2022 / Revised: 14 July 2022 / Accepted: 15 July 2022 / Published: 17 July 2022
(This article belongs to the Section Biogeography and Macroecology)

Abstract

:
The Chukar Partridge (Alectoris chukar, Galliformes) is one of the most important game birds in its native range, spanning from the Balkans to eastern Asia, and the regions of Europe, North America and New Zealand where it was introduced. Previous studies found two main genetic lineages of the species forming an eastern and a western clade. Chukar Partridges are raised in game farms and released to supplement natural populations for shooting in the USA, Canada, Greece, and Turkey. To explore intraspecific genetic structure, phylogeography, and possible genetic admixture events of A. chukar in Turkey, we genotyped individuals from fourteen wild and five captive populations at two mitochondrial and ten microsatellite DNA loci in. Wild and farmed Chukar Partridge samples were analyzed together to investigate possible influences of intraspecific hybridizations. We found that the farmed chukars, which mainly (85%) cluster into the eastern clade, and wild ones were genetically distinct. The latter could be separated into six management units (MUs), with partridges from Gökçeada Island in the Aegean Sea forming the most divergent population. Intraspecific hybridization was detected between wild and captive populations. This phenomenon causes rampant introgression and homogenization. The phylogeographic analysis revealed admixture among wild populations; nevertheless, this did not impair pointing to Anatolia as likely having a “refugia-within-refugia” structure. We recommend that the genetic structure of Chukar Partridge and its MUs be taken into account when developing the policy of hunting, production, and release to preserve the genetic integrity of this species.

1. Introduction

Genetic diversity plays a crucial role in the adaptation and survival of species [1], while their phylogeographic structure reflects the complex relationships between historical and ongoing evolutionary processes in a spatial framework. Phylogeographic studies helped elucidate gene flow patterns, hybridization, range expansion, and speciation among many bird species [2].
Climatic fluctuations have been occurring in the last three million years, alternating warm and cold periods in the Northern Hemisphere, especially in mountainous regions, influencing the current phylogeographic structure of resident species. During the Quaternary ice ages, substantial areas of northern Europe and the mountain ranges of southern Europe and Asia were covered by ice sheets. In this period, Iberia, Italy, the Balkans, and Anatolia subsequently acted as glacial refugia for different species [3]. Southern Anatolia was one of the most important unglaciated areas in the western Palearctic region during the Pleistocene [3,4]. During that period, several animal and plant populations remained isolated in different refugia, which changed the genetic structure of the species to which they belonged. High altitudinal differentiation and a wide range of climates and microclimates may have promoted three possible refugia within Anatolia located, respectively, along the coastline of the Mediterranean region from Antalya to Hatay, along the coastline of the Aegean region from İzmir to Çanakkale, and in mid-northern Anatolia [4]. Moreover, various phylogeographic studies provided evidence that local populations of mammals [5], birds [4,6,7], amphibians [8], and insects [9] display a high level of genetic differentiation as the likely outcome of different ecological and climatic conditions. Widespread resident species such as Alectoris spp. may have different genetic structure in Anatolia.
Seven Alectoris (Galliformes) species occur in the Palearctic [10]. Although they are mainly allopatric, natural hybridization in their contact zones has been described [11]. The Chukar Partridge, Alectoris chukar, which is represented in the ancient Roman and Hellenistic mosaics, is one of the world’s most important game birds. The native distribution range of this species extends from the Balkans to eastern Asia [12], with 14 morphological subspecies [13] clustering into two well-distinct genetic lineages forming an eastern and a western clade separated by mountain ranges from Altay to Himalayas [14,15]. Eastern clade chukars are also raised in farms for hunting and meat production [16,17]. Moreover, European game farms breed A. rufa x A. chukar [18,19,20] and A. graeca x A. chukar producing hybrids [11,21] that are released into the wild for shooting purposes with the aim of supplementing natural populations. This practice, however, is now illegal in most European countries. Almost 70,000 farm-reared Chukar Partridges are produced and released in Turkey yearly since 2001 (www.milliparklar.gov.tr/resmiistatistikler, accessed on 1 August 2021).
Similar to what happens with the common quail (Coturnix coturnix) [22] and the mallard (Anas platyrhynchos) [23] across Europe, the anthropogenic introgressive hybridization turns into the rampant genetic homogenization [11,19,24] of Alectoris partidges at both inter- and intraspecific level. We genotyped partridges of fourteen wild and five farm (captive) A.chukar populations from Turkey at two mitochondrial and ten microsatellites DNA loci to determine (i) the phylogeographic structure, (ii) whether wild and farmed chukars are genetically different, and (iii) whether signs of admixture between them occur.

2. Materials and Methods

2.1. Sample Collection and DNA Extraction

Muscle tissue samples were collected from wild and captive individuals (n = 362) sampled during the 2018–2019 hunting seasons in fourteen localities throughout Turkey and six breeding stations (Table 1). Captive adult individuals were randomly selected in each breeding station. The MAKU-HADYEK-169 protocol controlled all the experiments on Chukar Partridges by MAKU, Local Ethical Committee on Animal Experiments regulations. All samples were preserved at room temperature in absolute ethanol. Total DNA was extracted using GeneJET Genomic DNA Purification Kit (Thermo Fisher Scientific, Waltham, MA, USA) or Dneasy Blood & Tissue Kit (Qiagen, Hilden, Germany) following the manufacturer’s instructions.

2.2. DNA Amplification and Sequencing

The partial cytochrome-b (Cyt-b, 1092 bp) and the entire Control region (CR, about 1155 bp) of the mitochondrial DNA (mtDNA) were amplified for all samples following Barbanera et al. [14]. PCR products were purified and sequenced on both strands at Macrogen (Seoul, Korea). Sequences were aligned in GENEIOUS PRIME 2021.2.2 with the MUSCLE plugin and further proofed manually [25]. The sequences were deposited in GenBank with accession numbers MZ706294 to MZ706461. We added 86 partial Cyt-b and CR GenBank sequences of Chukar Partridge from Europe and Asia. The accession numbers of the outgroup Rock Partridge (Alectoris greaca) and GenBank sequences were given in the tree of Supplementary Material S1 (Table 1).
As far as the microsatellites are concerned, we selected the ten most polymorphic loci in A. chukar among 130 from an A. rufa genomic library: Aru1A, Aru1B3, Aru1E7, Aru1E93, Aru1E97, AruF25, AruF114, Aru1G4, Aru1G49 [26], plus one Aru2D020, used for the first time in this study (forward primer: CAACTACTTAACCTTTTCTCCTG; reverse primer: CACTTCATAGTACAGAAACATGG). The PCR conditions were as indicated in [27].

2.3. Phylogeographic Analysis

The Cyt-b and CR sequences were concatenated and aligned. The phylogenetic relationships were reconstructed in MEGA X [28] and BEAST 2 [29] using the Maximum Likelihood (ML) method. The TN93 + G + I algorithm was selected using MEGA X and following the Akaike Information Criterion (AIC). Initial tree(s) for the heuristic search were obtained automatically by applying Neighbor-Join and BioNJ algorithms to a matrix of pairwise distances estimated using the Tamura-Nei model and then selecting the topology with a superior log-likelihood value. There were a total of 2247 positions in the final dataset. Genetic differentiation among populations (FST) was evaluated by analyzing molecular variance (AMOVA) in ARLEQUIN 3.5 with significances assessed by 10,100 permutations [30] and a spatial analysis of molecular variance (SAMOVA) was performed using SAMOVA 1.0 [31]. This method is based on a simulated annealing procedure aimed at identifying geographically homogeneous populations and maximally differentiated in terms of among-group components (FCT) of the overall genetic variance without the prior assumption of group composition AMOVA relies on. The program was run for 10,000 iterations from each of 100 random initial conditions and tested all the grouping options (predefined number of groups K ranging from 2 to 18). The optimal number of groups (K): FCT values (proportion of genetic variation among groups) reached a maximum, or a plateau was selected. A median-joining network was created to visualize haplotype relationships using Network 10 [32]. Haplotypes and mismatch distributions of demographic/population expansion were defined by DnaSP 6 [33] and the number of polymorphic sites (S), haplotype diversity (Hd), nucleotide diversity (π), average number of nucleotide differences (K), and number of haplotypes (h) were calculated using DnaSP or ARLEQUIN for the mtDNA dataset.
Microsatellites: Departure from Hardy-Weinberg equilibrium (HWE) and linkage disequilibrium were calculated for each microsatellite locus and population with an exact test using GENEPOP 4.7.5 [34]. The mean number of alleles (A), observed (HO), expected (HE) heterozygosity, and FST distances were calculated using ARLEQUIN [30].
We used the Bayesian clustering method implemented in STRUCTURE 2.3.4 [35] to infer the population structure. Ten independent runs with K = 1–10, where K is the different number of subpopulations, were used with an admixture model taking sampling locations as priors and correlated allele frequencies between populations. Throughout the analysis, the burn-in period was fixed at 50,000, and the number of MCMC runs at 20,000. Besides, SAMOVA was performed to identify groups using SAMOVA [31]. The most likely number of groups was determined by 100 repeatedly running with two to 10 groups and choosing those partitions with a maximum FCT value and STRUCTURE HARVESTER [36] according to the method of Evanno et al. [37].

3. Results

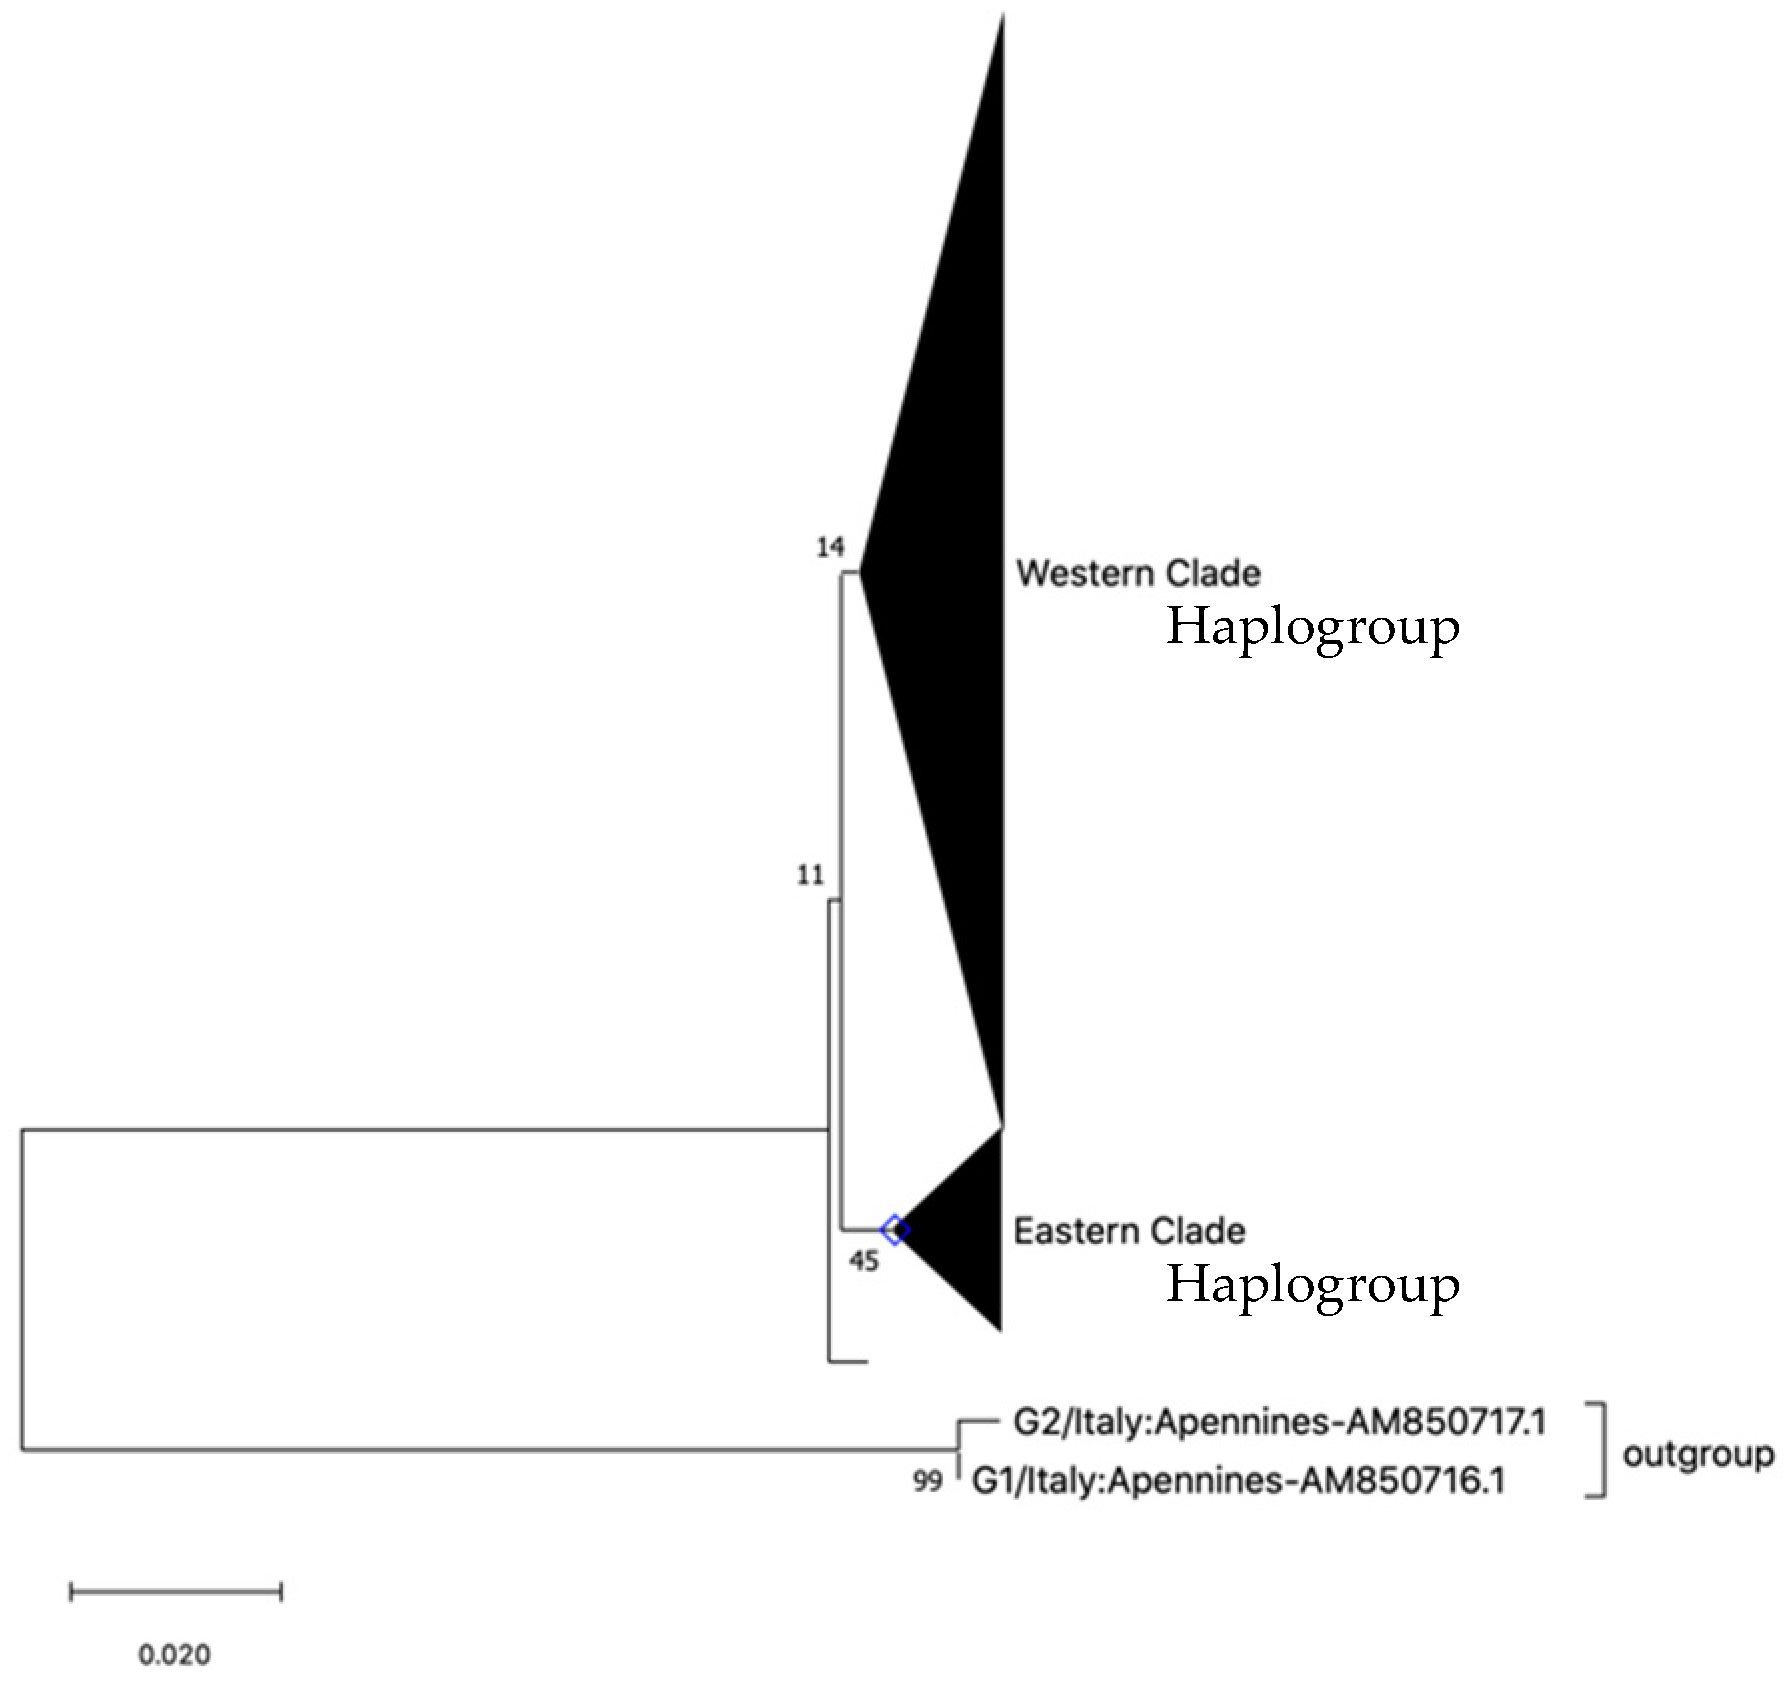
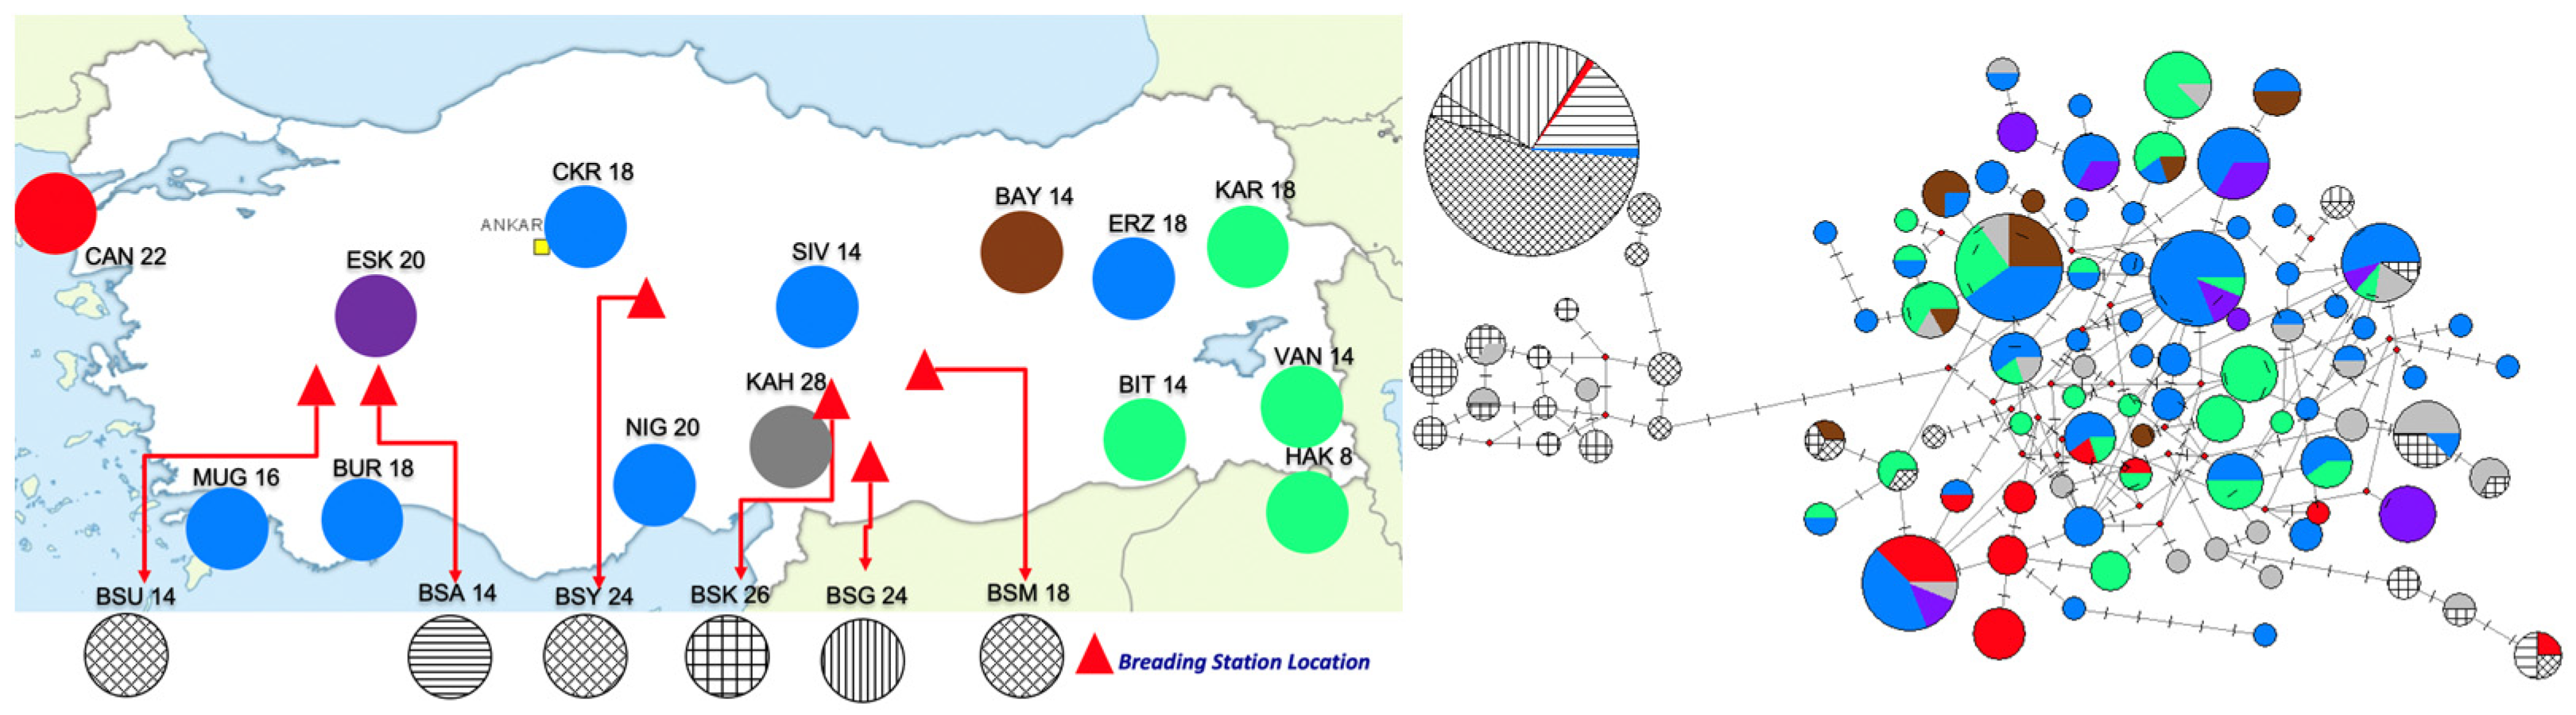
3.1. Mitochondrial Nucleotide Sequences

The alignment of concatenated mt DNA loci for 354 individuals had a length of 2247 nucleotides, indels included. A total of 169 haplotypes were found, 146 belonging to the wild populations and 30 to the captive populations. Unique haplotypes (n = 148) were mostly found in the wild populations (n = 139), whereas captive populations yielded only seven haplotypes (Table 2). The most frequent haplotypes were Hap20 (n = 48) and Hap74 (n = 25) found only in captive partridges except for one wild individual (NIG) at Hap74 and Hap 26 (n = 14) in only wild, respectively. The ML tree with the highest log likelihood (−6412.72) and posterior probability is shown in Figure 1. All haplotypes fell into one of the two main clades, i.e., either the western or the eastern one (Figure 1 and Supplementary Material). Besides, the median-joining haplotype network showed two main groups where captive and wild populations clearly clustered apart, even if evidences of admixture were also flagged (Figure 2. When star contraction of 169 haplotypes was applied, 96 haplotypes remained, with partridges from breeding stations and wild populations well separated from each other (Figure 2). The largest haplogroup included H19, H20, H74, and H88 haplotypes. These were mostly held by partridges from breeding stations (and in 60.5% of all captive individuals as opposed to only 0.9% of wild ones).
Basic summary statistics, including sample sizes, haplotype and nucleotide diversities, are provided in Table 2. We found the highest Hd in KAH and KAR, followed by BAY and central populations, while the lowest was recorded in BSG, BSY, and BSA. Eastern haplotypes were found in the wild CAN, KAH, NIG populations, and all breeding stations. Nearly all samples from breeding stations (85.3%) and some from wild populations (2.1%) belonged to the eastern clade (Table 3).
Some population differentiation was observed in the wild and captive Chukar Partridges in the SAMOVA for mt DNA. The highest FCT value was found at K = 5 (FCT = 0.56; p < 0.0001). One group included all wild populations, and the breeding stations were divided into four groups (Table 2 and Table 3). When only wild populations were analyzed, we did not observe an FCT plateau, rather it increased with the number of K. We selected K = 6 due to the highest FCT differentiation between K = 6 and K = 7 (FCT = 0.11; p < 0.001; Figure 3, Table 3). The first population to split apart was CAN (K = 2), followed by KAH (K = 3).
The AMOVA revealed that differences among populations accounted for 48.37% of the overall genetic variance observed and differences within populations for 51.63%. The differentiation between wild and captive populations was moderate yet statistically significant (FST = 0.48, p < 0.01). The differentiation among individuals from only wild or captive populations was low statistically significant (FST = 0.14 and FST = 0.24, p < 0.01). The differences among and within wild populations accounted for 13.66% and 86.34%, while in the case of captive populations these figures were 24.71% and 75.29%.
Pairwise FST estimates (Figure 3) revealed several well-distinct groups. Breeding station differing by high levels of divergence from wild populations but not from each other except for BSK (FST = 0.29—0.40, p < 0.001). Some wild populations were not distinguished from the other wild populations (p < 0.001). However, CAN, an island population, KAH, BAY, and ESK were differentiated from the other wild populations (p < 0.001; Figure 3).
Mismatch distribution was unimodal, and population expansion was accepted for wild populations, while for captive populations were multimodal and demographic expansion was not supported (Figure 4).

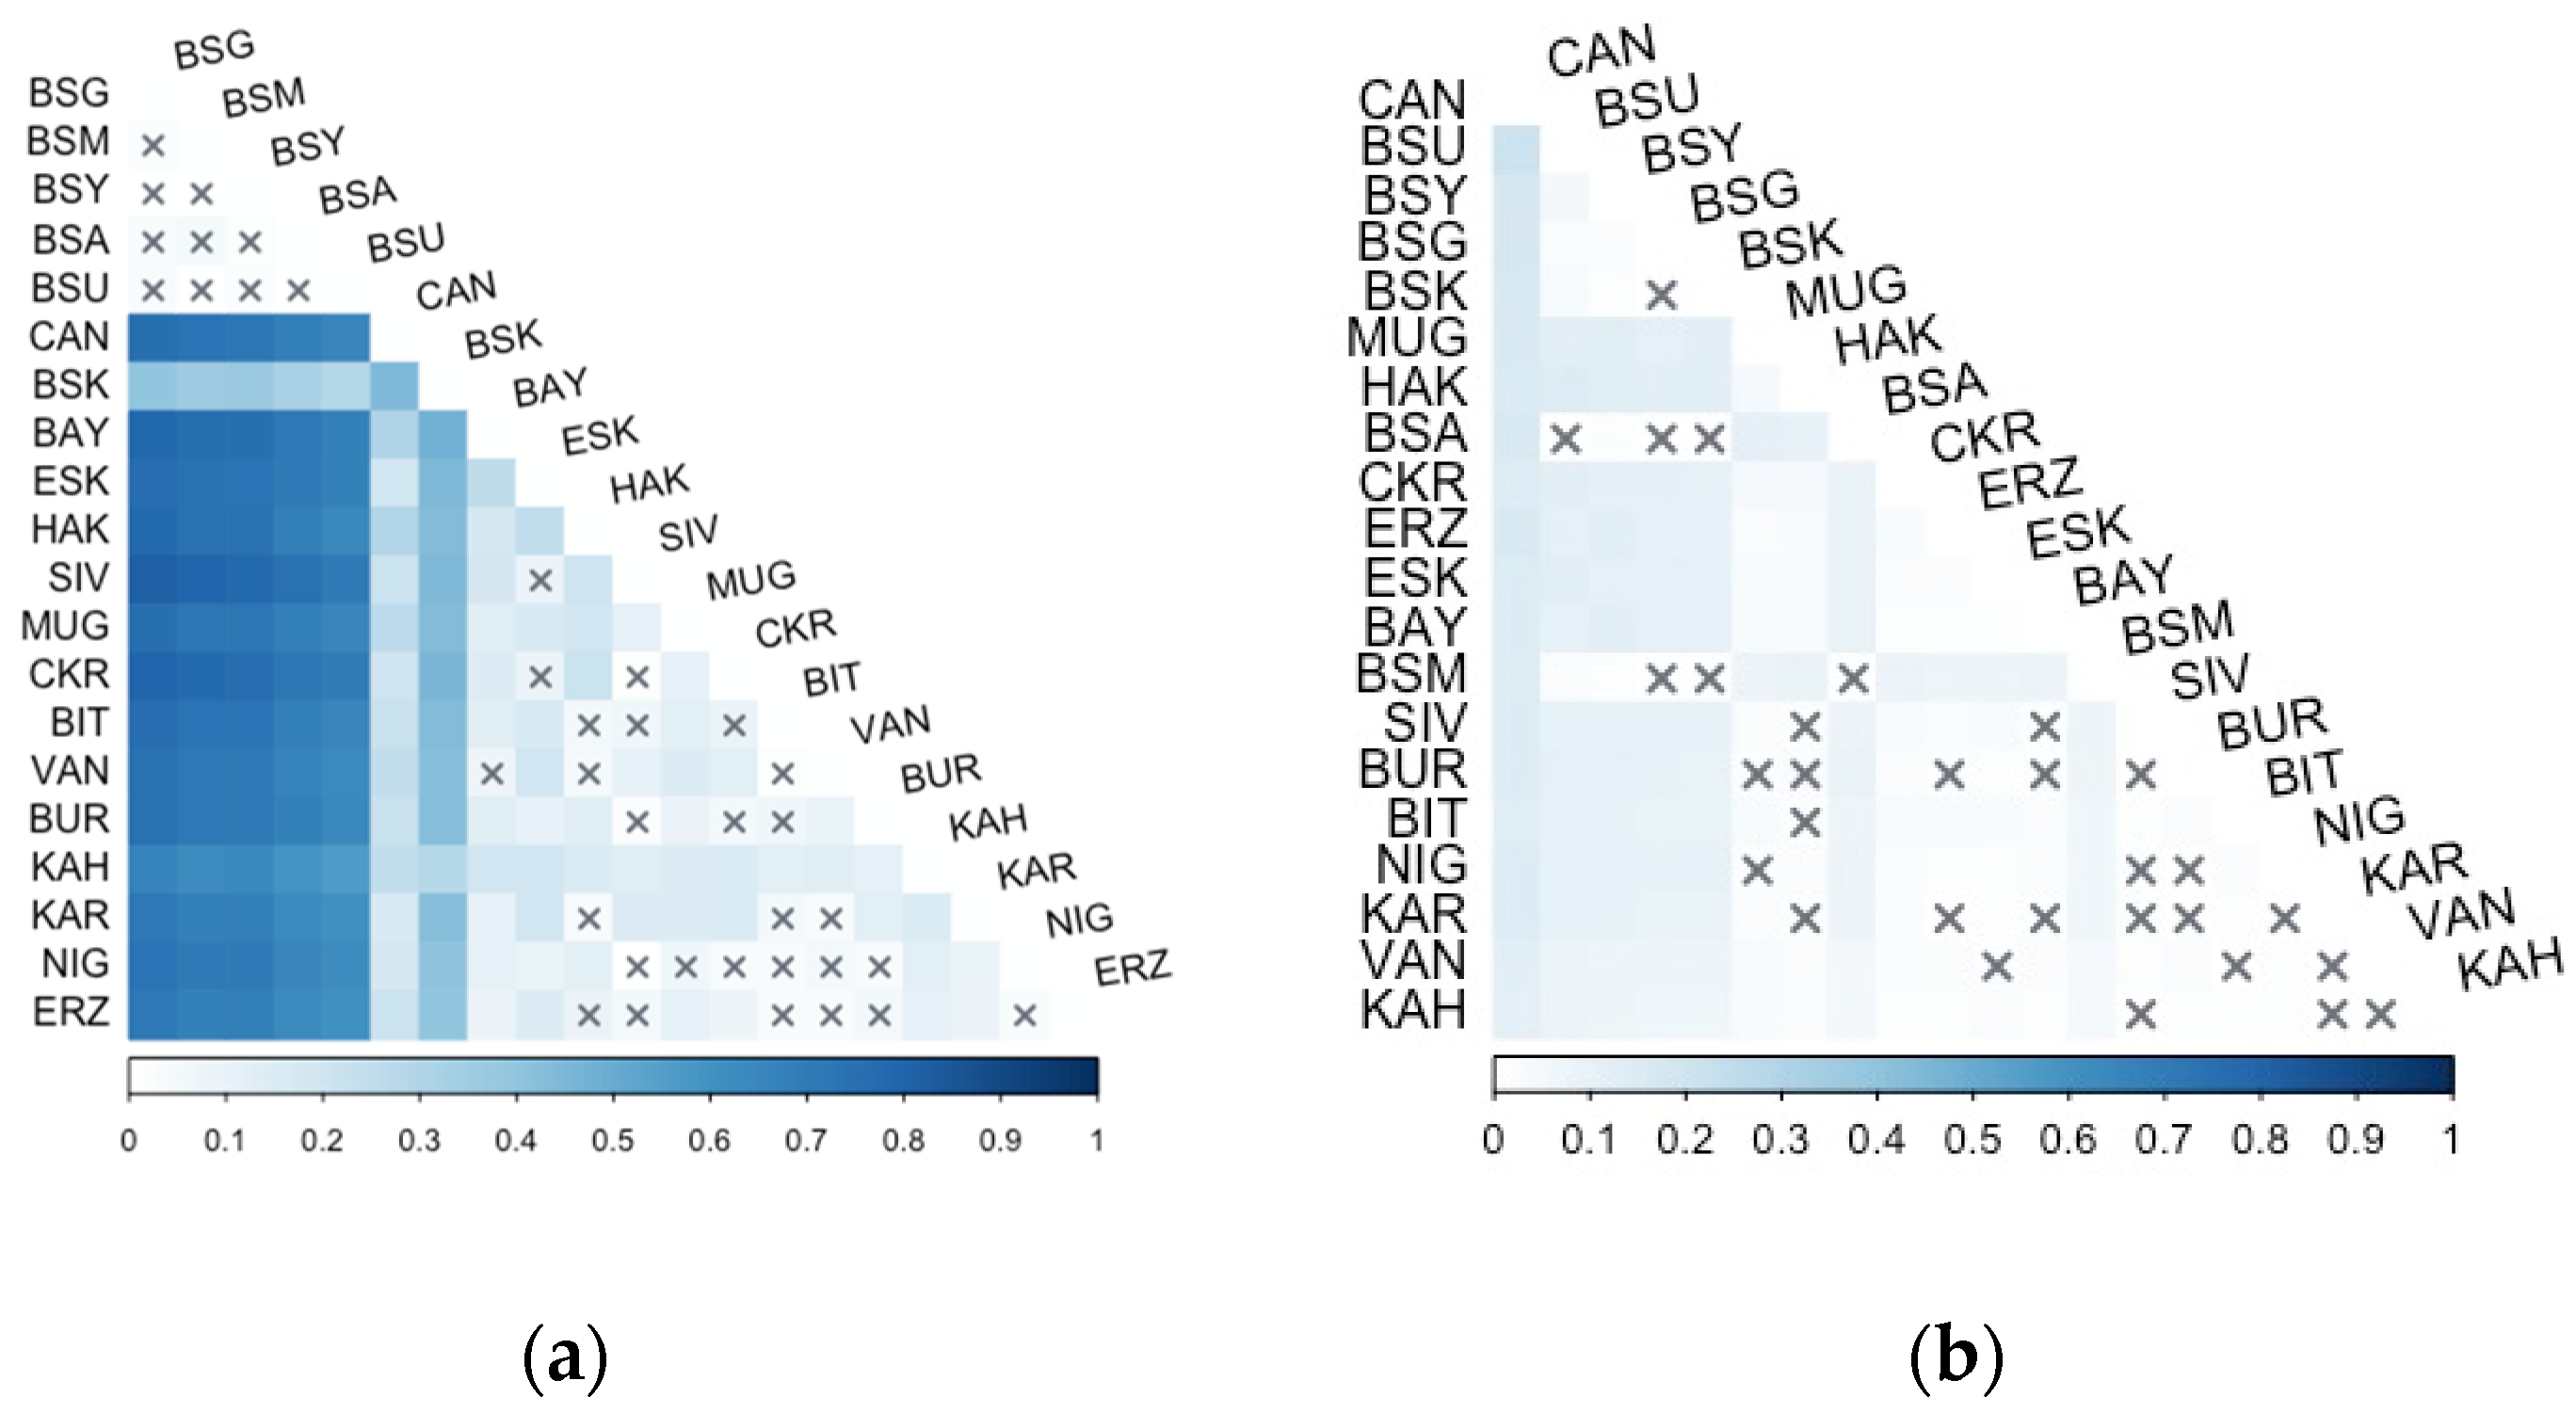
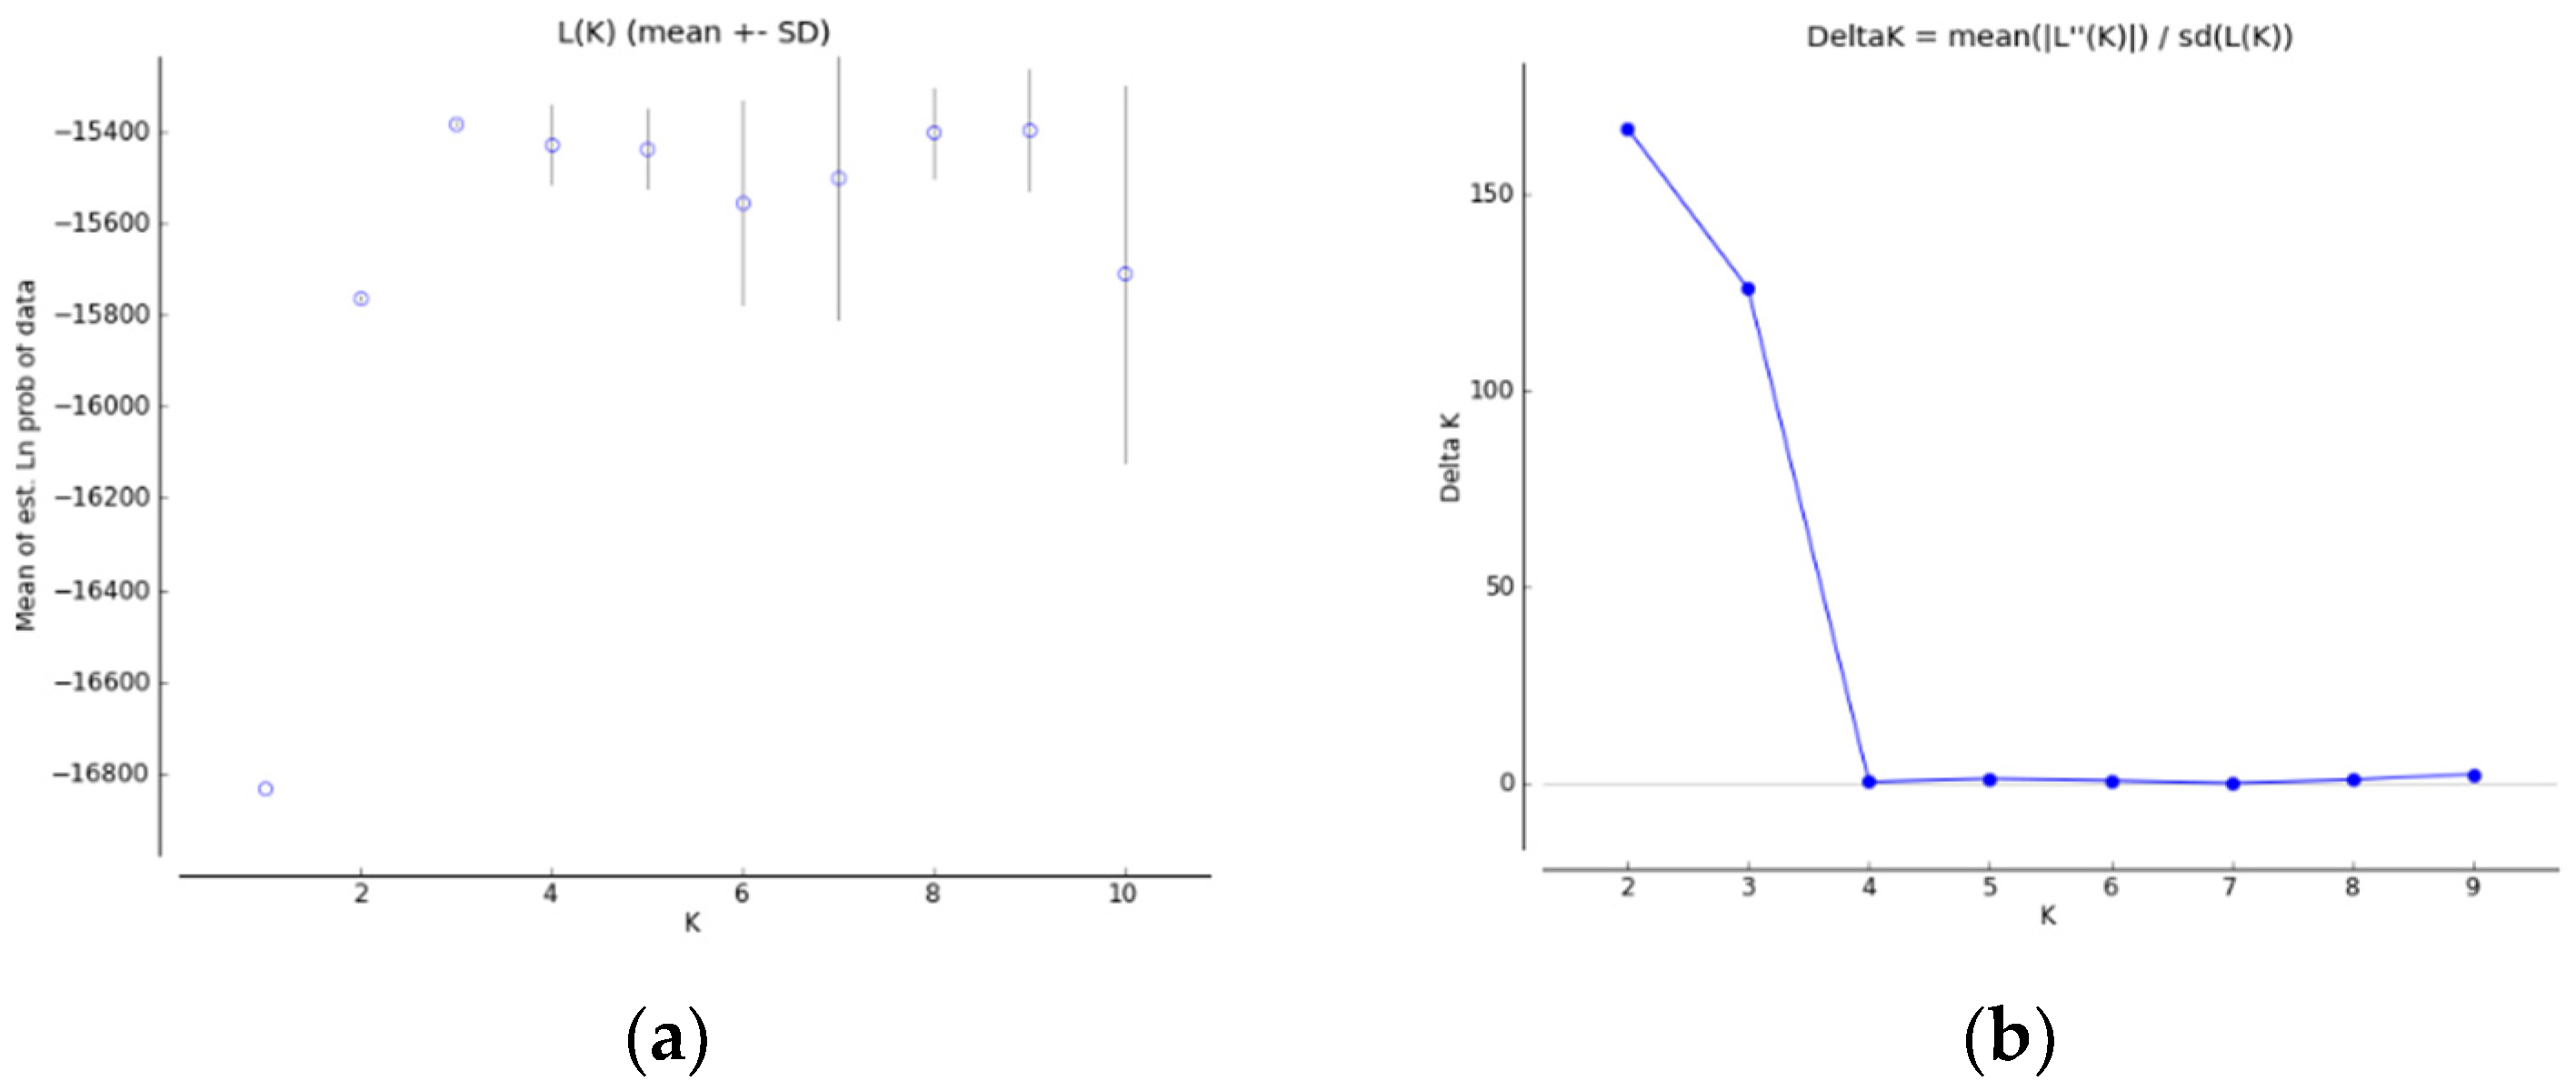
3.2. Microsatellite Analysis

The mean number of alleles per locus varied from 6.6 to 13.2 across wild populations and 6.9 to 8.3 in captive ones (Table 4). A total of 203 alleles were found of which 43 at Aru1E97, followed by 35 at AruF25 and 24 at Aru1B3 (Table 5). While private alleles were found in 11 populations, KAH was the one yielding the highest number (5 alleles; Table 5). The mean expected heterozygosity ranged from 0.69 to 0.87 in wild populations and from 0.71 to 0.79 in captive ones; observed heterozygosity ranged from 0.62 to 0.79 in the former and from 0.64 to 0.73 in the latter, respectively (Table 4).
The linkage equilibrium was rejected for only 22 out of 900 pairs of alleles. However, after sequential Bonferroni correction, exact tests for genotypic linkage disequilibrium was non-significant. These results indicated that the loci used segregate independently. Hardy–Weinberg Equilibrium (HWE) was not accepted for 54 out of 200 the loci in all localities (Table 5). Deviation from HWE was found in all populations except BSA and BSG (Table 4), which might be indicative of inbreeding, assortative mating or null alleles. Heterozygote deficiency appeared in one to 14 loci (Table 5). Heterozygote excess (HE) occurred in NIG at Aru2D020.
STRUCTURE HARVESTER indicated that the most likely number of clusters was K = 2 using the log-likelihood (L(K)) concept (Figure 5). Wild and captive populations separated at K = 2; inferences of K = 3 to K = 6 were similar, revealing three main groups with CAN always well differentiated. Captive samples showed evidence of admixture (Figure 6). Birds from the CAN island population are separated from the other wild populations at K = 3 to K = 6. By arbitrarily defining an individual as belonging to a specific cluster when assignment probability (q) was above 0.8, 346 of 362 individuals clustered together at K = 3 in Structure (Table 6). The highest percentages of admixed (less than 80% of the individuals assigned to the cluster) individuals between wild and captive clusters were observed in SIV, VAN, KAR, ESK, ERZ, and KAH (Table 4).
Comparable population differentiation was observed in wild and captive Chukar Partridges in the SAMOVA at ten microsatellite loci, and K = 4 distinguished among CAN, the other wild populations, BSU, and the other breeding stations (FCT = 0.12; p < 0.01; Table 3). When only wild populations were analyzed, we did not observe an FCT plateau; rather it decreased with the number of K (Table 3). The first population to emerge as distinct was CAN (K = 2), followed by HAK (K = 3), MUG (K = 4), and BIT (K = 5), respectively. Pairwise FST values based on microsatellites showed significant genetic differentiation among most localities (Figure 2). Non-significant values were obtained between neighboring east Anatolian localities.

4. Discussion

The goal of this study was threefold. First, we aimed to determine population structure and phylogeography of Chukar Partridges in Turkey; second, to investigate whether there is any difference between wild and farmed individuals; and third, to search for possible signatures of admixture between them.

4.1. Population Genetic Structure

Our mtDNA analyses of Chukar Partridges from Anatolia showed that farmed Chukars are genetically different from wild ones as well as that the two clusters they belong to fall within the western and eastern clade, respectively, emerged in previous studies [23,38] (Figure 1). Concordantly, microsatellites structure showed wild and captive birds to group in two distinct clusters (K = 2). CAN, an island population (Gökçeada Island), emerged as the most genetically differentiated one on the basis of mtDNA and microsatellites (K = 3–6) among the wild populations, and the other follow on the same order they are listed in Table 3. Noteworthy, this genetic picture emerged from FST and SAMOVA of both genetic systems used (Figure 2, Figure 3 and Figure 5). Even if the wild populations clustered together, it is still possible to detect some internal differentiation among eastern Anatolian, central Anatolian and ESK, KAH, plus BAY populations as well as that evidences of admixture between them occur with the exception of CAN. The differentiation between captive and wild populations was in line with the dissimilar shape and size of bill of their individuals [39]. When wild and captive populations were analyzed separately, it was found that the captive populations were highly differentiated from each other (captive FST = 0.24, wild FST = 0.14). This may be due to the fact that bloodlines used at breeding stations are sometimes reinforced with confiscated Chukar Partridges from illegal hunters.
Global populations of Chukar Partridges fall in an eastern and western clade; the farmed populations from Europe and the USA belong to the eastern clade [14]. Concordantly, we found that Turkish farmed Chukar Partridges mainly (85.3%) belong to the eastern clade. These captive partridges threaten the genetic integrity of wild populations. A number of studies unveiled the anthropogenic hybridization involving A. rufa X A. chukar [14,15,18,19,20,21,24,40,41,42,43,44,45], A. graeca X A. chukar [21] as well as intraspecific hybridization in Chukar Partridge [46,47].
We found some wild individuals falling in the eastern clade, CAN, KAH, and NIG (Table 2). Also, we have determined some genetic admixture between farmed (of eastern origin) and wild individuals in six wild populations and four farms. While 2% of hybrid individuals were found in the wild population, a higher hybridization rate (5%) occurred in farms (Table 6). If this process continues, these admixtures might significantly alter the gene pool of wild populations, possibly impair their fitness and affect female reproduction due to low carotenoid levels in blood plasma (as observed in the Red-Legged Partridges (Alectoris rufa) [48]). A similar genetic homogenization was found in the Mallard, another popular game bird in Europe, with captive-bred individuals changing the gene pool of wild populations [23]. Casas et al. [24] showed that extinction risk of wild and genetically preserved Red-Legged Partridge populations through releases of farmed hybrids is a possibility. Our results show that high haplotype and nucleotide diversity exists in wild Chukar Partridge populations in Turkey as opposed to farm populations (Table 2). Nevertheless, introgressive hybridization might reduce the distinctiveness and diversity of wild populations, impacting their fitness in the near future.
The unimodal mismatch distribution results indicated that all wild populations together experienced recent demographic expansion. However, when taken separately their multimodal mismatch distribution suggests that admixture of haplotypes from three previously isolated lineages (one of them was captive) might have occurred. Also, multimodal mismatch distribution of population separated by SAMOVA at K = 6 indicated previously isolated lineages. Although Anatolia is not covering all the range of Chukar Partridge, these linages may be considered as potential refugia within Anatolia, one of the most important unglaciated areas in Western Palearctic during the Pleistocene. The phylogeographic analysis showed that possibly Anatolia might have been a refugium with “refugia-within-refugia” structure. This model was supported by previous studies indicating range shifts within this region, as in case of Kurper’s Nuthatch, Sitta krueperi [49]. A dense forest cover existed in the northern Anatolia and its coastal belts [50], which, according to Albayrak et al. [4], might have hosted three refugia for Kruper’s Nuthatch in Last Glacial Maximum (LGM), with the late Quaternary glacial-interglacial cycles shaping subsequent demographic expansion. Overall, it is assumed that many Anatolian species underwent population expansion before the Last Interglacial (LIG) [51,52], or between LGM and LIG [49].

4.2. Heterozygosity and Inbreeding

Estimates of observed heterozygosity are significantly lower than expected, except in captive populations, BSG and BSA (Table 4). Widespread heterozygote deficiency (Table 5) might be indicative of a genetic diversity loss in wild and farmed Chukar Partridges. Inbreeding is confirmed, especially in MUG and BUR (indicated by FIS value higher than 0.2). The positive FIS is an indication of decreasing heterozygosity due to null alleles. Similarly, positive FIS was observed in the historical wild group of Mallards in Europe [23].

4.3. Taxonomic and Conservation Implications

Fourteen Chukar Partridge subspecies are recognized worldwide, and two of them, A. c. cypriotes and A. c. kurdestanica, occur in southwestern/south-central Turkey, respectively [13]. Our finding supports the two described subspecies (see Figure 3; depicted in blue and green, respectively). Moreover, (SAMOVA and FST results) might possibly support a new subspecies distributed in Gökçeada Island (CAN).
To preserve the genetic diversity of the Chukar Partridge in Turkey, a country where the release of captive individuals is a common practice, six management units (MUs) should be taken into account: CAN, KAH, BAY, ESK, south-eastern Turkey, and central Anatolia separately (Figure 3). Specific conservation efforts should be made for the population of Gökçeada Island (CAN), where partridge releases should be banned due to the occurrence of a genetically distinct and well-preserved A.chukar population. We advocate for the genetic identity of Chukar Partridges and their six MUs to be considered when developing hunting, production, and releasing policies to preserve the integrity and internal diversity in perpetuity.

Supplementary Materials

The following supporting information can be downloaded at: https://www.mdpi.com/article/10.3390/d14070571/s1, File S1 and S2: The detailed haplotypes tree.

Author Contributions

T.A. designed and directed the study. T.A., Ö.Ö., F.K., D.A. and M.W. provided material. J.A.D.G. conducted the microsatellite analysis. All authors have read and agreed to the published version of the manuscript.

Funding

This research was funded by TUBITAK, 117O580.

Institutional Review Board Statement

The animal study protocol was approved by The MAKU-HADYEK-169 protocol controlled all the experiments on Chukar Partridges by MAKU, Local Ethical Committee on Animal Experiments regulations.

Data Availability Statement

The data presented in this study are available in GenBank with accession numbers MZ706294 to MZ706461.

Acknowledgments

We are grateful to the Turkish General Directorate of Nature Conservation and National Parks and their regional offices. We are also thankful to all hunters who provided the samples, and Ersin Düzyol, who organized the hunters. We are very thanks to anonymous revivers to improve the manuscript.

Conflicts of Interest

The authors declare no conflict of interest.

References

  1. Burri, R. Linked selection, demography and the evolution of correlated genomic landscapes in birds and beyond. Mol. Ecol. 2017, 26, 3853–3856. [Google Scholar] [CrossRef] [Green Version]
  2. Nittinger, F.; Gamauf, A.; Pinsker, W.; Wink, M.; Haring, E. Phylogeography and population structure of the saker falcon (Falco cherrug) and the influence of hybridization: Mitochondrial and microsatellite data. Mol. Ecol. 2007, 16, 1497–1517. [Google Scholar] [CrossRef] [PubMed]
  3. Hewitt, G. The genetic legacy of the Quaternary ice ages. Nature 2000, 405, 907–913. [Google Scholar] [CrossRef] [PubMed]
  4. Albayrak, T.; Gonzalez, J.; Drovetski, S.V.; Wink, M. Phylogeography and population structure of Kruper’s Nuthatch Sitta krueperi from Turkey based on microsatellites and mitochondrial DNA. J. Ornithol. 2012, 153, 405–411. [Google Scholar] [CrossRef]
  5. Ibiş, O.; Tez, C.; Özcan, S. Phylogenetic status of the turkish red fox (Vulpes vulpes), based on partial sequences of the mitochondrial cytochrome b gene. Vertebr. Zool. 2014, 64, 273–284. [Google Scholar]
  6. Schrey, A.W.; Grispo, M.; Awad, M.; Cook, M.B.; McCoy, E.D.; Mushinsky, H.R.; Albayrak, T.; Bensch, S.; Burke, T.; Butler, L.K.; et al. Broad-scale latitudinal patterns of genetic diversity among native European and introduced house sparrow (Passer domesticus) populations. Mol. Ecol. 2011, 20, 1133–1143. [Google Scholar] [CrossRef]
  7. Perktaş, U.; Gür, H.; Ada, E. Historical demography of the Eurasian green woodpecker: Integrating phylogeography and ecological niche modelling to test glacial refugia hypothesis. Folia Zool. 2015, 64, 284–295. [Google Scholar] [CrossRef]
  8. Dufresnes, C.; Strachinis, I.; Suriadna, N.; Mykytynets, G.; Cogălniceanu, D.; Székely, P.; Vukov, T.; Arntzen, J.W.; Wielstra, B.; Lymberakis, P.; et al. Phylogeography of a cryptic speciation continuum in Eurasian spadefoot toads (Pelobates). Mol. Ecol. 2019, 28, 3257–3270. [Google Scholar] [CrossRef] [Green Version]
  9. Taylan, M.S.; Şirin, D. Speciation of the genus Dolichopoda in Anatolia with reference to the role of ancient central lake system. Insect Syst. Evol. 2016, 47, 267–283. [Google Scholar] [CrossRef]
  10. Winkler, D.W.; Billerman, S.M.; Lovette, I.J. Pheasants, Grouse, and Allies (Phasianidae), version 1.0. In Birds of the World; Billerman, S.M., Keeney, B.K., Rodewald, P.G., Schulenberg, T.S., Eds.; Cornell Lab of Ornithology: Ithaca, NY, USA, 2020. [Google Scholar]
  11. Barilani, M.; Bernard-laurent, A.; Mucci, N.; Tabarroni, C.; Perez, A.; Randi, E.; Kark, S.; Bo, O.E. Hybridisation with introduced chukars (Alectoris chukar) threatens the gene pool integrity of native rock (A. graeca) and red-legged (A. rufa) partridge populations. Biol. Conserv. 2007, 137, 57–69. [Google Scholar] [CrossRef]
  12. Madge, S.; McGowan, P. Pheasants, Partridges, and Grouse: A Guide to the Pheasants, Partridges, Quails, Grouse, Guineafowl, Buttonquails, and Sandgrouse of the World; Bloomsbury Publishing: London, UK, 2002. [Google Scholar]
  13. Christensen, G.C. Chukar (Alectoris chukar), version 1.0. In Birds of the World; Poole, A.F., Gill, F.B., Eds.; Cornell Lab of Ornithology: Ithaca, NY, USA, 2020. [Google Scholar]
  14. Barbanera, F.; Guerrini, M.; Khan, A.A.; Panayides, P.; Hadjigerou, P.; Sokos, C.; Gombobaatar, S.; Samadi, S.; Khan, B.Y.; Tofanelli, S.; et al. Human-mediated introgression of exotic chukar (Alectoris chukar, Galliformes) genes from East Asia into native Mediterranean partridges. Biol. Invasions 2009, 11, 333–348. [Google Scholar] [CrossRef]
  15. Martínez-Fresno, M.; Henriques-Gil, N.; Arana, P. Mitochondrial DNA sequence variability in red-legged partridge, Alectoris rufa, Spanish populations and the origins of genetic contamination from A. chukar. Conserv. Genet. 2008, 9, 1223–1231. [Google Scholar] [CrossRef]
  16. Moulton, M.P.; Cropper, W.P.J.; Broz, A.J. Inconsistencies among secondary sources of Chukar Partridge (Alectoris chukar) introductions to the United States. PeerJ 2015, 3, e1447. [Google Scholar] [CrossRef] [PubMed] [Green Version]
  17. Woodard, A.E. Raising Chukar Partridges; Cooperative Extension; University of California: La Jolla, CA, USA, 1982.
  18. Tejedor, M.T.; Monteagudo, L.V.; Mautner, S.; Hadjisterkotis, E.; Arruga, M.V. Introgression of Alectoris chukar genes into a Spanish wild Alectoris rufa population. J. Hered. 2007, 98, 179–182. [Google Scholar] [CrossRef]
  19. Blanco-Aguiar, J.A.; González-Jara, P.; Ferrero, M.E.; Sánchez-Barbudo, I.; Virgós, E.; Villafuerte, R.; Dávila, J.A. Assessment of game restocking contributions to anthropogenic hybridization: The case of the Iberian red-legged partridge. Anim. Conserv. 2008, 11, 535–545. [Google Scholar] [CrossRef]
  20. Negri, A.; Pellegrino, I.; Mucci, N.; Randi, E.; Tizzani, P.; Meneguz, P.G.; Malacarne, G. Mitochondrial DNA and microsatellite markers evidence a different pattern of hybridization in red-legged partridge (Alectoris rufa) populations from NW Italy. Eur. J. Wildl. Res. 2013, 59, 407–419. [Google Scholar] [CrossRef] [Green Version]
  21. Barilani, M.; Sfougaris, A.; Giannakopoulos, A.; Mucci, N.; Tabarroni, C.; Randi, E. Detecting introgressive hybridisation in rock partridge populations (Alectoris graeca) in Greece through Bayesian admixture analyses of multilocus genotypes. Conserv. Genet. 2007, 8, 343–354. [Google Scholar] [CrossRef]
  22. Barilani, M.; Deregnaucourt, S.; Gallego, S.; Galli, L.; Mucci, N.; Piombo, R.; Puigcerver, M.; Rimondi, S.; Rodríguez-Teijeiro, J.D.; Spanò, S.; et al. Detecting hybridization in wild (Coturnix c. coturnix) and domesticated (Coturnix c. japonica) quail populations. Biol. Conserv. 2005, 126, 445–455. [Google Scholar] [CrossRef]
  23. Söderquist, P.; Elmberg, J.; Gunnarsson, G.; Thulin, C.G.; Champagnon, J.; Guillemain, M.; Kreisinger, J.; Prins, H.H.T.; Crooijmans, R.P.M.A.; Kraus, R.H.S. Admixture between released and wild game birds: A changing genetic landscape in European mallards (Anas platyrhynchos). Eur. J. Wildl. Res. 2017, 63, 98. [Google Scholar] [CrossRef] [Green Version]
  24. Casas, F.; Mougeot, F.; Sánchez-Barbudo, I.; Dávila, J.A.; Viñuela, J. Fitness consequences of anthropogenic hybridization in wild red-legged partridge (Alectoris rufa, Phasianidae) populations. Biol. Invasions 2012, 14, 295–305. [Google Scholar] [CrossRef]
  25. Kearse, M.; Moir, R.; Wilson, A.; Stones-Havas, S.; Cheung, M.; Sturrock, S.; Buxton, S.; Cooper, A.; Markowitz, S.; Duran, C.; et al. Geneious Basic: An integrated and extendable desktop software platform for the organization and analysis of sequence data. Bioinformatics 2012, 28, 1647–1649. [Google Scholar] [CrossRef] [PubMed]
  26. Ferrero, M.E.; González-Jara, P.; Blanco-Aguiar, J.A.; Sánchez-Barbudo, I.; Dávila, J.A. Sixteen new polymorphic microsatellite markers isolated for red-legged partridge (Alectoris rufa) and related species. Mol. Ecol. Notes 2007, 7, 1349–1351. [Google Scholar] [CrossRef] [Green Version]
  27. Ferrero, M.E.; Blanco-Aguiar, J.A.; Lougheed, S.C.; Sánchez-Barbudo, I.; De Nova, P.J.G.; Villafuerte, R.; Dávila, J.A. Phylogeography and genetic structure of the red-legged partridge (Alectoris rufa): More evidence for refugia within the Iberian glacial refugium. Mol. Ecol. 2011, 20, 2628–2642. [Google Scholar] [CrossRef]
  28. Kumar, S.; Stecher, G.; Li, M.; Knyaz, C.; Tamura, K. MEGA X: Molecular evolutionary genetics analysis across computing platforms. Mol. Biol. Evol. 2018, 35, 1547–1549. [Google Scholar] [CrossRef]
  29. Bouckaert, R.; Vaughan, T.G.; Barido-Sottani, J.; Duchêne, S.; Fourment, M.; Gavryushkina, A.; Heled, J.; Jones, G.; Kühnert, D.; De Maio, N.; et al. BEAST 2.5: An advanced software platform for Bayesian evolutionary analysis. PLoS Comput. Biol. 2019, 15, e1006650. [Google Scholar] [CrossRef] [Green Version]
  30. Excoffier, L.; Lischer, H.E.L. Arlequin suite ver 3.5: A new series of programs to perform population genetics analyses under Linux and Windows. Mol. Ecol. Resour. 2010, 10, 564–567. [Google Scholar] [CrossRef] [PubMed]
  31. Dupanloup, I.; Schneider, S.; Excoffier, L. A simulated annealing approach to define the genetic structure of populations. Mol. Ecol. 2002, 11, 2571–2581. [Google Scholar] [CrossRef] [PubMed]
  32. Bandelt, H.-J.; Forster, P.; Rohl, A. Median-joining networks for inferring intraspecific phylogenies. Mol. Biol. Evol. 1999, 16, 37–48. [Google Scholar] [CrossRef]
  33. Rozas, J.; Ferrer-Mata, A.; Sanchez-DelBarrio, J.C.; Guirao-Rico, S.; Librado, P.; Ramos-Onsins, S.E.; Sanchez-Gracia, A. DnaSP 6: DNA sequence polymorphism analysis of large data sets. Mol. Biol. Evol. 2017, 34, 3299–3302. [Google Scholar] [CrossRef]
  34. Rousset, F. Genepop’007: A complete re-implementation of the GENEPOP software for Windows and Linux. Mol. Ecol. Res. 2008, 8, 103–106. [Google Scholar] [CrossRef]
  35. Pritchard, J.K.; Stephens, M.; Donnelly, P.J. Inference of population structure using multilocus genotype data. Genetics 2000, 155, 945–959. [Google Scholar] [CrossRef] [PubMed]
  36. Earl, D.A.; vonHoldt, B.M. STRUCTURE HARVESTER: A website and program for visualizing STRUCTURE output and implementing the Evanno method. Conserv. Genet. Resour. 2012, 4, 359–361. [Google Scholar] [CrossRef]
  37. Evanno, G.; Regnaut, S.; Goudet, J. Detecting the number of clusters of individuals using the software STRUCTURE: A simulation study. Mol. Ecol. 2005, 14, 2611–2620. [Google Scholar] [CrossRef] [PubMed] [Green Version]
  38. Forcina, G.; Guerrini, M.; Khaliq, I.; Khan, A.A.; Barbanera, F. Human-modified biogeographic patterns and conservation in game birds: The dilemma of the black francolin (Francolinus francolinus, phasianidae) in Pakistan. PLoS ONE 2018, 13, e0205059. [Google Scholar] [CrossRef] [Green Version]
  39. Albayrak, T.; Aytek, A.İ. Bill Variation of Captive and Wild Chukar Partridge Populations: Shape or Size. Diversity 2022, 14, 48. [Google Scholar] [CrossRef]
  40. Barbanera, F.; Forcina, G.; Cappello, A.; Guerrini, M.; van Grouw, H.; Aebischer, N.J. Introductions over introductions: The genomic adulteration of an early genetically valuable alien species in the United Kingdom. Biol. Invasions 2015, 17, 409–422. [Google Scholar] [CrossRef]
  41. Forcina, G.; Guerrini, M.; Barbanera, F. Non-native and hybrid in a changing environment: Conservation perspectives for the last Italian red-legged partridge (Alectoris rufa) population with long natural history. Zoology 2020, 138, 125740. [Google Scholar] [CrossRef]
  42. Forcina, G.; Tang, Q.; Cros, E.; Guerrini, M.; Rheindt, F.E.; Barbanera, F. Genome-wide markers redeem the lost identity of a heavily managed gamebird. Proc. R. Soc. B Biol. Sci. 2021, 288, 20210285. [Google Scholar] [CrossRef]
  43. Baratti, M.; Ammannati, M.; Magnelli, C.; Dessì-Fulgheri, F. Introgression of chukar genes into a reintroduced red-legged partridge (Alectoris rufa) population in central Italy. Anim. Genet. 2005, 36, 29–35. [Google Scholar] [CrossRef]
  44. Barbanera, F. Analysis of the genetic structure of red-legged partridge ( Alectoris rufa, Galliformes ) populations by means of mitochondrial DNA and RAPD markers: A study from central Italy. Biol. Conserv. 2005, 122, 275–287. [Google Scholar] [CrossRef]
  45. Barbanera, F.; Pergams, O.R.W.W.; Guerrini, M.; Forcina, G.; Panayides, P.; Dini, F. Genetic consequences of intensive management in game birds. Biol. Conserv. 2010, 143, 1259–1268. [Google Scholar] [CrossRef]
  46. Barbanera, F.; Marchi, C.; Guerrini, M.; Panayides, P.; Sokos, C.; Hadjigerou, P. Genetic structure of mediterranean chukar (Alectoris chukar, Galliformes) populations: Conservation and management implications. Naturwissenschaften 2009, 96, 1203–1212. [Google Scholar] [CrossRef] [PubMed]
  47. Panayides, P.; Guerrini, M.; Barbanera, F. Conservation genetics and management of the Chukar Partridge (Alectoris chukar) in Cyprus and the Middle East. Sandgrouse 2011, 33, 34–43. [Google Scholar]
  48. Casas, F.; Mougeot, F.; Ferrero, M.E.; Sánchez-Barbudo, I.; Dávila, J.A.; Viñuela, J. Phenotypic differences in body size, body condition and circulating carotenoids between hybrid and ‘“pure”’ red-legged partridges (Alectoris rufa) in the wild. J. Ornithol. 2013, 154, 803–811. [Google Scholar] [CrossRef]
  49. Perktaş, U.; Gür, H.; Saʇlam, I.K.; Quintero, E. Climate-driven range shifts and demographic events over the history of Kruper’s Nuthatch Sitta krueperi. Bird Study 2015, 62, 14–28. [Google Scholar] [CrossRef]
  50. Şenkul, Ç.; Doǧan, U. Vegetation and climate of Anatolia and adjacent regions during the Last Glacial period. Quat. Int. 2013, 302, 110–122. [Google Scholar] [CrossRef]
  51. Gür, H. The effects of the Late Quaternary glacial-interglacial cycles on Anatolian ground squirrels: Range expansion during the glacial periods? Biol. J. Linn. Soc. 2013, 109, 19–32. [Google Scholar] [CrossRef] [Green Version]
  52. Özüdoğru, B.; Özgişi, K.; Perktaş, U.; Gür, H. The Quaternary range dynamics of Noccaea iberidea (Brassicaceae), a typical representative of subalpine/alpine steppe communities of Anatolian mountains. Biol. J. Linn. Soc. 2020, 131, 986–1001. [Google Scholar] [CrossRef]
Figure 1. ML tree built in MEGA X for the aligned haplotypes using the TN93 + G + I model. The posterior probability of trees in which the associated taxa clustered together is shown next to the branches. Haplotype details are given as Supplementary Documents S1 and S2. Admixed individuals were excluded from this analysis.
Diversity 14 00571 g001
Figure 2. Heat map of mitochondrial (a) and microsatellite (b) pairwise FST values across A. chukar populations in Turkey. Darker shades of blue rectangles indicate higher values of FST (as displayed on the bar down of the heat map). Crosses indicate non-significant FST p-values (p > 0.05).
Diversity 14 00571 g002
Figure 3. Population group defined in SAMOVA (six wild and four captive) based on mtDNA data. Circles represent geographic locations of wild populations and red angles represent the breeding stations on the map. Median-joining haplotype network constructed from the combined mt Cyt b and CR sequence data in Network 10. Haplotypes are represented by circles with size proportional to individual number. Mutational steps are shown by the number of hatch marks.
Diversity 14 00571 g003
Figure 4. Mismatch distribution of Chukar Partridges based on SAMOVA groups. Pairwise differences of observed (red) and expected (green) values under the demographic expansion model.
Diversity 14 00571 g004
Figure 5. (a) Log-likelihood (L(K)) means for each number of cluster (K) from 10 independent runs in Structure Harvester (error bars represent SD). (b) graph shows ΔK for each K based on the first and second-order rates of change.
Diversity 14 00571 g005
Figure 6. STRUCTURE assignment of 362 individual microsatellites for K = 2 to K = 6. Each individual genotype is represented by a vertical bar. Black lines separate the 20 different populations, 14 wild and six captive. The most likely number of clusters is K = 3. Besides, CAN chukars are clustered separately from other wild populations (K = 3–K = 6). The sample size is shown above each respective pie chart.
Diversity 14 00571 g006
Table 1. Chukar Partridge sampling locations and sample size. Abbreviations for each wild and captive population surveyed in this study are spelled out.
No.SourceLocalityMt DNA (n)Microsatellites (n)Reference
1Wild populationÇanakkale (CAN)2421This study
2Muğla (MUG)1916This study
3Burdur (BUR)1918This study
4Eskişehir (ESK)2120This study
5Çankırı (CKR)1818This study
6Niğde (NIG)2221This study
7Sivas (SIV)2013This study
8Kayramanmaraş (KAH)2928This study
9Bayburt (BAY)1414This study
10Erzurum (ERZ)1919This study
11Kars (KAR)1818This study
12Bitlis BIT)1313This study
13Van (VAN)1414This study
14Hakkari (HAK)88This study
BS1Breeding stationAfyon (BSA)1915This study
BS2Gaziantep (BSG)2423This study
BS3Kahramanmaraş (BSK)2827This study
BS4Malatya (BSM)1817This study
BS5Uşak (BSU)1414This study
BS6Yozgat (BSY)2625This study
GenBank12 Countries86-Barbanera et al. [13]
Alectoris greaca2-Barbanera et al. [13]
Total 475362
Table 2. Summary statistics (±SD) of genetic diversity in Chukar Partridge populations. Haplotype diversity (Hd) and nucleotide diversity (π) for each sampling area. N = number of individuals; eN = number of east clade individuals; S = polymorphic sites; h = number of haplotypes; eh = number of east haplotypes; uh = number of unique haplotypes. * SAMOVA groups of breeding station.
SAMOVA GroupsPopulationNeN (%)SHaplotypesHdπ (×10−3)
heh (%)uh
1 CAN221 (4.5)25131 (7.7)80.91 ± 0.051.63 ± 0.46
2 KAH293 (10.3)36283 (10.7)210.99 ± 0.022.98 ± 0.30
3 BAY14no2312no80.98 ± 0.041.91 ± 0.31
4 ESK20no108no40.87 ± 0.051.69 ± 0.13
5CenterBUR18no2815no110.98 ± 0.022.45 ± 0.36
5MUG18no2215no130.98 ± 0.022.04 ± 0.28
5CKR16no1613no70.98 ± 0.031.62 ± 0.24
5NIG191 (5.3)28161 (6.3)90.98 ± 0.022.07 ± 0.43
5SIV12no1110no30.97 ± 0.041.25 ± 0.19
5ERZ19no3415no110.97 ± 0.022.84 ± 0.23
5-total center1021 (1)74721 (1.4)540.99 ± 0.002.17 ± 0.15
6EastKAR18no2316no100.99 ± 0.022.69 ± 0.24
6BIT12no2110no70.97 ± 0.042.32 ± 0.29
6VAN13no2010no50.95 ± 0.052.47 ± 0.37
6HAK8no127no10.96 ± 0.082.35 ± 0.25
6-total east51no3435no230.98 ± 0.012.49 ± 0.13
Total wild2385 (2.1)1031465 (3.4)1390.99 ± 0.002.47 ± 0.10
1 * BSA1412 (85.7)1443 (75.0)no0.71 ± 0.101.77 ± 0.75
2 * BSG2221 (95.5)1854 (80.0)no0.52 ± 0.111.02 ± 0.56
3 * BSK2617 (65.4)221812 (66.7)40.97 ± 0.023.26 ± 0.32
4 * BSM1514 (93.3)1165 (83.3)10.76 ± 0.081.08 ± 0.35
4 * BSU1412 (85.7)2053 (60.0)no0.72 ± 0.091.97 ± 0.85
4 * BSY2523 (92.0)1686 (75.0)no0.66 ± 0.091.29 ± 0.51
Total captive11699 (85.3)263020 (66.7)70.79 ± 0.032.23 ± 0.27
TOTAL354104 (29.4)10516921 (12.4)1480.97 ± 0.003.81 ± 0.08
Table 3. Spatial analysis of molecular variance (SAMOVA) of Alectoris chukar for the mtDNA. K, number of groups. FCT, the proportion of total genetic variance due to the differences between groups. Captive and wild populations’ K was given in the first column.
Mt DNAMicrosatellite
K5345678943456789
FCT0.56*0.10*0.10*0.10*0.11*0.11*0.12*0.12*0.12*0.11*0.08*0.07*0.06*0.05*0.05*0.05*
Group compositionGroup composition
Wild populationsBUR1345677743456789
CAN1111111111111111
MUG1345655543333333
ESK1345444443456782
CKR1345677743456666
SIV1345677743456789
NIG1345677743456789
KAH1222222243456788
BAY1343333343456755
ERZ1345676643456777
KAR1334568943456789
BIT1344566843444444
VAN1344566843455584
HAK1334568942222229
Breeding stationsBSA2 2
BSG3 2
BSK4 2
BSU5 3
BSY5 2
BSM5 2
Table 4. Summary statistics (±SD) of genetic diversity in Chukar partridge. Haplotype diversity (Hd) and nucleotide diversity (p) expected heterozygosity (HE), observed heterozygosity (HO), and inbreeding coefficient (FIS) for each sampling area. p values for heterozygote deficiency.
LocationNAHoHepFIS
CAN217.5 ± 3.70.63 ± 0.230.69 ± 0.220.00020.0991
MUG169.0 ± 3.70.62 ± 0.130.82 ± 0.110.00000.2523
BUR1810.4 ± 4.10.66 ± 0.180.86 ± 0.060.00000.2325
ESK2010.0 ± 3.40.74 ± 0.140.84 ± 0.060.00000.1286
CKR1810.1 ± 4.90.69 ± 0.180.81 ± 0.150.00000.1404
SIV139.7 ± 3.50.74 ± 0.160.86 ± 0.080.00000.1482
NIG2111.4 ± 4.40.74 ± 0.130.85 ± 0.090.00000.1344
KAH2813.2 ± 5.70.71 ± 0.120.86 ± 0.080.00000.1749
BAY149.5 ± 3.40.76 ± 0.180.84 ± 0.060.00000.1125
ERZ1910.2 ± 3.60.79 ± 0.090.84 ± 0.080.01550.0506
KAR1811.3 ± 4.40.78 ± 0.150.87 ± 0.060.00000.0995
BIT1310.1 ± 3.20.79 ± 0.170.86 ± 0.080.00000.0790
VAN149.3 ± 3.50.77 ± 0.180.86 ± 0.070.00000.1080
HAK86.6 ± 2.40.71 ± 0.260.84 ± 0.080.00040.1644
BSA157.0 ± 2.80.72 ± 0.140.75 ± 0.150.10040.0473
BSG238.2 ± 3.30.73 ± 0.150.73 ± 0.180.1194−0.0062
BSK277.8 ± 3.30.66 ± 0.180.74 ± 0.160.00000.0974
BSY258.3 ± 3.80.70 ± 0.170.72 ± 0.180.01520.0368
BSM178.2 ± 3.10.71 ± 0.170.79 ± 0.120.00000.1109
BSU146.9 ± 3.60.64 ± 0.160.71 ± 0.190.03290.0913
Table 5. Microsatellite polymorphism. T: total number of alleles (range), Np: mean the number of alleles per population ± SD, HWE: Hardy–Weinberg equilibrium, HD: Heterozygote deficiency, HE: Heterozygote excess, values: the number of specific alleles in each population.
LocationAru1B3Aru1E7Aru1E97Aru1G4Aru1G49Aru2D020Aru1AAru1E93AruF114AruF25
T24 (9–16)10 (5–10)43 (7–25)13 (4–9)23 (6–15)20 (4–13)13 (4–9)9 (2–9)13 (6–10)35 (6–20)
Np12.6/1.96.4/1.314.7/4.66.9/1.311.5/2.18.5/2.77.1/1.44.4/1.88.7/1.211.7/4.0
CAN-/HWE-/HWE-/HWE-/HWE-/HD-/HD-/HD-/HWE-/HWE-/HWE
MUG-/HD-/HWE1/HWE-/HD-/HD-/HD-/HWE-/HWE-/HD-/HD
BUR-/HD-/HD1/HD-/HWE-/HD-/HWE-/HWE-/HWE-/HD-/HWE
ESK-/HD-/HWE2/HWE-/HWE-/HD-/HWE-/HWE-/HWE-/HD-/HWE
CKR-/HD-/HWE-/HWE-/HWE-/HWE-/HWE-/HWE-/HWE-/HD-/HWE
SIV-/HWE-/HWE-/HWE1/HWE-/HD-/HWE-/HWE-/HWE-/HWE1/HWE
NIG-/HWE1/HD2/HWE-/HWE-/HD-/HE-/HWE-/HWE-/HD-/HWE
KAH-/HD-/HWE-/HD1/HWE1/HD1/HD-/HWE2/HWE-/HD-/HWE
BAY-/HD-/HWE-/HWE-/HD-/HWE-/HWE-/HWE-/HWE-/HWE-/HWE
ERZ-/HD-/HWE-/HWE-/HWE-/HD-/HWE-/HWE-/HWE-/HD1/HWE
KAR1/HWE-/HWE-/HWE1/HWE1/HD-/HD-/HWE-/HWE-/HWE-/HWE
BIT-/HWE-/HWE-/HWE-/HWE-/HD-/HWE-/HWE-/HWE-/HWE2/HWE
VAN-/HD-/HWE1/HWE-/HWE-/HD-/HWE-/HWE-/HWE-/HWE-/HWE
HAK1/HD-/HWE-/HD-/HWE-/HD-/HWE-/HWE-/HWE-/HD2/HWE
BSA-/HWE-/HWE-/HWE-/HWE-/HWE-/HWE-/HWE-/HWE-/HD-/HWE
BSG-/HWE-/HWE-/HWE-/HWE-/HD-/HWE-/HWE-/HWE-/HD-/HWE
BSK-/HWE-/HWE-/HWE-/HWE-/HD-/HWE-/HWE-/HWE-/HD-/HWE
BSY-/HWE-/HWE-/HWE-/HWE-/HD-/HWE-/HWE-/HWE-/HD-/HWE
BSM-/HWE-/HWE-/HWE-/HWE-/HD-/HWE-/HWE-/HWE-/HD-/HWE
BSU-/HWE-/HWE1/HWE-/HWE-/HD-/HWE-/HWE-/HWE-/HD-/HWE
Table 6. Sample size (n) and percentages of samples collected in different localities and assigned to the wild (two clusters) or captive cluster at K = 3 in STRUCTURE. Proportion of membership of each pre-defined population in each of the tree clusters ≤ 0.8 are considered admixed.
LocationnWild (%)Captive (%)Main Admixture (%)
Cluster ICluster IICluster IIICluster I and IICluster I and IIICluster II and III
WildCAN2109010000
MUG1610000000
BUR189400600
ESK209500050
CKR188906600
NIG219505000
SIV138500880
KAH2875018440
BAY1410000000
ERZ199500050
KAR189400060
BIT139200800
VAN148607070
HAK810000000
Total2418384220
Breeding stationsBSA150093007
BSG230096040
BSK274093004
BSM1700820180
BSU1400100000
BSY2500100000
Total1211094032
Total36256534131
Publisher’s Note: MDPI stays neutral with regard to jurisdictional claims in published maps and institutional affiliations.

