Article

Genetic Characterization of Endangered Indian Mithun (Bos frontalis), Indian Bison/Wild Gaur (Bos gaurus) and Tho-tho Cattle (Bos indicus) Populations Using SSR Markers Reveals Their Diversity and Unique Phylogenetic Status

1
Animal Genetics and Breeding Laboratory, National Research Centre on Mithun, Medziphema 797106, Nagaland, India
2
ICAR-National Dairy Research Institute, Karnal 132001, Haryana, India
3
Central Avian Research Institute, Izatnagar, Bareilly 243122, Uttar Pradesh, India
4
ICAR Research Complex for NEH Region, Nagaland Centre, Medziphema 797106, Nagaland, India
5
Department of Veterinary Microbiology, West Bengal University of Animal and Fishery Sciences, Kolkata 700037, West Bengal, India
6
Shri Chamarajendra Zoological Gardens, Mysore 570004, Karnataka, India
*
Author to whom correspondence should be addressed.
Diversity 2022, 14(7), 548; https://doi.org/10.3390/d14070548
Submission received: 19 May 2022 / Revised: 2 July 2022 / Accepted: 6 July 2022 / Published: 7 July 2022
(This article belongs to the Special Issue Conservation of Bison Populations – Achievements and Problems)

Abstract

:
Mithun (Bos frontalis) or gayal and Indian Bison or wild gaur (Bos gaurus) are listed among the rare and endangered bovine species of India. The remote location of mithun in four North Eastern Hill states (Arunachal Pradesh, Nagaland, Manipur, and Mizoram), scattered population size, and non-availability of genetic diversity status are major limitations towards devising a suitable breeding and conservation policy of these species. Since several studies have demonstrated the successful applicability of microsatellite/SSR markers across related genera/families in both crop plants and animal species, 30 FAO recommended cattle microsatellites were utilized for the assessment of the genetic diversity of Indian mithun, bison, and local Tho-tho cattle. Mitochondrial transmembrane protein coding cytochrome B (CYTB) complete sequence data of 71 bovine samples from India were also used to reinforce the study. Population structuring clustered the all bovines into three subgroups as per geographical location and species. Bottleneck analysis indicated a mode shift in the allelic frequency distribution of gaur, indicating minor genetic bottleneck events in the past, while no bottleneck was found in mithun and Tho-tho cattle. To our knowledge, this study represents the first report of molecular genetic characterization showing the population structure and status of genetic diversity in rare Indian bovines, namely, Mithun, Gaur, and Tho-tho cattle.

1. Introduction

Mithun (Bos frontalis), also known as ‘Gayal’, and ‘Cattle of the mountain’, an endangered ruminant species belonging to the family Bovidae, is indigenous to the eastern Himalayas. It plays an important role in the traditions and rituals of the vast tribal population of this North-Eastern Hill (NEH) region of India, being the pride of northeast India. There are various hypotheses on the origin of mithun reported in the literature. Mithun was first described as ‘the Ceremonial Ox’ of the Naga tribes of India, and the Indo-Myanmar border was reported to be the place of origin of mithun [1]. Three possible hypotheses regarding the origin of mithun were proposed, namely, (i) directly domesticated from wild Gaur/Indian Bison (Bos gaurus) [2,3,4,5,6,7], (ii) hybrid decent from the crossing of wild Gaur and domestic cattle [8,9,10], and (iii) crossing with a wild Bos, which is now extinct [11,12]. Mithun is mainly reared as a meat animal and its meat (meef) is relished among native tribes because of its unique texture, taste, and flavor. Similarly, milk obtained from mithun cows is reported to be superior in terms of quality over the milk of other bovines, and contains double the quantity of total energy value as compared to traditional cow milk [13,14].
India has the largest mithun population (~97.57%) in the world (0.38 million) [15], while Myanmar, Bangladesh, China, and Bhutan account for approximately 3000 (0.96%), 1000 (0.32%,), 3000 (0.96%), and 570 (0.18%) respectively [16]. The dwindling mithun population has made this unique species classified as an endangered species by the International Union for Conservation of Nature and Natural Resources (www.iucnredlist.org/) [10].
The wild gaur aka Indian Bison (Bos gaurus), the largest among the bovine family, is a highly endangered species in the wild and declared vulnerable by the International Union for Conservation of Nature and Natural Resources (IUCN) since 1986 (www.iucnredlist.org/, accessed on 10 January 2022) due to the rapidly declining population [17]. It is a massively built animal and is very strong. These are kept in various Indian zoos and protected National Parks as a part of conservation efforts. Recently, Sri Chamarajendra Zoological Gardens, Mysuru (Mysore), India is in the process of initiating an ambitious breeding and conservation program for wild gaurs. This necessitates the investigation of population structure and genetic diversity present in wild gaur population. Tho-tho is one of the indigenous cattle breeds, available mostly in Kohima and Phek district of Nagaland, and used by local tribal people for meat and dung purposes. It is a small- to medium-sized animal (adult weighing 260–300 kg) with pure black or black with white spot coat [18]. It is used for draught, manure, and meat purposes (https://nbagr.icar.gov.in/en/thutho-cattle/, accessed on 9 April 2022).
Microsatellites (Simple Sequence Repeats, SSRs) have been widely used for the genetic characterization and diversity analysis for livestock worldwide and have been recommended by the FAO as microsatellites are highly informative, codominant, highly specific, transferable among related species, and have relatively low costs. Therefore, microsatellites continue to be widely used, especially for various wild species [19,20,21,22]. SSRs have been the most frequently used genetic marker in population genetics in the past two decades [23]. Recently, Single Nucleotide Polymorphic loci (SNPs) have been used in a variety of genetic studies [24], but they could not replace SSRs completely, even in the genomic era, due to their potential benefits [25]. Multi-allelic nature and high polymorphism of SSR markers help to establish the relationship among the individuals even with fewer markers. SSR markers are immensely valuable in studies of variation detection, diversity analysis, phylogeny, population structure, gene mapping, and association studies in vertebrates [26,27,28,29] and fish species [30].
Several studies have demonstrated the successful transferability and applicability of gene-based microsatellite markers across related genera in both crop plants [31] and livestock species, particularly recommending the use of cattle (Bos taurus) microsatellite markers for population genetic analysis for other related Bos species for which microsatellites have not been developed, namely Bos frontalis and Bos gaurus, respectively [32,33,34,35,36,37]. It was decided to test microsatellites markers that have been developed for cattle [26,38], to assess the population structure and genetic diversity of mithun and gaur (Indian bison) population, being in the same Bos family. Furthermore, mtDNA based studies provides additional support and is regarded as an informational tool for genetic diversity, evolutionary studies due to the near-neutrality, maternal inheritance, and clock-like nature of its substitution rate [39]. The Displacement region (D-loop) proves to be a particularly useful genetic marker because it evolves much faster than the coding region of the mtDNA [40]. Hence, studying mtDNA becomes a quintessential tool to explore population structures and infer evolutionary histories.
Even if all these studies showed high suitability of bovine microsatellite markers for genetic characterization of domesticated mithun and wild gaur, as a member of the subfamily Bovinae, information on the genetic diversity of Indian mithuns and wild gaurs are scanty so far. Thus, it is important to determine the present level of genetic diversity and population structure in the mithun and gaur population to aid the development of suitable breeding strategies and propose well-versed recommendations to support their ongoing conservation and genetic improvement program. This is probably the first attempt, to our knowledge, for the genetic characterization of Indian mithun, Indian Bison/wild gaurs, and Tho-tho cattle using microsatellite (SSR) markers.
Therefore, the present study was performed to assess the levels of genetic diversity and population structure among mithun, wild gaur, and Tho-tho cattle. The results will help in a formulating effective breeding policy and shaping future conservation plans, as these sub-species come under endangered risk category. There is a need for improvement and at the same time maintaining subspecies purity by reducing the possible admixture due to subspecies hybridization.

2. Materials and Methods

2.1. Samples and DNA Extraction

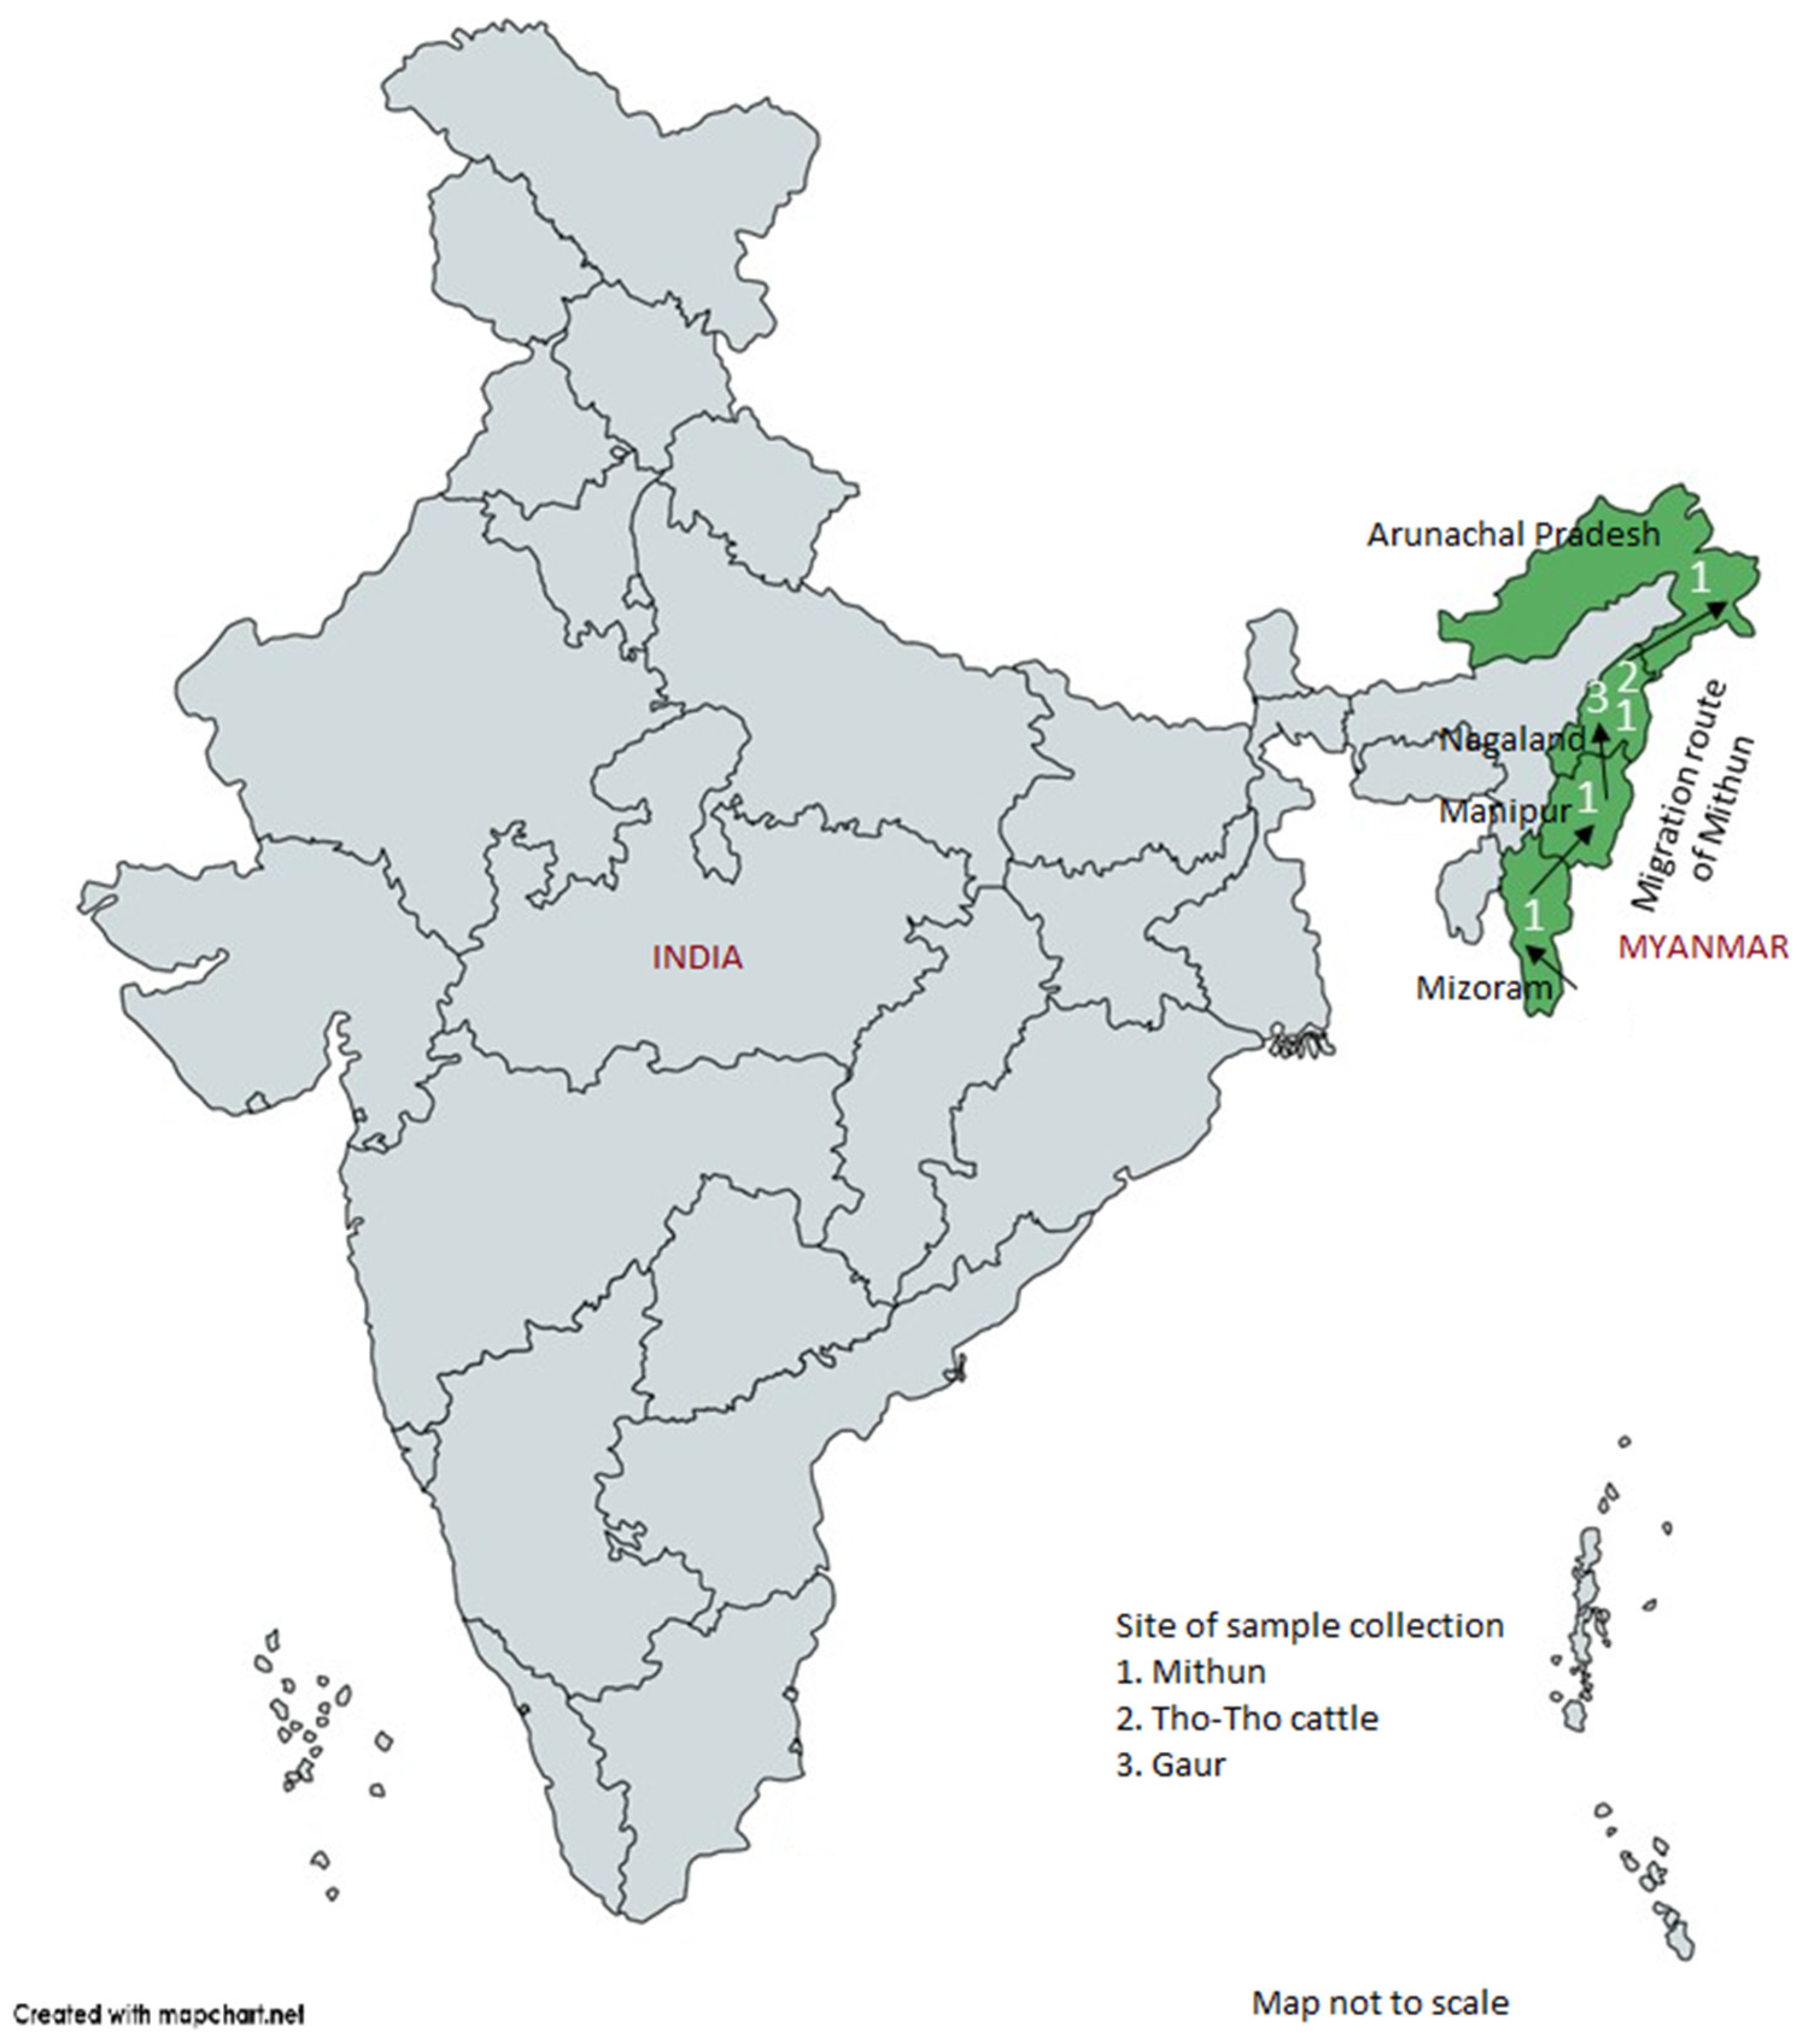
A total of 163 random blood samples from genetically unrelated four mithun populations, corresponding to four North-Eastern Indian states (Figure 1), namely, Arunachal Pradesh (n = 40), Nagaland (n = 41), Manipur (n = 16), and Mizoram (n = 66); additionally, 10 blood samples from Indian bison/wild gaur (Bos gaurus) from Mysore Zoo, Karnataka State, India were collected for diversity analysis. Twenty-five samples of a local cattle breed, Tho-tho, were also collected for positive control and comparative purpose. Genomic DNA from each sample was isolated from white blood cells by using a Promega DNA isolation kit (Promega, Madison, WI, USA) [41] and stored at −20 °C until further use.

2.2. Microsatellite Loci

Thirty cattle microsatellite loci (SSR markers) from the FAO (1996) MoDAD list [38], mapped to 20 different autosomes (Table 1), were tested for cross-species amplification and analysis of genetic diversity in the Indian mithun and wild gaur populations. Primer pairs for microsatellite markers were synthesized by Applied Biosystem (Life technologies, CA, USA). The forward primers of each locus were 5′ end-labeled, with either FAM, VIC, NED, or PET fluorescent tag, whereas the reverse primers were unlabeled. Polymerase chain reactions (PCR) were carried out in a 50 µL reaction volume containing 1.5 mm MgCl2, 10 mM dNTPs, 100 ng of each primer, 100 ng of template DNA, and 3U of Fast Taq Polymerase (Chromous Biotech, Bangalore, India).

2.3. Mitochondrial DNA Sequencing

The transmembrane protein coding cytochrome B gene (CYTB) was amplified by PCR, using primer pair L14724 (5′-CGAAGCTTGATATGAAAAACCATCGTTG-3′) and H15915R (5′-GGAATTCATCTCTCCGGTTTACAAGAC-3′) as described by [42].
These two primers yielded a PCR product of 1246 bp, representing the complete CYTB gene of mithun (GenBank: JQ404407.1).

2.4. Multiplex PCR and Genotyping

All the 30 microsatellite markers were initially tested for amplification of genomic DNA from a panel of 20 Indian mithuns and five gaurs. Genomic DNA isolated from eight local Tho-tho cattle (Bos indicus) were used as positive control. In total, 19 out of 30 cattle microsatellite markers successfully amplified mithun and gaur genomic DNA. Subsequently, all the genomic DNA samples were amplified using these 19 sets of microsatellite markers in four multiplex PCR set-ups (Table 2).
Amplification was performed in ABI Veriti thermal cycler (Applied Biosystems, Switzerland). The capillary electrophoresis was performed in an ABI Genetic Analyzer 3500xL (Applied Biosystem, CA, USA), according to manufacturer’s recommendations. The subsequent gel analysis and fragment sizing were performed with GENEMAPPER® version 4.1 software (Applied Biosystems, Waltham, MA, USA) with LIZ 500R size standard (Applied Biosystems, Switzerland). All the 19 amplified products for each microsatellite locus were cloned in T-Vector, the plates were screened for clones, and the positive clones were sequenced to analyze for presence of number of two-base repeats.
Polymerase Chain Reaction (PCR) was carried out on about 50 ng genomic DNA in a 25 μL reaction volume using Thermal Cycler (Applied Biosystem, Waltham, MA, USA). The reaction mixture consisted of 200 μM of each dNTPs, 1.5 mM MgCl2, 50 pmol primer, 0.5 U Taq polymerase (Promega, USA), and Taq buffer. Negative controls (lacking template DNA) were included in all reactions, and produced no products. The PCR reaction cycle was accomplished by denaturation for 6 min at 94 °C, 30 cycles of 94 °C for 45 s, 60 °C for 30 s, 72 °C for 60 s, and finally extension at 72 °C for 6 min, before cooling to 4 °C for 10 min. The size of amplification product was checked by loading 10 μL PCR product onto 2% agarose gel containing 0.5 μL/mL ethidium bromide. The product was purified using a QIA quick PCR purification kit (Qiagen, Hilden, Germany). Purified product was labeled using the Big Dye Terminator 3.1 Cycle sequencing kit (Applied Biosystems, Foster City, CA, USA) and sequenced directly using an ABI3100 Prism automatic DNA sequencer following manufacturer instructions. The primers used for sequencing were the same as those used in the PCR. Both strands of PCR product were completely sequenced. All final sequences were determined from both strands for verification.

2.5. Statistical Data Analysis

To identify the genetic structure of the given population and assign individuals to populations, the software STRUCTURE version 2.3.4 was used [43]. To estimate the optimal number of groups (K), STRUCTURE was run with K varying from 1 to 10, with five runs for each K value. To determine the true value of K, ad hoc statistic ΔK was followed. Parameters were set to 100,000 burn-in periods and 500,000 Markov Chain Monte Carlo (MCMC) replications after burn-in with an admixture and allele frequencies correlated model. The method described by [44] was used to estimate the most probable K value for the analyzed data, using the web tool Structure Harvester ver. 0.6. application [45].
Different measurements of within breed genetic variations, namely, observed number of alleles (Na), effective number of alleles (Ne), observed heterozygosity (Ho), and Nei’s unbiased expected heterozygosity (He) [46], were estimated using POPGENE software v1.32 [47]. Polymorphic information content (PIC) for each locus was calculated by the formula given by [48]:
PIC = 1   - i = 1 P i 2 i = 1 j = i + 1 P i 2 P j 2 ,
where, Pi and Pj are frequencies of the ith and jth alleles, respectively.
The allele data frequencies were used to assess if there was any bottleneck in the mithun population in recent history using BOTTLENECK software v1.2.02 [49]. The BOTTLENECK program was used to measure the genetic bottleneck through the test of gene diversity excess relative to that of under mutation-drift equilibrium. Reduction in the population genetic signatures was determined by the Wilcoxon’s heterozygosity excess test, the null hypothesis of the test being that all loci are in mutation-drift equilibrium. Three mutation models of microsatellite evolution were considered: Infinite allele model (IAM), Stepwise Mutation Model (SMM), and Two-Phase Model (TPM).
The allelic data were subjected to estimation of genetic distances among genotypes using simple matching coefficients by bootstrapping 1000 times and they were clustered using a neighbor-joining method using Darwin software version 6.0 [50]. Furthermore, an analysis of molecular variance (AMOVA) was performed to describe variance components among individuals and the population differentiation among the seven assumed subpopulations using GeneAlEx 6.502 program [51] with 1000 permutations. Principal coordinate analysis (PCoA) was performed to highlight the resolving power of the ordination and the first two components were used to represent the genotypes in the graphical form. PCoA and dissimilarity matrix was performed by using DARwin software version. 6.0. Genetic differentiation among the assumed subpopulation was analyzed using Nei’s gene diversity statistics using GenAlEx program version 6.502.

2.6. Mitochondrial DNA Statistical Analysis

The raw DNA sequences were analyzed manually using EditSeq (DNASTAR/Lasergene 11.0, Madison, Wisconsin, USA) and the online Nucleotide BLAST program (https://blast.ncbi.nlm.nih.gov/Blast.cgi, accessed on 10 January 2022) was used for alignment to construct consensus sequences. No gaps in the aligned sequences were permitted in the final analysis. We compared the 21 CYTB haplotypes of a 1021 bp fragment of mitochondrial DNA region obtained from 71 bovine samples from India. Diversity parameters including haplotype diversity (Hd), nucleotide diversity (π) within bovine populations, and average number of sequence differences (k) were estimated by Arlequin 3.1 [52].

3. Results

In total, 19 (63%) out of 30 cattle microsatellite markers (Table S1) revealed successful amplification patterns in 163 maithuna and 10 gaur samples, while the remaining 11 cattle-specific microsatellite markers failed to yield any amplification. Based on prior information on PCR products’ sizes, 19 microsatellite loci were grouped into four sets, containing five (ETH225, HAUT27, BM1818, LSTS030, and ETH185), four (HEL1, ETH3, BM1824, and ILSTS034), five (MM12, ETH10, HEL13, ILSTS033, and ETH152) and five loci (CSSM66, BM2113, ILSTS006, ILSTS011, and ILSTS054), respectively (Table 1). Fifteen of the positive clones which were sequenced and analyzed for presence of mithun-specific microsatellite repeats were submitted in GenBank (Accession KF564956-KF564970, Table 1). Genotype data collected from the 19 amplified microsatellites were used for genetic diversity studies of Indian mithun and wild gaur populations.

3.1. SSR Polymorphism among the Mithun, Gaur, and Tho-tho Population

The number of alleles, allele size, and polymorphism information content (PIC) detected among 163 mithun, 10 gaur, and 25 Tho-tho samples using 19 SSR markers is presented in Table 1. In the present diversity analysis, the PIC value ranged from 0.30 for HAUT27 to 0.89 for ILSTS006 microsatellite, with an average of 0.63 for mithun. PIC values in gaur population ranged from 0.32 for CSSM66 to 0.82 for LSTS030. In Tho-tho cattle the PIC value ranged 0.43 (ETH3) to 0.88 (CSSM66) (Table 1). The ILSTS006 and LSTS030 microsatellite showed higher discriminatory power to distinguish genotypes due to its high PIC value. A total of 15 microsatellite (79%) markers out of the 19 microsatellite loci were highly polymorphic and showed high PIC value (>0.50) in both mithun and gaur genotypes. Sixteen markers were highly polymorphic for Tho-tho population.

3.2. Population Genetic Diversity

The individual genetic diversity of mithun and gaur population is presented in Table 1. A total of 254 and 89 alleles were detected in Mithun and Gaur with allele numbers ranging from 8 to 25 in Mithun and 2 to 7 in gaur. The Tho-tho population comprised 136 alleles with allele number ranging 3 to 12 (Table 1). Hence, each of the panel of 15 microsatellites—Panel 1 (ETH225, BM1818, ILSTS030, ETH185, HEL1, ETH3, ILSTS034, MM12, HEL13, ILSTS033, ETH152, CSSM66, BM2113, ILSTS006, and ILSTS011) and Panel 2 (HAUT27, BM1818, ILSTS030, ETH185, HEL1, ETH3, BM1824, ILSTS034, MM12, HEL13, ETH152, BM2113, ILSTS006, ILSTS011 and ILSTS054)—from the FAO standard panel for cattle diversity studies appear to be most suitable for diversity studies in Indian mithun and Gaur, respectively, due to their high informativeness. The observed heterozygosity (Ho) ranged from 0.15 to 0.94 in mithun with an average of 0.48 and 0.01 to 0.99 in gaur with an average of 0.62 across all 19 loci, while expected heterozygosity and gene diversity (He) ranged from 0.31 to 0.89 in mithun, with an average of 0.66 and 0.36 to 0.83 in gaur with an average of 0.71, respectively, across all 19 loci. The observed and expected heterozygosity for Tho-tho population was 0.33–0.92 and 0.59–0.93, respectively. The average observed and expected heterozygosity was found to be 0.75 and 0.77, respectively, for the Tho-tho population.
The overall observed heterozygosity (Ho) ranged from 0.226 to 0.867 with an average of 0.54 across all 19 loci in the present study, comprising animals from the mithun, gaur, and Tho-tho cattle population. The total observed heterozygosity (0.54) was far lower than the total expected heterozygosity (0.858), which is supported by a low gene flow (Nm) value (Table 2). Average FIS and FIT values were 0.29 and 0.377 (Table 2), respectively, which is obvious and has indicated less inbreeding in the mithun, gaur, and Tho-tho cattle population due to the cross-bred nature of reproduction. Gene diversity ranged from 0.524 (BM1824) to 0.876 (CSSM66), with an average of 0.745.

3.3. Genetic Relationship among the Germplasm

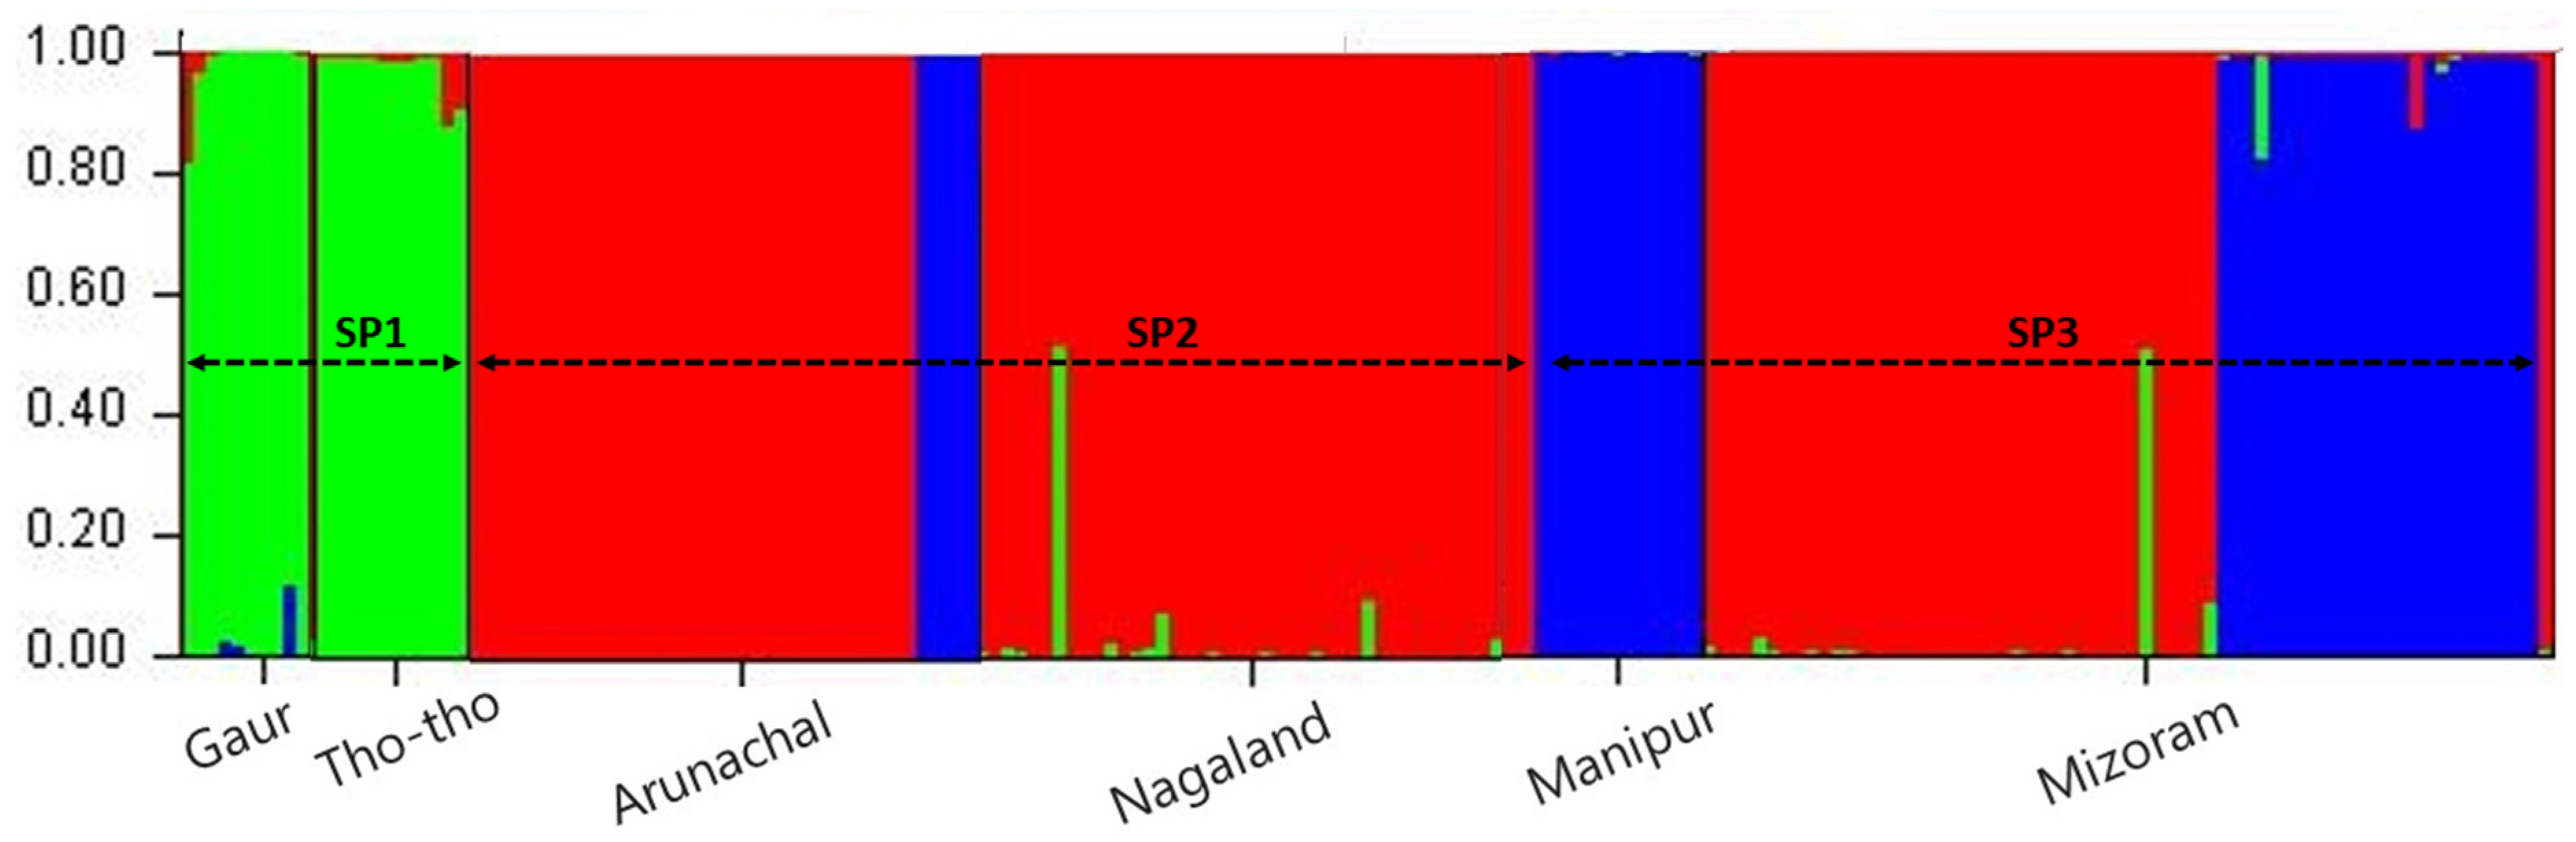
In the present study grouping of mithun, gaur, and Tho-tho population was determined using STRUCTURE analysis. Population structure of the 185 genotypes (163 mithun, 10 Gaur, and 25 Tho-Tho) was analyzed using a Bayesian model-based clustering approach with the k value ranging from 1 to 10 with 10 iterations using 19 polymorphic microsatellite markers data. The ΔK was found higher for K = 3 than other values of K and the standard deviation was least at K = 3. Hence, the true number of the populations was considered as three (SP1, SP2, and SP3), which revealed that in the present study, all the bovine populations (mithun, gaur, and Tho-tho) can be clustered into three subgroups. Genotypes under different subpopulations were categorized as pure or admixture based on the membership fractions. The accessions stratified in a particular subpopulation with the probability of ≥80% were considered as pure and assigned to corresponding subgroups, while <80% were categorized as admixture (Figure 2).
Based on STRUCTURE analysis, the subpopulation SP1 comprised Tho-tho cattle and gaur. Subpopulation SP2 consists of mithun population from Arunachal Pradesh and Nagaland, while subpopulation SP3 consists of mithun population from Manipur and Mizoram. The distinct subpopulations were obtained as per geographical locations and species.
Among the subpopulations, the SP3 was highly differentiated from SP2 (FST = 0.146) and SP1 (FST = 0.095), followed by differentiation between SP2 and SP1 (FST = 0.080). Subpopulation SP3 consists of mithuns from Manipur and Mizoram. This genetic difference might be attributed to natural selection favoring a different group of alleles in different niches or ecosystems and geographical barriers such as mountains, rivers, and valleys, which leads to low cross breeding or migration of genes/alleles between different subpopulations. This is further supported by moderate gene flow values among subpopulations.
The genetic diversity at subpopulation was studied in terms of the mean number of alleles (Na), number of effective alleles (Ne), Shannon’s information index (I), observed heterozygosity (Ho), gene diversity, unbiased expected heterozygosity (uHe), and wright’s fixation index (f), which is presented in Table 3. The Ne, I, and F are comparable among subpopulations. The highest number of effective alleles was present in the SP1 population, which consists of the gaur and Tho-tho cattle population. The lowest number of effective alleles was found in the SP2 population. This indicated that the SP1 population is more stable in the long term and has more buffering genes for wider adaptability. Shannon’s information index varied from 2.20 (SP1) to 1.58 (SP2). An analysis of Shannon’s information index revealed that the SP1 population is different from the SP2 and SP3 populations by showing the highest Shannon’s information index. The highest gene diversity was observed in subpopulation SP1.

3.4. Analysis for Molecular Variance

The three subpopulations obtained from the structure analysis were subjected to AMOVA, to measure the percentage of molecular variance between subpopulations, among individuals and within individuals. AMOVA revealed the presence of 15% of the variation among populations and 29% of variation among individuals, whereas 56% of variation was present within individuals (Table 4). AMOVA estimates indicated that most of the variation in mithun germplasm is present within individuals. Lower FIS (0.336) and FIT (0.436) estimated at subpopulation level (Table 4) in the entire population indicated the presence of a high amount of heterozygosity because of the cross-bred nature of mithun, gaur, and Tho-tho cattle. The FST value of 0.151 (Table 4) indicates distinctness and presence of genetic variation among the subpopulations of mithuns.
Pairwise FST values of the subpopulation range from 0.080 to 0.146 (Table 5) and showed significant differentiation among all the pairs, which suggested that all the three subpopulation were significantly different from each other. Based on the pairwise FST estimate, SP2 and SP3 showed the highest level of differentiation from each other and subpopulation SP1 exhibited less differentiation from SP2 and SP3.
Nei’s genetic distance varied from 0.626 to 1.397. The maximum distance was observed between subpopulation SP1 and SP3, and minimum distance was observed between SP1 and SP2 (Table 6). This is supported by a low gene flow between SP1 and SP3.

3.5. Neighbor-Joining Based Clustering

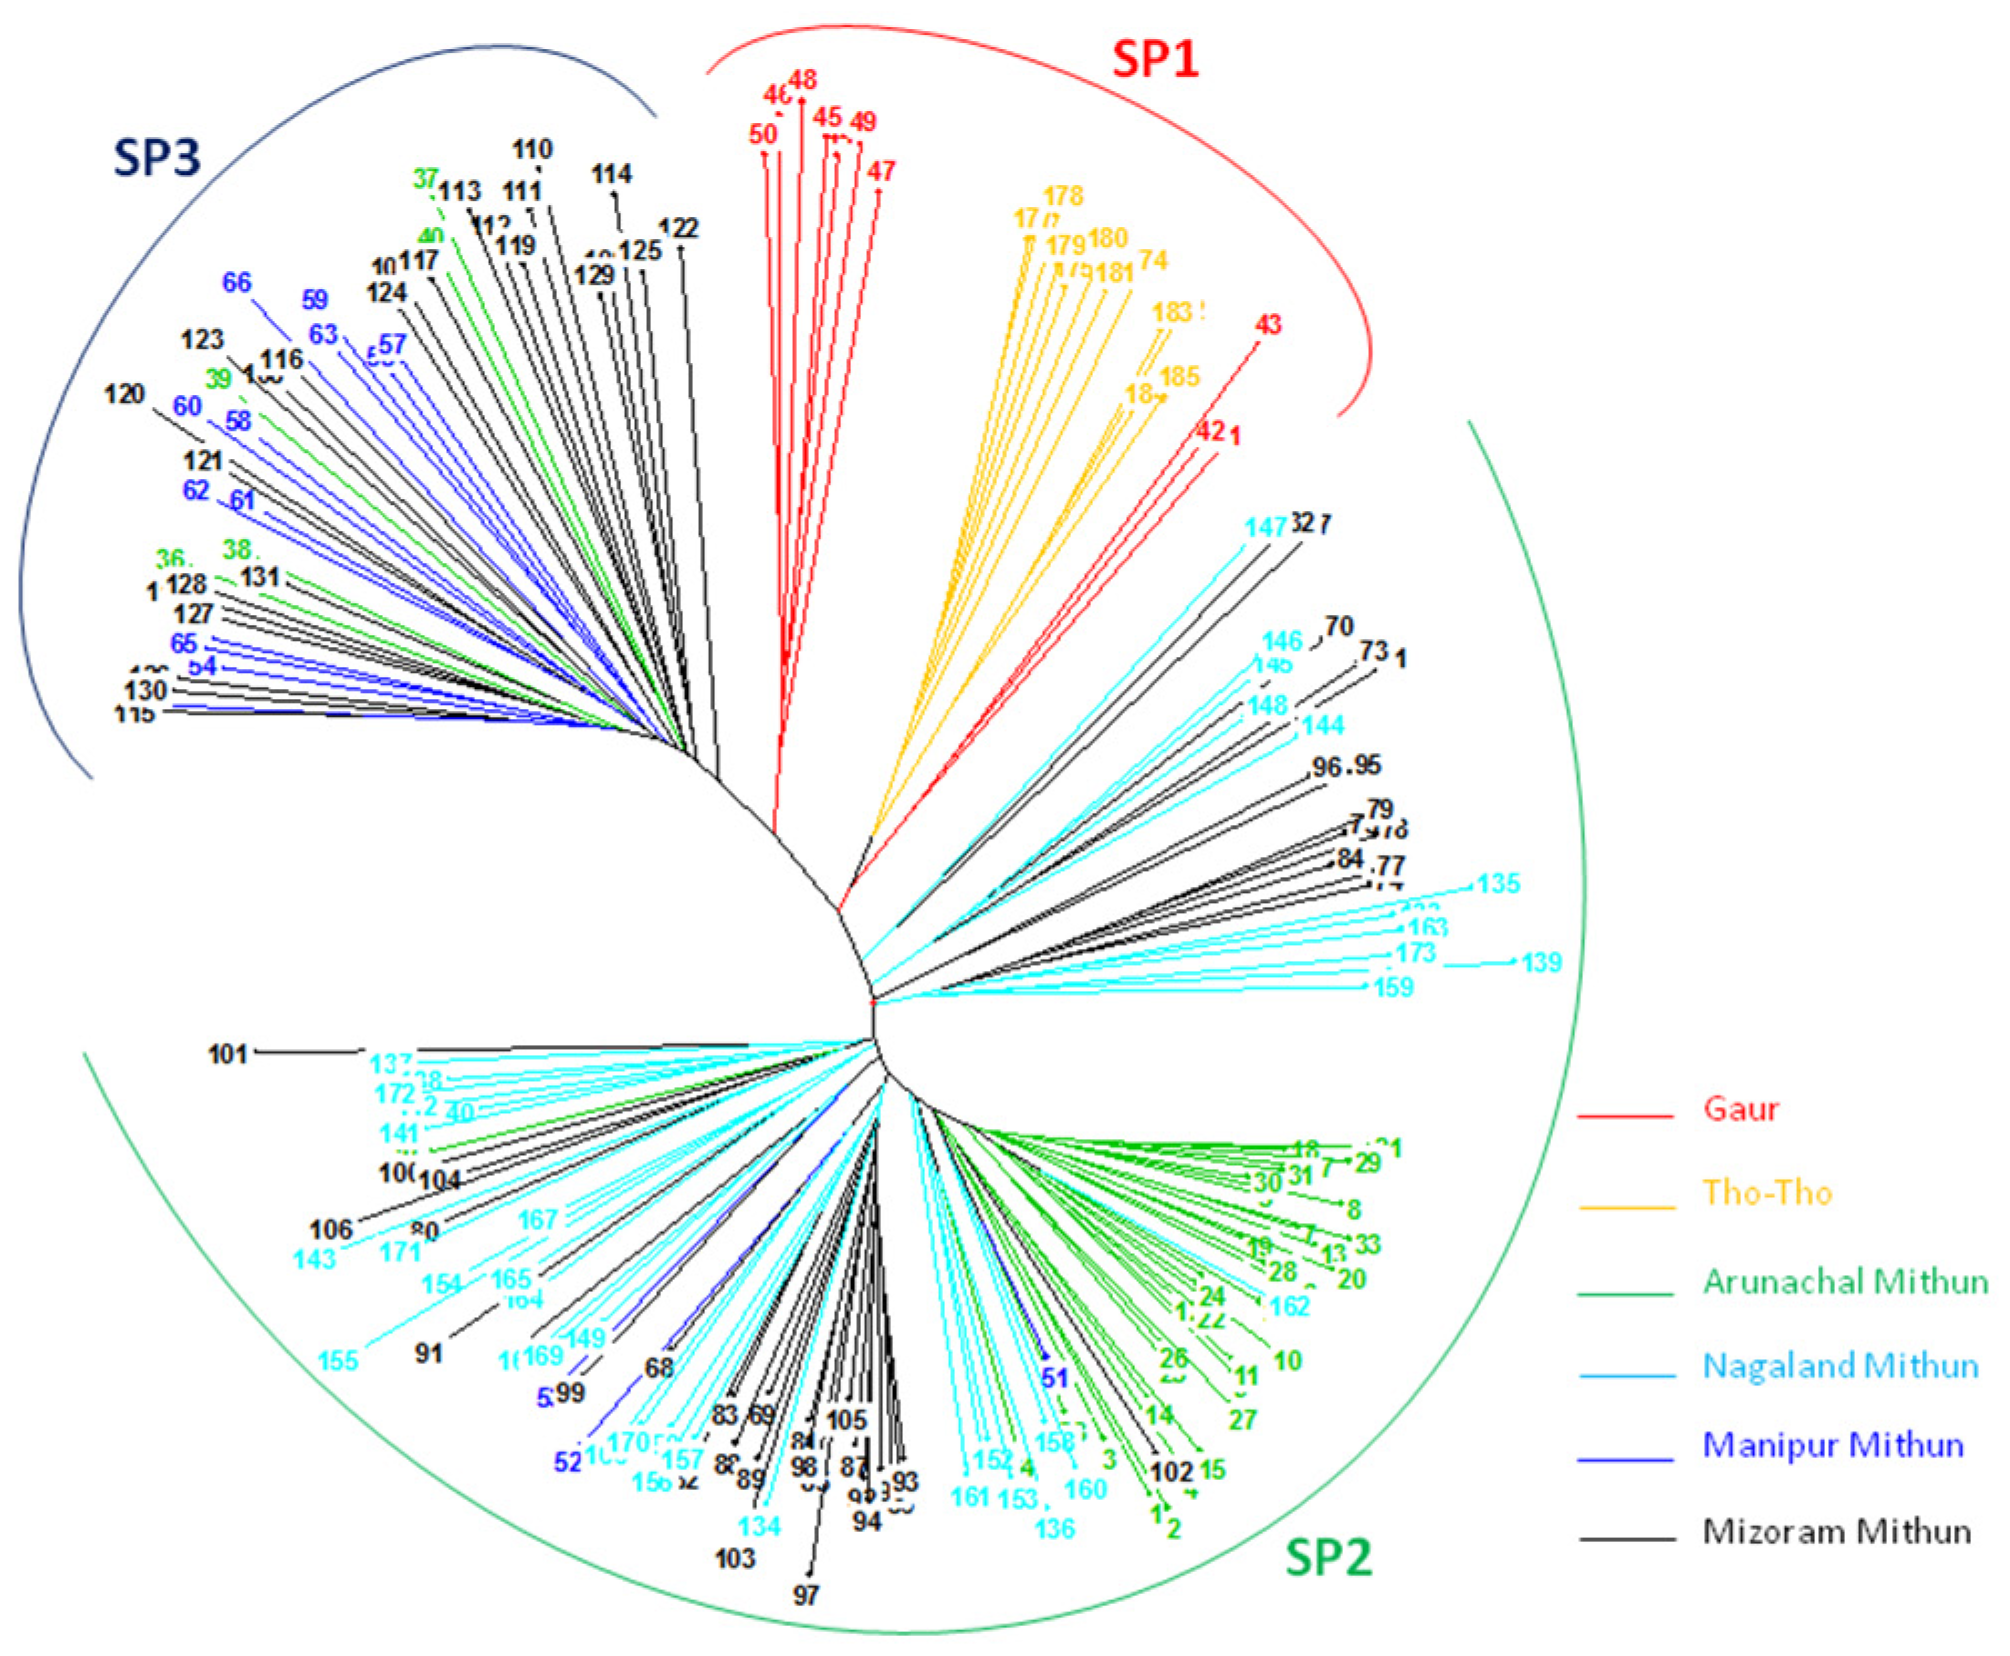
An unrooted neighbor-joining cluster analysis based on unweighted method using the 19 SSR marker allelic data classified the 185 bovines (mithun, guar, and Tho-tho) into three clusters (
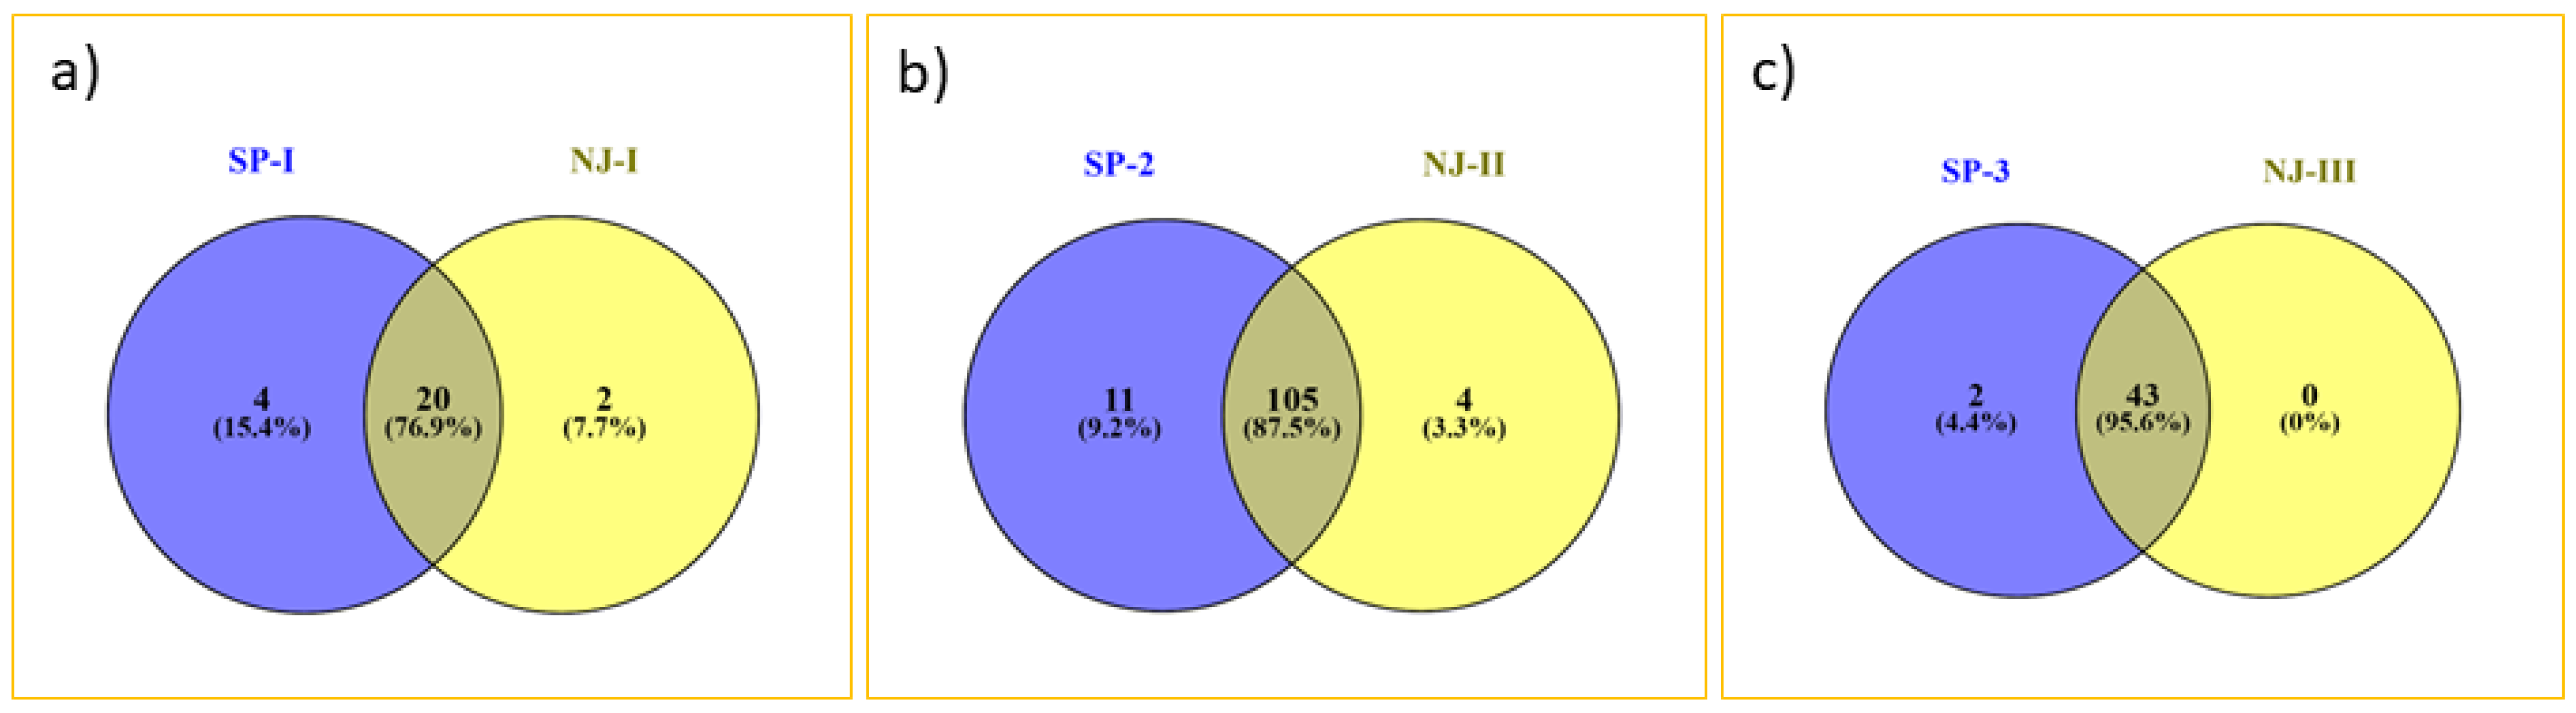
Figure 3). The result of distance-based neighbor-joining cluster analysis is similar to the model-based grouping pattern. Gaur and Tho-tho cattle are grouped adjacent to each other but distinct from each other. Nagaland and Arunachal mithuns were grouped in cluster 2, whereas Manipur and Mizoram mithuns were clustered in cluster 3. Few of Mizoram mithuns have shown close similarity with Nagaland mithuns. This cluster analysis revealed the presence of significant amount of genetic diversity among the bovine cattle population. The results of grouping pattern generated by the model-based STRUCTURE analysis were compared with distance based neighbor-joining cluster analysis using a Venn diagram (Figure 4 Venn). Cluster-I, based on the neighbor-joining analysis, showed 76.9% of similarity of genotypes with subpopulation SP1 generated through the model-based analysis. Cluster-II exhibited 95.6% of similarity of genotypes with the subpopulation SP2. Similarly, 87.5% of correspondence was observed between Cluster-III and the SP3 subpopulation.

3.6. Principal Component Analysis (PCA)

The PCA based on 19 micro-satellite allelic datapoints determined the genetic relatedness among the bovine cattle population. The first two coordinates of PCA explained the 28.69% of variation and clearly distinguished the three subpopulations obtained from the STRUCTURE analysis. The first coordinate of PCA explained 24.96% of the variation and the second coordinate explained 3.73% of the variation (Figure S1). The PCA result showed good correspondence with the neighbor-joining clustering and STRUCTURE grouping patterns.

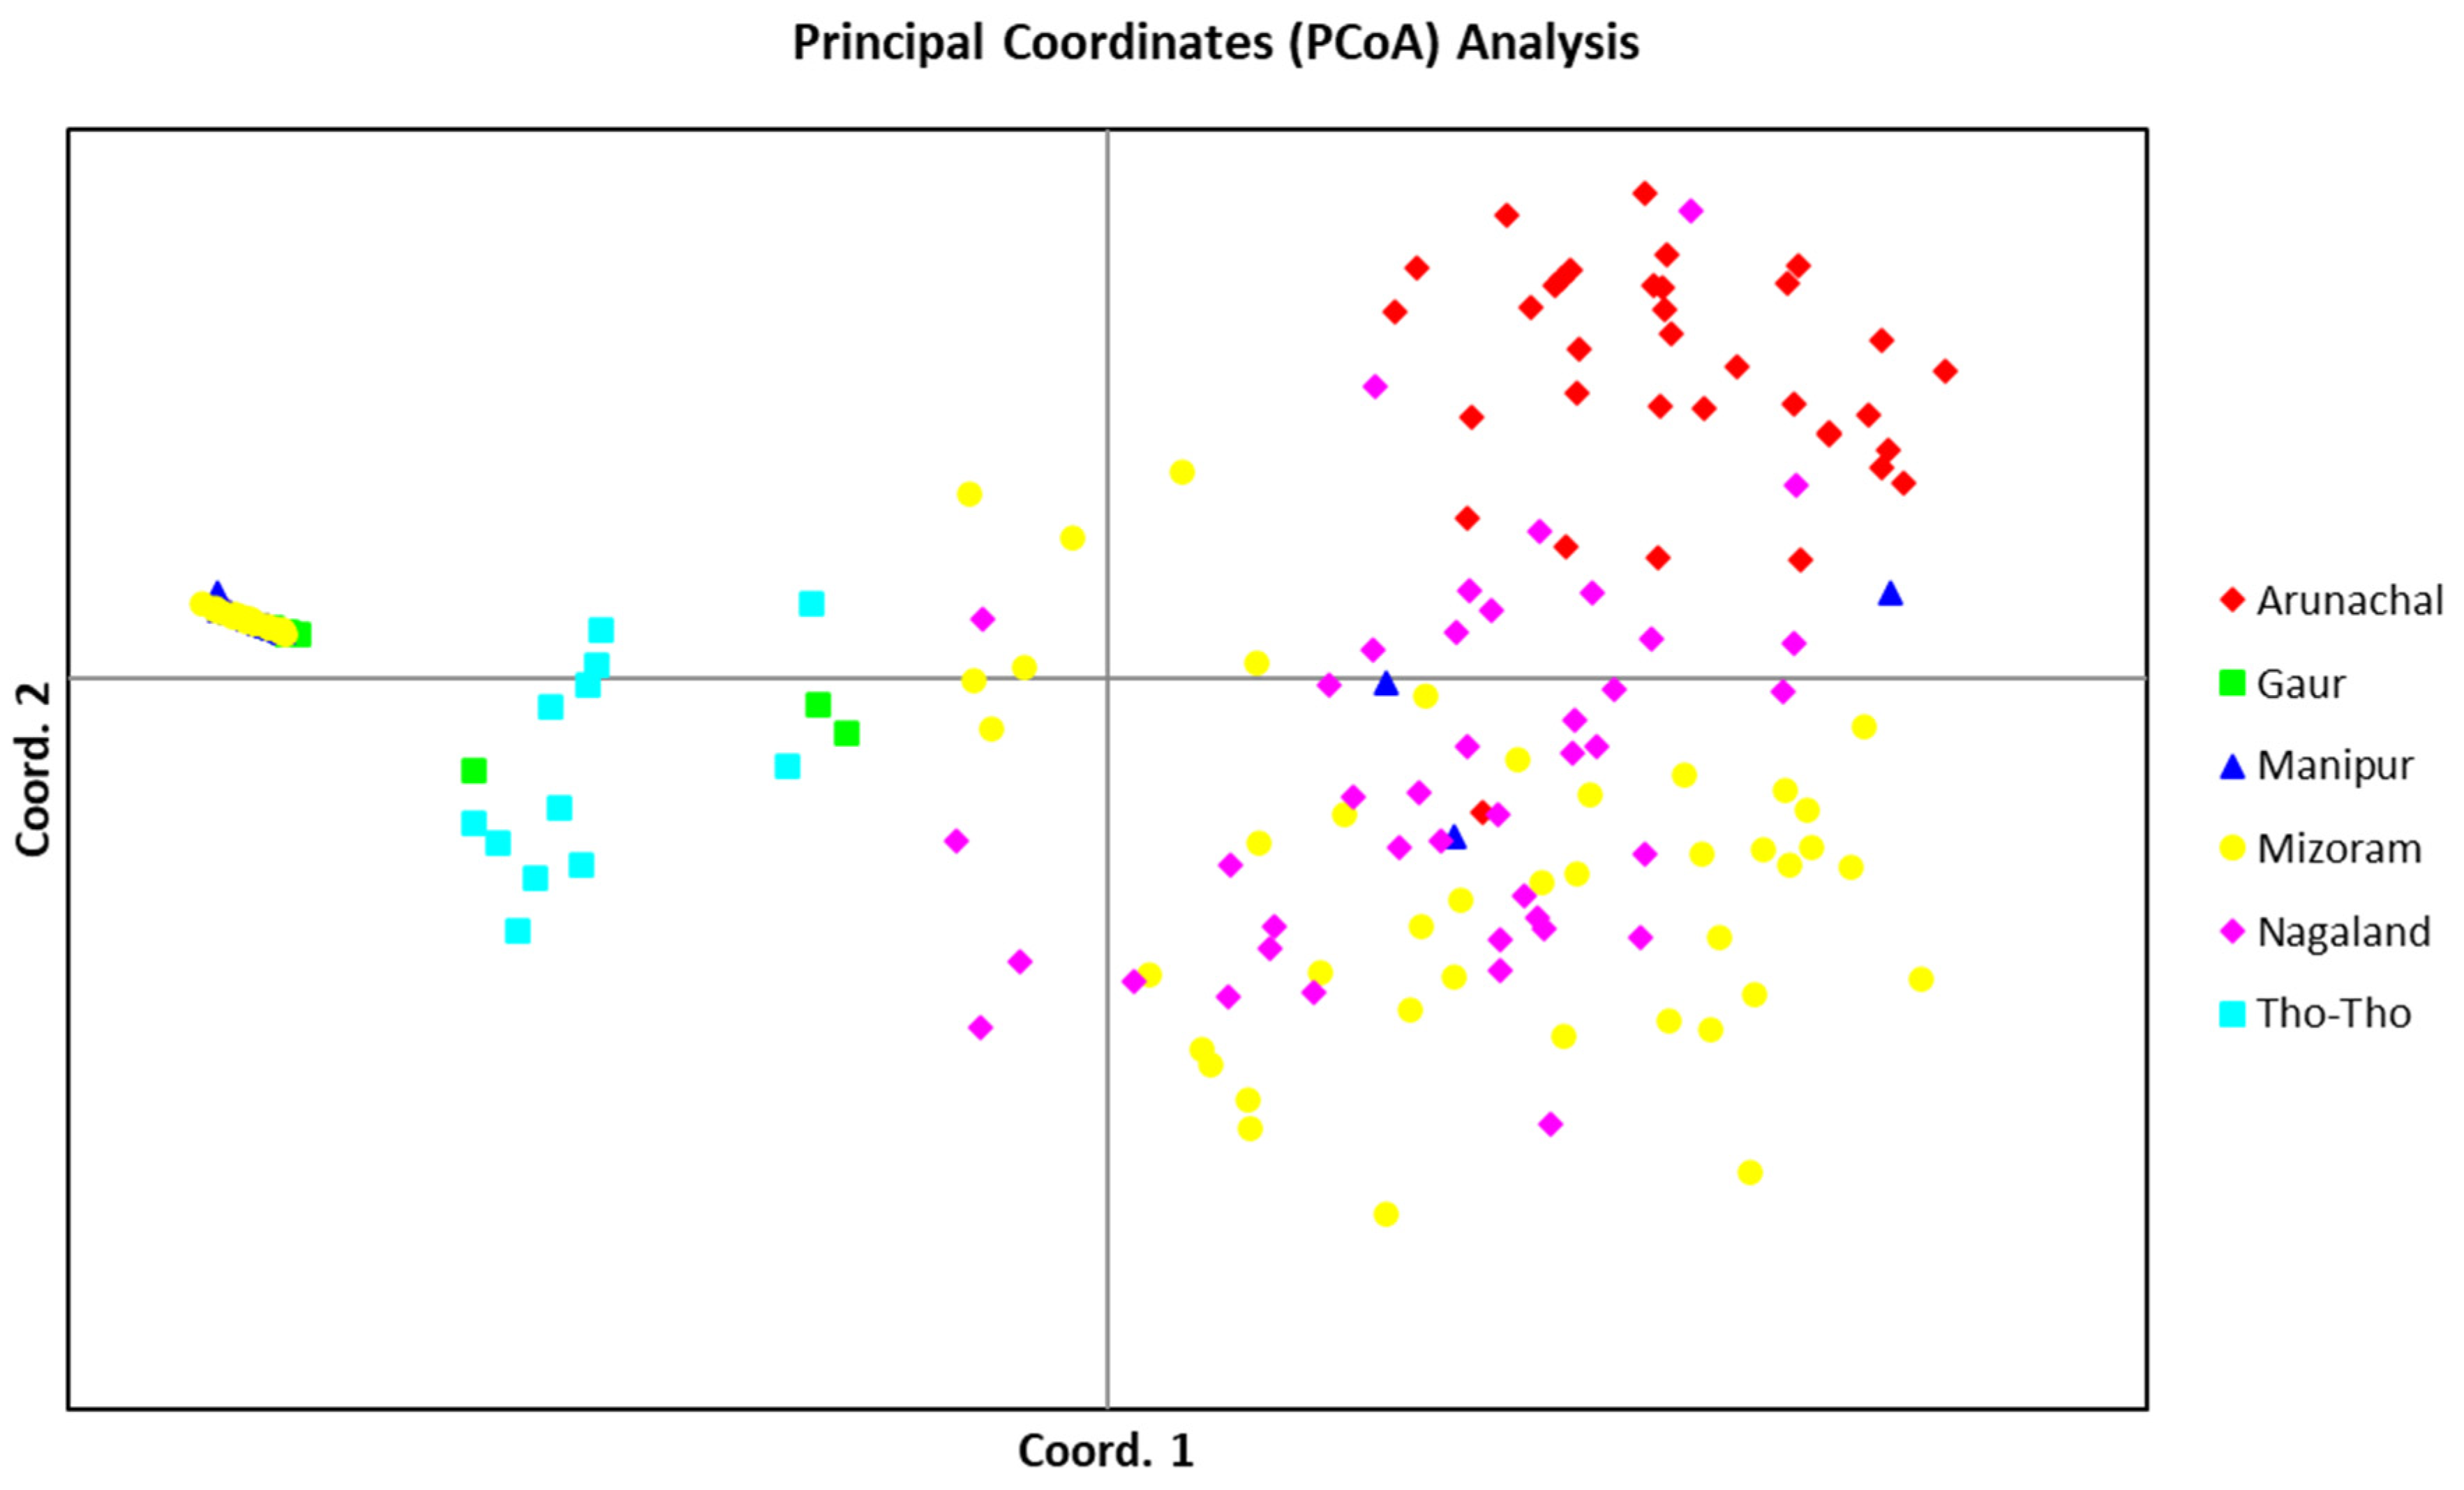
3.7. Principal Coordinate Analysis (PCoA)

The PCoA, using allelic data of 19 SSR markers, determined the patterns of variation among the three bovine populations (Mithun, Gaur, and Tho-Tho). The PCoA analysis also clearly separated the STRUCTURE subpopulations (Figure 5). Gaur and Tho-tho cattle grouped close to each other in the same group-I, similar to model-based subpopulation 1. However, gaur and Tho-tho have distinct subgroups within group-I. This result is similar to the neighbor-joining clustering pattern and further supported the results of the neighbor-joining clustering, and indicated that gaur and Tho-tho are different from each other. The PCoA results for Nagaland and Arunachal mithun, along with a few Mizoram mithun grouped in top right-side group-II, are similar to the model-based STRUCTURE analysis. Similarly, Manipur and Mizoram mithun grouped in the top left-side of group-III, similar to the model-based SP3 subpopulation grouping.
The outcome of the distance-based neighbor-joining tree, PCoA, and PCA analysis were highly congruent with the results of the model-based STRUCTURE analysis, which indicated the accurate grouping of mithun, gaur, and Tho-tho genotypes and further supported the results of STRUCTURE. These analyses revealed that mithun, gaur, and Tho-tho cattle are different populations and distinct from each other.

3.8. Hardy–Weinberg Test

All 19 microsatellite loci showed significant deviation from the Hardy–Weinberg equilibrium (p < 0.05) in Indian mithun and gaur. Estimates of within-population inbreeding coefficient (FIS) as per [53] were 30.00% and 6.50% in the mithun and gaur population, respectively, which was high and positive (p < 0.05).

3.9. Bottleneck Effect

Our bottleneck analysis exhibited significant heterozygosity excess under IAM model in the mithun, gaur, and Tho-tho cattle population (p < 0.01), while heterozygosity excess was detected only in the gaur population (p < 0.05) in the TPM model. No heterozygosity excess was found in any population in the SMM model. This revealed a minor genetic bottleneck in recent history only in the gaur population.
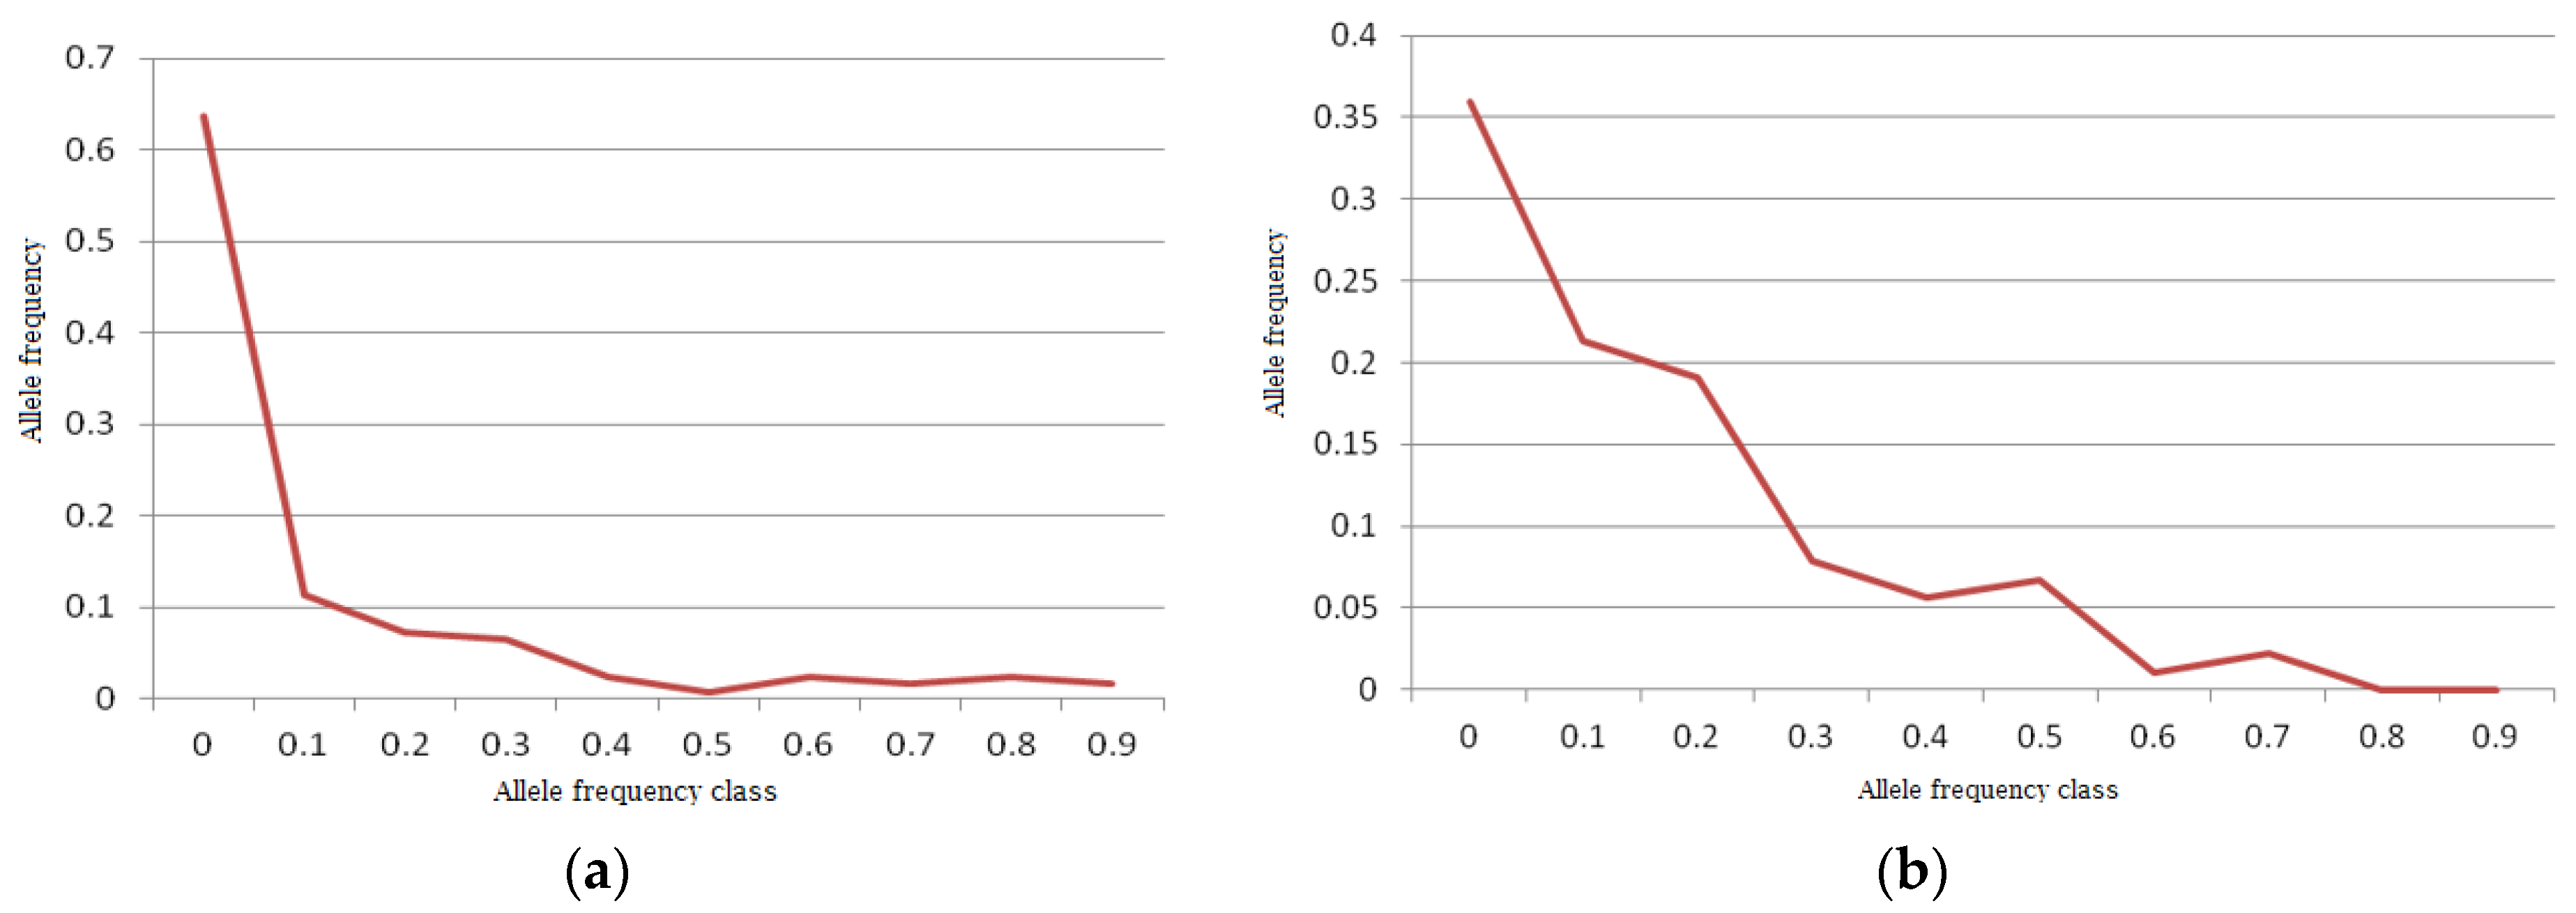
A normal L-shaped distribution of allelic frequencies was found in the bottleneck analysis in the Indian mithun population by the qualitative graphical test (Figure 6a). There was no mode-shift found in the distribution of allelic frequencies, showing the absence of any genetic bottleneck in the Indian mithun population, similar to Yunnan mithun [54]. However, the gaur population was found to have shifted mode, indicating the presence of a bottleneck in recent history, as the distribution of allelic frequency did not form an exact L-shaped distribution (Figure 6b).

3.10. Mitochondrial Genetic Variability

A fragment of 1021 bp transmembrane protein coding CYTB gene of mtDNA was explored resulting in identification of 961 variable sites. We identified 21 haplotypes with an average diversity of 0.62 (Table 7). An overall estimate for population indices revealed nucleotide diversity of 0.058 and average expected heterozygosity of 0.926. These indices indicated sufficient mtDNA diversity among the analyzed breeds.
The gene diversity examined on the basis of CYTB bp reflected the highest diversity in Mizoram mithun and the lowest in Arunachal mithun as well as gaur. However, the number of polymorphic sites was found to be highest in gaur, while the lowest number was found in Tho-tho cattle. Regarding mithun species only, all the breeds had a similar number of polymorphic sites, except Arunachal mithun, which was very low. The polymorphic sites converged to very few haplotypes, where Manipur mithun was having six haplotypes while gaur had only two haplotypes. The expected heterozygosity was highest in gaur and lowest in Manipur and Nagaland mithun. The highest nucleotide diversity was seen in Gaur, while the lowest was in Tho-tho. With regard to mithun breeds, the highest nucleotide diversity was in Mizoram mithun and the lowest was in Arunachal mithun.
The phylogenetic relationship between different species and the various breeds of mithun was visualized by constructing a phylogenetic tree (Figure S2) and a cladogram (Figure S3). Tho-tho cattle was the most distinct, which formed a separate clade than the other considered species in the study. The other ones, mithun and gaur, formed a group which further separated into different clades as expected. Among the species, B. gaurus was genetically closer to Mizoram mithun as compared to other breeds.

4. Discussion

This is the first research investigation on genetic diversity analysis in Indian mithuns, Indian Bison/wild gaurs, and Tho-tho cattle employing bovine microsatellite markers following secondary guidelines of FAO.

4.1. Genetic Diversity

Maintaining sufficient diversity of livestock is necessary to ensure their adaptation and development in the context of global climate change [55]. The observed heterozygosity values in mithun and gaur were significantly (p < 0.05) lower than the average expected heterozygosity (Nei’s unbiased mean heterozygosity) in both mithuns and gaur, respectively. This indicated presence of overall low heterozygosity and low to medium genetic diversity in Indian mithun and gaur populations, which was similar to Yunnan mithuns [54]. Comparable results were also obtained by [56] with mean Ho (0.53), He (0.49), and PIC (0.44). The average observed heterozygosity value (Ho = 0.269) of the Vietnamese gaur population was reported to be lower with a statistically significant difference than the average expected heterozygosity (He = 0.298) [37]. Based on HD SNP array data, the genetic diversity in terms of average heterozygosity in two mithun populations was 0.17–0.25 [57]. A low proportion of polymorphic markers (58.1) has been reported for Vietnamese wild gaur due to their low effective population size [31]. The low heterozygosity might be due to non-random mating structure in mithuns with a few bigger bulls getting more chances to mate with females, and a smaller population size. However, studies in Kherigarh cattle [58] showed higher observed heterozygosity, which might be due to the availability of a larger population in cattle than mithuns. Total observed heterozygosity was far lower than total expected heterozygosity, which is supported by a low gene flow (Nm) value (Table 2). If the observed heterozygosity is lower than expected, we seek to attribute the discrepancy to forces such as inbreeding. We also assume here that more alleles may have been observed in the guar and Tho-tho if the sample size was larger.
The microsatellite markers amplified from the FAO panel for cattle diversity studies appeared to be suitable for diversity studies in Indian mithun and gaur. In another study [56], 14 microsatellite loci were amplified for Bhutanese mithun. The 121 bp allele at the BM2113 locus was observed in the mithun and gaur populations only and not in Tho-tho cattle, which suggested it may possibly be a mithun- and gaur-specific allele. Non-amplification of ILSTS005 locus in Indian mithun and wild gaur indicated absence of this sequence in both these species which was in agreement with the observations of the phylogenetic analysis of the tribe Bovini using microsatellites [34] and in wild gaur [37], who also reported that this cattle microsatellite marker failed to amplify both in mithan (mithun) and gaur.
Low mtDNA diversity was reflected in Arunachal mithun and gaur, which might be due to the absence of any additional source for increased diversity. A low genetic diversity in the current study may be assigned to the small population size and repeated introduction of animals from same source over the years. Low mtDNA diversity is likely to occur in the wild population due to the presence of small number of founder females [59,60,61,62]. It has been already stated by [63] that the gaur population is anticipated to fall by 30% within the next three decades due to habitat loss, poaching for its meat and horns, and fatal diseases. The population can be statistically analyzed comprehensively and immediate steps could be taken to design and implement strategies for the conservation of threatened germplasm. Higher genetic diversity of Mizoram mithun was observed, which can be due to the emphasis on programmed breeding strategies [64]. Mithun and gaur were in a similar clade before the species diversified into their breeds, which is supported by the hypothesis that mithun and gaur were the direct descendants and might have originated from the same wild bovine, which has been previously reported in other studies using the Cytochrome b gene [65,66]
Mithun is supposed to have originated from the erstwhile Indo-Burma (present-day Myanmar) border [1]. Out of the three hypotheses regarding the origin of Mithun [2], different studies have reported different opinions and supported either of these three hypotheses, without any conclusive view [6,7,8,9,10,12]. Most of these earlier studies were based on a small sample size. However, our study, based on a considerably larger dataset (163 mithun samples), was sampled from all four Indian states with mithun populations. Our results have shown that using microsatellites as well as mtDNA markers (complete Cytochrome B gene sequence), mithun is grouped constantly in the same genetic clade with gaur (Indian Bison), which is depicted phylogenetically (Figure S2), and which is branching out from a common origin point/ancestor. This indicated that mithun and gaur might have originated from the same wild bovine, which is now extinct.
Our result from this study is consistent with another study using SNP genotyping data [57], where mithun population was found to be in the same genetic clade with wild gaur, suggesting both mithun and guar had a common origin/ancestor, which is now extinct.

4.2. AMOVA

Overall, the FIS values estimated in mithun and gaur population were low to medium. Low inbreeding in gaur may be because of it being wild and undomesticated, with migration of gaur between forest locations. When three subpopulations were considered, FIS was estimated to be 0.336. The overall population inbreeding estimate (FIS) has been reported to be 0.056 (p < 0.001) and the subdivision estimate (FST) is 0.054 between mithun populations from two different farms [56]. No inbreeding was concluded due to random mating in the population. Farm and field mithun showed a close genetic connection (FST = 0.03) and the estimated FIS was lower in the field (0.02) than in the farm population (0.06) [57]. Another study [67] on mithuns from Bangladesh using the Illumina BovineSNP50 BeadChip revealed a mean expected heterozygosity of 0.148 ± 0.14 with a heterozygote deficiency of 0.06 (FIS). Tenzin et. al. [56] showed that 5% of total variation between populations, 37% among individuals, and 58% within individuals. Our subpopulations were more distant (15% among population) due to the different subspecies classification and we obtained similar within-individual variation (57%). A high within-individual variation is a result of high expression of genetic drift due to small population size [68].

4.3. Population Differentiation

Both pair-wise population differentiation (FST) and Nei’s genetic distance differentiated SP2 and SP3 the farthest, which shows high degree of within-species mithun population differentiation due to geographical isolation. The lowest differentiation was observed between SP1 and SP2, which may indicate a closer relationship between Nagaland and Arunachal mithun with gaur or Tho-tho. A close relationship (Nei’s distance) between mithun farms was observed by Tenzin et al. [56]. One study has [57] reported a uniform genetic background of mithun populations, with few possible signs of indicine admixture. The same study grouped farm and field mithuns with a gaur, yak, and bison cluster, separated from taurine cattle (N’Dama and Holstein) and indicine cattle. Furthermore, Treemix results of the same study indicated a considerable genetic similarity between Indian mithun and gaur. STRUCTURE analysis on Bhutanese mithun [56] from two populations showed that the animals have not undergone genetic differentiation. Additionally, they have low genetic diversity and very low/no inbreeding. At K = 2, the populations did not cluster distinctly to the inferred populations. No clear differentiation of two populations further supports the absence of distinct genetic characteristic between the farms. Similarly, STRUCTURE analysis conducted [57] at K = 4 to K = 7 could not differentiate farm and field mithun distinctly, but together, they differentiated well from other bovine subspecies.
A close correspondence was observed between the results of STRUCTURE, AMOVA, and FST analysis. These analysis results revealed that mithun, gaur, and Tho-tho cattle population have adequate genetic diversity and moderate population structure. The diversity among mithun was observed to be in correspondence to their geographical locations. The majority of Arunachal and Nagaland mithun are grouped together and are distinct from Manipur, Mizoram mithuns. Conversely, mithuns of Mizoram showed genetic similarity with Manipur mithuns, which indicates that Mithun initially migrated from the western Myanmar region to the eastern region of Mizoram and further migrated to other hill regions, such as Manipur, Nagaland, and Arunachal Pradesh.

4.4. HWE

All the microsatellite loci in our study showed significant deviation from the Hardy–Weinberg equilibrium (p < 0.05) in Indian mithuns, gaur, and Tho-tho cattle. Significant deviation (p < 0.001) from HWE was also observed in Vietnamese gaur population, indicating a heterozygote deficit [37]. Other than inbreeding, such deviation may also result from the presence of non-amplifying alleles, which could have contributed to the deficiency of heterozygotes. Cattle-derived micro-satellite markers are expected to perform less in other related subspecies, being less polymorphic and contributing a higher proportion of null alleles.
The significant deviation from the Hardy–Weinberg equilibrium (p < 0.05) in Indian mithuns and gaurs at all the loci might be due to heterozygote deficiency under a small population size. A high degree of the within-population inbreeding estimate in the Indian mithun population was possibly due to the fact that the mating system was non-random; probably, the bigger bulls had more chances for mating within the herd and there were fewer chances of gene flow into the herd due to non-introduction of external germplasm, resulting in a deviation of the population from the Hardy–Weinberg equilibrium. However, a lower level of inbreeding observed in the wild gaur population was probably due to the zoo policy of introducing gaur bulls from outside into the zoo herd from time to time. The study also further validates the fact that the normal practice of tribal mithun owners of a particular clan shun any exchange of their mithuns with other clans or tribal society and possibly assortative mating practiced within the mithun groups, giving rise to a highly inbred mithun population or heterozygote deficiency.

4.5. Bottleneck

The normal L-shaped distribution of allelic frequencies in the bottleneck analysis without any mode-shift by the qualitative graphical test showed the absence of a genetic bottleneck in the Indian mithun and Tho-tho cattle population. Similar to our results, in an earlier study conducted on mithun [56], there was no recent bottleneck as per a mode-shift distortion graph. This was also similar to the reports in Kherigarh cattle [58], Banni buffalo [69], and Nagpuri buffalo [70]. A bottleneck analysis indicated that in spite of lower heterozygosity and a small population size, there is no such evidence of genetic bottleneck in the Indian mithun population so far, which is an encouraging fact. However, genetic bottleneck was observed in wild gaur population, which was expected and may be attributed to small population size of wild gaur under zoo and forest condition. This type of genetic bottleneck was also reported in other wild species, namely European bison [71] and giant panda [72]. However, this genetic bottleneck may not be indicative of any low reproductive capacity of wild gaurs, as no such evidence is present. This is the first study of a genetic bottleneck in the Indian mithun and wild gaur population.
The lack of a recent bottleneck supports the lack of inbreeding in these populations and presence of optimum population size at the source [73]. A higher number of short and medium ROH (250 kb–1 Mb, 1–2 Mb, 2–4 Mb, and 4–8 Mb) have been reported than longer categories (8–16 Mb and >16 Mb) in farm and field mithun populations. This indicates shared ancestors long ago and can be indicative of a selective sweep, ancient inbreeding, or bottleneck. Lower estimates of mean FROH indicated larger effective population sizes in the past [57]. There was no mode-shift found in the distribution of allelic frequencies, showing the absence of any genetic bottleneck in the Indian mithun population, similar to Yunnan mithun [54]. Alleles with low frequencies (0.01–0.1) are the most numerous in Senegalese bovine populations and the distribution of allele frequencies followed the normal L-shaped form, which indicates these cattle have not experienced recent genetic bottleneck [74]. Despite small population of Bhutanese mithun, there was no recent bottleneck as per the mode-shift distortion graph [56], similar to our study.

5. Conclusions

Our study revealed medium to high within breed genetic diversity in the Indian mithun, gaur, and Tho-tho cattle population, implying moderate genetic differentiation among these bovine species. Absence of any recent genetic bottleneck in the mithun, and Tho-tho and minor genetic bottleneck in the gaur, in spite of very low population size is encouraging for ongoing genetic improvement and conservation efforts.
This study also demonstrated that the cattle microsatellite markers can be used effectively on the mithun and gaur population, which generated valuable information regarding the present genetic status of these rare bovine species. The present level of heterozygosity in the Indian mithuns, gaur, and Tho-tho population was adequate. These findings have helped towards the development and introduction of a rational breeding policy for mithuns in their native tracts and for the wild gaurs for future genetic improvement of these unique bovines and their conservation, which are under threat of extinction.

Supplementary Materials

The following are available online at https://www.mdpi.com/article/10.3390/d14070548/s1, Figure S1: PCA analysis clustering the structured subpopulations separately, Figure S2: Neighbor-joining (NJ) tree showing phylogenetic relation based on the Nei’s distances among mithun, wild gaur, and Tho-tho cattle from the North Eastern Hill Region of India; Figure S3: phylogenetic tree from the Mithun Cytb gene sequence, Table S1: Characterization of 30 cattle microsatellite markers tested in Indian Mithuns and wild gaur.

Author Contributions

Conceptualization, S.M. and A.M.; Formal analysis, S.M., S.B., I.L. and M.M.; Project administration, M.H.K.; Resources, K.K., K.V. and S.K. (Suresh Kumar); Software, S.K. (Sanjeev Kumar) and H.V.; Supervision, C.R.; Writing—original draft, S.M.; Writing—review and editing, O.T. and S.N.J. All authors have read and agreed to the published version of the manuscript.

Funding

This research was funded by ICAR-NRC on Mithun, Medziphema 797106, Nagaland, and the Department of Biotechnology, Govt. of India, New Delhi, India Grant No. BT/27/NE/TBP/2010. The APC was not funded by any agency.

Institutional Review Board Statement

The study was conducted according to the guidelines of the Declaration of Helsinki, and approved by the Institutional Ethics Committee of ICAR-NRC on Mithun (NRCM/IAEC/2020(01)/10, dated 26 August 2020).

Data Availability Statement

Data supporting this paper were generated by ICAR-NRC on Mithun. The SSR data are available from the Data Cell of the Institute and should be requested directly from the corresponding author or the institute.

Acknowledgments

The authors are extremely thankful to ICAR-NRC on Mithun, Nagaland and Dept. of Biotechnology, Govt. of India, New Delhi for funding this study. The authors would like to thank the field veterinarians and mithun owners/farmers for their participation and cooperation in the collection of mithun blood sampling from the field. We also acknowledge the kind permission of the Executive Director, Chamarajendra Zoological Garden, Mysore 570004, Karnataka, India for the gaur blood samples to carry out the study.

Conflicts of Interest

The authors declare no conflict of interest. The funders had no role in the design of the study; in the collection, analyses, or interpretation of data; in the writing of the manuscript, or in the decision to publish the results.

References

  1. Simoons, F.J.; Simoons, E.S. A Ceremonial Ox of India; the Mithan in Nature, Culture, and History, with Notes on the Domestication of Common Cattle; University of Wisconsin Press: Madison, WI, USA, 1968. [Google Scholar]
  2. Simoons, F.J. Gayal or Mithun. In Evolution of domesticated Animals; Manson, I.L., Ed.; Evolution of Domesticated Animals: London, UK, 1984; pp. 34–39. [Google Scholar]
  3. Winter, H.; Mayr, B.; Schleger, W.; Dworak, E.; Krutzler, J.; Kalat, M. Genetic Characterisation of the Mithun (Bos frontalis) and Studies of Spermatogenesis, Blood Groups and Haemoglobins of Its Hybrids with Bos Indicus. Res. Vet. Sci. 1986, 40, 8–17. [Google Scholar] [CrossRef]
  4. Gallagher, D.S.; Womack, J.E. Chromosome Conservation in the Bovidae. J. Hered. 1992, 83, 287–298. [Google Scholar] [CrossRef] [PubMed]
  5. Li, S.P.; Chang, H.; Ma, G.L.; Cheng, H.Y. Molecular Phylogeny of the Gayal in Yunnan China Inferred from the Analysis of Cytochrome b Gene Entire Sequences. Asian Australas. J. Anim. Sci. 2008, 21, 789–793. [Google Scholar] [CrossRef]
  6. Tanaka, K.; Takizawa, T.; Murakoshi, H.; Dorji, T.; Nyunt, M.M.; Maeda, Y.; Yamamoto, Y.; Namikawa, T. Molecular Phylogeny and Diversity of Myanmar and Bhutan Mithun Based on MtDNA Sequences: Molecular Phylogeny and Diversity of Mithun. Anim. Sci. J. 2011, 82, 52–56. [Google Scholar] [CrossRef] [PubMed]
  7. Baig, M.; Mitra, B.; Qu, K.; Peng, M.; Ahmed, I.; Miao, Y.-W.; Zan, L.; Zhang, Y. Mitochondrial DNA Diversity and Origin of Bos frontalis. Curr. Sci. 2013, 104, 115–120. [Google Scholar]
  8. Lan, H.; Xiong, X.; Lin, S.; Liu, A.; Shi, L. Mitochondrial DNA polymorphism of cattle (Bos taurus) and mithun (Bos frontalis) in Yunnan Province. Yi Chuan Xue Bao 1993, 20, 419–425. [Google Scholar]
  9. Gou, X.; Wang, Y.; Yang, S.; Deng, W.; Mao, H. Genetic Diversity and Origin of Gayal and Cattle in Yunnan Revealed by MtDNA Control Region and SRY Gene Sequence Variation. J. Anim. Breed. Genet. 2010, 127, 154–160. [Google Scholar] [CrossRef]
  10. Mei, C.; Wang, H.; Zhu, W.; Wang, H.; Cheng, G.; Qu, K.; Guang, X.; Li, A.; Zhao, C.; Yang, W.; et al. Whole-Genome Sequencing of the Endangered Bovine Species Gayal (Bos frontalis) Provides New Insights into Its Genetic Features. Sci. Rep. 2016, 6, 19787. [Google Scholar] [CrossRef] [Green Version]
  11. Walker, E.P. Mammals of the World; Hopkins: Baltimore, MD, USA, 1968; Volume III. [Google Scholar]
  12. Ma, G.; Chang, H.; Li, S.; Chen, H.; Ji, D.; Geng, R.; Chang, C.; Li, Y. Phylogenetic Relationships and Status Quo of Colonies for Gayal Based on Analysis of Cytochrome b Gene Partial Sequences. J. Genet. Genom. 2007, 34, 413–419. [Google Scholar] [CrossRef]
  13. Nath, N.C.; Verma, N.D. Biochemical evaluation of Mithun milk for human consumption. Indian Vet. J. 2000, 77, 418–423. [Google Scholar]
  14. Mondal, M.; Baruah, K.K.; Rajkhowa, C. Mithun: An Animal of Indian Pride. Livest. Res. Rural Dev. 2014, 26. Available online: http://www.lrrd.org/lrrd26/1/mond26006.html (accessed on 18 June 2022).
  15. DAHDF. 20th Livestock Census. Department of Animal Husbandry Dairying & Fisheries; Ministry of Fisheries, Animal Husbandry & Dairying, Government of India: New Delhi, India, 2019.
  16. Faruque, M.; Rahaman, M.; Hoque, M.; Ikeya, K.; Amano, T.; Han, J.; Dorji, T.; Omar, A. Present Status of Gayal (Bos frontalis) in the Home Tract of Bangladesh. Bang. J. Anim. Sci. 2015, 44, 75–84. [Google Scholar] [CrossRef]
  17. Duckworth, J.W.; Sankar, K.; Williams, A.C.; Samba Kumar, N.; Timmins, R.J. IUCN Bos Gaurus: The IUCN Red List of Threatened Species 2016: E.T2891A46363646. 2016. Available online: https://www.academia.edu/35167878/THE_IUCN_RED_LIST_OF_THREATENED_SPECIES (accessed on 10 January 2022).
  18. Dhali, A.; Chowdhury, H.; Mech, A.; Khate, K.; Rajkhowa, C.; Pundir, R.K.; Singh, P.K.; Singh, G.; Ahlawat, S.P.S. Tho-tho Cattle: Cattle Genetic Resources of India; NBAGR: Karnal, India, 2006; pp. 1–38.
  19. Wang, H.; Yang, B.; Wang, H.; Xiao, H. Impact of Different Numbers of Microsatellite Markers on Population Genetic Results Using SLAF-Seq Data for Rhododendron Species. Sci. Rep. 2021, 11, 8597. [Google Scholar] [CrossRef] [PubMed]
  20. Huang, J.; Li, Y.Z.; Du, L.M.; Yang, B.; Shen, F.J.; Zhang, H.M.; Zhang, Z.H.; Zhang, X.Y.; Yue, B.S. Genome-wide survey and analysis of microsatellites in giant panda (Ailuropoda melanoleuca), with a focus on the applications of a novel microsatellite marker system. BMC Genom. 2015, 16, 61. [Google Scholar] [CrossRef] [Green Version]
  21. Yang, W.; Zheng, J.; Jia, B.; Wei, H.; Wang, G.; Yang, F. Isolation of novel microsatellite markers and their application for genetic diversity and parentage analyses in sika deer. Gene 2018, 15, 68–73. [Google Scholar] [CrossRef] [PubMed]
  22. Wang, P.; Burley, J.T.; Liu, Y.; Chang, J.; Chen, D.; Lu, Q.; Li, S.H.; Zhou, X.; Edwards, S.; Zhang, Z. Genomic Consequences of Long-Term Population Decline in Brown Eared Pheasant. Mol. Biol. Evol. 2021, 38, 263–273. [Google Scholar] [CrossRef] [PubMed]
  23. Vieira, M.L.C.; Santini, L.; Diniz, A.L.; Munhoz, C.d.F. Microsatellite Markers: What they mean and why they are so useful. Genet. Mol. Biol. 2016, 39, 312–328. [Google Scholar] [CrossRef] [PubMed] [Green Version]
  24. Zimmerman, S.J.; Aldridge, C.L.; Oyler-McCance, S.J. An empirical comparison of population genetic analyses using microsatellite and SNP data for a species of conservation concern. BMC Genom. 2020, 21, 382. [Google Scholar] [CrossRef]
  25. Wang, H.; Gao, S.; Liu, Y.; Wang, P.; Zhang, Z.; Chen, D. A pipeline for effectively developing highly polymorphic simple sequence repeats markers based on multi-sample genomic data. Ecol. Evol. 2022, 12, e8705. [Google Scholar] [CrossRef]
  26. Agung, P.P.; Saputra, F.; Zein, M.S.A.; Wulandari, A.S.; Putra, W.P.B.; Said, S.; Jakaria, J. Genetic diversity of Indonesian cattle breeds based on microsatellite markers. Asian-Australas. J. Anim. Sci. 2019, 32, 467–476. [Google Scholar] [CrossRef]
  27. Webster, M.S.; Reichart, L. Use of microsatellites for parentage and kinship analyses in animals. Methods Enzymol. 2005, 395, 222–238. [Google Scholar]
  28. Seo, J.H.; Lee, J.H.; Kong, H.S. Assessment of genetic diversity and phylogenetic relationships of Korean native chicken breeds using microsatellite markers. Asian-Australas. J. Anim. Sci. 2017, 30, 1365–1371. [Google Scholar] [CrossRef] [PubMed]
  29. Silva de Deus, A.R.; Silva, G.R.; Sena, L.S.; Britto, F.B.; de Carvalho, D.A.; de Freitas, J.V.G.; Sarmento, J.L.R. Comparison of kinship estimates in Santa Inês sheep using microsatellite and genome-wide SNP markers. Small Rumin. Res. 2021, 201, 106399. [Google Scholar] [CrossRef]
  30. DeWoody, J.A.; Avise, J.C. Microsatellite variation in marine, freshwater and anadromous fishes compared with other animals. J. Fish Biol. 2000, 56, 461–473. [Google Scholar] [CrossRef]
  31. Raji, A.A.; Anderson, J.V.; Kolade, O.A.; Ugwu, C.D.; Dixon, A.G.; Ingelbrecht, I.L. Gene-Based Microsatellites for Cassava (Manihot EsculentaCrantz): Prevalence, Polymorphisms, and Cross-Taxa Utility. BMC Plant Biol. 2009, 9, 118. [Google Scholar] [CrossRef] [PubMed] [Green Version]
  32. Van Hooft, W.F.; Hanotte, O.; Wenink, P.W.; Groen, A.F.; Sugimoto, Y.; Prins, H.H.T.; Teale, A. Applicability of Bovine Microsatellite Markers for Population Genetic Studies on African Buffalo (Syncerus caffer): Microsatellite Markers for Population Genetic Studies. Anim. Genet. 1999, 30, 214–220. [Google Scholar] [CrossRef] [PubMed] [Green Version]
  33. Edwards, C.J.; Gaillard, C.; Bradley, D.G.; MacHugh, D.E. Y-specific Microsatellite Polymorphisms in a Range of Bovid Species. Anim. Genet. 2000, 31, 127–130. [Google Scholar] [CrossRef] [PubMed] [Green Version]
  34. Ritz, L.R.; Glowatzki-Mullis, M.; MacHugh, D.E.; Gaillard, C. Phylogenetic Analysis of the Tribe Bovini Using Microsatellites. Anim. Genet. 2000, 31, 178–185. [Google Scholar] [CrossRef]
  35. Navani, N.; Jain, P.K.; Gupta, S.; Sisodia, B.S.; Kumar, S. A Set of Cattle Microsatellite DNA Markers for Genome Analysis of Riverine Buffalo (Bubalus bubalis): Microsatellite DNA Markers for Buffalo Genome Analysis. Anim. Genet. 2002, 33, 149–154. [Google Scholar] [CrossRef]
  36. Kim, K.-S.; Min, M.-S.; An, J.-H.; Lee, H. Cross-Species Amplification of Bovidae Microsatellites and Low Diversity of the Endangered Korean Goral. J. Hered. 2004, 95, 521–525. [Google Scholar] [CrossRef] [Green Version]
  37. Nguyen, T.T.; Genini, S.; Bui, L.C.; Voegeli, P.; Stranzinger, G.; Renard, J.-P.; Maillard, J.-C.; Nguyen, B.X. Genomic Conservation of Cattle Microsatellite Loci in Wild Gaur (Bos gaurus) and Current Genetic Status of This Species in Vietnam. BMC Genet. 2007, 8, 77. [Google Scholar] [CrossRef] [Green Version]
  38. FAO. Molecular Genetic Characterization of Animal Genetic Resources. In Animal Production and Health Guidelines; Commission on Genetic Resources for Food and Agriculture Food and Agriculture Organization of the United Nations: Rome, Italy, 2011. [Google Scholar]
  39. Loftis, D.G.; Echelle, A.A.; Koike, H.; Van Den Bussche, R.A.; Minckley, C.O. Genetic Structure of Wild Populations of the Endangered Desert Pupfish Complex (Cyprinodontidae: Cyprinodon). Conserv. Genet. 2009, 10, 453–463. [Google Scholar] [CrossRef]
  40. Galtier, N.; Nabholz, B.; Glémin, S.; Hurst, G.D.D. Mitochondrial DNA as a Marker of Molecular Diversity: A Reappraisal. Mol. Ecol. 2009, 18, 4541–4550. [Google Scholar] [CrossRef] [PubMed]
  41. Sambrook, J.; Fritsch, E.R.; Maniatis, T. Molecular Cloning: A Laboratory Manual, 2nd ed.; Cold Spring Harbor Laboratory Press: Cold Spring Harbor, NY, USA, 1989. [Google Scholar]
  42. Irwin, D.M.; Kocher, T.D.; Wilson, A.C. Evolution of the Cytochromeb Gene of Mammals. J. Mol. Evol. 1991, 32, 128–144. [Google Scholar] [CrossRef]
  43. Pritchard, J.K.; Stephens, M.; Donnelly, P. Inference of Population Structure Using Multilocus Genotype Data. Genetics 2000, 155, 945–959. [Google Scholar] [CrossRef]
  44. Evanno, G.; Regnaut, S.; Goudet, J. Detecting the Number of Clusters of Individuals Using the Software Structure: A Simulation Study. Mol. Ecol. 2005, 14, 2611–2620. [Google Scholar] [CrossRef] [PubMed] [Green Version]
  45. Earl, D.A.; von Holdt, B.M. Structure Harvester: A Website and Program for Visualizing STRUCTURE Output and Implementing the Evanno Method. Conserv. Genet. Resour. 2012, 4, 359–361. [Google Scholar] [CrossRef]
  46. Nei, M. Molecular Evolutionary Genetics; Columbia University Press: New York, NY, USA, 1987; ISBN 978-0-231-88671-0. [Google Scholar]
  47. Yeh, F.C.; Boyle, T.; Rongcai, Y.; Ye, Z.; Xian, J.M. Popgene, Version 1.32. A Microsoft Window Based Free Ware for Population Genetic Analysis; University of Alberta: Edmonton, AB, USA, 1999. [Google Scholar]
  48. Botstein, D.; White, R.L.; Skolnick, M.; Davis, R.W. Construction of a Genetic Linkage Map in Man Using Restriction Fragment Length Polymorphisms. Am. J. Hum. Genet. 1980, 32, 314–331. [Google Scholar]
  49. Piry, S.; Luikart, G.; Cornuet, J.-M. Computer Note. BOTTLENECK: A Computer Program for Detecting Recent Reductions in the Effective Size Using Allele Frequency Data. J. Hered. 1999, 90, 502–503. [Google Scholar] [CrossRef]
  50. Perrier, X.; Jacquemoud-Collet, J.P. DARwin Software. 2006. Available online: http://darwin.cirad.fr/darwin (accessed on 10 January 2022).
  51. Peakall, R.; Smouse, P.E. GenAlEx 6.5: Genetic Analysis in Excel. Population Genetic Software for Teaching and Research—An Update. Bioinformatics 2012, 28, 2537–2539. [Google Scholar] [CrossRef] [Green Version]
  52. Excoffier, L.; Lischer, H.E.L. Arlequin Suite Ver 3.5: A New Series of Programs to Perform Population Genetics Analyses under Linux and Windows. Mol. Ecol. Resour. 2010, 10, 564–567. [Google Scholar] [CrossRef]
  53. Wright, S. Evolution and the Genetics of Natural Population; University of Chicago Press: Chicago, IL, USA, 1978; Volume 4. [Google Scholar]
  54. Kai-Xing, Q. Genetic Diversity and Bottleneck Analysis of Yunnan Mithun (Bos frontalis) Using Microsatellite Loci. Afr. J. Biotechnol. 2012, 11, 2912–2919. [Google Scholar] [CrossRef]
  55. Boettcher, P.J.; Hoffmann, I.; Baumung, R.; Drucker, A.G.; McManus, C.; Berg, P.; Stella, A.; Nilsen, L.B.; Moran, D.; Naves, M.; et al. Genetic Resources and Genomics for Adaptation of Livestock to Climate Change. Front. Genet. 2015, 5, 461. [Google Scholar] [CrossRef] [Green Version]
  56. Tenzin, S.; Dorji, J.; Dorji, T.; Kawamoto, Y. Assessment of Genetic Diversity of Mithun (Bos frontalis) Population in Bhutan Using Microsatellite DNA Markers. Anim. Genet. Resour. 2016, 59, 1–6. [Google Scholar] [CrossRef]
  57. Mukherjee, A.; Mukherjee, S.; Dhakal, R.; Mech, M.; Longkumer, I.; Haque, N.; Vupru, K.; Khate, K.; Jamir, I.Y.; Pongen, P.; et al. High-Density Genotyping Reveals Genomic Characterization, Population Structure and Genetic Diversity of Indian Mithun (Bos frontalis). Sci. Rep. 2018, 8, 10316. [Google Scholar] [CrossRef] [PubMed] [Green Version]
  58. Pandey, A.K.; Sharma, R.; Singh, Y.; Prakash, B.B.; Ahlawat, S.P.S. Genetic Diversity Studies of Kherigarh Cattle Based on Microsatellite Markers. J. Genet. 2006, 85, 117–122. [Google Scholar] [CrossRef] [PubMed]
  59. Atkulwar, A.; Farah, S.; Gadhikar, Y.; Baig, M. Mitochondrial DNA Diversity in Wild Gaur (Bos gaurus): Evidence from Extant and Historical Samples. Mitochondrial DNA Part B 2020, 5, 1556–1560. [Google Scholar] [CrossRef] [Green Version]
  60. Md-Zain, B.M.; Abdul-Aziz, A.; Mohd-Yusuf, N.S.; Norsyamimi, R.; Rovie-Ryan, J.J.; Karuppannan, K.V.; Zulkifli, N.A.; Yaakop, S. Sequence Variation of Captive Malayan Gaur (Bos gaurus hubbacki) Based on Mitochondrial D-Loop Region DNA Sequences. Biodiversitas 2018, 19, 1601–1606. [Google Scholar] [CrossRef]
  61. Wang, W.; Zheng, Y.; Zhao, J.; Yao, M. Low Genetic Diversity in a Critically Endangered Primate: Shallow Evolutionary History or Recent Population Bottleneck? BMC Evol. Biol. 2019, 19, 134. [Google Scholar] [CrossRef]
  62. Wang, W.; Qiao, Y.; Li, S.; Pan, W.; Yao, M. Low Genetic Diversity and Strong Population Structure Shaped by Anthropogenic Habitat Fragmentation in a Critically Endangered Primate, Trachypithecus leucocephalus. Heredity 2017, 118, 542–553. [Google Scholar] [CrossRef] [Green Version]
  63. Kamalakkannan, R.; Bhavana, K.; Prabhu, V.R.; Sureshgopi, D.; Singha, H.S.; Nagarajan, M. The Complete Mitochondrial Genome of Indian Gaur, Bos Gaurus and Its Phylogenetic Implications. Sci. Rep. 2020, 10, 11936. [Google Scholar] [CrossRef]
  64. Decker, J.E.; Pires, J.C.; Conant, G.C.; McKay, S.D.; Heaton, M.P.; Chen, K.; Cooper, A.; Vilkki, J.; Seabury, C.M.; Caetano, A.R.; et al. Resolving the Evolution of Extant and Extinct Ruminants with High-Throughput Phylogenomics. Proc. Natl. Acad. Sci. USA 2009, 106, 18644–18649. [Google Scholar] [CrossRef] [Green Version]
  65. Xu, H.; Luo, X.; Qian, J.; Pang, X.; Song, J.; Qian, G.; Chen, J.; Chen, S. FastUniq: A Fast De Novo Duplicates Removal Tool for Paired Short Reads. PLoS ONE 2012, 7, e52249. [Google Scholar] [CrossRef] [Green Version]
  66. Bernt, M.; Donath, A.; Jühling, F.; Externbrink, F.; Florentz, C.; Fritzsch, G.; Pütz, J.; Middendorf, M.; Stadler, P.F. MITOS: Improved de Novo Metazoan Mitochondrial Genome Annotation. Mol. Phylogenetics Evol. 2013, 69, 313–319. [Google Scholar] [CrossRef] [PubMed]
  67. Uzzaman, M.R.; Edea, Z.; Bhuiyan, M.S.A.; Walker, J.; Bhuiyan, A.K.F.H.; Kim, K.-S. Genome-Wide Single Nucleotide Polymorphism Analyses Reveal Genetic Diversity and Structure of Wild and Domestic Cattle in Bangladesh. Asian-Australas. J. Anim. Sci. 2014, 27, 1381–1386. [Google Scholar] [CrossRef] [PubMed] [Green Version]
  68. Excoffier, L.; Smouse, P.E.; Quattro, J.M. Analysis of Molecular Variance Inferred from Metric Distances among DNA Haplotypes: Application to Human Mitochondrial DNA Restriction Data. Genetics 1992, 131, 479–491. [Google Scholar] [CrossRef] [PubMed]
  69. Mishra, B.P.; Kataria, R.S.; Kathiravan, P.; Bulandi, S.S.; Singh, K.P.; Sadana, D.K. Evaluation of Genetic Variability and Mutation Drift Equilibrium of Banni Buffalo Using Multi Locus Microsatellite Markers. Trop. Anim. Health Prod. 2009, 41, 1203–1211. [Google Scholar] [CrossRef]
  70. Kataria, R.S.; Sunder, S.; Malik, G.; Mukesh, M.; Kathiravan, P.; Mishra, B.P. Genetic Diversity and Bottleneck Analysis of Nagpuri Buffalo Breed of India Based on Microsatellite Data. Genetika 2009, 45, 941–948. [Google Scholar] [CrossRef]
  71. Luenser, K.; Fickel, J.; Lehnen, A.; Speck, S.; Ludwig, A. Low Level of Genetic Variability in European Bisons (Bison bonasus) from the Bialowieza National Park in Poland. Eur. J. Wildl. Res. 2005, 51, 84–87. [Google Scholar] [CrossRef]
  72. Zhang, Y.; Wang, X.; Ryder, O.A.; Li, H.; Zhang, H.; Yong, Y.; Wang, P. Genetic Diversity and Conservation of Endangered Animal Species. Pure Appl. Chem. 2002, 74, 575–584. [Google Scholar] [CrossRef]
  73. Luikart, G. Distortion of Allele Frequency Distributions Provides a Test for Recent Population Bottlenecks. J. Hered. 1998, 89, 238–247. [Google Scholar] [CrossRef]
  74. Ndiaye, N.; Adama, S.; Saliou, N.; Sawadogo, G.; Sembene, M. Bottleneck and molecular variance analyses in Senegalese local cattle breeds using microsatellite markers. Res. Opin. Anim. Vet. Sci. 2015, 5, 158–164. [Google Scholar]
Figure 1. Indian map showing the approximate location of study populations (Mithun: 1, Tho-tho: 2, and Gaur: 3) and possible migration route of mithuns as per the direction of the arrows.
Diversity 14 00548 g001
Figure 2. Model-based grouping utilizing the STRUCTURE analysis clustered all the bovine populations into three subgroups (SP1, SP2, and SP3). SP1 = Gaur and Tho-tho samples; SP2 = Arunchal and Nagaland mithun samples; SP3 = Manipur and Mizoram mithun samples given different color codes, assuming K = 3.
Diversity 14 00548 g002
Figure 3. Unweighted and unrooted neighbor-joining cluster analysis. SP1 = Gaur and Tho-tho samples; SP2 = Arunchal and Nagaland mithun samples; SP3 = Manipur and Mizoram mithun samples.
Diversity 14 00548 g003
Figure 4. Venn diagrams depicting comparison of grouping patterns generated by STRUCTURE and neighbor-joining tree. SP1 = Gaur and Tho-tho samples; SP2 = Arunachal and Nagaland mithun samples; SP3 = Manipur and Mizoram mithun samples. (a) Venn diagram showing co-linearity between model-based sub-population SP1 & neighbor-joining based cluster 1. (b) Venn diagram showing co-linearity between model-based subpopulation SP2 & neighbor-joining based cluster 2. (c) Venn diagram showing co-linearity between model-based subpopulation SP3 & neighbor-joining based cluster 3.
Diversity 14 00548 g004
Figure 5. PCoA-based grouping of individuals belonging to different bovine populations of mithun, gaur, and Tho-tho with different color codings.
Diversity 14 00548 g005
Figure 6. Distribution of allelic in the Indian Mithun population ((a); typical L shape—no bottleneck) and gaur population ((b); mode shift observed—bottleneck) by the qualitative graphical test.
Diversity 14 00548 g006
Table 1. Bovine microsatellite markers tested for diversity analysis in Indian Mithuns, wild gaur, and Tho-tho cattle.
Multiplex PCR SetMarkersSpeciesAllele Size Range (bp)HoHePIC *Number of AllelesFISRepeatsGenBank Accession Number **
IETH225Mithun111–1590.180.560.54160.67(GT)-
Gaur139–14100.490.3721 -
Tho-Tho101–1490.330.830.7670.417 -
HAUT27Mithun110–1500.210.310.3100.33(TG)KF564959
Gaur128–1340.290.680.640.58 -
Tho-Tho108–1440.830.830.7780.02 -
BM1818Mithun218–2460.30.530.5180.44(TG)KF564962
Gaur214–24010.80.777−0.26 -
Tho-Tho214–2420.920.90.8511−0.33 -
LSTS030Mithun119–1550.610.70.65110.13(AC)KF564966
Gaur129–15510.830.827−0.21 -
Tho-Tho133–15310.810.757−0.22 -
ETH185Mithun136–1940.880.740.713−0.18--
Gaur172–18410.660.64−0.51 -
Tho-Tho172–17810.590.483−0.78 -
IIHEL1Mithun100–1480.430.590.57110.27(CA)-
Gaur134–1480.860.680.656−0.25 -
Tho-Tho136–1500.580.690.6150.16 -
ETH3Mithun180–2120.720.790.76100.09--
Gaur184–2160.570.780.7450.26 -
Tho-Tho204–21610.560.433−0.78 -
BM1824Mithun161–1970.310.360.34100.15(GT)KF564963
Gaur185–1990.430.610.5850.3 -
Tho-Tho181–1930.750.790.726−0.60 -
ILSTS034Mithun122–1640.780.850.84150.09(TG)KF564967
Gaur126–1580.710.690.676−0.03 -
Tho-Tho150–1540.920.690.593−0.53 -
IIIMM12Mithun90–1240.360.620.6150.42(CA)KF564957
Gaur94–1180.570.780.7560.26 -
Tho-Tho94–1160.580.810.7570.20 -
ETH10Mithun186–2400.150.390.38130.62(CA)KF564960
Gaur204–2120.290.450.4230.36 -
Tho-Tho204–2120.750.710.635−0.15 -
HEL13Mithun183–2230.940.840.8117−0.12(CA)KF564964
Gaur189–21310.730.76−0.36 -
Tho-Tho195–2130.830.7570.676−0.13 -
ILSTS033Mithun134–1580.330.680.64100.51(CA)KF564968
Gaur146–1620.140.520.4730.73 -
Tho-Tho138–1640.420.840.7880.21 -
ETH152Mithun187–2090.430.730.7120.4(TG)KF564956
Gaur189–2050.430.710.6650.4 -
Tho-Tho185–2050.750.850.798−0.08 -
IVCSSM66Mithun177–2230.330.780.75150.57(CA)KF564958
Gaur189–2170.430.360.323−0.2 -
Tho-Tho153–2180.830.930.88120.16 -
BM2113Mithun99–1490.510.820.8150.38(CA)KF564961
Gaur115–1270.710.70.644−0.02 -
Tho-Tho116–1370.580.890.83100.27 -
ILSTS006Mithun226–3000.460.890.89250.49(GT)KF564965
Gaur228–2660.710.670.645−0.06 -
Tho-Tho192–2660.580.880.8290.60 -
ILSTS011Mithun222–2880.810.820.8170.02(TG)KF564969
Gaur236–2580.710.730.6950.03 -
Tho-Tho236–2620.750.860.870.25 -
ILSTS054Mithun99–1530.290.50.47110.42(CA)KF564970
Gaur127–13310.560.53−0.78 -
Tho-Tho117–1450.920.920.87110.04 -
Average-Mithun-0.480.660.6313.370.3 -
Gaur-0.620.710.64.680.07 -
Tho-Tho-0.750.800.737.16−0.03 -
He = Expected heterozygosity; Ho = Observed heterozygosity; PIC = Polymorphic information content; * Microsatellites with PIC value > 0.50 are bold faced; ** GenBank Accession Number from this study.
Table 2. Global gene diversity and F-statistics for each of 19 SSR loci analyzed across three bovine populations (163 Mithun, 10 gaur, and 25 Tho-tho cattle).
LocusHtMean HeMean HoFISFITFSTNm
ETH2250.8840.7730.3190.5880.6390.1261.740
HAUT270.8530.7150.5120.2850.4000.1611.298
BM18180.8090.5730.2260.6070.7210.2920.607
LSTS0300.8850.7910.6890.1290.2220.1062.108
ETH1850.8740.8070.7180.1110.1790.0763.024
HEL10.7830.6150.3820.3790.5130.2140.916
ETH30.8890.7900.6040.2350.3200.1112.004
BM18240.8080.5240.3980.2410.5070.3510.463
ILSTS0340.8860.8480.8300.0210.0630.0435.580
MM120.8650.7250.3470.5220.5990.1621.292
ETH100.7560.5490.2450.5530.6760.2750.661
HEL130.8950.8410.867−0.0310.0310.0603.883
ILSTS0330.8750.7920.4270.4610.5130.0952.376
ETH1520.9000.8110.4170.4860.5370.0992.276
CSSM660.9230.8760.8430.0370.0860.0514.680
BM21130.8980.8480.7810.0800.1300.0554.317
ILSTS0060.9400.8530.5350.3730.4310.0922.467
ILSTS0110.8870.8470.6720.2070.2430.0455.301
ILSTS0540.6960.5730.4460.2220.3600.1761.167
Average0.8580.7450.5400.2900.3770.1362.429
Ht = Total expected heterozygosity, He = Gene Diversity, Ho = Observed heterozygosity, FIS = inbreeding coefficient, FIT = inbreeding coefficient to total, FST = Fixation index and Nm = Gene flow.
Table 3. Genetic diversity statistics of 163 Mithun, 10 gaur, and 25 Tho-tho cattle at subpopulation levels.
PopulationsNaNeIHoHeuHeF
SP113.05 ± 0.77.34 ± 0.452.20 ± 0.060.63 ± 0.050.85 ± 0.010.87 ± 0.010.26 ± 0.06
SP213.58 ± 1.33.96 ± 0.541.58 ± 0.130.51 ± 0.060.66 ± 0.040.66 ± 0.040.26 ± 0.06
SP313.58 ± 1.15.08 ± 0.621.85 ± 0.130.48 ± 0.060.73 ± 0.040.74 ± 0.040.37 ± 0.07
Na = Number of alleles, Ne = Number of effective alleles, I = Shannon’s information index, Ho = Observed Heterozygosity, He = Gene Diversity, uHe= Unbiased expected heterozygosity, F = fixation index.
Table 4. Analysis for molecular variance of 163 Mithun, 10 gaur, and 25 Tho-tho cattle populations (AMOVA).
SourcedfSSMSEst. Var.% of Variance
Among Populations2278.062139.0311.31515%
Among Individuals1821800.2849.8922.48929%
Within Individuals185909.0004.9144.91456%
Total3692987.346 8.718100%
F-StatisticsValuep (rand ≥ data)
FST0.1510.001
FIS0.3360.001
FIT0.4360.001
Nm1.407
Table 5. Pairwise population differentiation (FST value) of 163 Mithun, 10 gaur, and 25 Tho-tho cattle germplasm at subpopulation level.
PopulationsSP1SP2SP3
SP10.0
SP20.0800.0
SP30.0950.1460.0
Table 6. Pairwise population matrix of the Nei genetic distance below the diagonal and gene flow above the diagonal of 163 Mithun, 10 gaur, and 25 Tho-tho cattle germplasm at the subpopulation level.
PopulationsSP1SP2SP3
SP10.02.8922.370
SP20.6260.01.464
SP31.3971.2820.0
Table 7. Variability in the mtDNA.
PopulationNo. of Gene CopiesNo. of HaplotypesNo.of Polymorphic SitesExp. HetGene DiversityNucleotide Diversity
Nagaland134760.160.650.012
Mizoram64770.520.860.039
Arunachal23250.40.40.002
Manipur146750.170.780.012
Gaur5272540.40.284
Tho-Tho10330.310.640.0009
Publisher’s Note: MDPI stays neutral with regard to jurisdictional claims in published maps and institutional affiliations.

