Article

A Socio-Ecological Approach to Understanding How Land Use Challenges Human-Elephant Coexistence in Northern Tanzania

1
Department of Sustainable Agriculture, Biodiversity and Ecosystem Management, School of Life Sciences and Bio-Engineering, Nelson Mandela African Institution of Science and Technology, Arusha P.O. Box 447, Tanzania
2
Tanzania Wildlife Research Institute (TAWIRI), Arusha P.O. Box 661, Tanzania
3
Oikos East Africa, Haile Selassie Road, Plot 165, House N 12, Arusha P.O. Box 1908, Tanzania
4
College of Information Sciences and Technology, The Pennsylvania State University, State College, PA 16801, USA
5
Amboseli Trust for Elephants, Nairobi P.O. Box 15135, Kenya
6
Centre for Ecology and Conservation, University of Exeter, Exeter EX4 4PY, UK
7
Ecology of Tropical Agricultural Systems, Hans-Ruthenberg Institute, University of Hohenheim, 70599 Stuttgart, Germany
8
Department of Physical Geography, Stockholm University, 11419 Stockholm, Sweden
*
Author to whom correspondence should be addressed.
Diversity 2022, 14(7), 513; https://doi.org/10.3390/d14070513
Submission received: 2 April 2022 / Revised: 9 June 2022 / Accepted: 18 June 2022 / Published: 24 June 2022
(This article belongs to the Special Issue Elephants: Moving from Conflict to Coexistence with People)

Abstract

:
A globally rapid land use/land cover change (LULC) in human-transformed landscapes alters the interface of human-wildlife interactions due to shifting socio-ecological and environmental pressures. Understanding these shifts is crucial for mitigating repeated negative interactions that escalate conflict states between people and wildlife. This study aimed to understand LULC changes over 30 years (1989–2019), with more recent spatio-temporal patterns of high pressure at the human-elephant interface, and potentially underlying environmental and human-driven factors that affect elephant movement patterns. We analyzed a dataset of 923 human-elephant conflict occurrences, mainly crop foraging incidents, in the Enduimet Wildlife Management Area (EWMA) between the years 2016 and 2020 and combined these data with LULC for year 2019 to understand potential drivers of conflict and assess how agricultural land and settlement have increased over time. We further used GPS datasets of elephants collared between 2019 to 2020 to understand elephant movement patterns in changing land use types. Landsat image analysis revealed that 41% of the area had been converted into farmlands and settlements within the last three decades, which creates elephant-intolerant habitats and the potential to increase pressure at the human-elephant interface. Collared elephants using EWMA moved through all land use types and did not avoid settlements, although they moved through these at higher speeds, reflecting perception of risk. Elephants travelled slightly more slowly in farmland, likely reflecting the availability of foraging opportunities. Our analysis shows that human-induced LULC changes and the encroachment into elephant habitats have resulted in spatially and temporally predictable increases in HEC in EWMA, driven by the proximity of farmlands and protected areas (PAs), so that incompatible land uses are the principal drivers of damage to human livelihoods and increased risks to Tanzanian (and Kenyan) natural capital. Communities in Enduimet urgently need support to increase the effective distance between their farming activities and the PAs. Village-level crop protection and small-scale land-use planning around PAs are important first steps to halt an escalating conflict situation but need to be supported with longer-range strategies that separate incompatible land-use types and encourage the cultivation of alternative crops and livelihood diversification.

1. Introduction

Humans and wildlife have co-existed over millennia, but increasing human activities have tipped the scale towards negative interactions due to increased demands on natural resources [1]. These activities, mainly settlements, farming and livestock-keeping adjacent to protected areas (PAs), have recently intensified negative interactions and damaged community livelihoods [2,3]. In Tanzania, as elsewhere, these intensified negative interactions are termed human-wildlife conflict (HWC), a serious conservation concern because of the significant risks to human lives and livelihoods and consequent impacts on the sustainability of wildlife conservation initiatives [4].
Land Use/Land Cover (LULC) changes and human encroachment into PAs affect ecological systems and wildlife distribution, thereby influencing the spatial patterns of HWC [5,6]. For example, in the Maasai Mara–Serengeti ecosystem in Kenya and Tanzania, seven wild ungulate species declined by 25% as a result of land-use changes [7,8]. Climate change and increasing climate variability influence food and water availability for wild herbivores [9], resulting in increased movements and likelihood of human-wildlife interaction. In the Trans-Himalayan region, Nepal, Aryal et al. [10] found that blue sheep (Pseudois nayaur) foraging areas shifted towards lower altitudes as a result of land-use changes, which correspondingly drew leopards (Panthera uncia) from higher altitude habitats and increased HWC. These problems are predominantly true for species that require large home ranges, such as the African elephant (Loxodonta Africana) [11]. Populations that once moved freely through a mosaic of natural vegetation types are now confronted with a man-made labyrinth of barriers that fragment formerly expansive natural landscapes [12].
The interface between the African elephant and humans is becoming particularly strained. Elephants are classified as endangered under the IUCN red list 2020 [13], and form a vital part of range state natural capital and ecosystem function [14,15], but in Tanzania, elephants range both within PAs and on community lands where they may cause damage to crops and property and sometimes human injury or death [16]. Elephant home ranges are often constrained by human presence, and their spatio-temporal movements across landscapes might often drive shifts at the human-elephant interface that underlie HEC occurrences [17]. Elephant movement speeds are reliable indicators of the level of perceived risk [18], as elephants move more quickly in areas that may be dangerous for them [18], but few studies have related movement patterns and conflict hotspots. [18]. Unfortunately, many HEC studies still rely solely on survey questionnaires that are prone to bias, as losses can be exaggerated by respondents, especially if encounters have been traumatic [16,19,20]. Understanding how LULC changes and elephant space use drive HEC can yield crucial insights for developing effective mitigation and biodiversity conservation strategies [17,21].
Increasing HEC incidences in Tanzania and the knowledge gap about the main drivers of HEC motivated us to conduct this study in the Enduimet Wildlife Management Area (EWMA). Despite the importance of HEC assessment, environmental correlates of conflict, including the effects of natural and anthropogenic parameters, have rarely been connected to detailed elephant spatial and temporal movement patterns. Further, little is known about how anthropogenic activity expansion has impacted elephant movement patterns and HEC in both protected and unprotected areas such as EWMA and other parts of Tanzania. The increasing human population has accelerated land use changes (e.g., settlements, agricultural land) and reduced natural vegetation, and increased both the absolute number of interactions between humans and elephants and the likelihood of conflict. Thus, the assessment of a linkage between LULC changes and HEC spatio-temporal distribution is important in developing sustainable solutions for conserving and protecting elephant populations and human livelihoods.
In this study, we applied Geographical Information System (GIS) and Remote Sensing techniques to quantify LULC changes over 30 years. We also analysed elephant movements using transboundary GPS collar locations in Kenya (Amboseli National) and Tanzania (Enduimet Wildlife Management Area; EWMA) of three male elephants between the years 2019 and 2020. We combined this information with household data on HEC collected during the survey, as well as with a HEC dataset collected by OIKOS literature (HEC reports) and participatory field assessments, to evaluate pressure at the human-elephant interface and investigate environmental correlates of “conflict”, including the relative effects of natural and anthropogenic influences in EWMA. We aimed at capturing long-term information on LULC changes for the years 1989, 1999, 2009 and 2019, and to overlay more recent elephant movements and LULC for the year 2019 in this changing landscape and assess the spatiotemporal distribution of HEC and their underlying drivers. Specifically, we aimed to (i) map LULC changes between 1989 and 2019 in the EWMA, (ii) model the most important environmental and anthropogenic predictors of HEC, (iii) estimate male elephant home ranges in relation to HEC hotspots areas, and (iv) analyze the spatio-temporal patterns of HEC and elephant movement speed under different land use based on the 2019 classified LULC map. We hypothesized that (i) farmlands and settlements have increased in the EWMA over the last three decade and escalated the potential for HEC, (ii) crop raiding events would increase during the dry season, when wild food resources become limited, (iii) HEC incidents would increase over the years as farmlands expanded, (iv) HEC incidents would be high in areas of high Normalized Difference Vegetation Index (NDVI) values since elephants prefer rich foraging areas, and (v) elephant movement speed would be high in human-dominated areas.

2. Materials and Methods
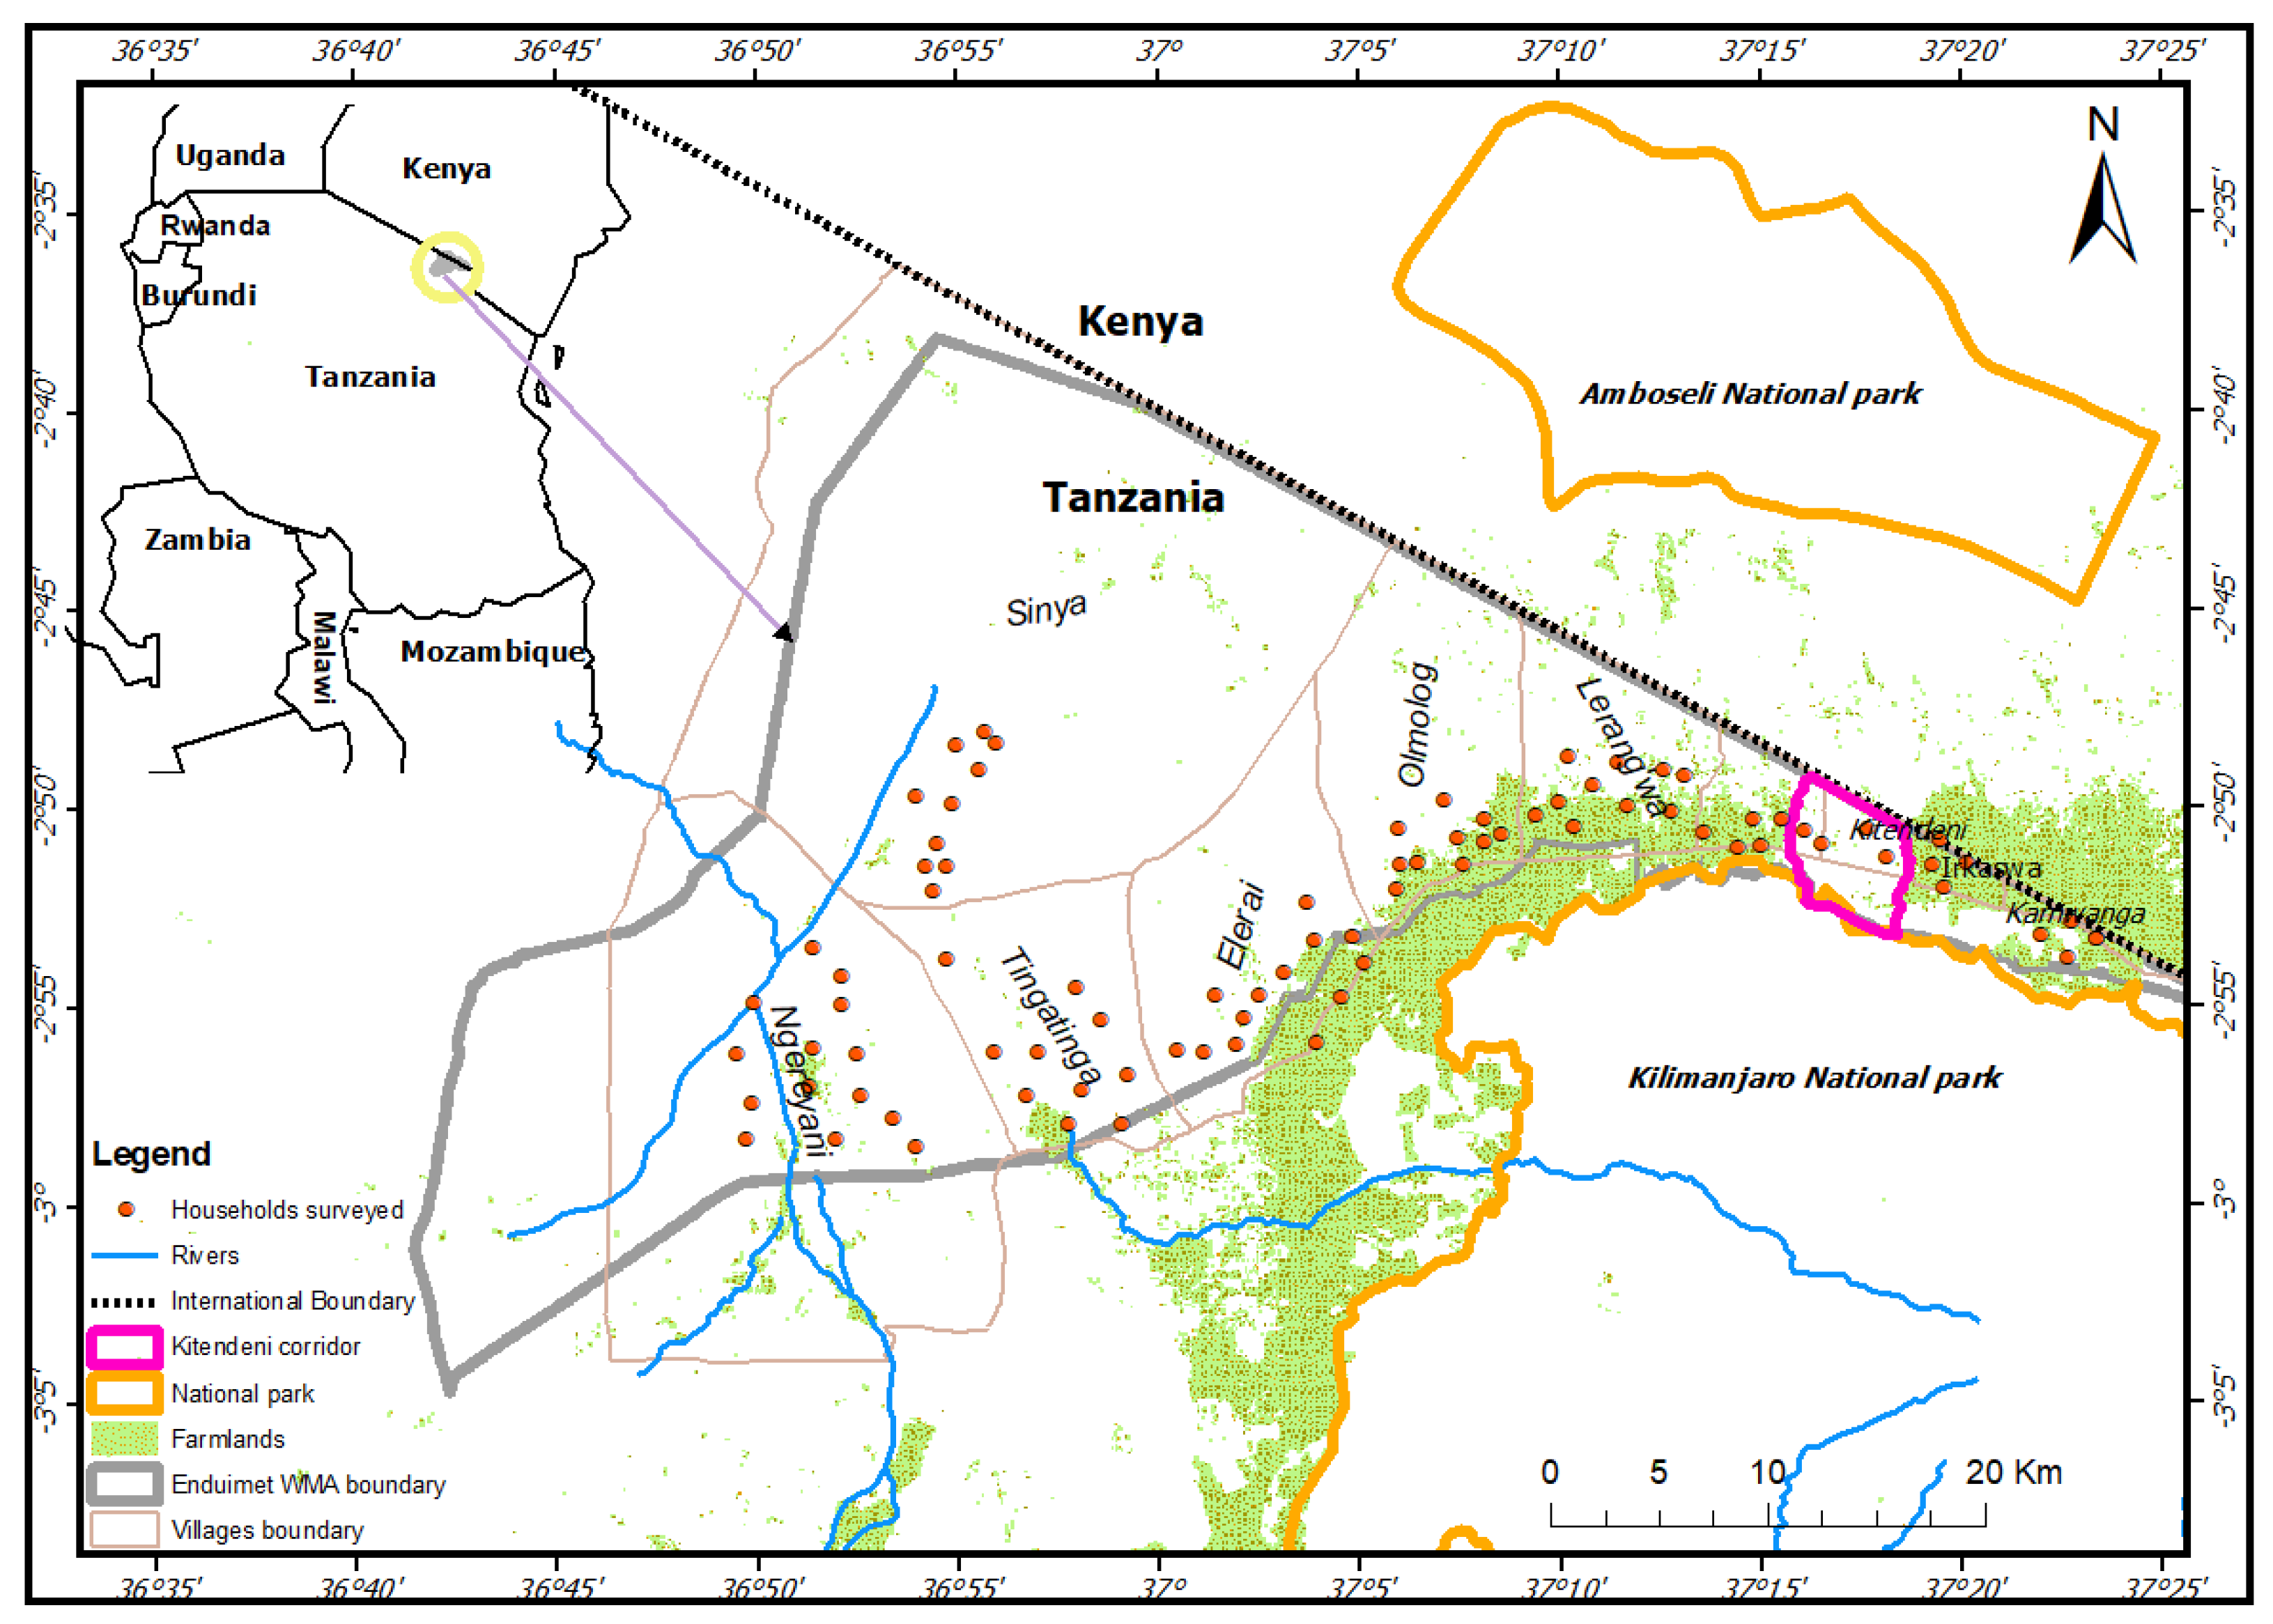
2.1. Study Area

The Enduimet Wildlife Management Area (EWMA) covers 752 km2 [22], within the Longido District, in the Arusha Region. The area is bordered by Kilimanjaro National Park (KINAPA) to the South-east, the Tanzania-Kenya political boundary to the north and the Ngasurai plains to the west (Mariki et al., 2015). The EWMA was established in 2005 under the Tanzania wildlife policy of 1998 and comprises nine villages concentrated along the productive slopes of Mt. Kilimanjaro [23] (Figure 1). As many as 600 elephants utilize EWMA during the dry season [24], and it represents an important wet season sanctuary for elephants and other species, including wildebeest (Connochaetes taurinus), lions (Panthera leo), zebras (Equus quagga) and African buffalos (Syncerus caffer) [25].
The EWMA comprises the Kitendeni wildlife migratory corridor (KWC), which connects the Kilimanjaro in Tanzania and Amboseli National Parks in Kenya [26], and serves as a major transboundary migratory corridor for many wildlife species [27]. This remains the only formally protected wildlife corridor that links EWMA to other PAs such as Natron Game Controlled Area, Arusha and Mkomazi National Parks [28]. The corridor is, however, under threat following the rapid expansion of human activities and changes in land use over the years [7]. The EWMA contains arable and fertile lands with high agricultural potential and a rapidly increasing number of human settlements, in particular the villages of Tingatinga, Elerai, Lerang’wa, Kamwanga and Olmolog [23]. The human population in EWMA is about 57,000 people, having increased by 30% between 1988 and 2017 [24,29]. Although traditionally the resident Maasai are nomadic pastoralists, agriculture and tourism-related activities are becoming an important source of income [30]. The average annual rainfall of EWMA ranges between 300–600 mm, daily average temperatures between 30–35 °C, and it covers an elevation ranging between 1230–1600 m [31]. The big rainy season lasts from February to May, while the small rainy season lasts from June to November [23]. Agro-pastoralists practice small-scale farming concentrated during the short rains, and plant crops that mature quickly and are drought-tolerant, such as maize (Zea mays) and beans (Phaseolus vulgaris) [7]. The natural vegetation is primarily comprised of mixed Acacia woodlands, including Acacia commiphora bushland, Acacia tortilis savannah and Sporobolus short grass plains, typical of semi-arid East African savannah [7].

2.2. Remote Sensing Data for LULC Analysis

In order to analyze LULC changes over the years 1989, 1999, 2009, and 2019, we used time-series pairs of Landsat images, namely Landsat 5 Thematic Mapper (TM), Landsat 7 Enhanced Thematic Mapper plus (ETM) and Landsat 8+ with two sensors: the Operational Land Image (OLI) and Thermal Infrared Sensor (TIRS). All images were visually interpreted and processed to map LULC. The satellite images downloaded with 30 m resolution were freely accessed from USGS earth explorer (http://www.usgs.gov, accessed on 29 March 2021) (Table A1). Images were captured during the dry season with less than 10% cloud cover, imported in ArcGIS 10.6 and georeferenced for processing and analysis using the World Geographical System (WGS) 1984, and projected to Universal Transverse Mercator (UTM) Zone 37S. Before classification, we performed image pre-processing, such as layer stacking radiometric and geometric correction, to improve the quality of the image by minimizing various radiometric and atmospheric errors [11]. Visual interpretation and high-resolution imagery, such as GeoEye (1.36 m × 1.36 m) and/or SPOT (20 m × 20 m) on Google Earth, were used to determine signature files to be used in classification based on previous studies in the Serengeti ecosystem [32] and Kilombero valley floodplain, southeastern Tanzania [33]. Training signatures for the nine LULC classes, including agriculture, settlements, bare ground, bushland, forest, grassland, woodlands, water, and wetland (Table A2) were visually interpreted and then digitized as polygons. All Landsat images were classified by using Maximum Likelihood Classification (MLC) [34] and verified on the ground. Post image classification was performed to determine the accuracy of images classified using a confusion error matrix [35,36] and to validate remotely sensed data by comparing classified images with the provided ground-truthing data [37].

2.3. Household Survey for Primary HEC Hotspots

We used a semi-structured questionnaire survey (Supplementary File S1) adapted from Punch [38] to collect data on the locations and numbers of HEC incidents in eight administrative villages (Figure 1). A total of 96 households located at least 1 km apart from each other were selected using a systematic random sampling protocol [39] and interviewed about HEC incidents in their respective villages from the years 2016 to 2020. We interviewed respondents aged >25 years who had been living in the area for more than 5 years. In addition, we asked elders (>55 years) of each village to recall the trend in LULC changes and the nature of HEC incidents that happened in the area over the past 5 years to complement data from classified Landsat satellite images on LULC. We also consulted four EWMA staff to complement our knowledge on HEC incidences that had occurred in the area over the past 5 years. Each respondent was interviewed only after verbal consent to participate was given.

2.4. Secondary Data for HEC and Environmental Dynamics

Data on the spatial location of HEC in EWMA, in particular crop forage incidents, were collected between May 2016 and May 2020 by the Tanzania Wildlife Research Institute (TAWIRI) (www.tawiri.or.tz, accessed on 12 August 2020) and OIKOS East Africa (http://oikosea.co.tz, accessed on 17 June 2020 under the EU-funded project CONNEKT (Greater Kilimanjaro Initiatives to enhance community participation in sustainable conservation of the trans-frontier ecosystem and wildlife). Each HEC incident was recorded as a unique event, and information about the location of crop raids, date and time, name of the village, as well as crop type affected, were collected. The distances of all HEC locations to the park boundaries, nearest road networks and the nearest rivers were obtained using nearest tool in QGIS version 3.6. The elevations of the HEC locations areas were extracted from a Digital Elevation Model (DEM) (https://www.usgs.gov, accessed on 1 May 2021 having a spatial resolution of 30 m [40]. Average NDVI values for the years 2016 to 2019, related with occurrences of HEC and elephant home ranges, were derived from Moderate Resolution Imaging Spectroradiometer (MODIS) (https://modis.gsfc.nasa.gov, accessed on 13 September 2021) (Table 1).

2.5. Spatial and Temporal Distribution of Elephants

We used 52,488 GPS locations of three male elephants ranging in the EWMA between 2019–2020, collected from collars fitted by the Amboseli Trust for Elephants (ATE). Collared elephants were based on known IDs from Amboseli elephant families studied since 1972 [41]. All males were of dispersal age (range 8–19, mean 13 years old) and were either still in association with their natal family or had known dispersal dates within the previous 6 months. GPS collars (GSM IPO-95 supplied by Savannah Tracking Ltd., Kilifi, Kenya) recorded hourly location fixes and had been monitored for fit and wear during observations of target elephants. Permissions to deploy collars had been obtained from Kenya Wildlife Service.

2.6. Data Analysis

QGIS version 3.6 software was used for change detection statistics and to determine changes in LULC between pairs of consecutive classified images, i.e., from 1989 to 2019. All datasets on HEC from both OIKOS and our conducted field questionnaires were combined before analysis, as the same methodology, design and tools were used. We examined the relative influence of key underlying correlates using a binary multiple logistic regression incorporating environmental (NDVI, elevation, distances from PAs, main road network and rivers) and anthropogenic variables (the proportion of land converted to agriculture and settlement (Table 1). Before running the model, variables showing multicollinearity, i.e., having a Variance Inflation Factor (VIF) greater than 10, were identified and dropped from the model [42]. We examined annual, seasonal and time of day effects on crop foraging incidents using the Kruskal-Wallis or the Mann-Whitey U-test. We measured spatial autocorrelation of incidents using Global Moran’s I function and identified incident hotspots using Kernel Density Estimation (KDE) and Gedis-Ord Gi algorithms in ArcMap 10.6 software. Next, we combined the KDE surface with different LULC classes to generate a hotspot map. We estimated home range for each male elephant using 100% minimum convex polygon (MCP100%) and 95% fixed KDE following procedures described by Kikoti et al. [25]. KDE was implemented using Hawth’s tools in ArcMap 10.5 software and overlaid with the dataset on crop incidents. We determined elephant travel speeds and the percentage of GPS fixes within each land use class of the EWMA. A one-way ANOVA test (Welch’s) was used to determine the difference of studied parameters (settlement, farmland and other areas of EWMA). All statistical analyses were performed using R version 3.4.1 (https://www.r-project.org, accessed on 15 January 2022) and at a 5% level of significance (α = 0.05) unless otherwise stated.

3. Results

3.1. Land Use / Land Cover (LULC) Class Changes

We found that thirty years of LULC had converted EWMA from a grassland-dominated ecosystem to one in which wildlife-incompatible agriculture and settlements had more than doubled. This change was mainly due to the rapid conversion of 1042 ha of forest and 17,711 ha of grassland to farmland within the last 10 years (Table 2). Bushland and woodland cover remained overall stable, while bare ground declined slightly over time from 2009 to 2019 (Table 2). Our results showed a high rate of agreement between the user’s accuracy and producer’s accuracy in terms of grassland, woodland, and water cover changes across all images with Kappa Indices of Agreement of 0.86, 0.87, 0.79 and 0.91 for the four periods under investigation, which is similar to the standard land cover mapping accuracy of 85–90% [32]. Above 0.75 Kappa is the minimum acceptable interrater agreement [43]. Therefore, this makes us confident in the analytical process.

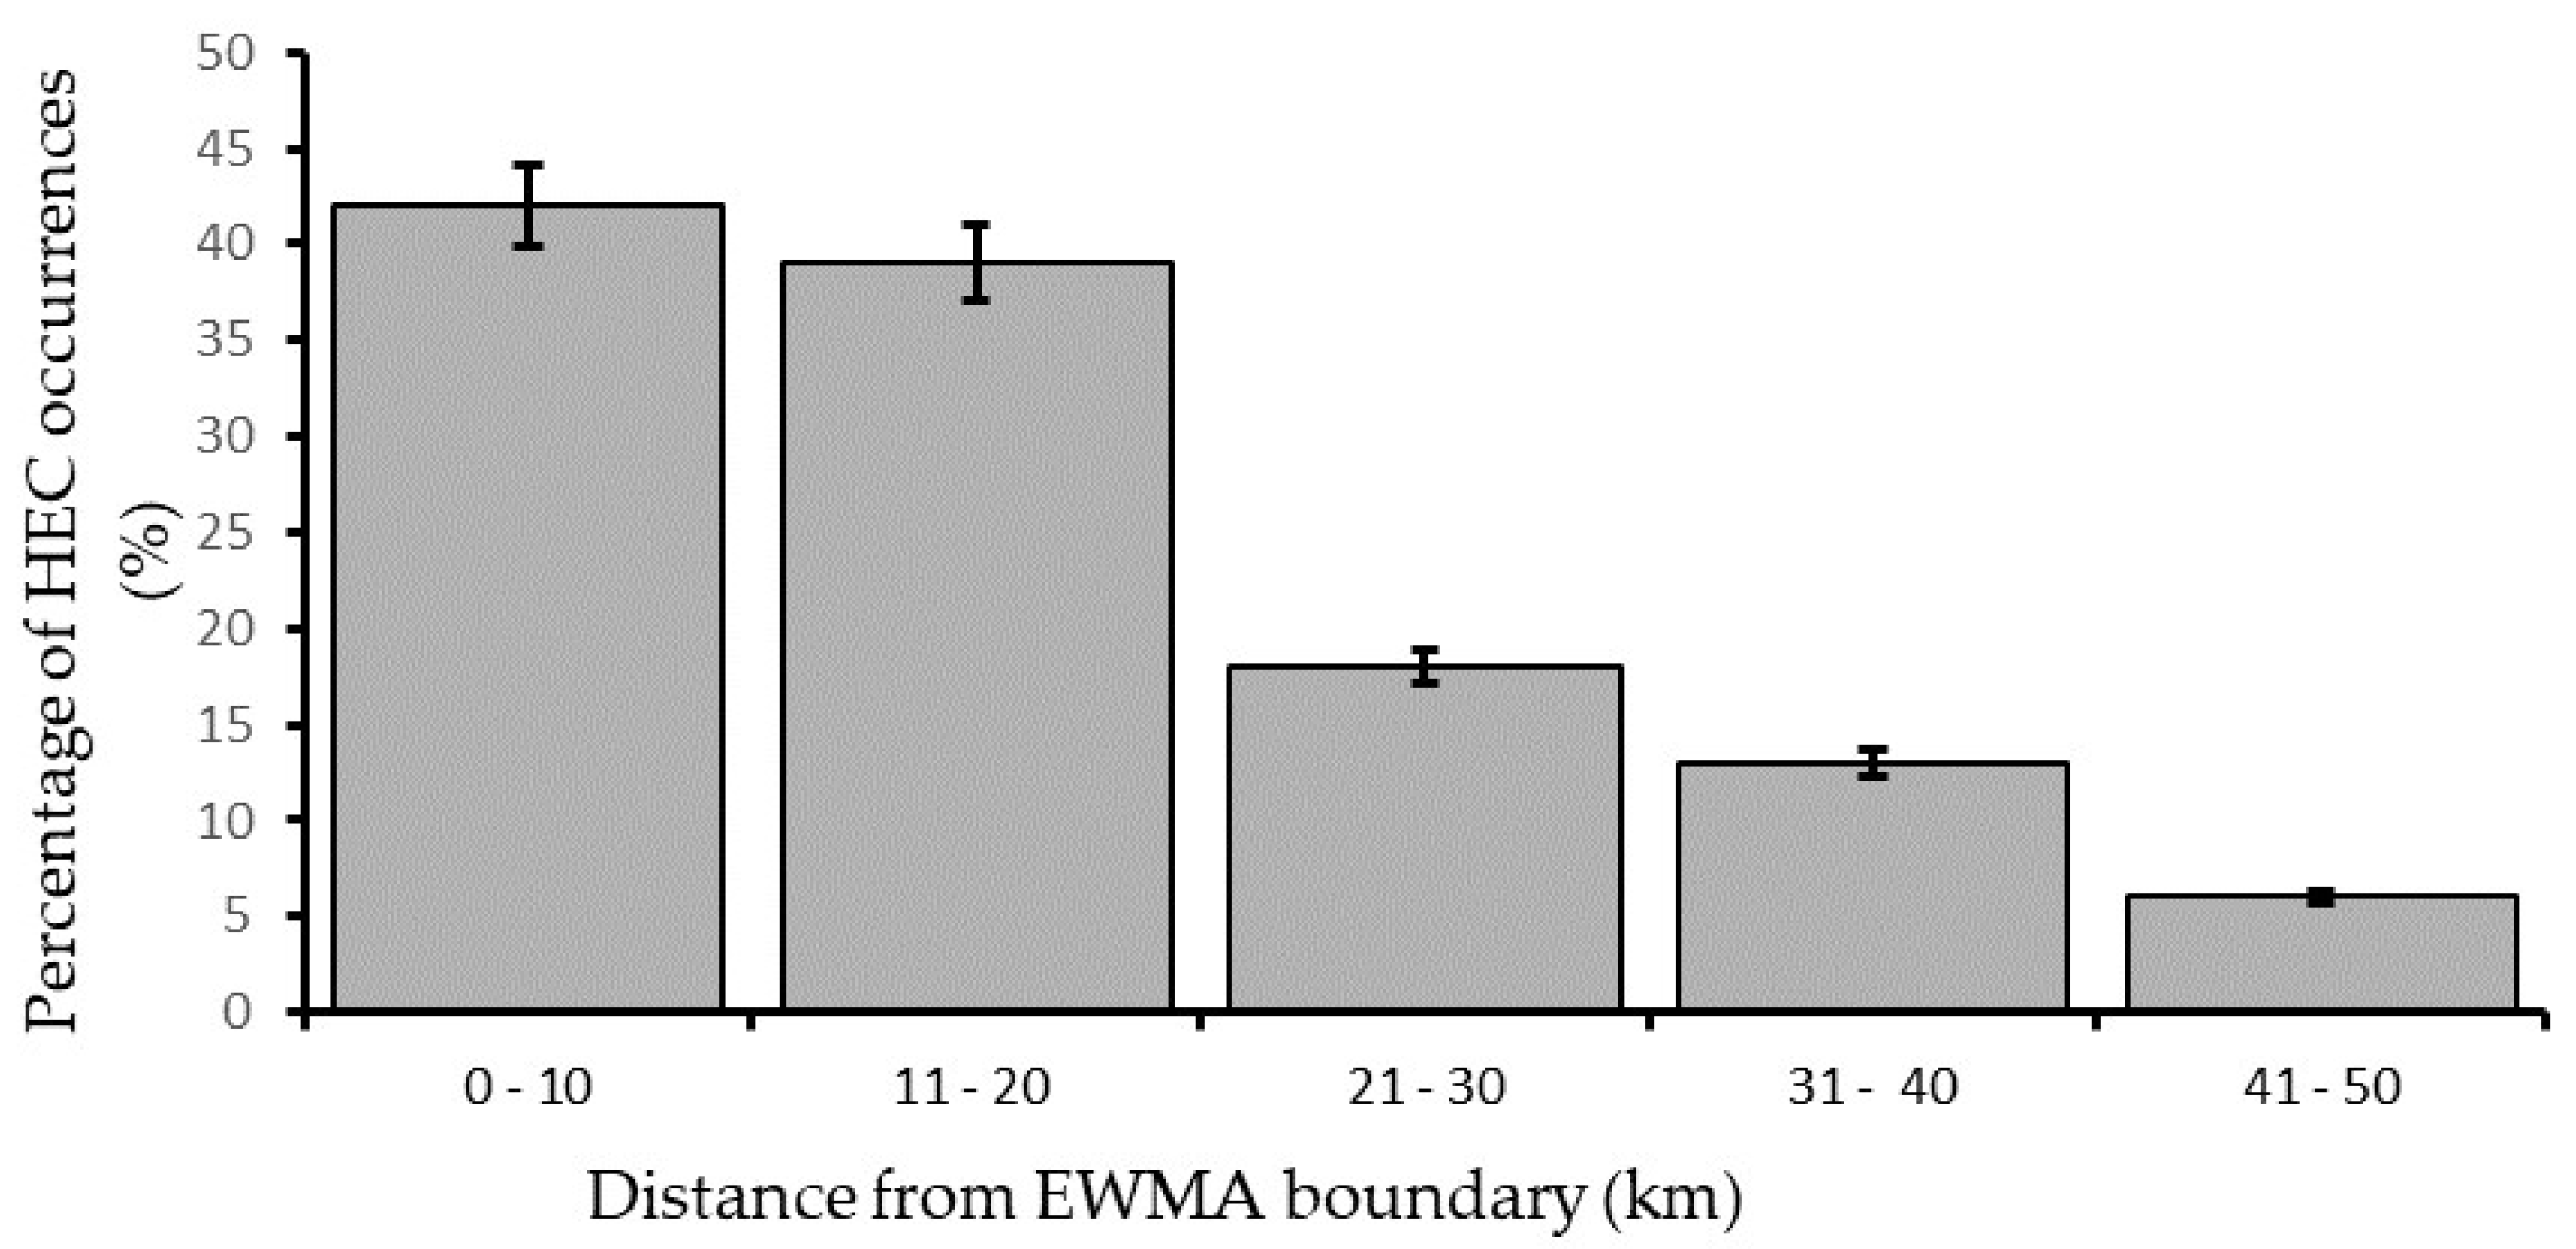
3.2. Influence of Environmental and Anthropogenic Factors on HEC

Environmental factors that significantly influenced HEC occurrence were low elevation, proximity to settlements, farmlands and protected areas. Furthermore, based on interviews and existing reports, HEC occurrence across the entire study period was closely linked with higher average NDVI values, particularly in the wet season, confirming the elephants’ preference for rich and productive vegetation. Distances from roads and rivers (Table 3) showed a non-significant relationship with HEC occurrence in our study area. Elephant raids occurred most often in farmland within 20 km of PAs (80% of incidents), concentrating on agricultural areas along the KWC and close to the villages of Tingatinga and Ngereyani. A small number of raids (20%) occurred between 21 km to 40 km away from the EWMA boundary (Figure 2).

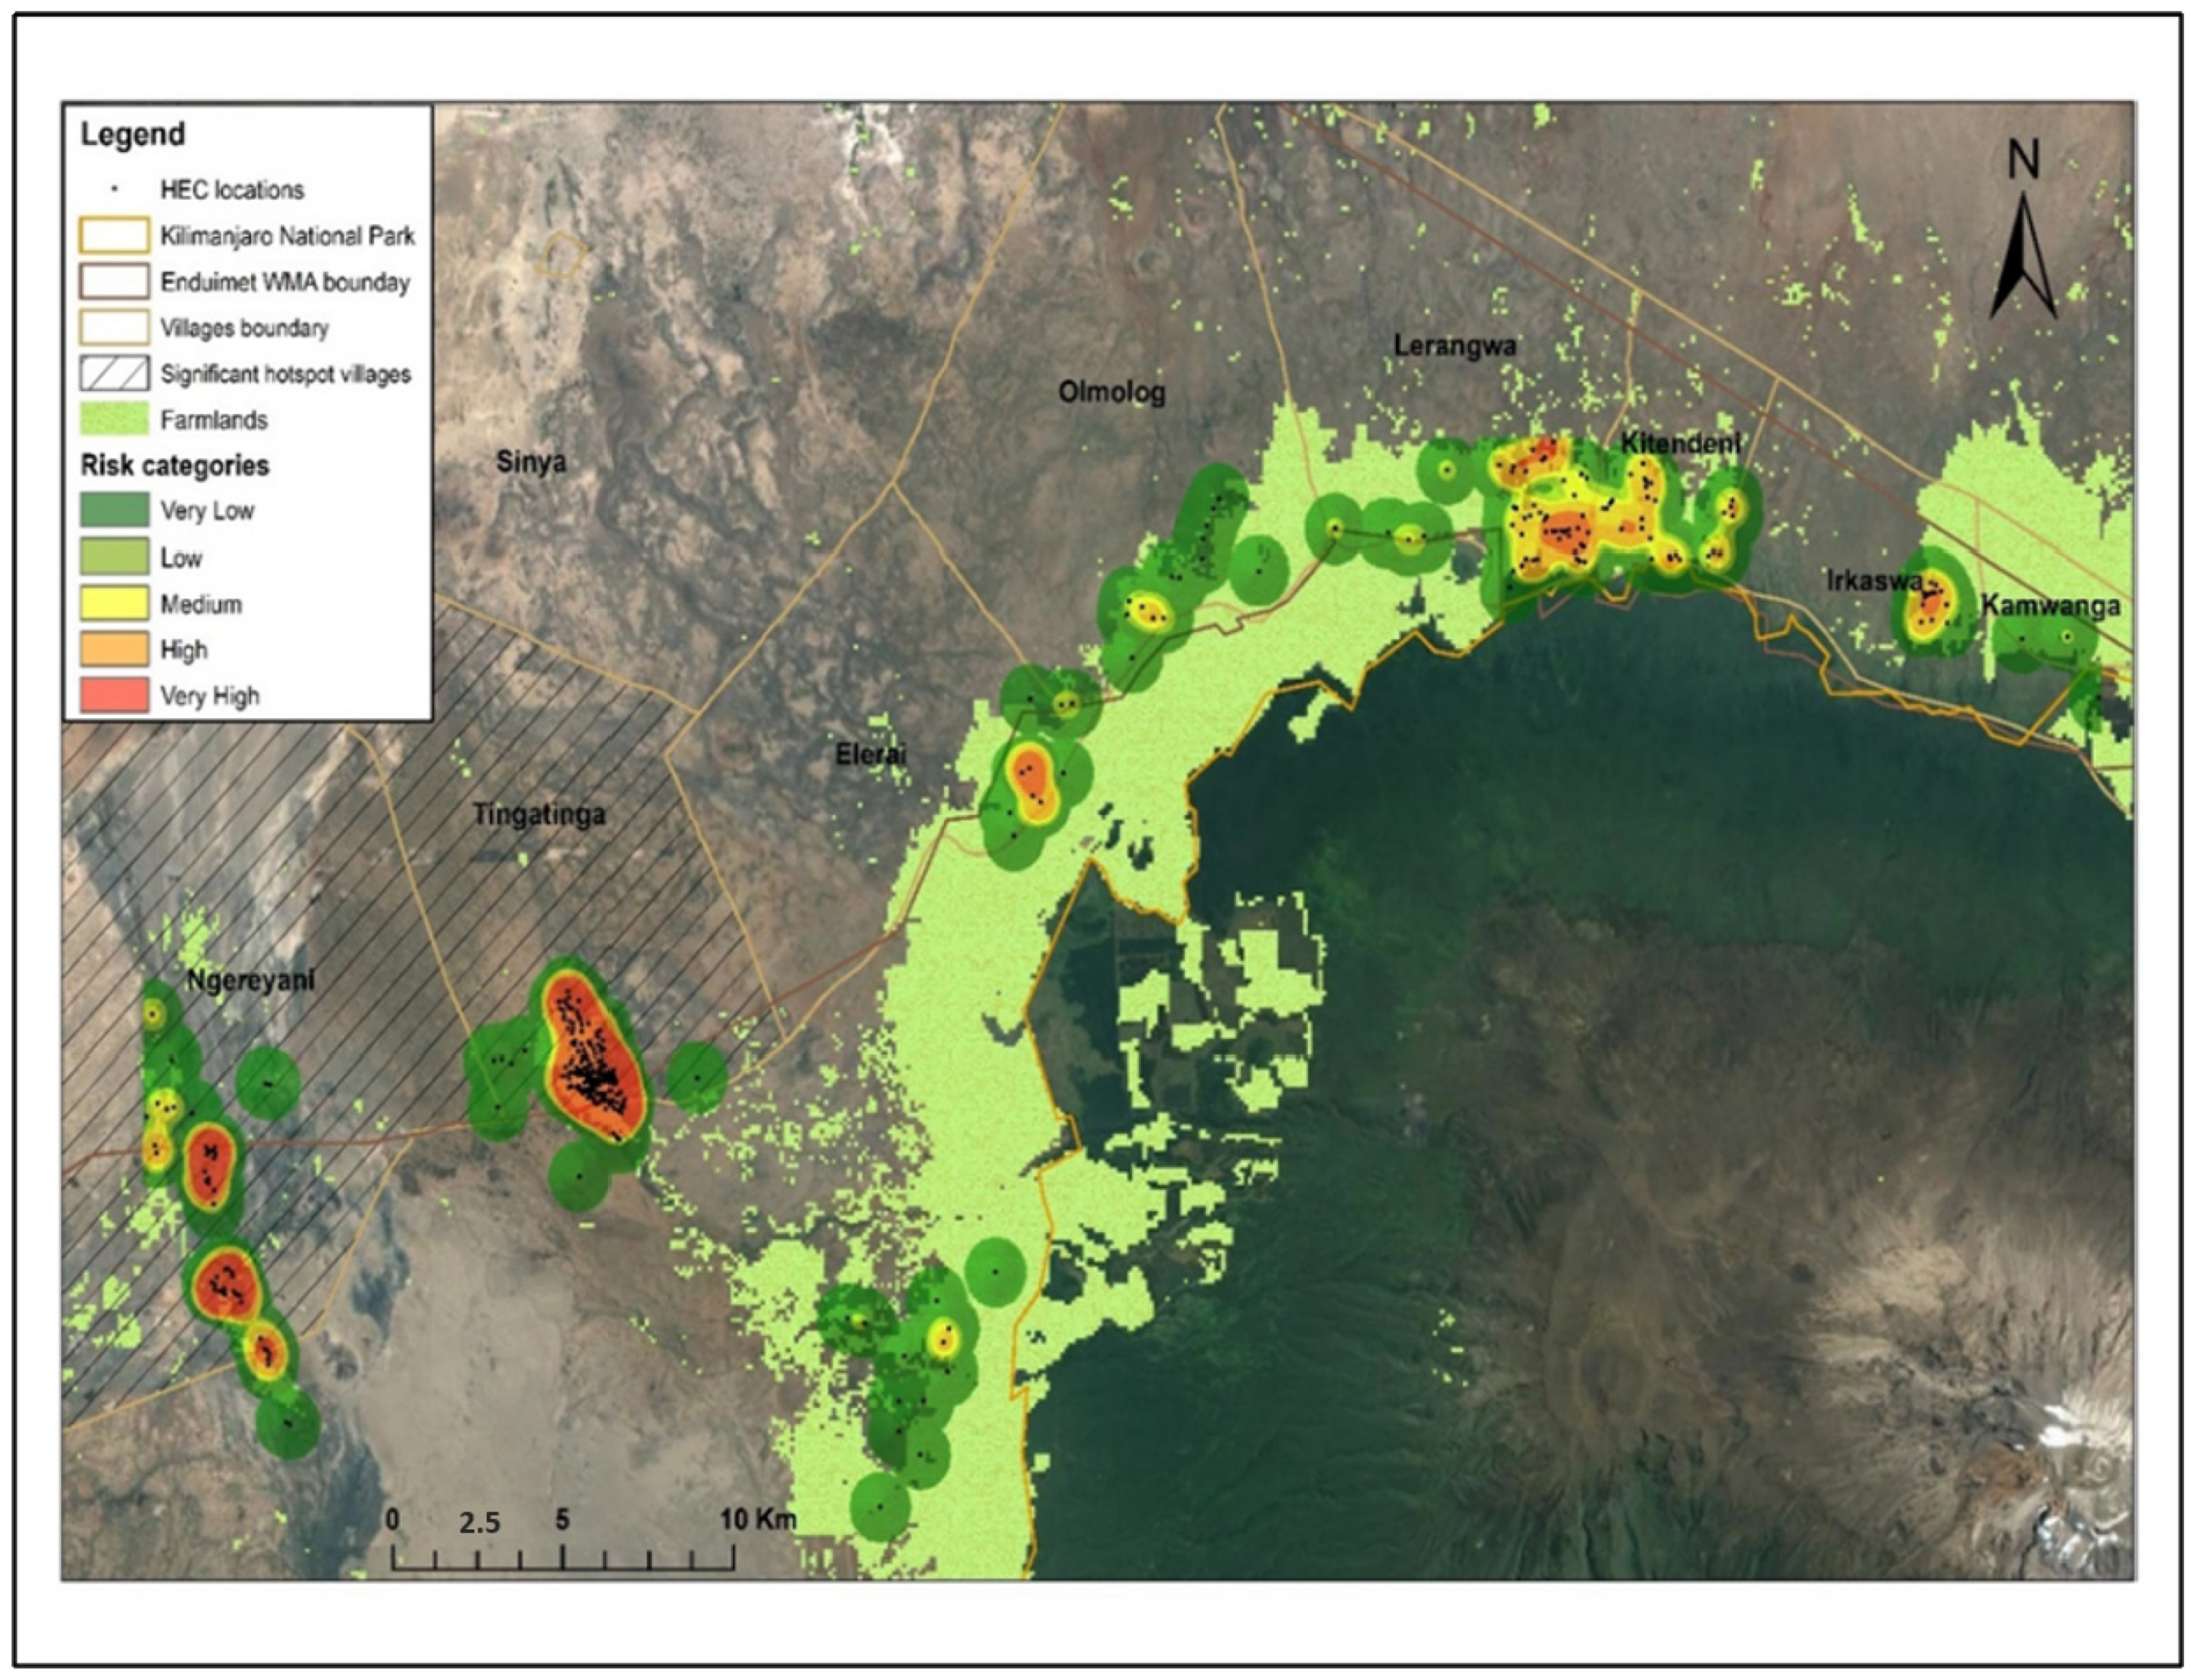
3.3. Spatio-Temporal Patterns of HEC and Hotspot Mapping under Different LULC

A total of n = 923 crop foraging incidents were recorded by Oikos East Africa between May 2016 and May 2020 across the eight villages in EWMA, with an annual mean (±SD) of 185 (±173). The lowest (n = 56) and the highest (n = 482) number of incidents took place in 2016 and 2019, respectively, but there was no significant trend across the years (p > 0.05). Although crop losses caused by elephants occurred throughout the year, most incidents (55%) were recorded during the dry season, from June to November, when wild forage resources for elephants decrease in quality. There was a trend of more incidents being documented during the harvest periods of May (26%) and June (25%) (Figure A4), while lower incidents were observed in April (3%) and October (2%), albeit not significantly different (U = 10.50, Z = 0.42, p = 0.69). Further, there was no significant trend across years 2016 to 2020 (H (4) = 5.55, p = 0.24). The majority (82%) of the recorded crop foraging incidents took place during the night and were concentrated across six clusters within Tingatinga and Ngereyani, showing strong spatial autocorrelation (Moran’s I = 0.34, Z-score = 33.8, p < 0.0001; Figure 3).

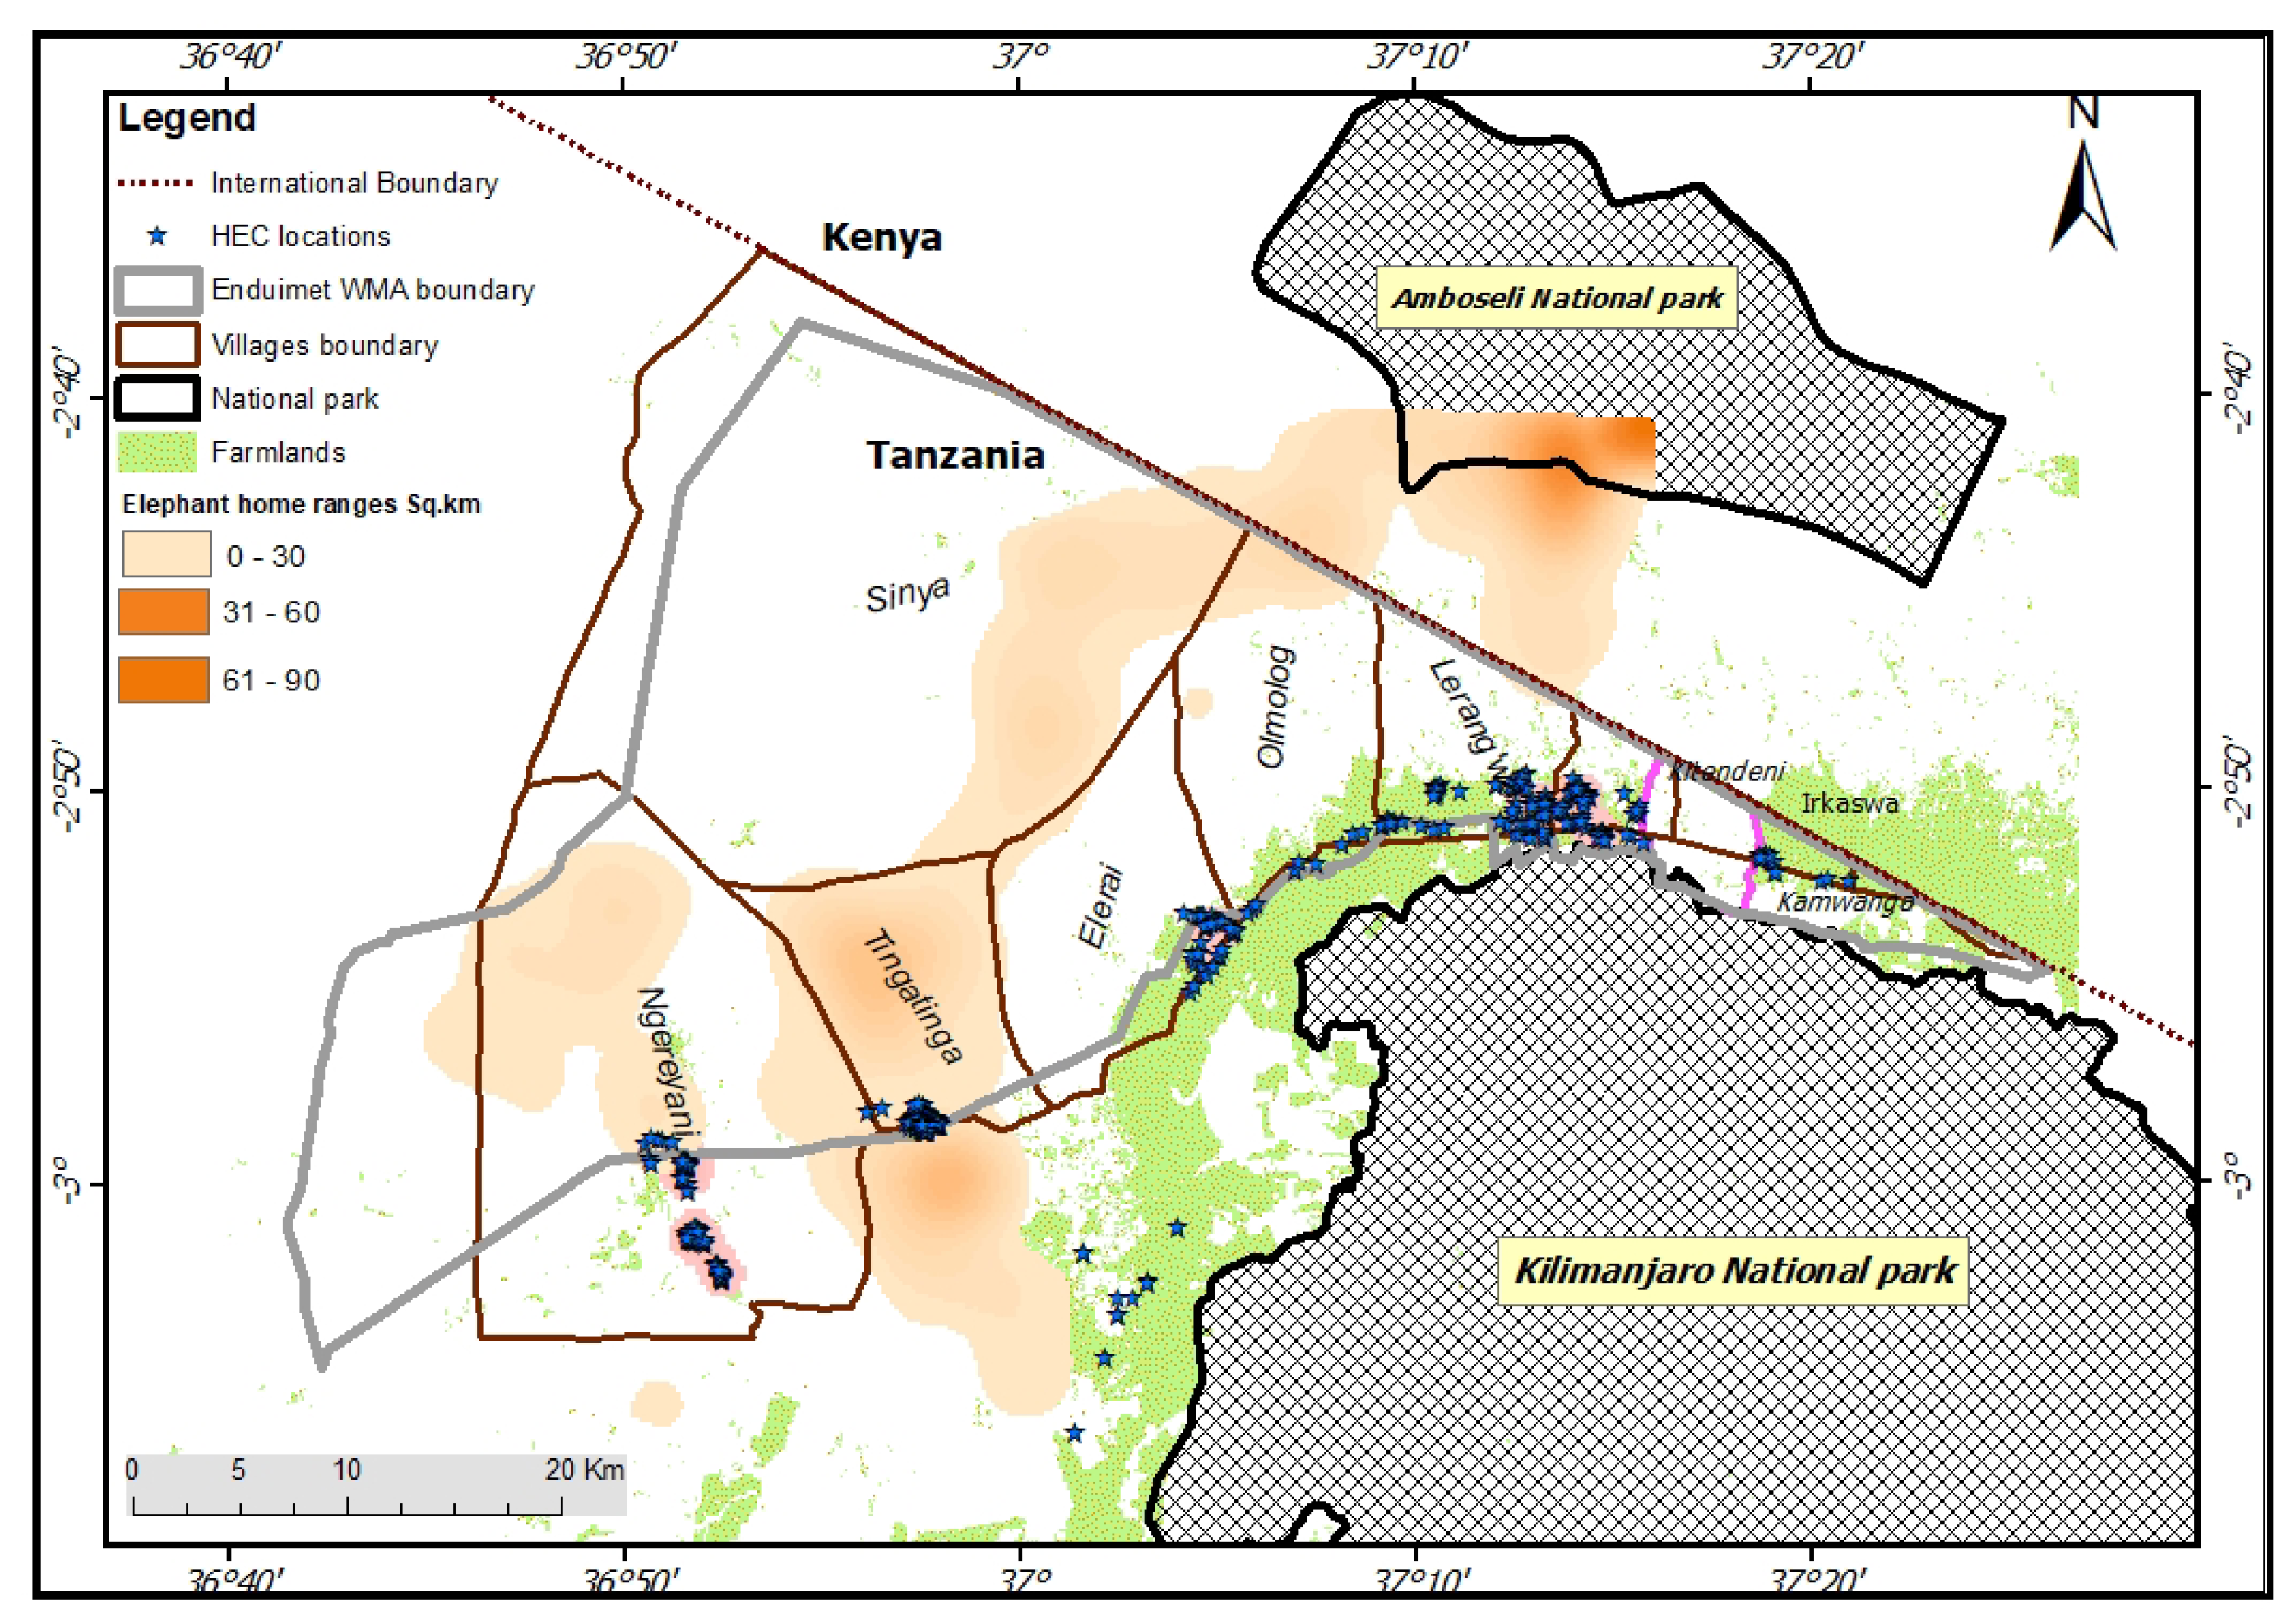
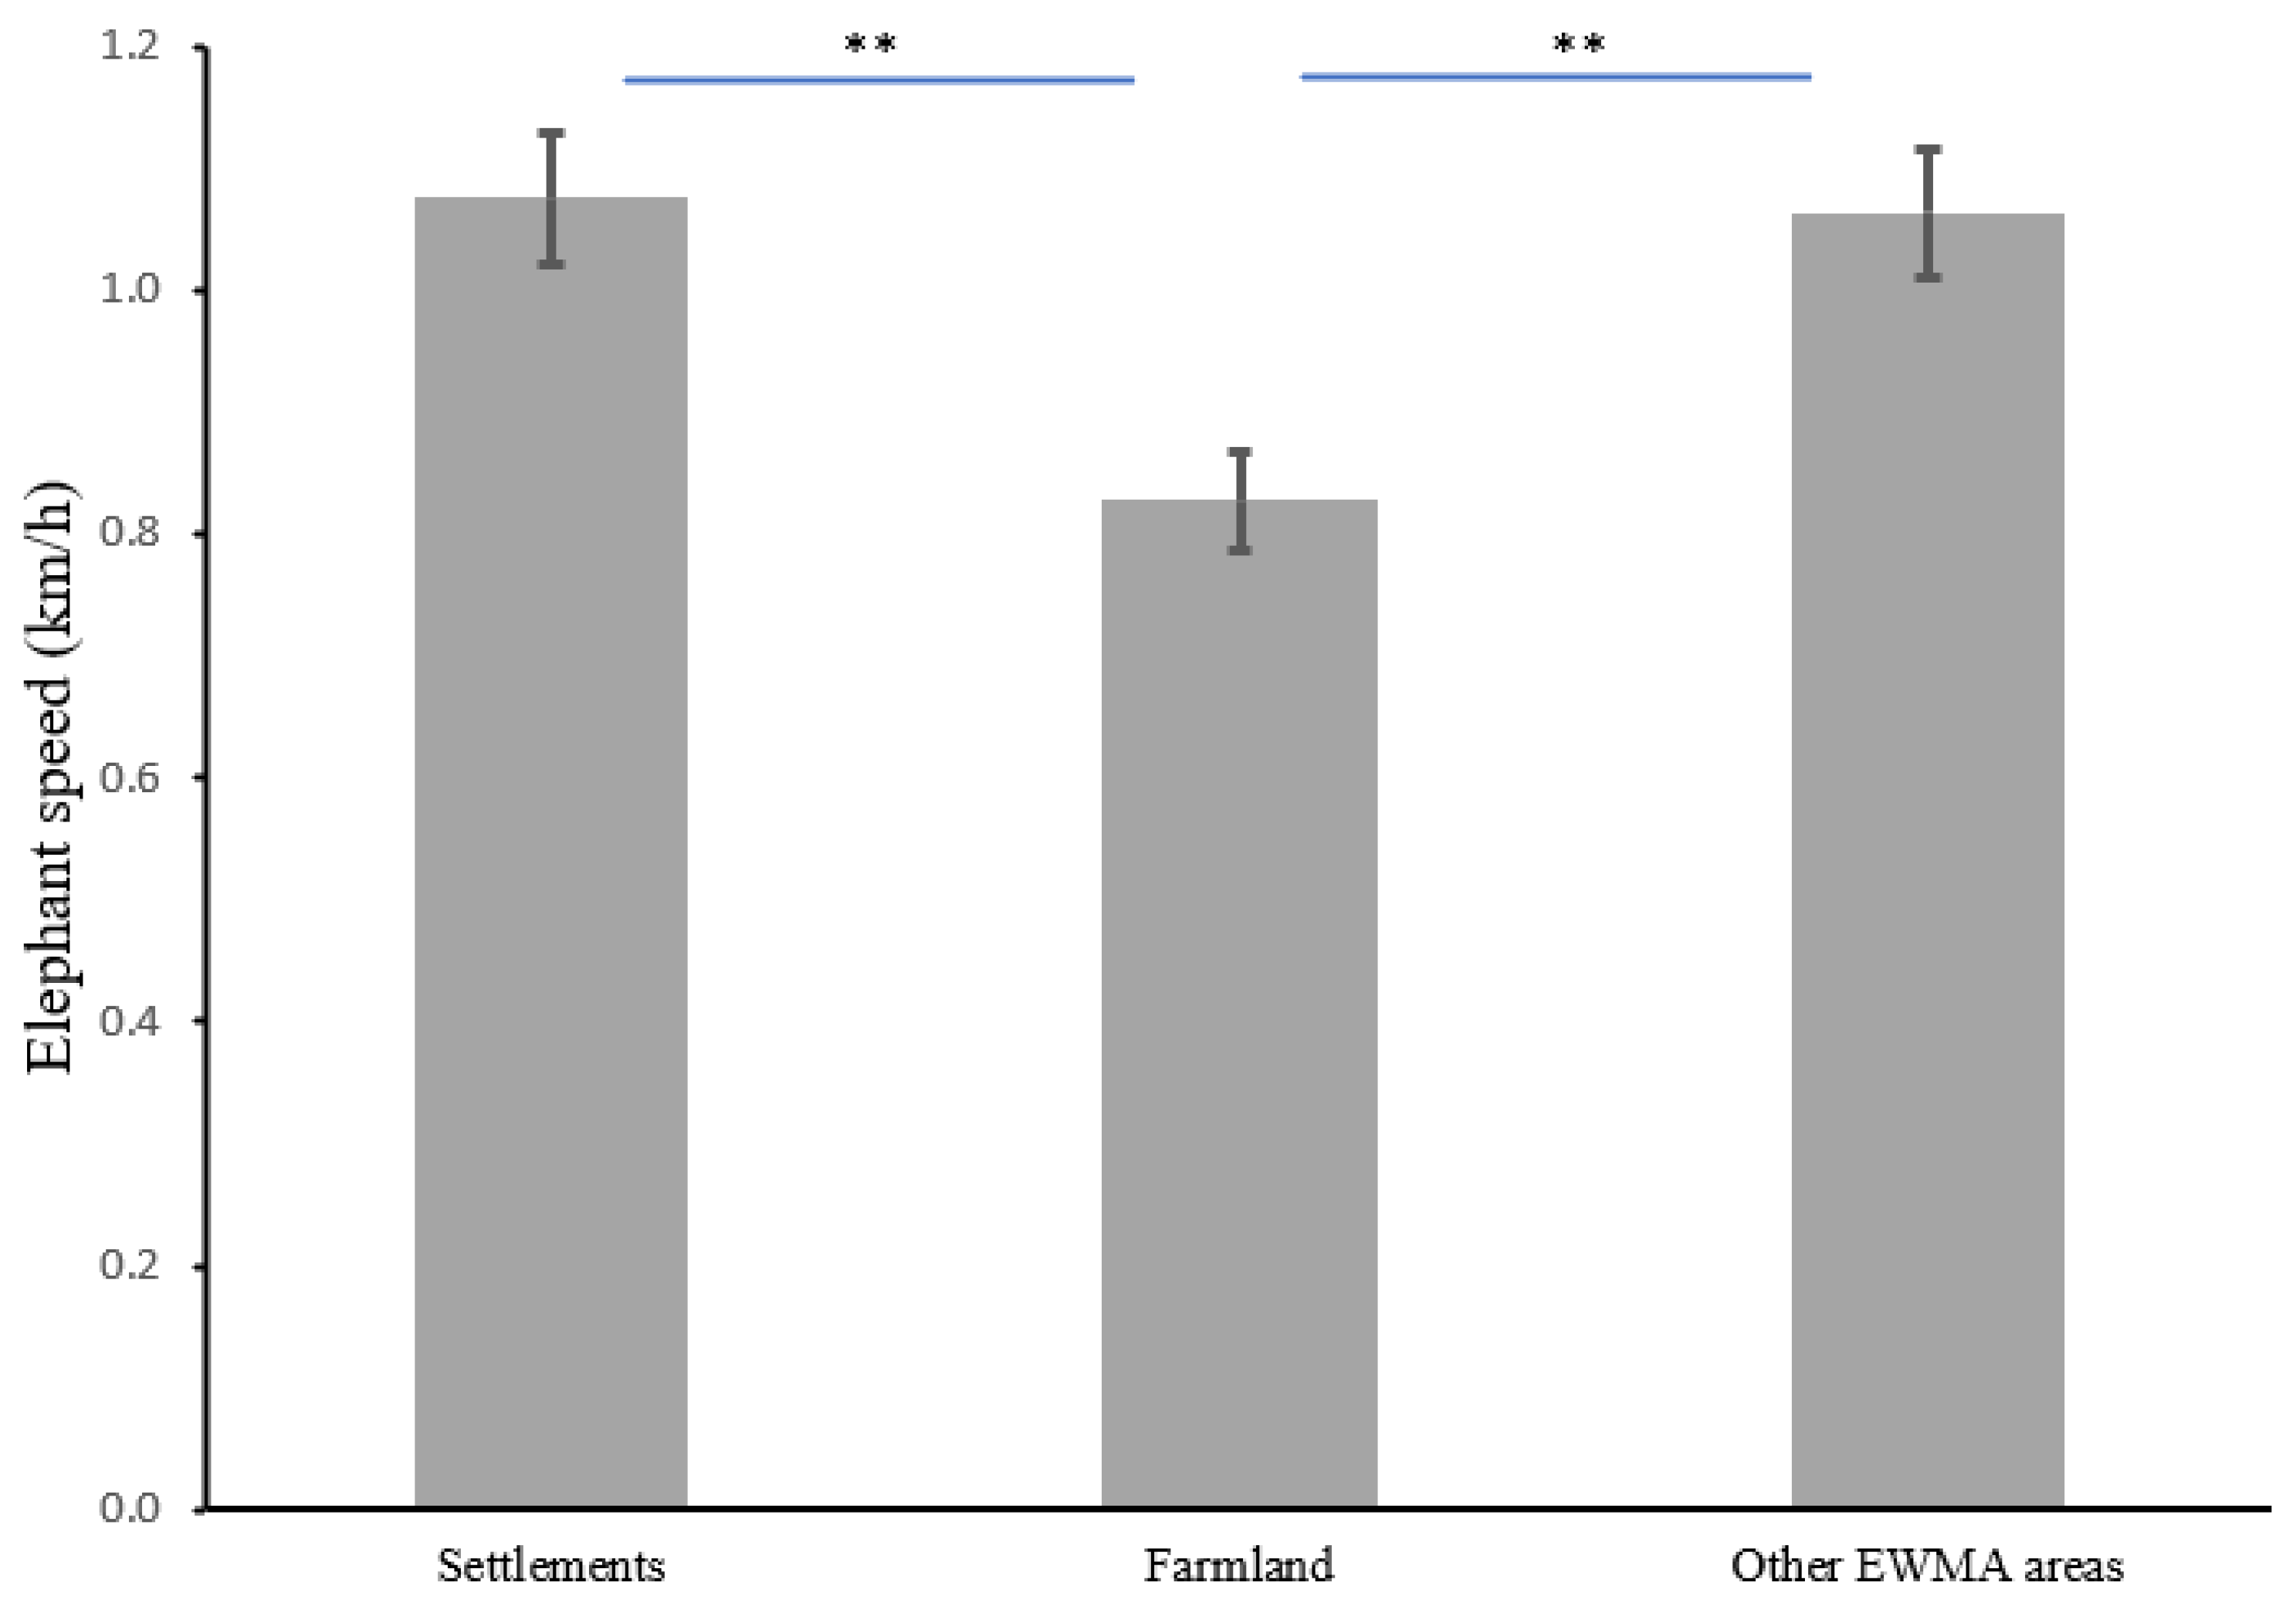
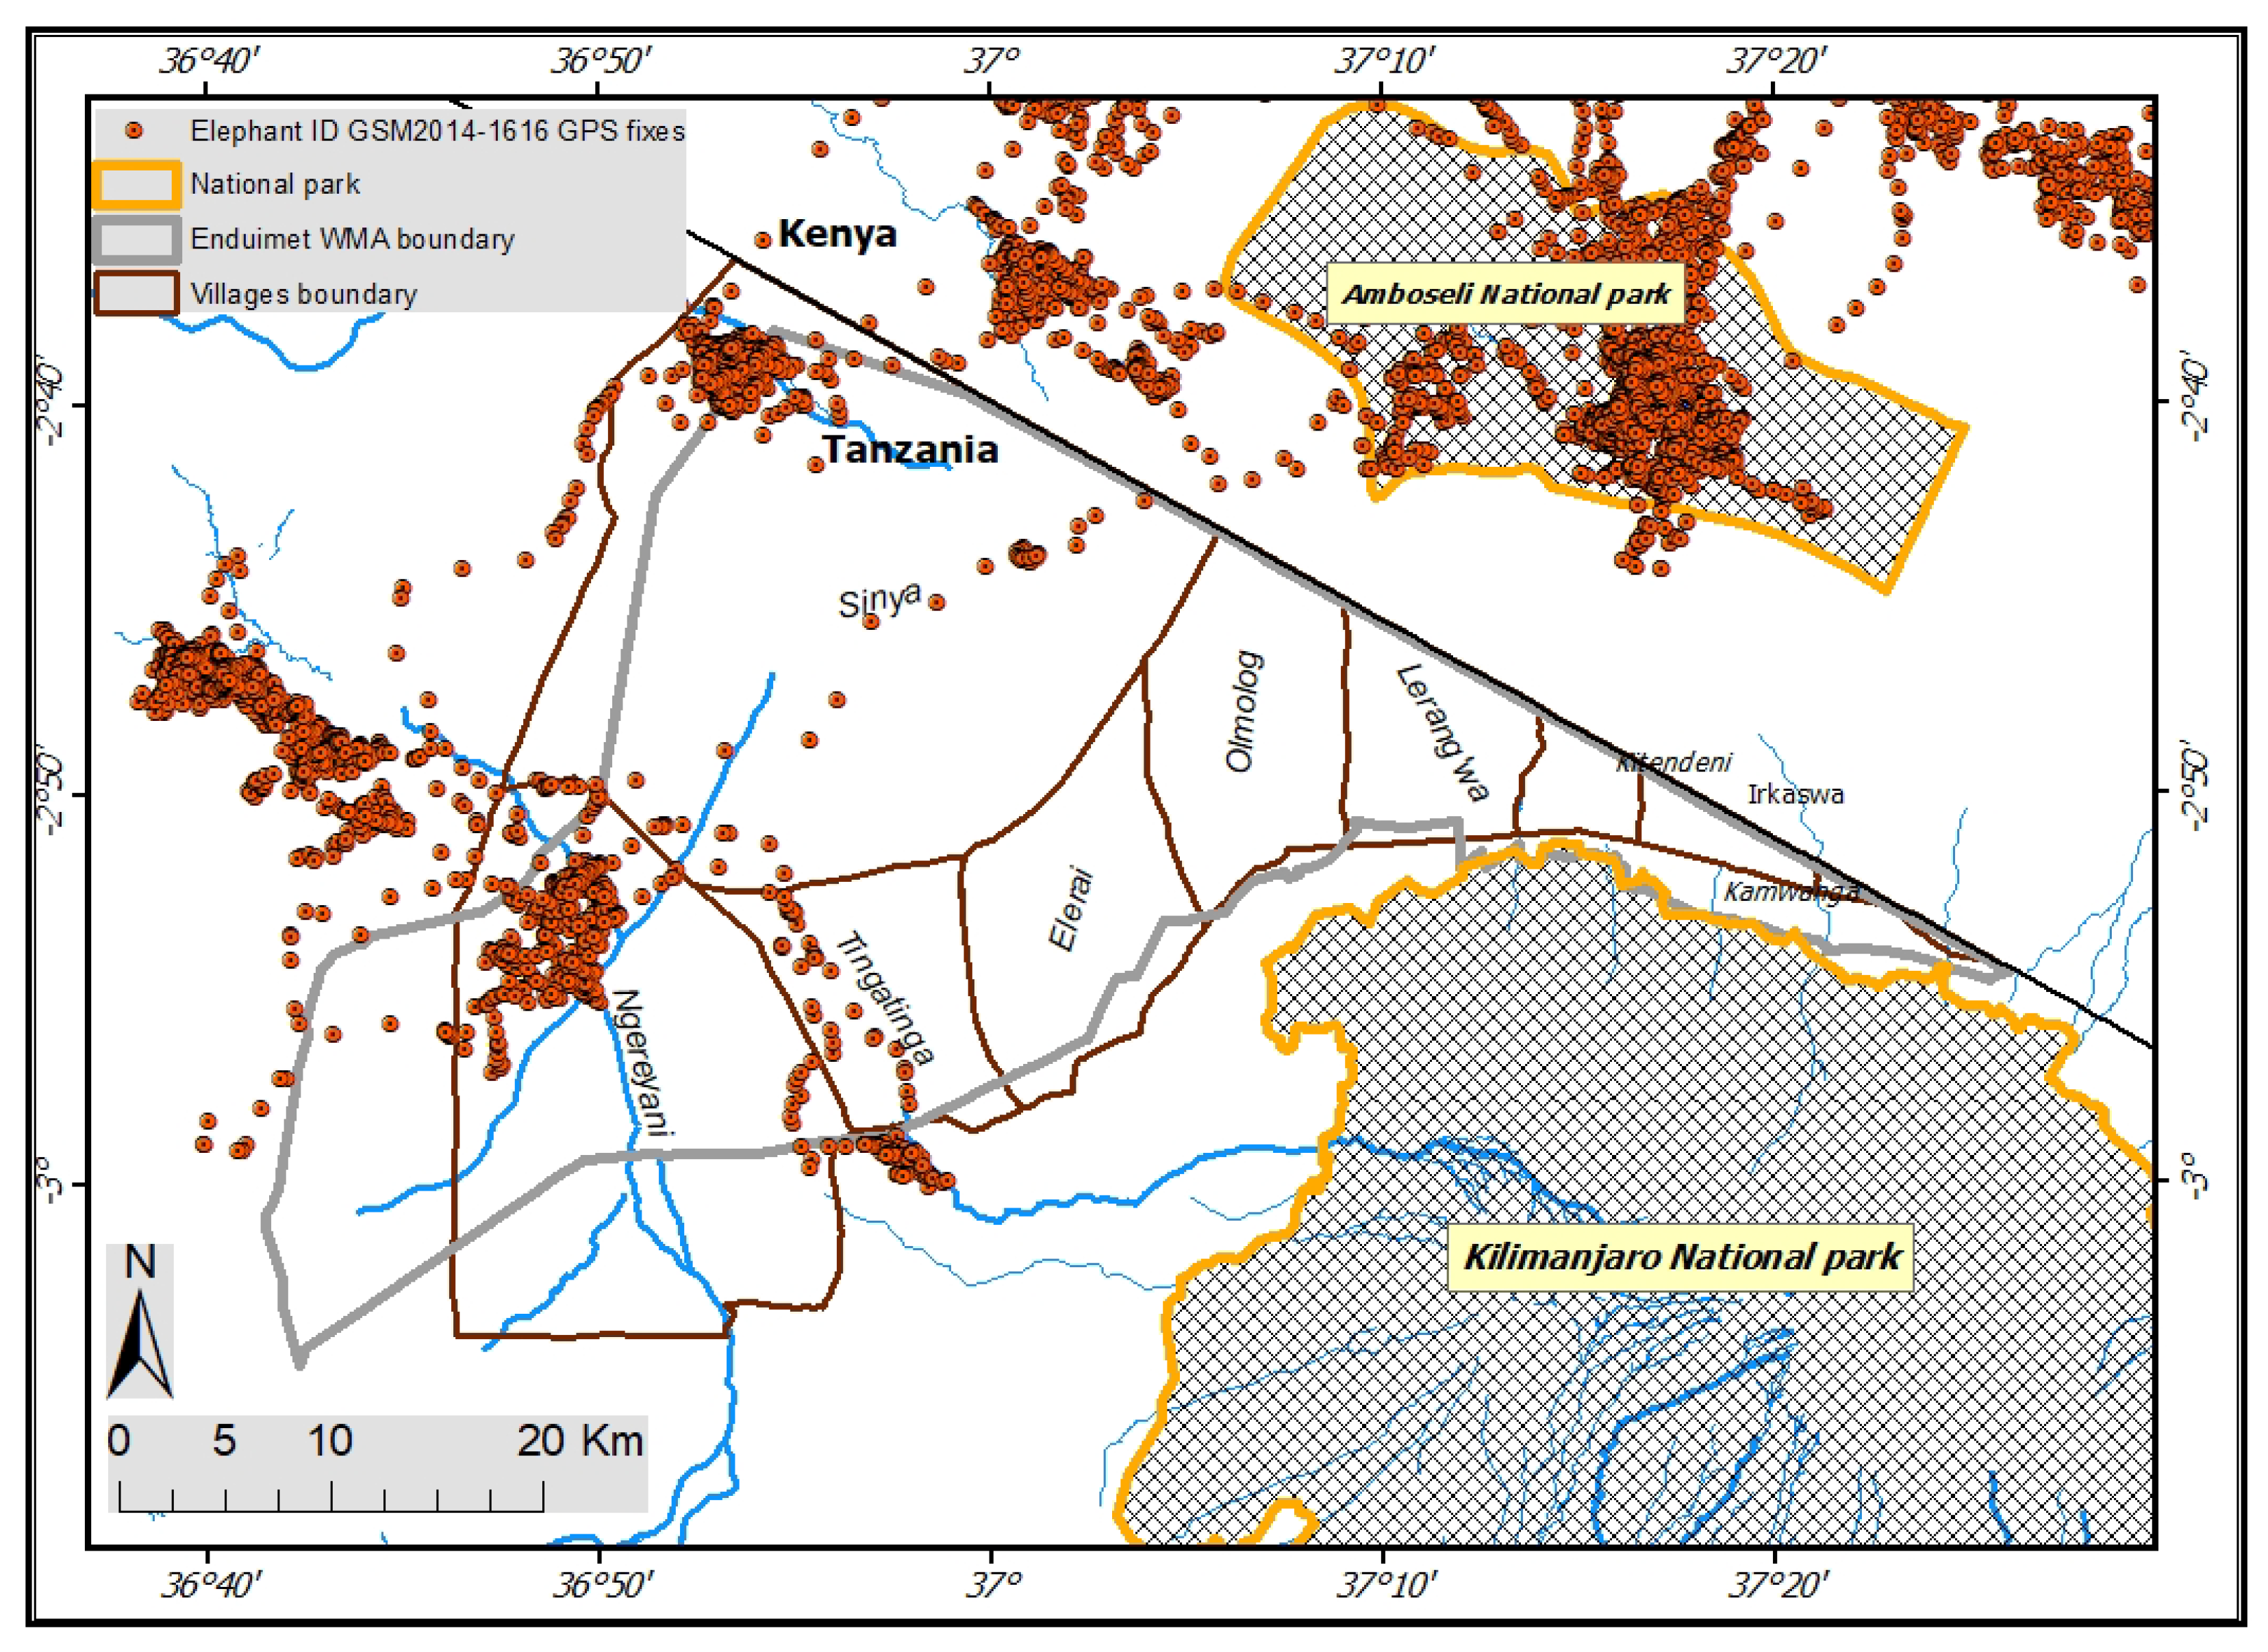
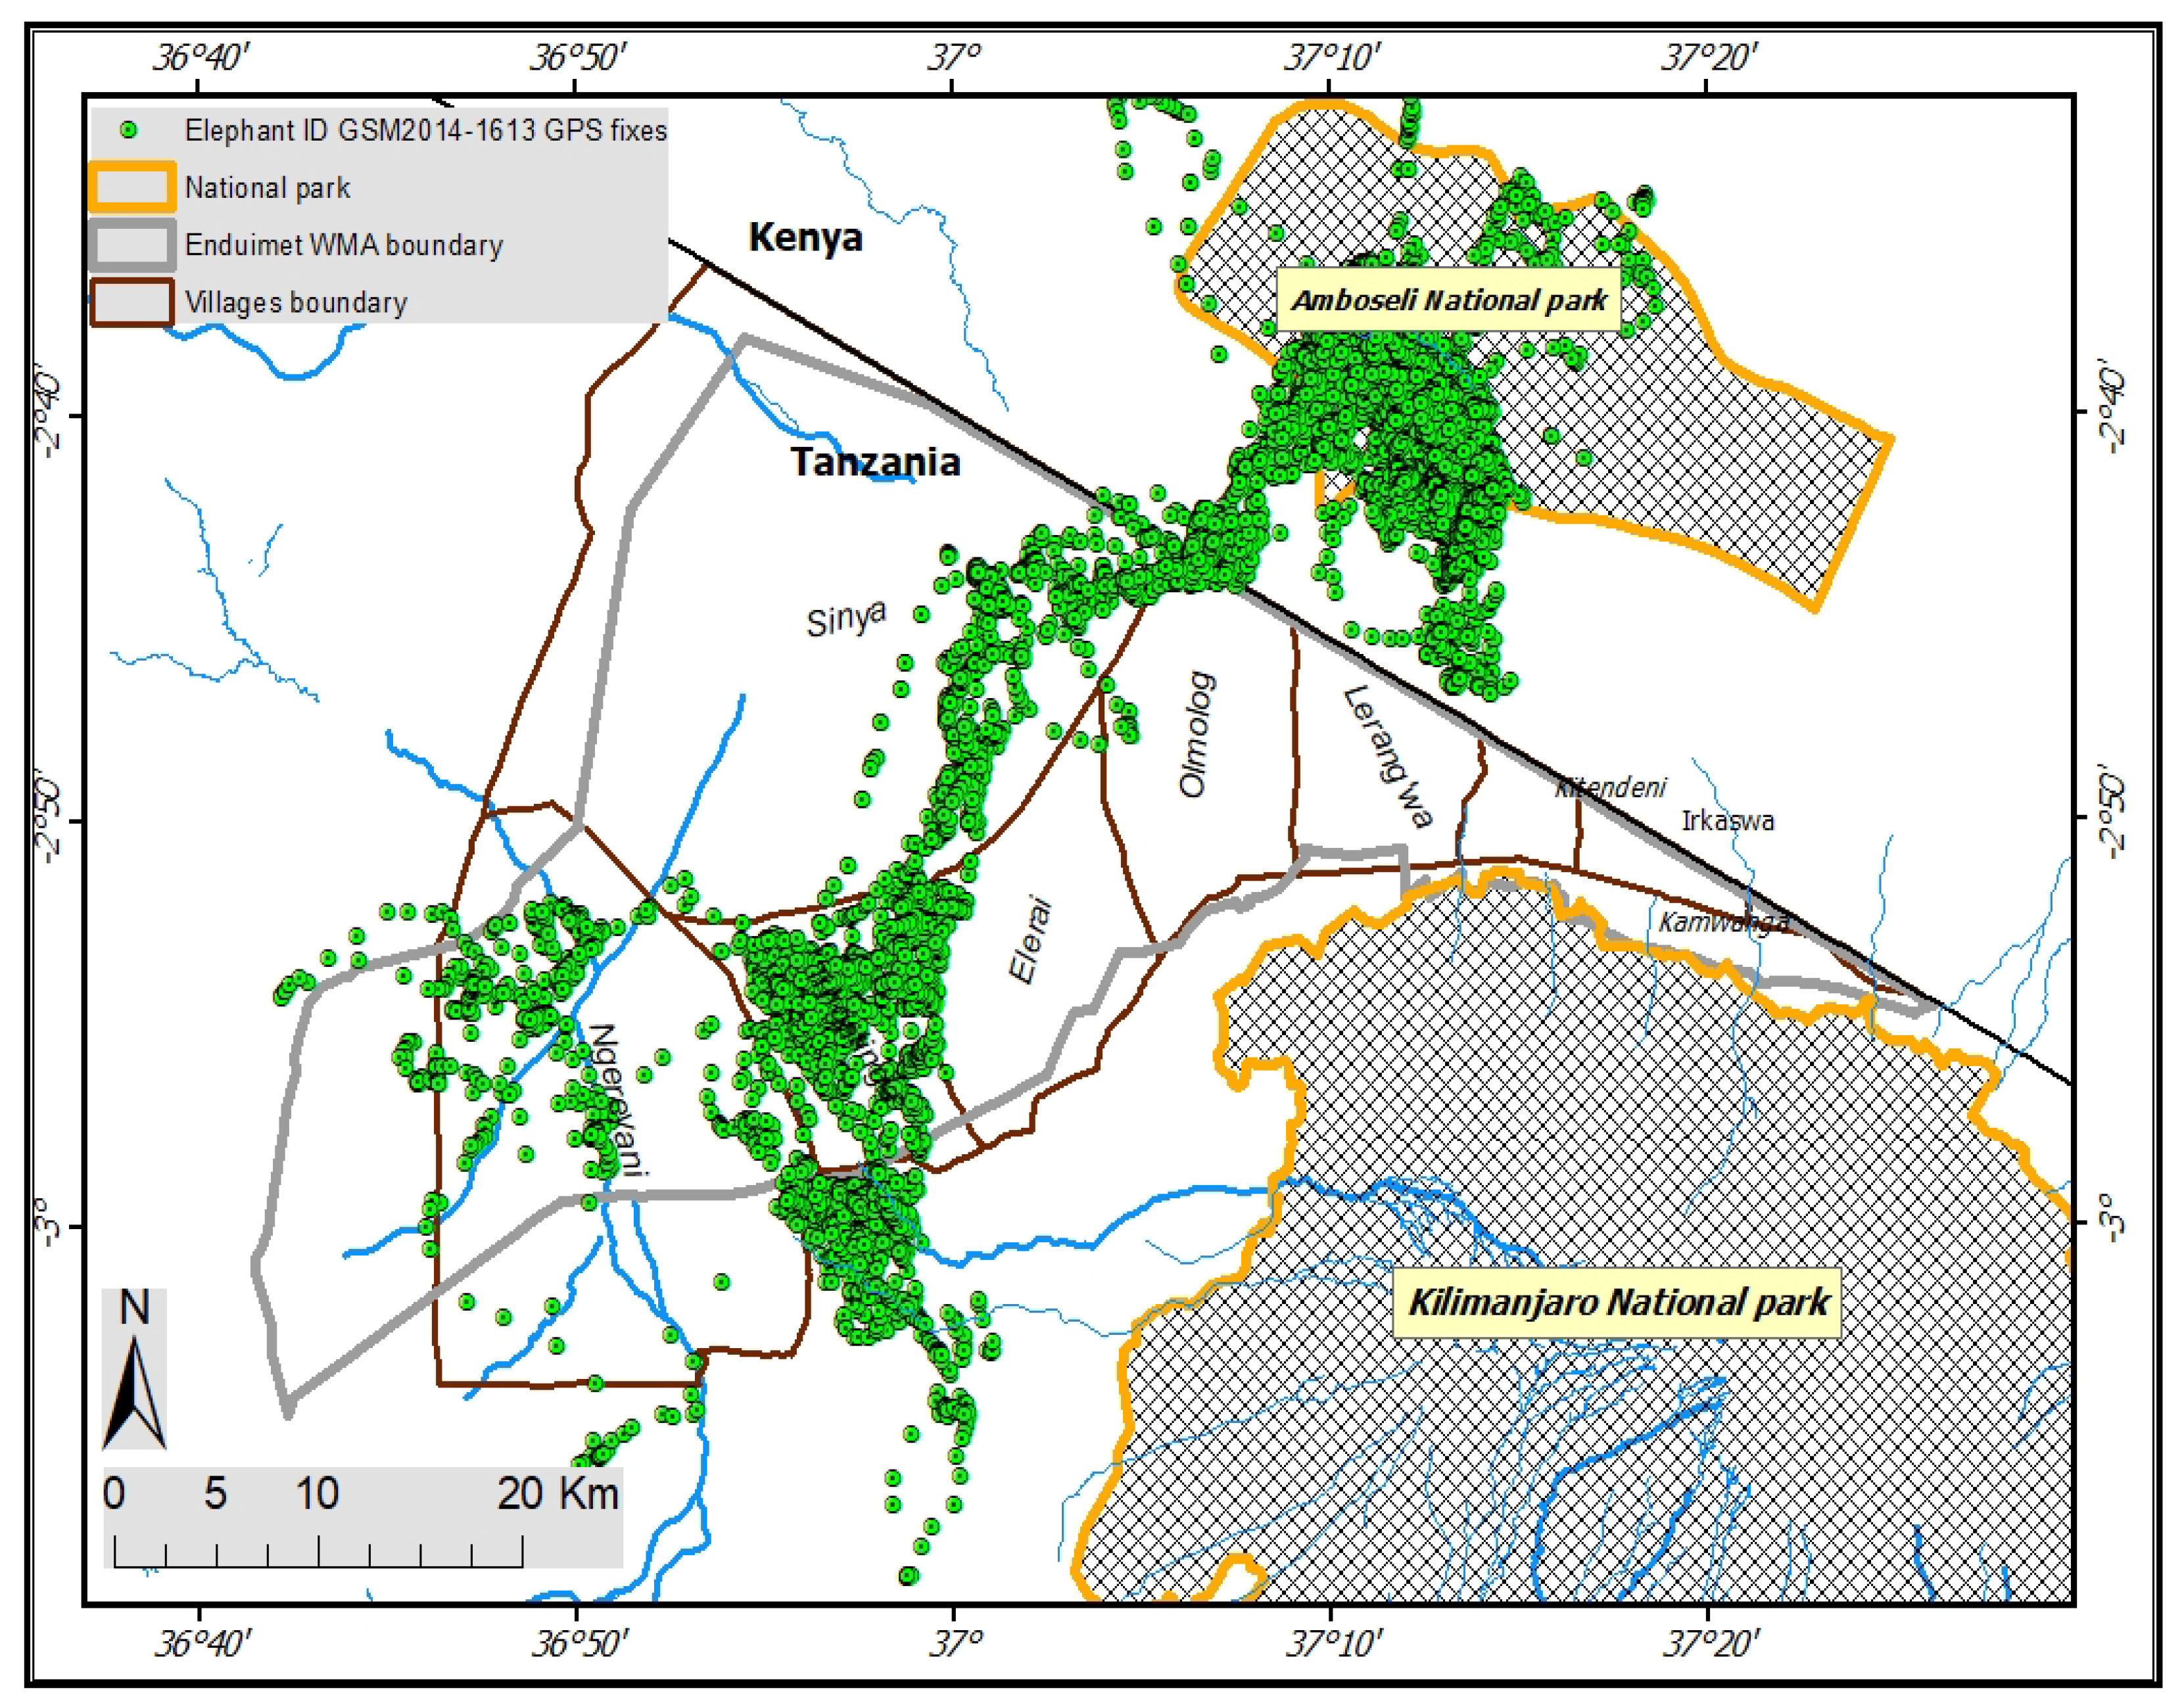
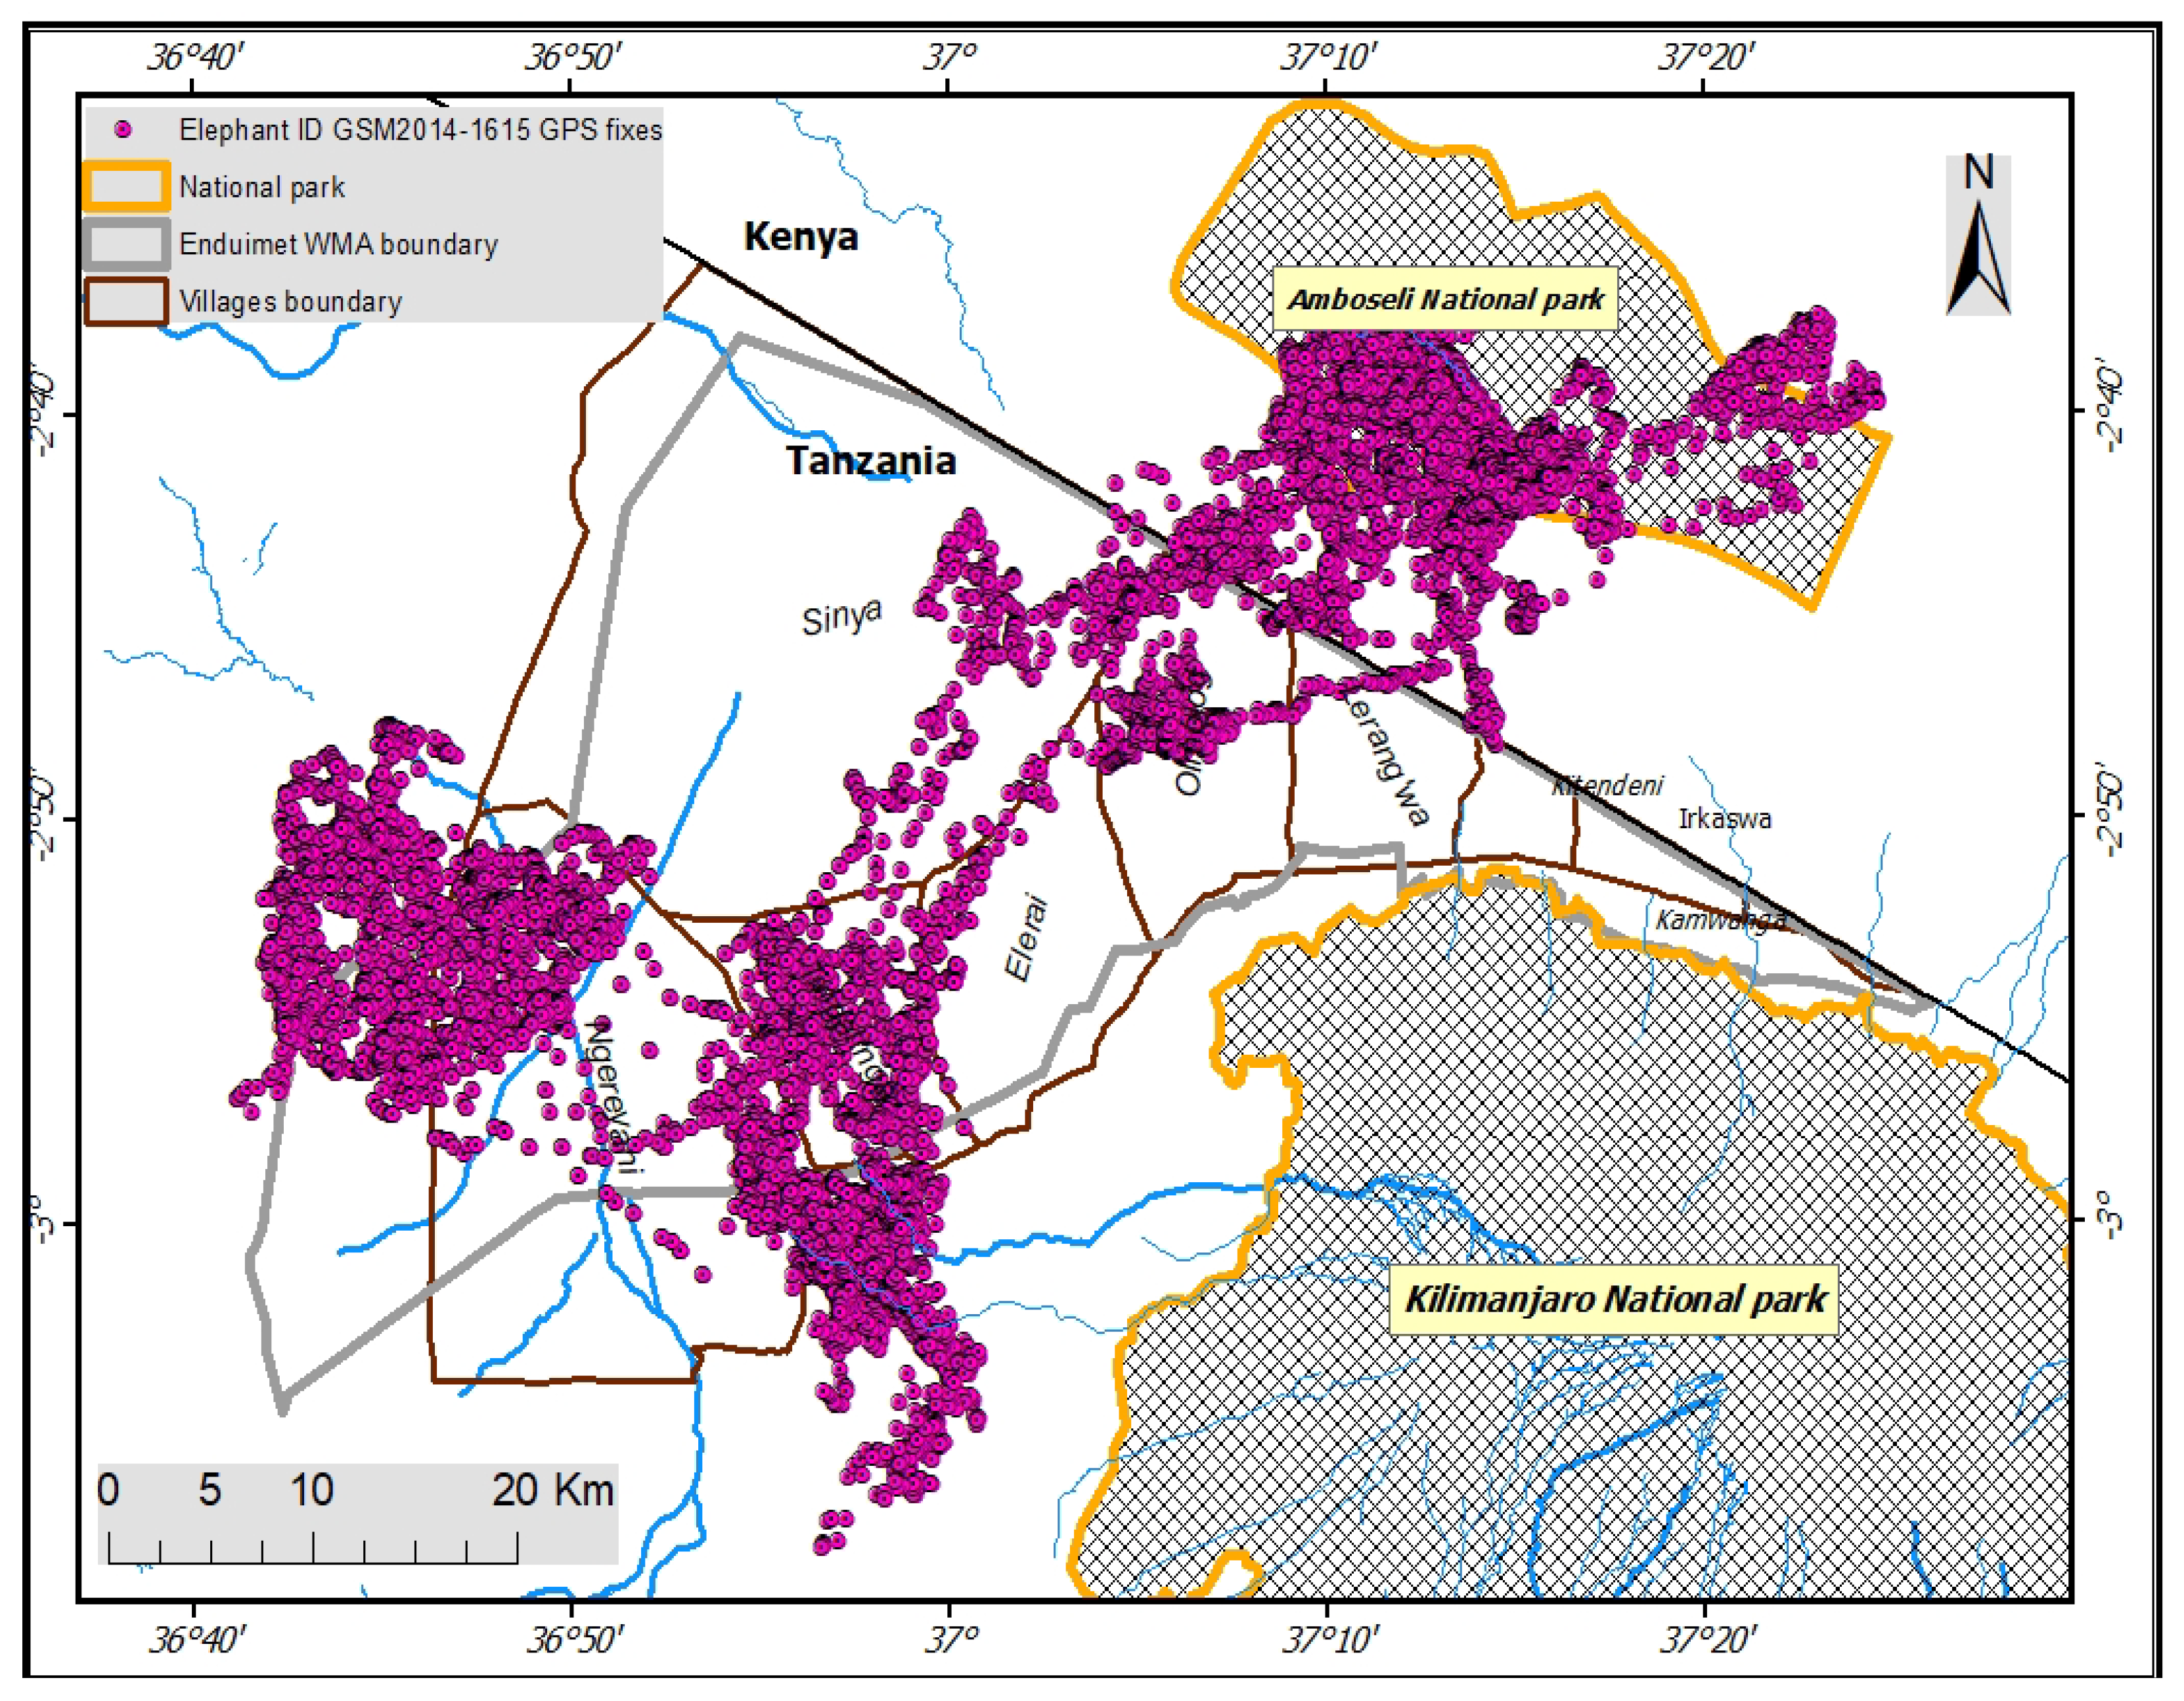
3.4. Elephant Home Range and Habitat Use

From more than 52,488 GPS fixes collected from three male collared elephants known to the Amboseli Elephant Research Project between 2019 to 2020, male elephants spent most of their time (48% of total recorded fixes, p < 0.05) in Amboseli National Park (Kenya) and 10% of their time in the EWMA (Tanzania). In agreement with other studies, elephant home range sizes were highly variable between individuals and seasons, but no significant pattern was visible (p > 0.05 for all variables; Table A3 and Figure A1, Figure A2 and Figure A3). In the EWMA, 27% of elephant GPS fixes were recorded in agricultural areas, while 38% and 34% were found in grassland and bushland, respectively. Elephant home ranges overlapped with farmland in the villages of Tingatinga and Ngereyani, where 23% of the GPS fixes were less than 2 km away from settlements and farmlands, and 27% of the GPS fixes around Lerang’wa, and Kitendeni villages were recorded near farmland (within the buffer zones or 0–20 km from the park boundary) (Figure 4).
We further found a statistically significant difference (F = 5.543, p = 0.004) in the average speed of elephants between farmland and settlements and other areas of EWMA. The collared male elephants moved almost 10% significantly slower in farmlands (0.83 km/h) compared to areas near settlements (1.08 km/h) or other areas of EWMA habitats (1.06 km/h) (Figure 5).

4. Discussion

4.1. Land Use/Land Cover Change Effects on Elephants in EWMA

There was persistent spatial and temporal LULC change in the EWMA throughout the thirty years of assessment. Grassland, bushland, and agriculture together formed 90% of the EWMA in 1989. The first two cover classes experienced the greatest reduction, to 84% in 1999, 82% in 2009 and finally 72% in 2019. Agriculture had a rapid increase during the same years (13–26%), doubling in the area from 1989 (25,999 ha) to 2019 (50,685 ha). The slight increment of 51 ha of forest area between 1999 and 2009 was likely due to a compensatory afforestation and plantation program [7]. Our findings that a large proportion of natural vegetation (152,656 ha in 1989 to 116,382 ha in 2019 or 79% in 1989 to 60% in 2019) was transformed to farmland and settlements are consistent with other studies in eastern Africa [44], indicating that anthropogenic activities are the main driver for LULC changes [8,32]. The total human population of the EWMA was around 47,103 people in 2012, with an average annual growth rate of 3% [45], which might have led to an increased demand for natural resources and land. The establishment of plantations and settlements in the EWMA, as well as intense livestock grazing practices, might have blocked the traditional migratory route of elephants from east to west [23,24,46]. However, even if elephants can navigate these obstacles, these practices usually increase the contact between elephants and people and, thereby, enhance the potential for damaged livelihoods [47,48,49]. In addition, agriculture-supporting policies encouraged the expansion of agriculture between 2009 and 2019 in the EWMA [50], causing changes in grasslands and forest cover. Globally, the human population is projected to increase in the coming decades, particularly in Africa [51] and likely also in the EWMA [52], threatening the survival of the elephant populations and their habitats. Wildlife tends to disappear when anthropogenic activities cover 25–50% of savanna landscapes [53], and our results revealed that settlement and agriculture together encompassed about 37% of the EWMA land in the year 2019. In Ghana, savanna reserves surrounded by human settlements have lost a large number of wildlife species over time [54], and we might be seeing similar trends in EWMA. The growth of human populations around PAs may further have strong negative impacts on large mammals and biodiversity through poaching, deforestation, and habitat encroachment, as was shown recently in a human-dominated landscape in North Bengal [55] Mole National Park in Ghana and Tarangire National Park in Tanzania [54].

4.2. Environmental and Anthropogenic Variability Determines HEC

We found a strong positive and significant relationship between NDVI and HEC occurrence, in line with other studies [56,57], as both elephants and farmers select areas of higher rainfall, and farmers effectively create new foraging opportunities for elephants within these already preferred areas [56,58,59]. Moreover, we found that HEC decreased with increasing elevation, likely as elephants prefer flat lands and lowland forests compared to highlands [60]. In contrast to other studies [61,62], which claimed that decreased water and food availability in protected areas could lead to higher HEC, we found a non-significant relationship between HEC occurrence and water body distribution in EWMA. The spatial resolution at which we sampled might have been too coarse and did not take artificially added water holes or seasonal water bodies into account [63]. While roads and small pathways open up areas for human passage and increase the probability of contact between humans and elephants [64], we did not find any significant positive or negative relationship of HEC with roads. This might be due to the fact that EWMA vegetation is quite open, and there is no need for elephants to use roads in otherwise inaccessible terrain [22].

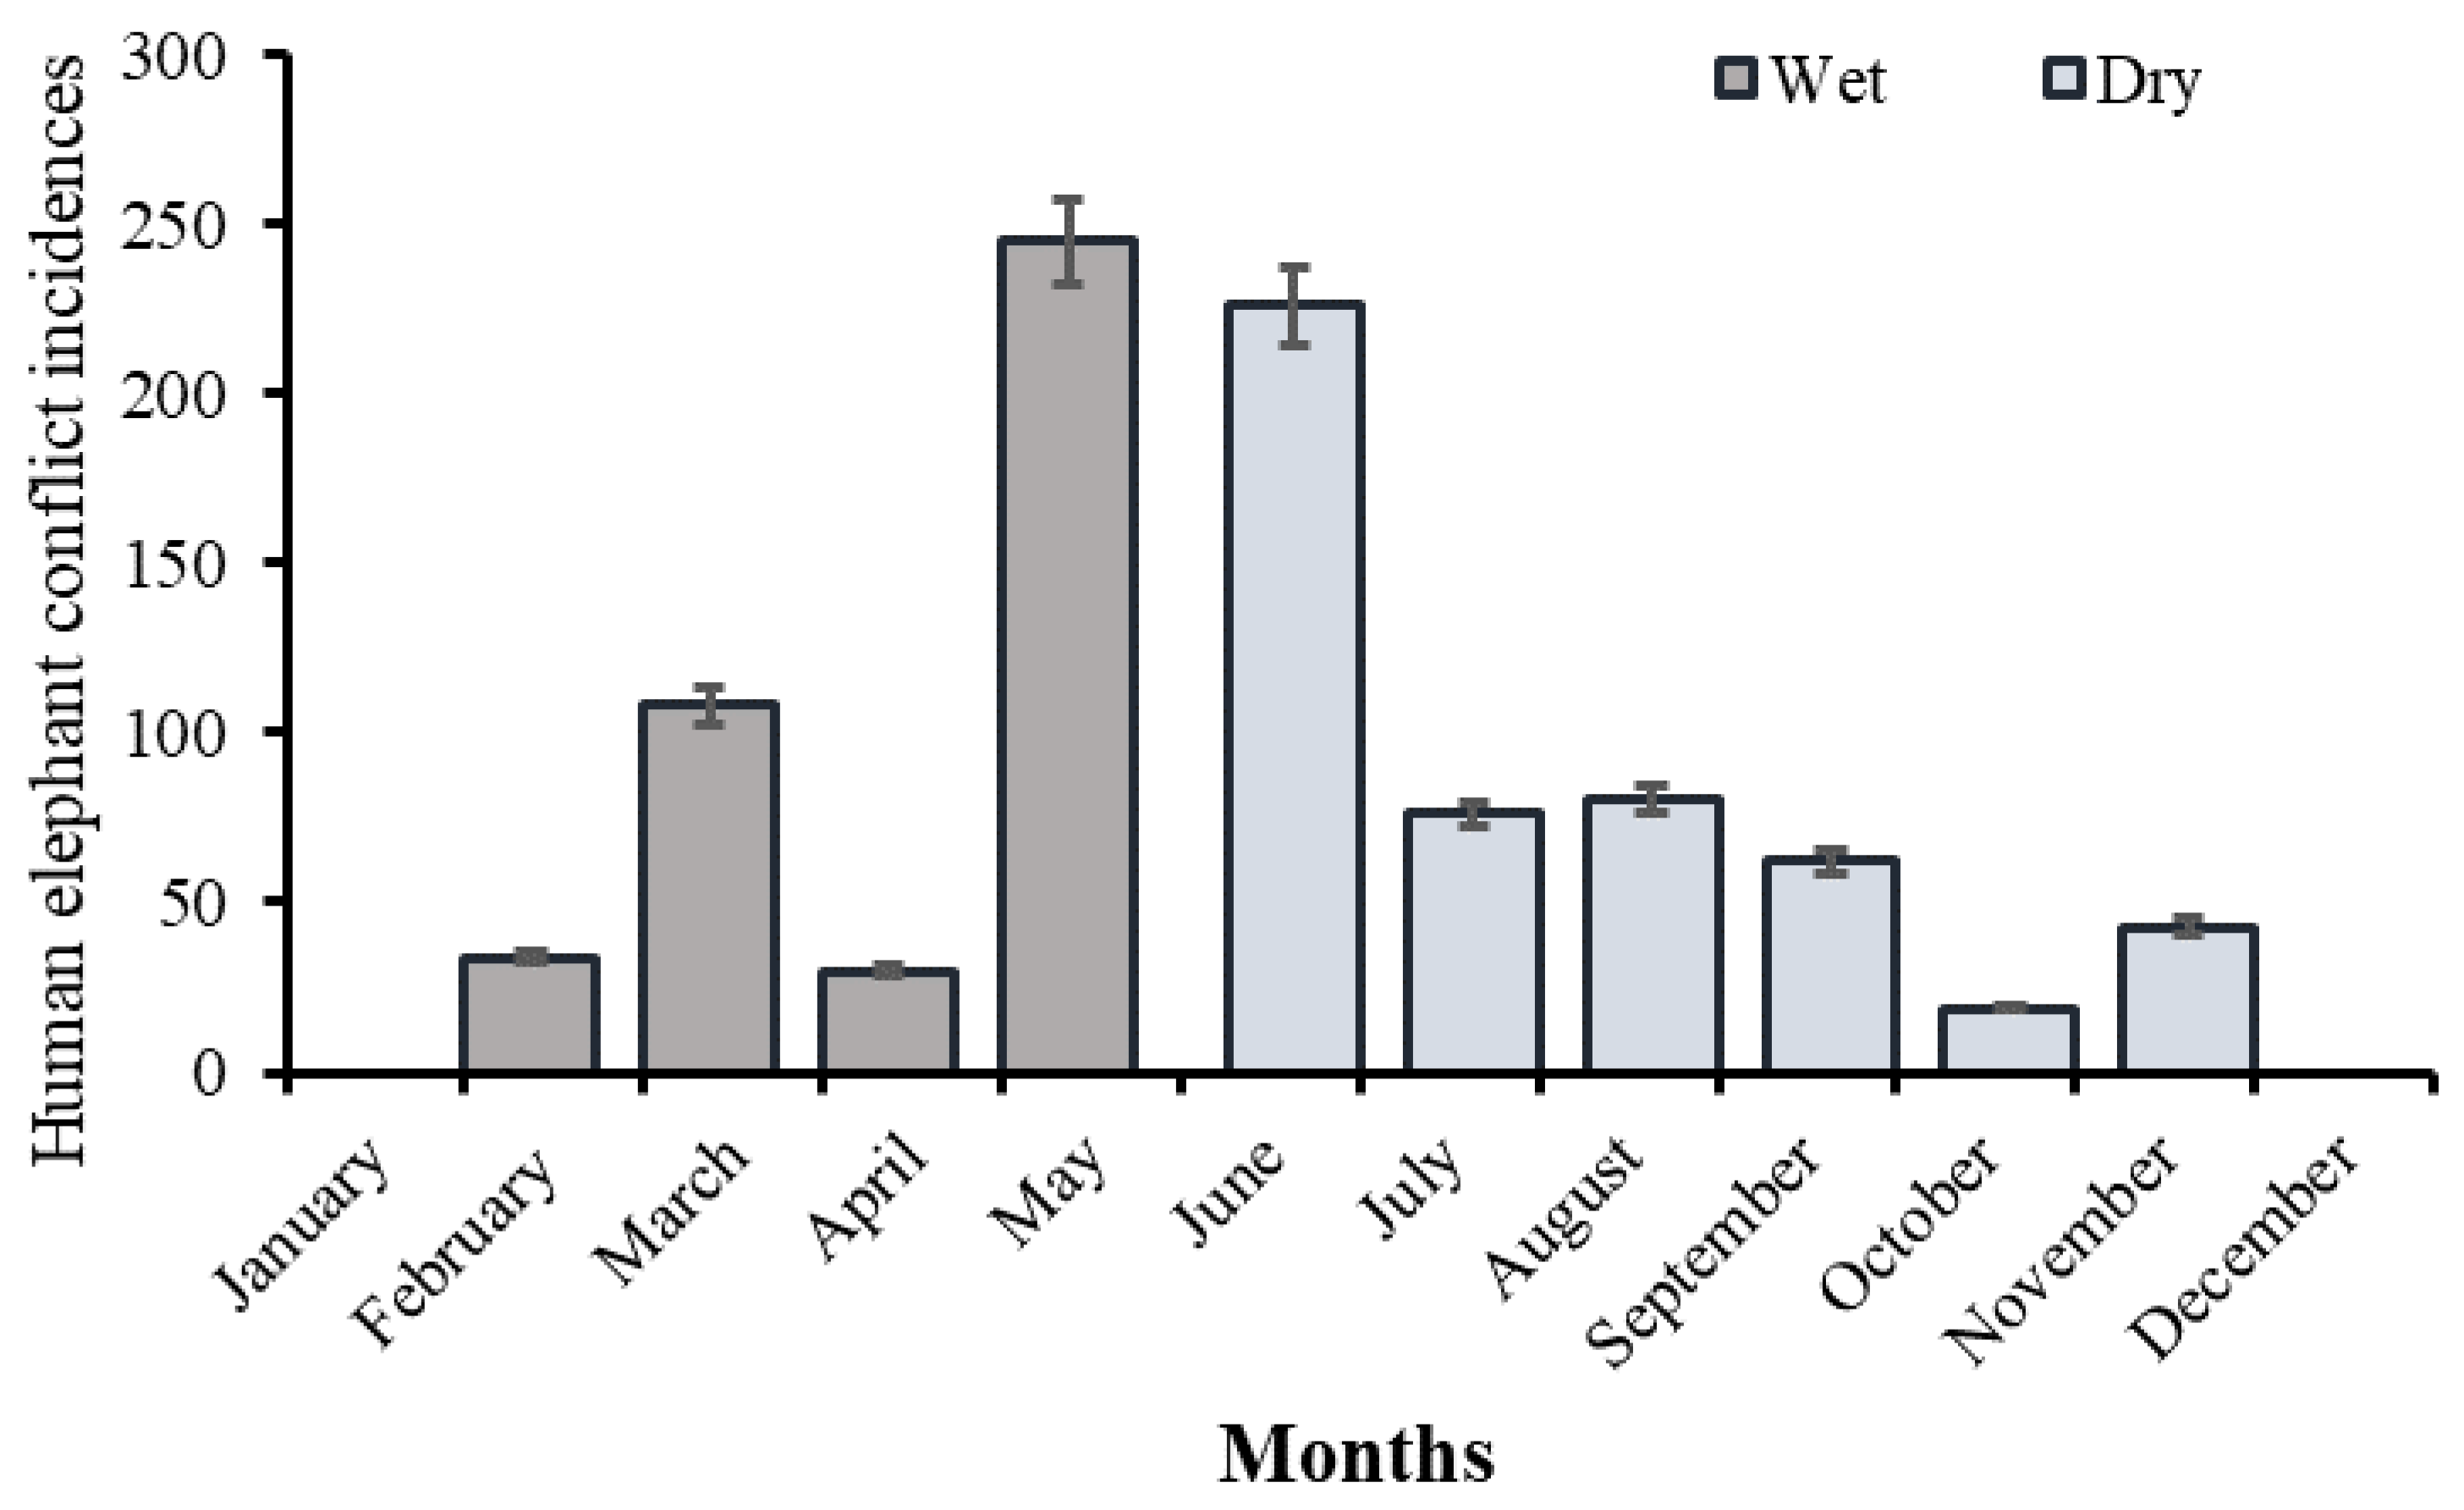
4.3. Spatio-Temporal Patterns of HEC

Our results showed the tendency of increasing HEC incidents into the dry season in June, when crops such as Zea mays (maize), Phaseolus vulgaris (beans), Solanum lycopersicum (tomatoes) and Triticum spp. (wheat) are maturing and harvested [8]. At this time, elephants raid farmlands for nutritious and palatable crops despite the availability of natural forage resources within protected areas [65,66]. Additionally, we observed spatially clustered HEC incident areas, mainly close to protected area boundaries in the EWMA, as has been widely reported across Africa’s protected areas [47,49,67,68]. Our HEC hotspots in Ngereyani and Tingatinga villages reflect the proximity of vast plantations of maize and beans as well as bushlands, a mixed tree and grass system dominating the southern parts of the EWMA, which represent an attractive habitat for elephants and potentially increased the HEC incidences in the area. The presence of dense vegetation and open grassland near farms and settlements, along with available patches of forest outside the PA in our study, may have assisted elephant movements and facilitated crop raiding. Moreover, the presence of a permanent river flowing from Tingatinga to Ngereyani is an important water source for villagers and wildlife and might have influenced the two observed HEC hotspots areas [69].

4.4. Influence of Elephant Home Ranges on HEC

We found that elephants using EWMA demonstrated less constrained movements during the wet season, albeit not significant, but had an influence on HEC as elephants do not have to stay close to surface water bodies to drink, which is crucial for lactating females and contributes to sexual segregation in elephants during the dry season [70]. Although elephants mostly used protected area habitats on both sides of the country border, the foraging opportunities in farmland were reflected by the proportion of elephant GPS fixes in agricultural areas and by relatively low walking speed [18,71].
This cluster of low elephant moving speeds likely reflects foraging opportunities available in farmland, but as these data were not overlaid with crop availability data due to different resolutions, we could not identify if any of the collared elephants were involved with identified crop foraging events.
On the other hand, elephants travelled at the same speeds in settlement areas and in other EWMA areas. Generally, male elephants have higher risk tolerance and a higher payoff for crop foraging [72], and this trend was visible in our collar data. Understanding that crop foraging is only a small part of an elephant’s ranging behavior is important for developing sustainable solutions, as our collared elephants spent 90% of their time in other areas (the rest of EWMA that is neither settlement nor farmland) rather than near farms [73]. Our results are further in line with [74], who found HEC in Rombo district close to Kilimanjaro National Park mainly occurring during the night. In addition, our study revealed cold spots for HEC in areas that were cultivated with crops less preferred by elephants, such as Taro (Colocasia esculenta), Tumeric (Cuscuma longa), Chili (Capsicum sp.), Eggplant (Solanum sp.) [67], which are not currently planted by farmers in EWMA, highlighting a potentially robust solution against HEC. Areas of high human population and a decrease of suitable land were the best predictors of HEC in Mozambique [75], where it was found that areas with a human population density of <60 people/km2 had lower HEC incidences than areas with higher human population densities. At low population densities, there is less interaction between humans and elephants, but also human driven destruction on elephant habitats and migratory routes might be lower [76]. Unfortunately, our time span for land cover change and GPS collar data did not cover exactly the same time span, during which conflict occurrences were assessed, making it difficult to relate changes in LULC to HEC incidences over time. Further, reports and interviews might have exaggerated damage extent as farmers receive reimbursement only for certain damage to their crops. Nevertheless, we think that our socio-ecological approach is highly valuable in identifying spatial and temporal conflict risk zones and finding underlying factors, which can be applied for further land management actions. Nevertheless, our study provides a spatio-temporal HEC risk-map, and we were able to show that our combination of cross-boundary long-term remote sensing imagery series with unpublished reports on crop raids and GPS elephant movement data provide a valuable resource for HEC predictions and land use planning strategies for in the EWMA of northern, Tanzania.

5. Conclusions

Our analysis showed that human-induced LULC changes and the encroachment into elephant habitats have resulted in spatially and temporally predictable increases in HEC in EWMA. Particularly, forests and grasslands have been converted into agricultural land and settlements over the last three decades, which may have increased the competition between elephants and humans. As the majority of farms in EWMA are located close (0–20 km) to the protected areas, which likely stimulated crop foraging and escalated conflict situations, we propose to enforce buffer zones and effectively increase the distance of human settlements and farmland from protected areas and elephant habitats. Local farmers urgently need village-level crop protection, along with small-scale land-use planning around protected areas, as an important first step to halt an escalating conflict situation but need to be supported with longer-range strategies that separate incompatible land-use types and encourage the cultivation of alternative crops and livelihood diversification [67]. We highlight that movement speed by elephants can be a crucial indicator for potential foraging hotspots and associated conflicts. Tracking data can be used to delineate well-used movement paths, and together with suggested cultivation distances from such paths, land-use policies can be informed at the governmental level. This will minimize further agricultural encroachment and keep corridors and habitats accessible to elephants while diminishing HEC [77] and protecting rural livelihoods. We were able to show that our combination of cross-boundary long-term remote sensing imagery series with unpublished reports on crop raids and GPS elephant movement data provide a valuable resource for HEC predictions and land use planning strategies in northern Tanzania.

Supplementary Materials

The following are available online at https://www.mdpi.com/article/10.3390/d14070513/s1, File S1: Questionnaire for local respondents.

Author Contributions

J.E.S.: conceptualization, methodology, images processing, formal analysis, writing original draft, reviewing, and editing, D.V.: formal analysis, reviewing and editing. C.L.: formal analysis, formatting, and editing, V.F.: formal analysis, reviewing, G.G. for statistical analysis and A.C.T.: Conceptualization, methodology, reviewing, supervision and editing. All authors have read and agreed to the published version of the manuscript.

Funding

This research was funded by the African Development Bank (AfDB), The Rufford Foundation through Small Grant for Conservation (Number 30296–1), Nord Anglia Education and we are grateful to Idea Wild for their support in research equipment.

Institutional Review Board Statement

Ethical clearance was obtained from the research ethics committee at the Nelson Mandela African Institution of Science and Technology (NM-AIST), Tanzania and Tanzania Commission for Science and Technology (COSTECH) with Research permit number 2020-148-NA-2020-05.

Data Availability Statement

The data presented in this study are available on request from the corresponding author. The data are not publicly available to due to privacy.

Acknowledgments

We acknowledge the Tanzania Wildlife Research Institute (TAWIRI) and Enduimet Wildlife Management Area (EWMA) for granting us the research permit and access to conduct the fieldwork, OIKOS East Africa, for providing HEC data. Further, we acknowledge Amboseli Trust for Elephants for providing access to elephant collar datasets. We thank field assistants and village executives of Kitendeni, Tingatinga, Elerai, Irkaswa and Sinya, for allowing household surveys to be conducted in their communities.

Conflicts of Interest

The authors declare that they have no known competing financial interests or personal relationship that could have influenced the work reported in this paper.

Appendix A

Table A1. Details of the Landsat images used for land use/land cover mapping during our study in the Enduimet Wildlife Management area, Tanzania, for the years 1989, 1999, 2009 and 2019 (source: http://www.usgs.gov, accessed on 29 March 2021).
Acquisition DateScenes (Path/Row)% Cloud CoverSensorData Source
8/24/1989139/42<10%TMUSGS
7/2/1999138/42<10%ETM+USGS
7/11/2009137/062<10%ETM+USGS
8/7/2019138/062<10%OLI & TIRSUSGS
Table A2. Description of Land use/Land cover (LULC) classes used in our analysis modified from a classification system by [32,33] in the Enduimet Wildlife Management Area, Tanzania, from 1989, 1999, 2009 to 2019.
LULC TypesLULC Description
AgricultureLand actively used to grow crops (seasonal and permanent)
Bare groundNo vegetation (exposed rock outcrops and bare soil)
BushlandDominated by multi-stemmed plants from a single root base and woody cover
Forest>50% canopy cover of woody plants of ≥5 m height
Grassland<10% cover of sparse woody plants, dominated by continuous herbaceous cover
SettlementUrban and rural settlements (houses, roads, infrastructure)
WaterWater bodies, mostly permanent (inland water)
WetlandMarshes or swamps; saturated land
Woodland<50% canopy cover of woody plants of ≥5 m height
Figure A1. Spatial distribution of one collared elephant with the ID GSM2014-1616 (n = 17,452) in the Amboseli National Park in Kenya, in the Kilimanjaro National Park and Enduimet Wildlife Management Area (EWMA) in Tanzania. Source: Amboseli Trust for Elephants.
Diversity 14 00513 g0a1
Figure A2. Spatial distribution of one collared elephant with the ID GSM2014-1613 (n = 17,472) in the Amboseli National Park in Kenya, in the Kilimanjaro National Park and Enduimet Wildlife Management Area (EWMA) in Tanzania. Source: Amboseli Trust for Elephants.
Diversity 14 00513 g0a2
Figure A3. Spatial distribution of one collared elephant with the ID GSM2014-1615 (n = 17,472) in the Amboseli National Park in Kenya, covering the Kilimanjaro National Park and Enduimet Wildlife Management Area (EWMA) in Tanzania. Source: Amboseli Trust for Elephants.
Diversity 14 00513 g0a3
Table A3. Annual and seasonal 100% maximum convex polygon (100% MCP), and Seasonal 95% Fixed kernel density (KDE) home range sizes (km2) for three male elephants monitored via GPS collars in Amboseli, Kenya, and in northern Tanzania from (2019–2020). Wet = wet season (January–May; dry = dry season (June–November).
100 % MCPSexNoAnnualWetDry
Male1552368368
212781066704
3819816169
Mean (x¯)996756644
95% KDE No Season
WetDry
Male1 981700
2 816269
3 568472
Mean (x¯) 740466
Figure A4. Temporal distribution of average (±SE) human elephant conflict (HEC) incidences reported in the Enduimet Wildlife Management Area across the year, averaged for the years 2016 and 2019. (Note: no data were collected in the months Dec and Jan, likely indicating no HEC occurrence).
Diversity 14 00513 g0a4

References

  1. Hariohay, K.M.; Munuo, W.A.; Roskaft, E. Human-Elephant Interactions in Areas Surrounding the Rungwa, Kizigo, and Muhesi Game Reserves, Central Tanzania. Oryx 2020, 54, 612–620. [Google Scholar] [CrossRef] [Green Version]
  2. Nyhus, P.J. Human-Wildlife Conflict and Coexistence. Annu. Rev. Environ. Resour. 2016, 41, 143–171. [Google Scholar] [CrossRef] [Green Version]
  3. Kideghesho, J.R. The Elephant Poaching Crisis in Tanzania: A Need to Reverse the Trend and the Way Forward. Trop. Conserv. Sci. 2016, 9, 369–388. [Google Scholar] [CrossRef]
  4. Gross, E.M.; Lahkar, B.P.; Subedi, N.; Nyirenda, V.R. Seasonality, Crop Type and Crop Phenology Influence Crop Damage by Wildlife Herbivores in Africa and Asia. Biodivers. Conserv. 2018, 27, 2029–2050. [Google Scholar] [CrossRef]
  5. Billah, M.M.; Rahman, M.M.; Abedin, J.; Akter, H. Land Cover Change and Its Impact on Human–Elephant Conflict: A Case from Fashiakhali Forest Reserve in Bangladesh. SN Appl. Sci. 2021, 3, 649. [Google Scholar] [CrossRef]
  6. Veldhuis, M.P.; Ritchie, M.E.; Ogutu, J.O.; Morrison, T.A.; Beale, C.M.; Estes, A.B.; Mwakilema, W.; Ojwang, G.O.; Parr, C.L.; Probert, J.; et al. Cross-Boundary Human Impacts Compromise the Serengeti-Mara Ecosystem. Science 2019, 363, 1424–1428. [Google Scholar] [CrossRef] [Green Version]
  7. Mbane, J.O.; Chira, R.M.; Mwangi, E.M. Impact of Land Use and Tenure Changes on the Kitenden Wildlife Corridor, Amboseli Ecosystem, Kenya. Afr. J. Ecol. 2019, 57, 335–343. [Google Scholar] [CrossRef]
  8. Mmbaga, N.E.; Munishi, L.K.; Treydte, A.C. How Dynamics and Drivers of Land Use/Land Cover Change Impact Elephant Conservation and Agricultural Livelihood Development in Rombo, Tanzania. J. Land Use Sci. 2017, 12, 168–181. [Google Scholar] [CrossRef]
  9. Mukeka, J.M.; Ogutu, J.O.; Kanga, E.; Røskaft, E. Human-Wildlife Conflicts and Their Correlates in Narok County, Kenya. Glob. Ecol. Conserv. 2019, 18, e00620. [Google Scholar] [CrossRef]
  10. Aryal, A.; Brunton, D.; Raubenheimer, D. Impact of Climate Change on Human-Wildlife-Ecosystem Interactions in the Trans-Himalaya Region of Nepal. Theor. Appl. Climatol. 2014, 115, 517–529. [Google Scholar] [CrossRef]
  11. Sintayehu, D.W.; Kassaw, M. Impact of Land Cover Changes on Elephant Conservation in Babile Elephant Sanctuary, Ethiopia. Biodivers. Int. J. 2019, 3, 65–71. [Google Scholar] [CrossRef]
  12. Graham, M.D.; Douglas-Hamilton, I.; Adams, W.M.; Lee, P.C. The Movement of African Elephants in a Human-Dominated Land-Use Mosaic. Anim. Conserv. 2009, 12, 445–455. [Google Scholar] [CrossRef]
  13. IUCN. The UICN Red List of Threatened Species. UICN Red List Threat. Species 2020. Available online: https://www.iucn.org/sites/dev/files/import/downloads/iucn_brochure_low_res.pdf (accessed on 13 April 2021).
  14. Poulsen, J.R.; Rosin, C.; Meier, A.; Mills, E.; Nuñez, C.L.; Koerner, S.E.; Blanchard, E.; Callejas, J.; Moore, S.; Sowers, M. Ecological Consequences of Forest Elephant Declines for Afrotropical Forests. Conserv. Biol. 2018, 32, 559–567. [Google Scholar] [CrossRef] [PubMed]
  15. Pringle, R.M. Elephants as Agents of Habitat Creation for Small Vertebrates at the Patch Scale. Ecology 2008, 89, 26–33. [Google Scholar] [CrossRef] [PubMed]
  16. Mwakatobe, A.; Julius, N.; Janemary, N.; Eivin, R. The Impact of Crop Raiding by Wild Animals in Communities Surrounding the Serengeti National Park, Tanzania. Int. J. Biodivers. Conserv. 2014, 6, 637–646. [Google Scholar] [CrossRef] [Green Version]
  17. Wall, J.; Wittemyer, G.; Klinkenberg, B.; LeMay, V.; Blake, S.; Strindberg, S.; Henley, M.; Vollrath, F.; Maisels, F.; Ferwerda, J.; et al. Human Footprint and Protected Areas Shape Elephant Range across Africa. Curr. Biol. 2021, 31, 2437–2445.e4. [Google Scholar] [CrossRef]
  18. Troup, G.; Doran, B.; Au, J.; King, L.E.; Douglas-Hamilton, I.; Heinsohn, R. Movement Tortuosity and Speed Reveal the Trade-Offs of Crop Raiding for African Elephants. Anim. Behav. 2020, 168, 97–108. [Google Scholar] [CrossRef]
  19. Gubbi, S. Patterns and Correlates of Human-Elephant Conflict around a South Indian Reserve. Biol. Conserv. 2012, 148, 88–95. [Google Scholar] [CrossRef]
  20. Naughton-Treves, L. Society for Conservation Biology Predicting Patterns of Crop Damage by Wildlife around Kibale National Park, Uganda. Conserv. Biol. 2019, 12, 156–168. [Google Scholar]
  21. Martin, E.H.; Jensen, R.R.; Hardin, P.J.; Kisingo, A.W.; Shoo, R.A.; Eustace, A. Assessing Changes in Tanzania’s Kwakuchinja Wildlife Corridor Using Multitemporal Satellite Imagery and Open-Source Tools. Appl. Geogr. 2019, 110, 102051. [Google Scholar] [CrossRef]
  22. Minwary, M.Y. Politics of Participatory Wildlife Management in Enduimet WMA, Tanzania, Noragric, Norwegian University of Life Sciences (UMB), AS, Norway, 2009. Available online: https://agris.fao.org/agris-search/search.do?recordID=NO2009273353 (accessed on 18 January 2021).
  23. Mariki, S.B.; Svarstad, H.; Benjaminsen, T.A. Elephants over the Cliff: Explaining Wildlife Killings in Tanzania. Land Use Policy 2015, 44, 19–30. [Google Scholar] [CrossRef]
  24. Dekker, L. A Disagreement about Livestock Grazing in Enduimet Wildlife Management Area Heterogeneous Communities and the Use of Agency in Community—Based Natural Resource Management Projects. 2018. Available online: https://edepot.wur.nl/442531 (accessed on 2 June 2020).
  25. Kikoti, A.P. Seasonal Home Range Sizes, Transboundary Movements and Conservation of Elephants in Northern Tanzania. Ph.D. Thesis, University of Massachusetts Amherst, Amherst, MA, USA, 2009; p. 108. [Google Scholar] [CrossRef]
  26. Okello, M.M.; Kenana, L.; Maliti, H.; Kiringe, J.W.; Kanga, E.; Warinwa, F.; Bakari, S.; Ndambuki, S.; Massawe, E.; Sitati, N. Population Density of Elephants and Other Key Large Herbivores in the Amboseli Ecosystem of Kenya in Relation to Droughts. J. Arid Environ. 2016, 135, 64–74. [Google Scholar] [CrossRef]
  27. Philip, M.; Frohardt, K. Study on the development of transboundary natural resource management areas in Africa. In Kilimanjaro Heartland Case Study; AWF: Washington, DC, USA, 2006. [Google Scholar]
  28. Noe, C. Land Use Change Impacts and Dynamics (LUCID); Project Working Paper #; LUCID: Nairobi, Kenya, 2003; Volume 31. [Google Scholar]
  29. Mariki, S.B. Communities and Conservation in West Kilimanjaro, Tanzania: Participation, Costs and Benefits. Ph.D. Thesis, Department of International Environment and Development (Noragric), Norwegian University of Life Sciences, As, Norway, 2015. [Google Scholar]
  30. Songorwa, A.N. Human Population Increase and Wildlife Conservation in Tanzania: Are the Wildlife Managers Addressing the Problem or Treating Symptoms? African J. Environ. Assess. Manag. 2004, 9, 49–77. [Google Scholar]
  31. Trench, P.C.; Steven, K.; Fred, N.; Katherine, H. Still “People of Cattle”? Livelihoods, diversification and community conservation in Longido District. In Staying Maasai? Springer: New York, NY, USA, 2009; pp. 217–256. [Google Scholar]
  32. Kija, H.K.; Ochieng Ogutu, J.; Johana Mangewa, L.; Bukombe, J.; Verones, F.; Jessen Graae, B.; Ramadhani Kideghesho, J.; Yahya Said, M.; Fred Nzunda, E. Land Use and Land Cover Change Within and Around the Greater Serengeti Ecosystem, Tanzania. Am. J. Remote Sens. 2020, 8, 1. [Google Scholar] [CrossRef]
  33. Msofe, N.K.; Sheng, L.; Lyimo, J. Land Use Change Trends and Their Driving Forces in the Kilombero Valley Floodplain, Southeastern Tanzania. Sustainability 2019, 11, 505. [Google Scholar] [CrossRef] [Green Version]
  34. Campbell, J.B.; Wynne, R.H. Introduction to Remote Sensing; Guilford Press: New York, NY, USA, 2011. [Google Scholar]
  35. Congalton, R.G. A Review of Assessing the Accuracy of Classifications of Remotely Sensed Data. Remote Sens. Environ. 1991, 37, 35–46. [Google Scholar] [CrossRef]
  36. Serra, P.; Pons, X.; Saurí, D. Post-Classification Change Detection with Data from Different Sensors: Some Accuracy Considerations. Int. J. Remote Sens. 2003, 24, 3311–3340. [Google Scholar] [CrossRef]
  37. Reis, S. Analyzing Land Use/Land Cover Changes Using Remote Sensing and GIS in Rize, North-East Turkey. Sensors 2008, 8, 6188–6202. [Google Scholar] [CrossRef]
  38. Punch, K.F. Introduction to Social Research: Quantitative and Qualitative Approaches; Sage: Thousand Oaks, CA, USA, 2013. [Google Scholar]
  39. Acharya, A.S.; Prakash, A.; Saxena, P.; Nigam, A.; Acharya, A.S. Sampling: Why and How of It? Symposium Sampling: Why and How of It? Indian J. Med. Spec. 2013, 4, 330–333. [Google Scholar] [CrossRef]
  40. Wang, L.; Chen, J.; Zhang, H.; Chen, L. Difference Analysis of SRTM C-Band DEM and ASTER GDEM for Global Land Cover Mapping. In Proceedings of the 2011 International Symposium on Image and Data Fusion, Tengchong, China, 9–11 August 2011. [Google Scholar] [CrossRef]
  41. Chiyo, P.I.; Archie, E.A.; Hollister-Smith, J.A.; Lee, P.C.; Poole, J.H.; Moss, C.J.; Alberts, S.C. Association Patterns of African Elephants in All-Male Groups: The Role of Age and Genetic Relatedness. Anim. Behav. 2011, 81, 1093–1099. [Google Scholar] [CrossRef]
  42. Tabachnick, B.; Fidell, L.S. Using Multivarite Statistics. Biol. Conserv. 2012, 148, 88–95. [Google Scholar]
  43. McHugh, M.L. Lessons in Biostatistics Interrater Reliability: The Kappa Statistic. Biochem. Med. 2012, 22, 276–282. [Google Scholar] [CrossRef]
  44. Bullock, E.L.; Healey, S.P.; Yang, Z.; Oduor, P.; Gorelick, N.; Omondi, S.; Ouko, E.; Cohen, W.B. Three Decades of Land Cover Change in East Africa. Land 2021, 10, 150. [Google Scholar] [CrossRef]
  45. Kulindwa, K.; Mvena, Z.; Runyoro, V. Baseline Study for the Proposed Pilot Wildlife Management Areas (WMAs)—Tarime Pilot Wma; Ministry of Natural Resources and Tourism: Dar es Salaam, Tanzania, 2003; 40p.
  46. Noe, C. The Dynamics of Land Use Changes and Their Impacts on the Wildlife Corridor between Mt. Kilimanjaro and Amboseli National Parks 2003. Available online: https://cgspace.cgiar.org/handle/10568/1891 (accessed on 15 February 2021).
  47. Nyumba, T.O.; Emenye, O.E.; Leader-Williams, N. Assessing Impacts of Human-Elephant Conflict on Human Wellbeing: An Empirical Analysis of Communities Living with Elephants around Maasai Mara National Reserve in Kenya. PLoS ONE 2020, 15, e0239545. [Google Scholar] [CrossRef] [PubMed]
  48. Nyirenda, V.R.; Nkhata, B.A.; Tembo, O.; Siamundele, S. Elephant Crop Damage: Subsistence Farmers’ Social Vulnerability, Livelihood Sustainability and Elephant Conservation. Sustainability 2018, 10, 3572. [Google Scholar] [CrossRef] [Green Version]
  49. Shaffer, L.J.; Khadka, K.K.; Van Den Hoek, J.; Naithani, K.J. Human-Elephant Conflict: A Review of Current Management Strategies and Future Directions. Front. Ecol. Evol. 2019, 6, 235. [Google Scholar] [CrossRef] [Green Version]
  50. Nduwamungu, J. Recent Land Cover and Use Changes in Miombo Woodlands of Eastern Tanzania. Tanzania J. For. Nat. Conserv. 2008, 78, 54–64. [Google Scholar]
  51. United Nations. World Population Prospects 2019; United Nations: New York, NY, USA, 2019; ISBN 9789211483161. [Google Scholar]
  52. URT 2019 Tanzania in Figures. National Bureau of Statistics United Republic Tanzania 2019, 125. Available online: https://www.nbs.go.tz/nbs/takwimu/references/Tanzania_in_Figures_2019.pdf (accessed on 15 February 2021).
  53. Mmbaga, N. Human Population Growth as Indicator for Human-Elephant Conflicts in Rombo Area, Tanzania. J. Biodivers. Environ. Sci. 2018, 10, 94–102. [Google Scholar]
  54. Abukari, H.; Mwalyosi, R.B. Comparing Pressures on National Parks in Ghana and Tanzania: The Case of Mole and Tarangire National Parks. Glob. Ecol. Conserv. 2018, 15, e00405. [Google Scholar] [CrossRef]
  55. Naha, D.; Dash, S.K.; Chettri, A.; Roy, A.; Sathyakumar, S. Elephants in the Neighborhood: Patterns of Crop-Raiding by Asian Elephants within a Fragmented Landscape of Eastern India. PeerJ 2020, 8, e9399. [Google Scholar] [CrossRef] [PubMed]
  56. Bohrer, G.; Beck, P.S.A.; Ngene, S.M.; Skidmore, A.K.; Douglas-Hamilton, I. Elephant Movement Closely Tracks Precipitation-Driven Vegetation Dynamics in a Kenyan Forest-Savanna Landscape. Mov. Ecol. 2014, 2, 2. [Google Scholar] [CrossRef] [PubMed] [Green Version]
  57. Duffy, J.P.; Pettorelli, N. Exploring the Relationship between NDVI and African Elephant Population Density in Protected Areas. Afr. J. Ecol. 2012, 50, 455–463. [Google Scholar] [CrossRef]
  58. Caprivi, E.; Connell-rodwell, C.E.O.; Rodwell, T.; Rice, M.; Hart, L. A Living with the Modern Conservation Paradigm: Can Agricultural Communities Co-Exist with Elephants? A ® ve-Year Case Study. Natl. Park. 2000, 93, 381–391. [Google Scholar]
  59. Matt Walpole, 2014. An Assessment of Human-Elephant Conflict in the Western Serengeti. 2020. Available online: https://www.tnrf.org/en/node/9071?lang=en (accessed on 1 January 2020).
  60. Naha, D.; Sathyakumar, S.; Dash, S.; Chettri, A.; Rawat, G.S. Assessment and Prediction of Spatial Patterns of Human-Elephant Conflicts in Changing Land Cover Scenarios of a Human-Dominated Landscape in North Bengal. PLoS ONE 2019, 14, e0210580. [Google Scholar] [CrossRef] [Green Version]
  61. Dublin, H.; President, C. African Elephant Specialist Group Report. Pachyderm 2006, 4, 1–12. [Google Scholar]
  62. Tsalyuk, M.; Kilian, W.; Reineking, B.; Getz, W.M. Temporal Variation in Resource Selection of African Elephants Follows Long-Term Variability in Resource Availability. Ecol. Monogr. 2019, 89, e01348. [Google Scholar] [CrossRef] [Green Version]
  63. Harris, G.M.; Russell, G.J.; Van Aarde, R.I.; Pimm, S.L. Rules of Habitat Use by Elephants Loxodonta Africana in Southern Africa: Insights for Regional Management. Oryx 2008, 42, 66–75. [Google Scholar] [CrossRef] [Green Version]
  64. Mann, D.; Agrawal, G.; Joshi, P.K. Spatio-Temporal Forest Cover Dynamics along Road Networks in the Central Himalaya. Ecol. Eng. 2019, 127, 383–393. [Google Scholar] [CrossRef]
  65. Pozo, R.A.; Coulson, T.; McCulloch, G.; Stronza, A.L.; Songhurst, A.C. Determining Baselines for Human-Elephant Conflict: A Matter of Time. PLoS ONE 2017, 12, e.0178840. [Google Scholar] [CrossRef] [Green Version]
  66. Chen, Y.; Marino, J.; Chen, Y.; Tao, Q.; Sullivan, C.D.; Shi, K.; Macdonald, D.W. Predicting Hotspots of Human-Elephant Conflict to Inform Mitigation Strategies in Xishuangbanna, Southwest China. PLoS ONE 2016, 11, e0162035. [Google Scholar] [CrossRef] [PubMed]
  67. Ly, C.T.; Hung, V.; Anh, N.C.T.; Bao, H.D.; Quoc, P.D.P.; Khanh, H.T.; Van Minh, N.; Cam, N.T.H.; Cuong, C.D. A Pilot Study of Cultivating Non-Preferred Crops to Mitigate Human-Elephant Conflict in the Buffer Zone of Yok Don National Park, Vietnam. Gajah 2020, 51, 4–9. [Google Scholar]
  68. Chibeya, D.; Wood, H.; Cousins, S.; Carter, K.; Nyirenda, M.A.; Maseka, H. How Do African Elephants Utilize the Landscape during Wet Season? A Habitat Connectivity Analysis for Sioma Ngwezi Landscape in Zambia. Ecol. Evol. 2021, 11, 14916–14931. [Google Scholar] [CrossRef]
  69. Kitratporn, N.; Takeuchi, W. Spatiotemporal Distribution of Human-Elephant Conflict in Eastern Thailand: A Model-Based Assessment Using News Reports and Remotely Sensed Data. Remote Sens. 2020, 12, 90. [Google Scholar] [CrossRef] [Green Version]
  70. Stokke, S.; Du Toit, J.T. Sexual Segregation in Habitat Use by Elephants in Chobe National Park, Botswana. Afr. J. Ecol. 2002, 40, 360–371. [Google Scholar] [CrossRef]
  71. Hemson, G.; Johnson, P.; South, A.; Kenward, R.; Ripley, R.; Mcdonald, D. Are Kernels the Mustard? Data from Global Positioning System (GPS) Collars Suggests Problems for Kernel Home-Range Analyses with Least-Squares Cross-Validation. J. Anim. Ecol. 2005, 74, 455–463. [Google Scholar] [CrossRef]
  72. Chiyo, P.I.; Lee, P.C.; Moss, C.J.; Archie, E.A.; Hollister-Smith, J.A.; Alberts, S.C. No Risk, No Gain: Effects of Crop Raiding and Genetic Diversity on Body Size in Male Elephants. Behav. Ecol. 2011, 22, 552–558. [Google Scholar] [CrossRef] [Green Version]
  73. Danquah, E. Spatial Distribution of Elephants versus Human and Ecological Variables in Western Ghana. Adv. Ecol. 2016, 2016, 8038524. [Google Scholar] [CrossRef] [Green Version]
  74. Mmbaga, N.E.; Munishi, L.K.; Treydte, A.C. Balancing African Elephant Conservation with Human Well-Being in Rombo Area, Tanzania. 2017. Available online: https://www.hindawi.com/journals/ae/2017/4184261/ (accessed on 20 July 2020).
  75. Ntumi, C.P. A Landscape Approach to Elephant Conservation in Mozambique. Ph.D. Thesis, University of Pretoria, Pretoria, South Africa, 2012; p. 237. Available online: https://repository.up.ac.za/handle/2263/24988 (accessed on 12 May 2019).
  76. Thompson, K.E.; Ford, A.; Esteban, G.; Poupard, A.; Zoon, K.; Pettorelli, N. Impacts of African Savannah Elephants (Loxodonta Africana) on Tall Trees and Their Recovery within a Small, Fenced Reserve in South Africa. Afr. J. Ecol. 2022, 1–10. [Google Scholar] [CrossRef]
  77. Songhurst, A.; McCulloch, G.; Coulson, T. Finding Pathways to Human-Elephant Coexistence: A Risky Business. Oryx 2016, 50, 713–720. [Google Scholar] [CrossRef] [Green Version]
Figure 1. Map of the study area showing the location of households surveyed (n = 96) across different villages from March 2019 to June 2019 as well as the Kilimanjaro and Amboseli National Parks, Enduimet Wildlife Management Area (EWMA) and farmlands within the EWMA, Tanzania, based on the map of 2019.
Diversity 14 00513 g001
Figure 2. Percentage of human-elephant conflict (HEC) occurrence (n = 923) within varying distances from 0 Enduimet Wildlife Management Area (EWMA) boundary (in km), as reported between 2016–2020.
Diversity 14 00513 g002
Figure 3. Heat map of areas with a high risk of being a crop foraging hotspot for elephants in the Enduimet Wildlife Management Area and close farmlands adjacent to the southern part of EWMA, Tanzania (n = 923), generated from HEC data collected by OIKOS East Africa and interviews (n = 96) between the years 2016 to 2020.
Diversity 14 00513 g003
Figure 4. Home ranges for three collared male elephants (n = 52,488) in the EWMA and close farmlands adjacent to the southern part of EWMA from July 2019 to September 2020 calculated using Kernel Density Estimation (KDE).
Diversity 14 00513 g004
Figure 5. Average (±SE) speed of three male elephants collared in Amboseli National Park, Kenya, who also ranged in the Enduimet Wildlife Management Area (EWMA) in farmlands and settlements from 2016 to 2020. Bar plots with an asterisk are significantly different at p < 0.01 based on a Games-Howell Post-hoc Test.
Diversity 14 00513 g005
Table 1. Major environmental variables that were used in our model to test whether they influenced human-elephant conflict occurrences were collected in the Enduimet Wildlife Management Area, Tanzania, from 2016 to 2020. NDVI = Normalized Difference Vegetation Index, season = time of the year that is distinguished by special climate condition (wet and dry), HEC = human-elephant conflict.
VariableUnitCategoryRange (Min–Max)
Dependent variable
HEC occurrence categorical0 and 1
Independent variables
Distance from riverkmcontinuous0–24
Distance from main roadkmcontinuous0–13
Distance from protected areakmcontinuous0–46
Distance from farmlandkmcontinuous0–18
Distance from settlementkmcontinuous0–60
Elevationm. a. s. l.continuous1125–5120
Year numerical2016–2020
NDVIvaluesnumerical0–1
Season categoricalwet and dry
Time of day categoricalnight and day
Table 2. Land Use/ Land Cover (LULC) classes (in ha and % coverage) between 1989 and 2019 in the Enduimet Wildlife Management Area, Tanzania (EWMA). Cover classes were categorized according to ([32,33]. See also Table 1.
LULC ClassesLULC Coverage
1989 1999 2009 2019
ha% ha% ha% ha%
Agriculture 25,99913.47 28,69814.86 35,01718.14 50,68526.25
Bare ground32911.70 28271.46 24081.25 7100.37
Bushland24,93512.91 34,25117.74 24,02012.44 26,31213.63
Forest 29491.53 9910.51 10420.54 860.04
Grassland120,74662.54 101,84552.75 102,05952.86 84,34843.69
Settlement10,3505.36 18,0029.32 21,06010.91 24,59912.74
Woodland40262.09 55072.85 52932.74 56362.92
Water bodies00.01 80.01 40.01 30.01
Wetland7770.40 9440.49 21701.12 6940.36
Table 3. Binary multiple logistic regression analysis results of variables influencing human-elephant conflict occurrences (n = 923), collected by Oikos East Africa, household interviews (n = 96), collared elephant home ranges (n = 3) and grey literature reports in the Enduimet Wildlife Management Area, Tanzania, from 2016 to 2020. PA = protected area, NDVI = Normalized Difference Vegetation Index.
VariableEstimateSEZp
(Intercept)25.011.333.610.001
Elevation (m) −0.01−0.03−4.260.001
Distance from farmland (km)−1.130.00−2.840.004
NDVI16.411.052.120.027
Distance from PA (km)−0.810.31−3.090.007
Distance from river (km)−0.280.32−1.100.331
Distance from settlement (km)−0.460.292.060.037
Distance from road (km)−0.020.25−1.530.321
Distance from river * from road0.010.010.920.359
Distance from farmland * from PA0.010.012.310.021
Note: * interaction between two variables.
Publisher’s Note: MDPI stays neutral with regard to jurisdictional claims in published maps and institutional affiliations.

