Article

Effects of the Climatic Region on Richness Correlations between Vascular Plants and Vertebrates in Nature Reserves of China

1
ECNU-Alberta Joint Lab for Biodiversity Study, Zhejiang Tiantong Forest Ecosystem National Observation and Research Station, School of Ecological and Environmental Sciences, East China Normal University, Shanghai 200241, China
2
Department of Biological Sciences, National University of Singapore, 14 Science Drive 4, Singapore 117543, Singapore
*
Author to whom correspondence should be addressed.
Diversity 2022, 14(6), 499; https://doi.org/10.3390/d14060499
Submission received: 1 June 2022 / Revised: 15 June 2022 / Accepted: 17 June 2022 / Published: 20 June 2022

Abstract

:
Identifying indicator taxa is a solution to the problem of a lack of diverse data. However, the variation between studies on richness correlations (RCs) among taxa from different climate regions makes the application value of indicator taxa questionable. Few studies have compared the RCs among climatic regions in a single study, leaving the variation in RCs and the underlying ecological drivers among climatic regions unknown. In this study, data were compiled on vascular plants, vertebrates (including mammals, birds, reptiles, and amphibians), and environmental factors across 219 nature reserves located in subtropical and temperate regions of China to examine RCs among taxonomic groups and underlying ecological mechanisms. Results showed that the climatic region could affect between-taxon correlations in species richness and that the effectiveness of vascular plants as suitable indicator taxa for vertebrates varied with the climatic region and target taxa. Energy (temperature and evapotranspiration) and habitat heterogeneity (area and elevation range) were ecological drivers of RCs among taxonomic groups in the subtropical and temperate regions. The differences in the effect of abiotic factors on RCs among taxonomic groups caused the difference in RCs between subtropical and temperate regions. Our findings provide new evidence for understanding the variation of RCs and the underlying mechanisms and highlight the positive role of climatic variables and habitat heterogeneity in determining RCs between vascular plants and vertebrates.

1. Introduction

In the current crisis of biodiversity loss, protecting biodiversity [1,2] is essential. However, the distribution data of vulnerable taxa are still insufficient to set policies on that protection. Effectively correlating taxonomic groups in species-rich areas for predicting the diversity of unknown taxa of conservation interest contributes to a solution to the problem of the insufficient data [3,4,5,6,7,8].
When a well-known taxon has a strong correlation with other taxonomic groups, that taxon could be recommended as an indicator taxon whose diversity is a proxy to predict the diversity of other taxa [8]. Numerous studies have verified the validity of indicator taxa by analysing the richness correlations (RCs) among taxonomic groups. Still, they have not found consistent conclusions to find the desired perfect indicator taxon [2,9,10,11,12,13]. Some studies have recommended a few taxonomic groups as good indicator groups, such as vascular plants [14,15]. Other studies have doubted the potential application value of indicator taxa because of the variation of RCs among taxonomic groups [16,17]. That variation might have been caused by differences in research conditions such as research scale, habitat type, and climatic regions [18,19]. Although some empirical studies have confirmed the effect of scale and habitat type on RCs among taxonomic groups [20,21,22,23,24], only a few studies have compared RCs between tropical and temperate regions. Further, they did not focus on the drivers [18,19]. Thus, exploring RCs across different climatic regions will help conservation ecologists objectively assess the potential application value of indicator taxa in biological conservation.
Almost all taxonomic groups’ species richness and climatic conditions are markedly different between subtropical and temperate regions [25,26,27]. Subtropical regions usually have better hydrothermal conditions and more opportunities for biological interactions than temperate regions [26]. Common environmental factors driving the spatial patterns of taxon richness and biological interactions could promote correlations between taxonomic groups and species richness [28,29,30,31].
Therefore, there could be significant differences between tropical/subtropical regions and temperate regions in their strength of positive RCs among taxonomic groups. Two meta-analyses have reported the differences in the RCs among taxonomic groups between tropical and temperate regions. However, they had no consistent conclusions about which regions had higher RCs among taxonomic groups. For example, a meta-analysis of more than 100 articles by Wolters et al. [18] found that significant positive RCs among taxonomic groups in tropical regions were notably higher than those in temperate regions. Westgate et al. [19] found via a meta-analysis of 74 articles that RCs among taxonomic groups increased with the increase in latitude. It is still unclear whether there is a difference in RCs between taxonomic groups in subtropical and temperate regions of China, and if there is a difference, which ecological driver causes it.
Richness correlations between taxa have been hypothesized to be promoted mainly by shared environmental factors that drive the richness patterns of taxonomic groups [30]. Those patterns could be determined by energy, habitat heterogeneity, geographic factors, soil properties (e.g., soil pH, water content, nutrients), productivity, and climatic stability [32,33,34,35,36,37,38]. However, only energy (temperature, precipitation, and evapotranspiration), geographic factors (latitude), and habitat heterogeneity (area and elevation range) have been examined in previous studies as the ecological mechanisms promoting RCs [29,39]. Whether other environmental factors promoted RCs and which ecological driver promoted RCs among taxonomic groups in different climatic regions remain unknown.
Our study collected species data of vascular plants and vertebrates and environmental data across 219 nature reserves in China to explore the following two questions: (1) Is there a significant difference in RCs between vascular plants and vertebrates between subtropical and temperate regions? (2) How do ecological mechanisms drive RC differences between vascular plants and vertebrates between subtropical and temperate regions?

2. Materials and Methods
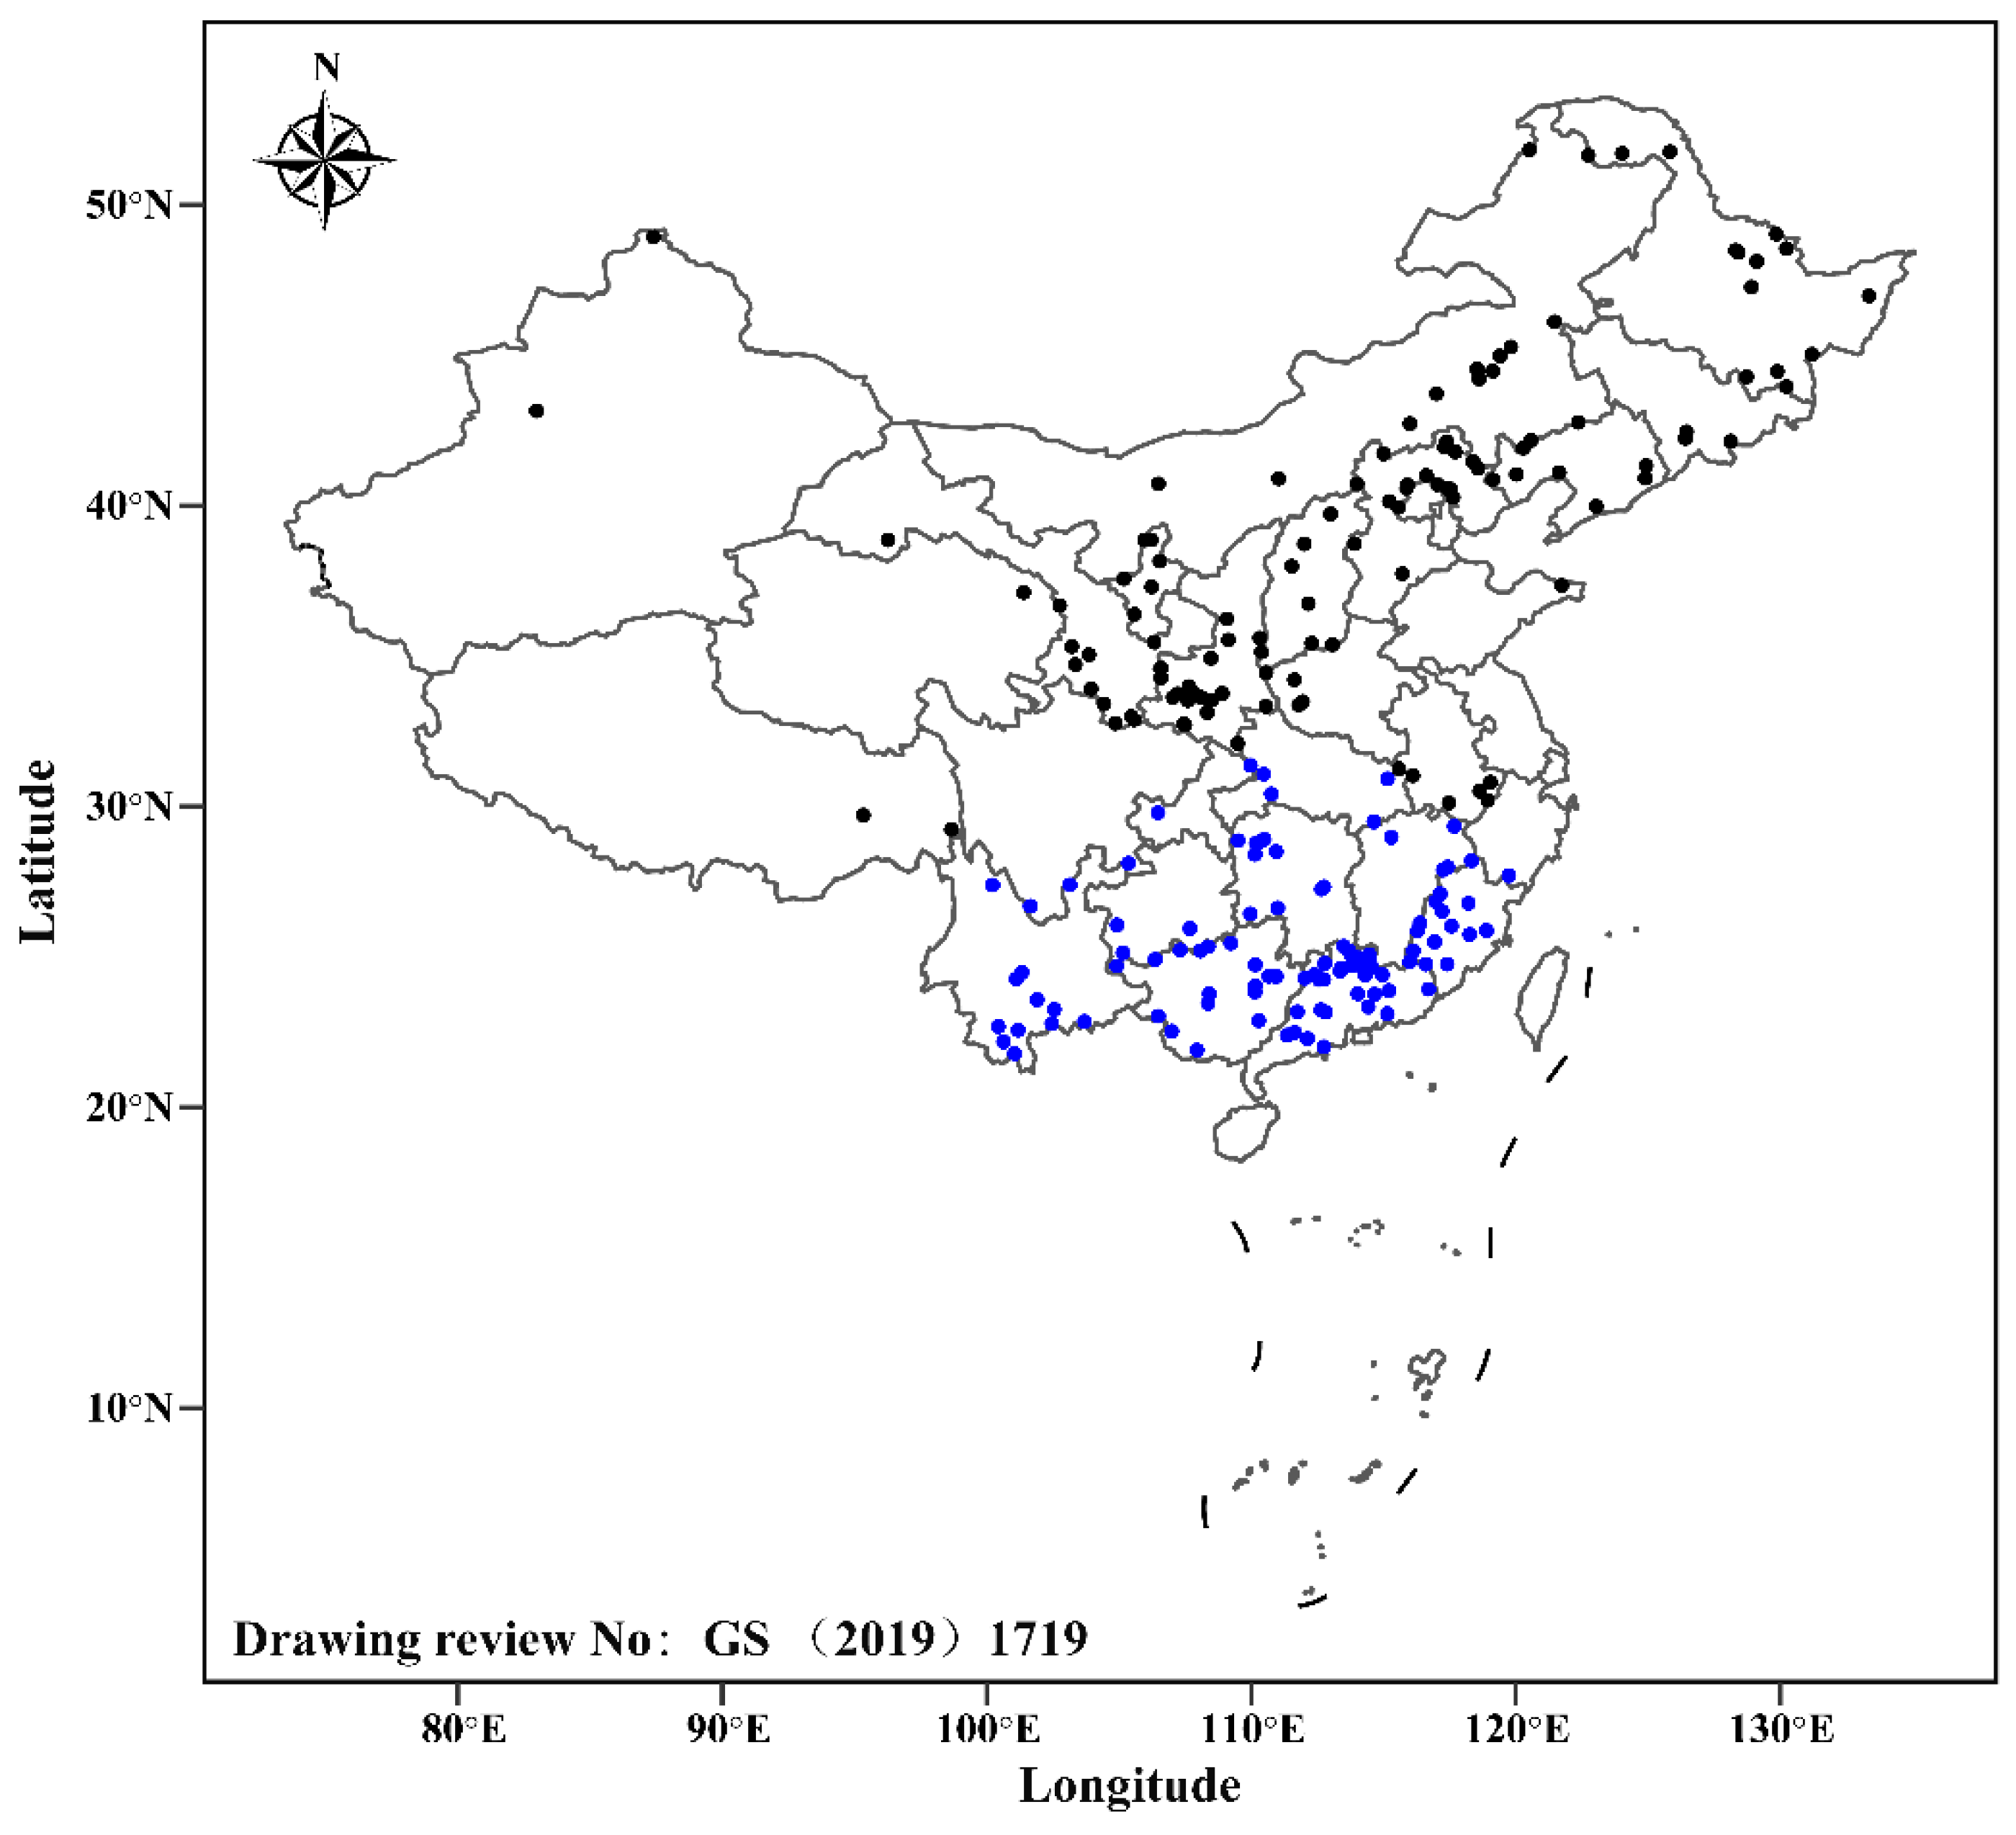
2.1. Study Area

Data were collected from 219 nature reserves in China (Figure 1, Supplementary Material Tables S1 and S2); their latitude and longitude ranged from 82.97° E to 133.36° E and 21.78° N to 51.83° N, respectively. The climatic region of each nature reserve was divided according to accumulated temperature (the daily mean temperature was ≥10 °C) [40,41]. Accumulated temperature data were collected from the China Meteorological Background Dataset of the Data Center for Resources and Environmental Sciences (https://www.resdc.cn/data.aspx?DATAID=253, accessed on 20 March 2021). Among them, 102 nature reserves were in subtropical regions (4500 ≤ accumulated temperature < 8000), and 117 nature reserves were in temperate regions (accumulated temperature < 4500).

2.2. Data Sources

The species richness of vascular plants and vertebrates in each nature reserve, and some environmental factors such as latitude and longitude range, area, and elevation range, were obtained mainly from the following three types of officially published books and literature:
  • Monographs on national nature reserves [42];
  • Monographs on nature reserves of various provinces [43,44,45]; and
  • Scientific research reports on the nature reserves.
Moreover, besides the data above representing geographic factors and habitat heterogeneity, 27 environmental factors representing energy, climate stability, productivity, and soil properties were also collected to explore ecological mechanisms that promote RC differences between subtropical and temperate regions. Specifically, 19 extensively studied bioclimatic factors from 1970 to 2000 were downloaded from WorldClim (https://worldclim.org, accessed on 11 July 2020). Annual potential evapotranspiration (PET) was derived from the MODIS Global Evapotranspiration Project (https://www.ntsg.umt.edu, accessed on 15 September 2020). The normalized difference vegetation index (NDVI) was derived from the Gimms NDVI 3g dataset and processed through the ‘raster’, ‘gimms’, and ‘rgdal’ packages in R (accessed on 11 September 2020). Soil property factors such as topsoil pH, topsoil organic carbon, soil cation exchange capacity, total soil nitrogen, field capacity (FC), and soil carbon density were derived from the re-gridded Harmonized World Soil Database v1.2 (http://daac.ornl.gov/cgi-bin/dsviewer.pl?ds_id=1247, accessed on 15 September 2020) and global Gridded Surfaces of Selected Soil Characteristics (https://daac.ornl.gov/cgi-bin/dsviewer.pl?ds_id=565, accessed on 15 September 2020). In this study, ArcGIS 10.5 (https://www.esri.com/, accessed on 20 December 2020) was used to extract environmental values based on the midpoint of the latitude and longitude of each nature reserve.

2.3. Spearman Rank Correlation Analysis

Spearman correlation analysis was used to quantify RCs between the species richness of vascular plants and vertebrates from 50 randomly selected nature reserves in each of the two climatic regions. This was conducted to compare the RCs between vascular plants and vertebrates in subtropical and temperate regions. The above steps were repeated 999 times to exclude the effects of a few outliers on the estimate of the population correlations. As the data did not satisfy the normal distribution, the Wilcoxon rank test was used to test whether there was a difference in RCs between subtropical and temperate regions.

2.4. Collinearity Pre-Processing and Variables Standardization

Before modelling the relationship between environmental variables and species richness of each taxonomic group in different climatic regions, we used the method of Dormann et al. [46]. Therefore, any two factors with strong collinearity were identified via Pearson correlation analysis and processed by eliminating one and retaining another to exclude the effect of collinearity on the estimation of model parameters. If a pairwise correlation exceeded 0.7, we considered it as strong collinear. Finally, 15 environmental factors from 6 ecological hypotheses were retained (Table 1) and were standardized. The reserve area was log-transformed, and then all environmental factors were standardized by (x − xmean)/xsd.

2.5. Model Selection

A generalized linear model with negative binomial distribution was used to model the relation between species richness of each taxon and the 15 environmental factors in each climatic region by the MASS package’s ‘glm.nb’ function. This was conducted to test which ecological driver promoted RCs among taxonomic groups in different climatic regions and caused the difference in RCs between climatic regions. The multimodel inference was used to select the best-fitting models and obtain the averaged model to manifest the richness pattern of each taxon in different climatic regions. The multimodel inference is a method that can effectively quantify the effects of multiple factors on evolutionary or ecological response processes [47]. That method considers the uncertainty of parameter estimation and model selection and objectively deals with variables [48]. The operation steps were as follows: Per the modified Akaike information criterion (AICc, ΔAICc < 2), a series of best-fitting models were selected by the ‘dredge’ function of the MuMIn package. The ‘model.avg’ function of the MuMIn package was then used to calculate the averaged model to predict the species richness of each taxonomic group in different climatic regions based on the AICc weights of the obtained best-fitting models. The averaged models for species richness of vascular plants and vertebrates in subtropical and temperate regions are shown in Appendix A Figure A1 and Figure A2. The standardized coefficients and 95% confidence intervals of shared environmental factors that significantly influenced the species richness of taxonomic groups were extracted from the averaged models to represent the effect of ecological hypotheses on RCs. All statistical analyses were performed in R 4.0.4 software (https://r-project.org/, accessed on 20 December 2020).

3. Results

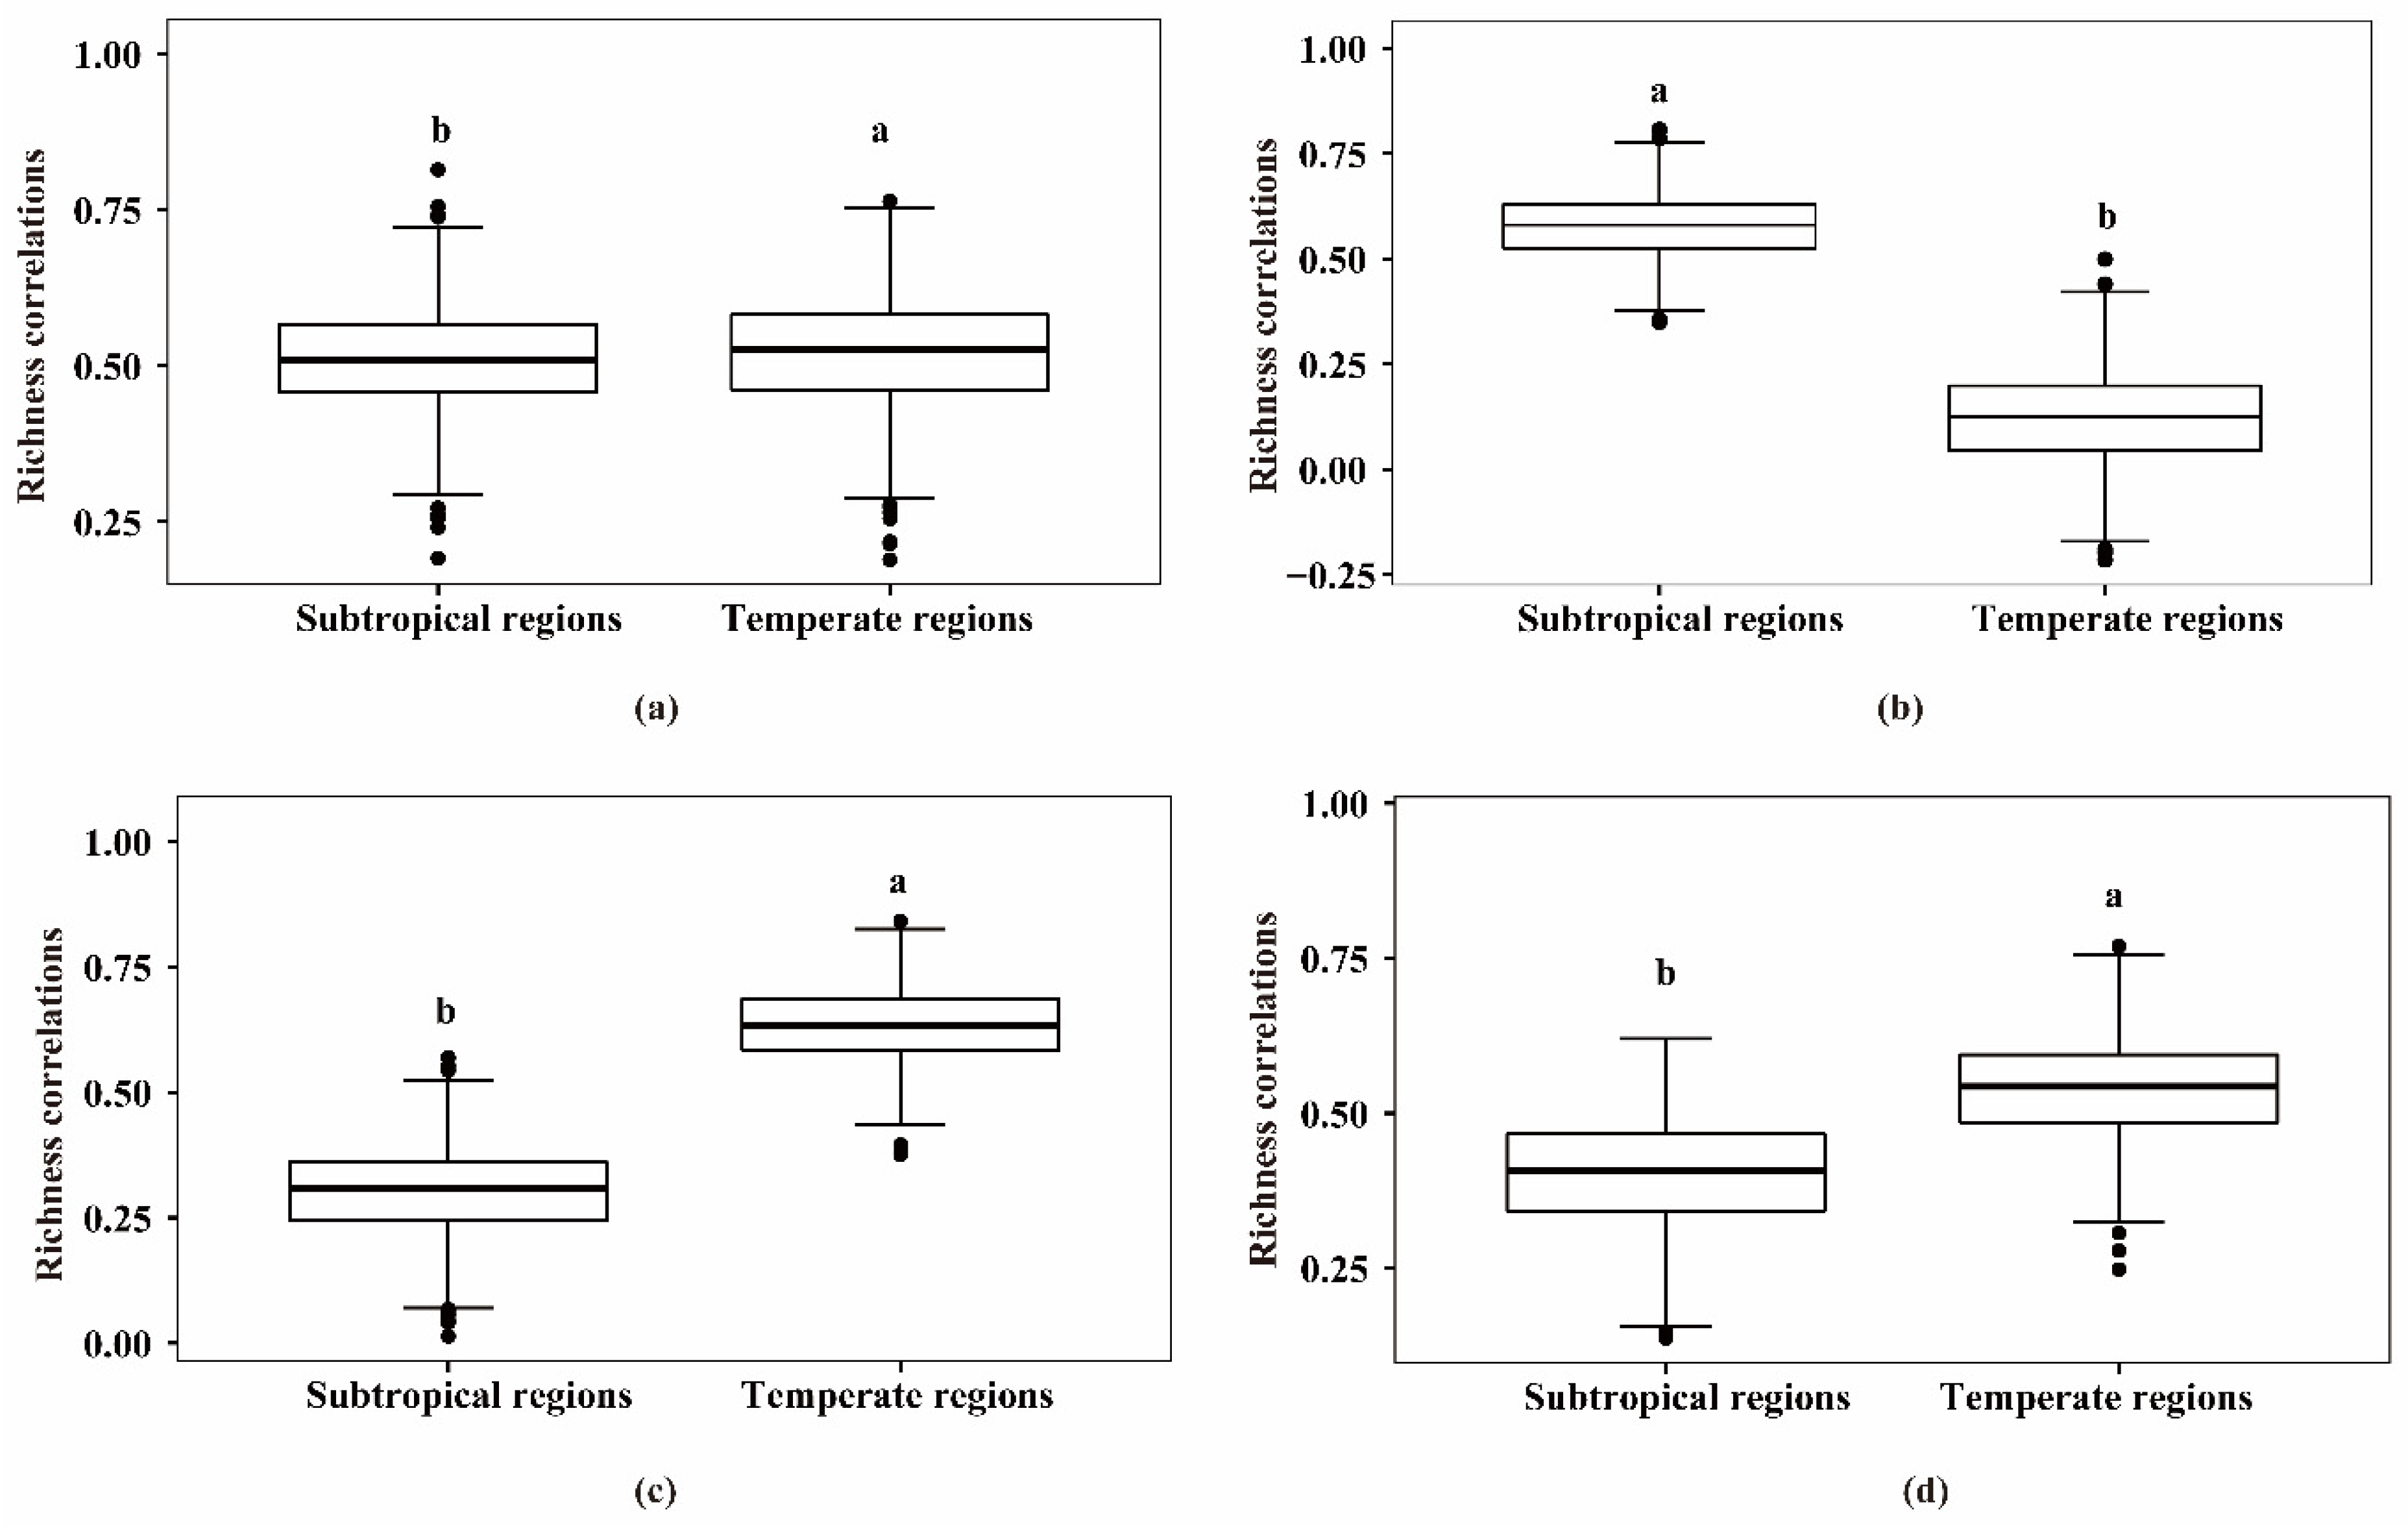
3.1. Richness Correlations between Vascular Plants and Vertebrates in Subtropical and Temperate Regions

The RCs between vascular plants and vertebrates in both subtropical and temperate regions were significant positive (ρ > 0, p > 0.05, Table 2), except for RCs between vascular plants and birds in temperate regions (p < 0.05), and RCs between vascular plants and reptiles in subtropical regions (p < 0.05). Furthermore, the RCs were significantly different between subtropical and temperate regions (p < 0.001, Figure 2). Specifically, RCs were weaker in subtropical regions than in temperate regions (p < 0.001) for vascular plants and mammals (subtropical regions: ρmedian = 0.51; temperate regions: ρmedian = 0.53), vascular plants and reptiles (subtropical regions: ρmedian = 0.31; temperate regions: ρmedian = 0.63), and vascular plants and amphibians (subtropical regions: ρmedian = 0.41; temperate regions: ρmedian = 0.54). However, RCs between vascular plants and birds were stronger (p < 0.001) in subtropical regions (ρmedian = 0.58) than in temperate regions (ρmedian = 0.13)

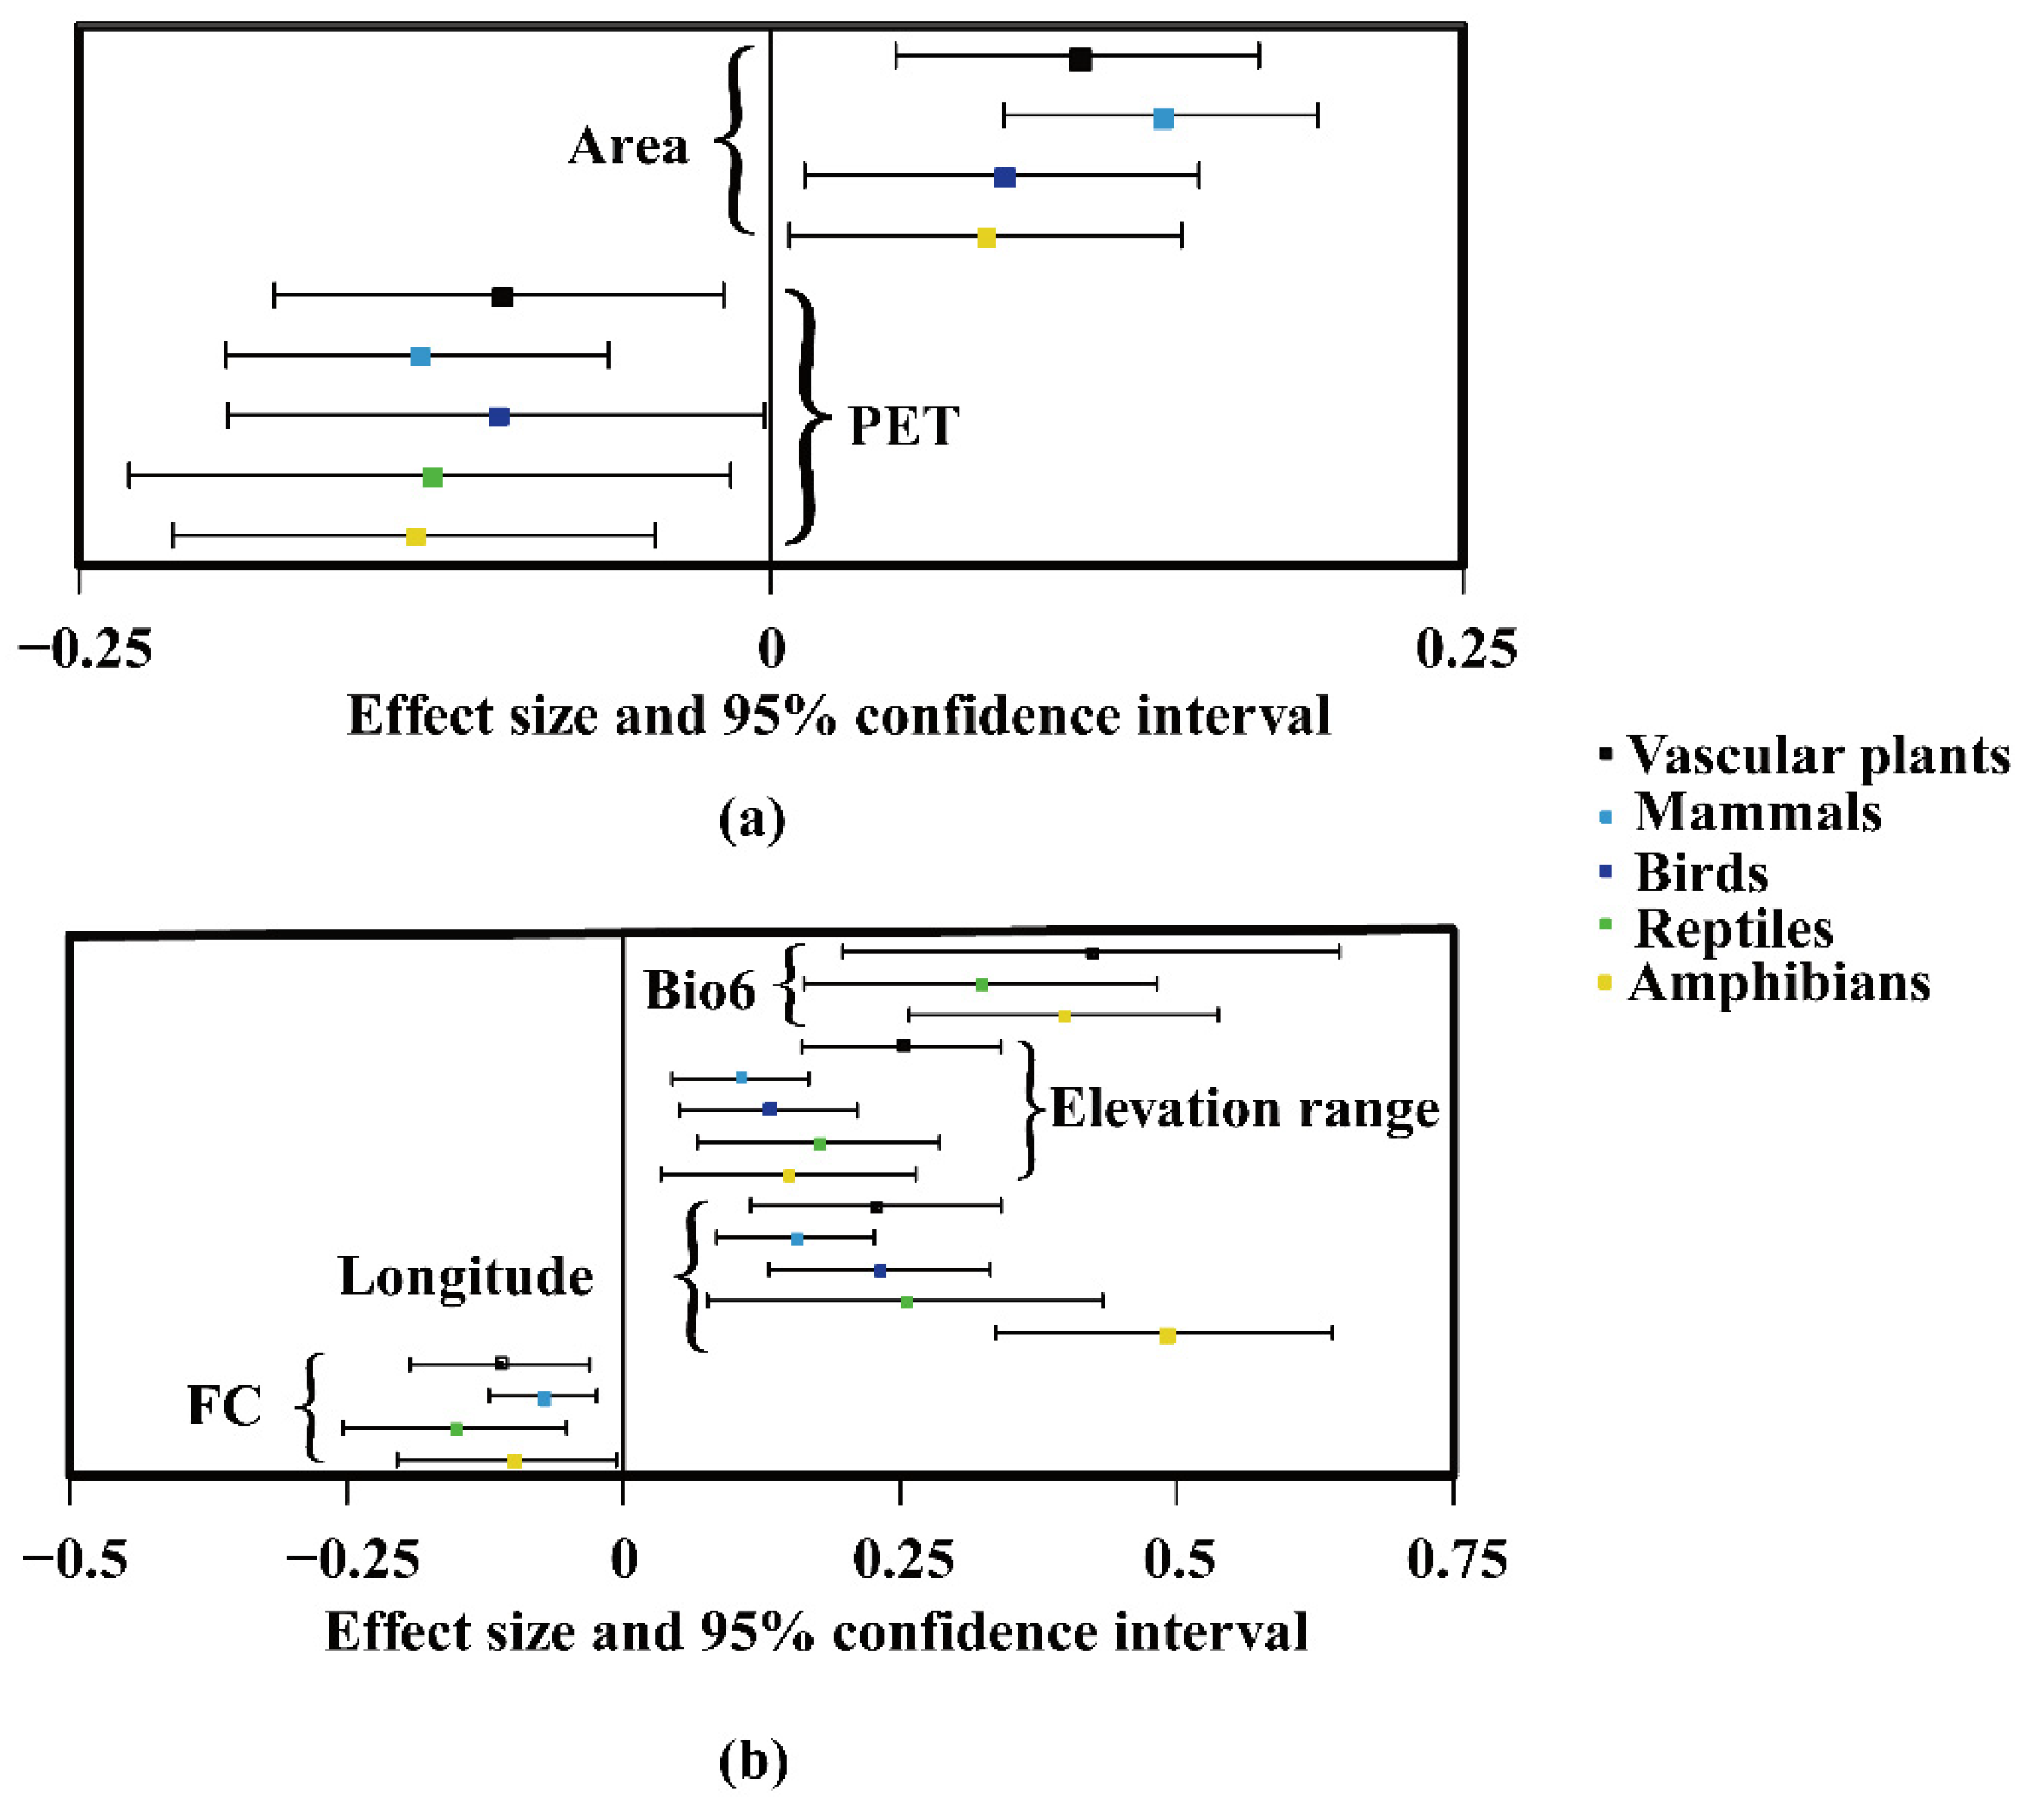
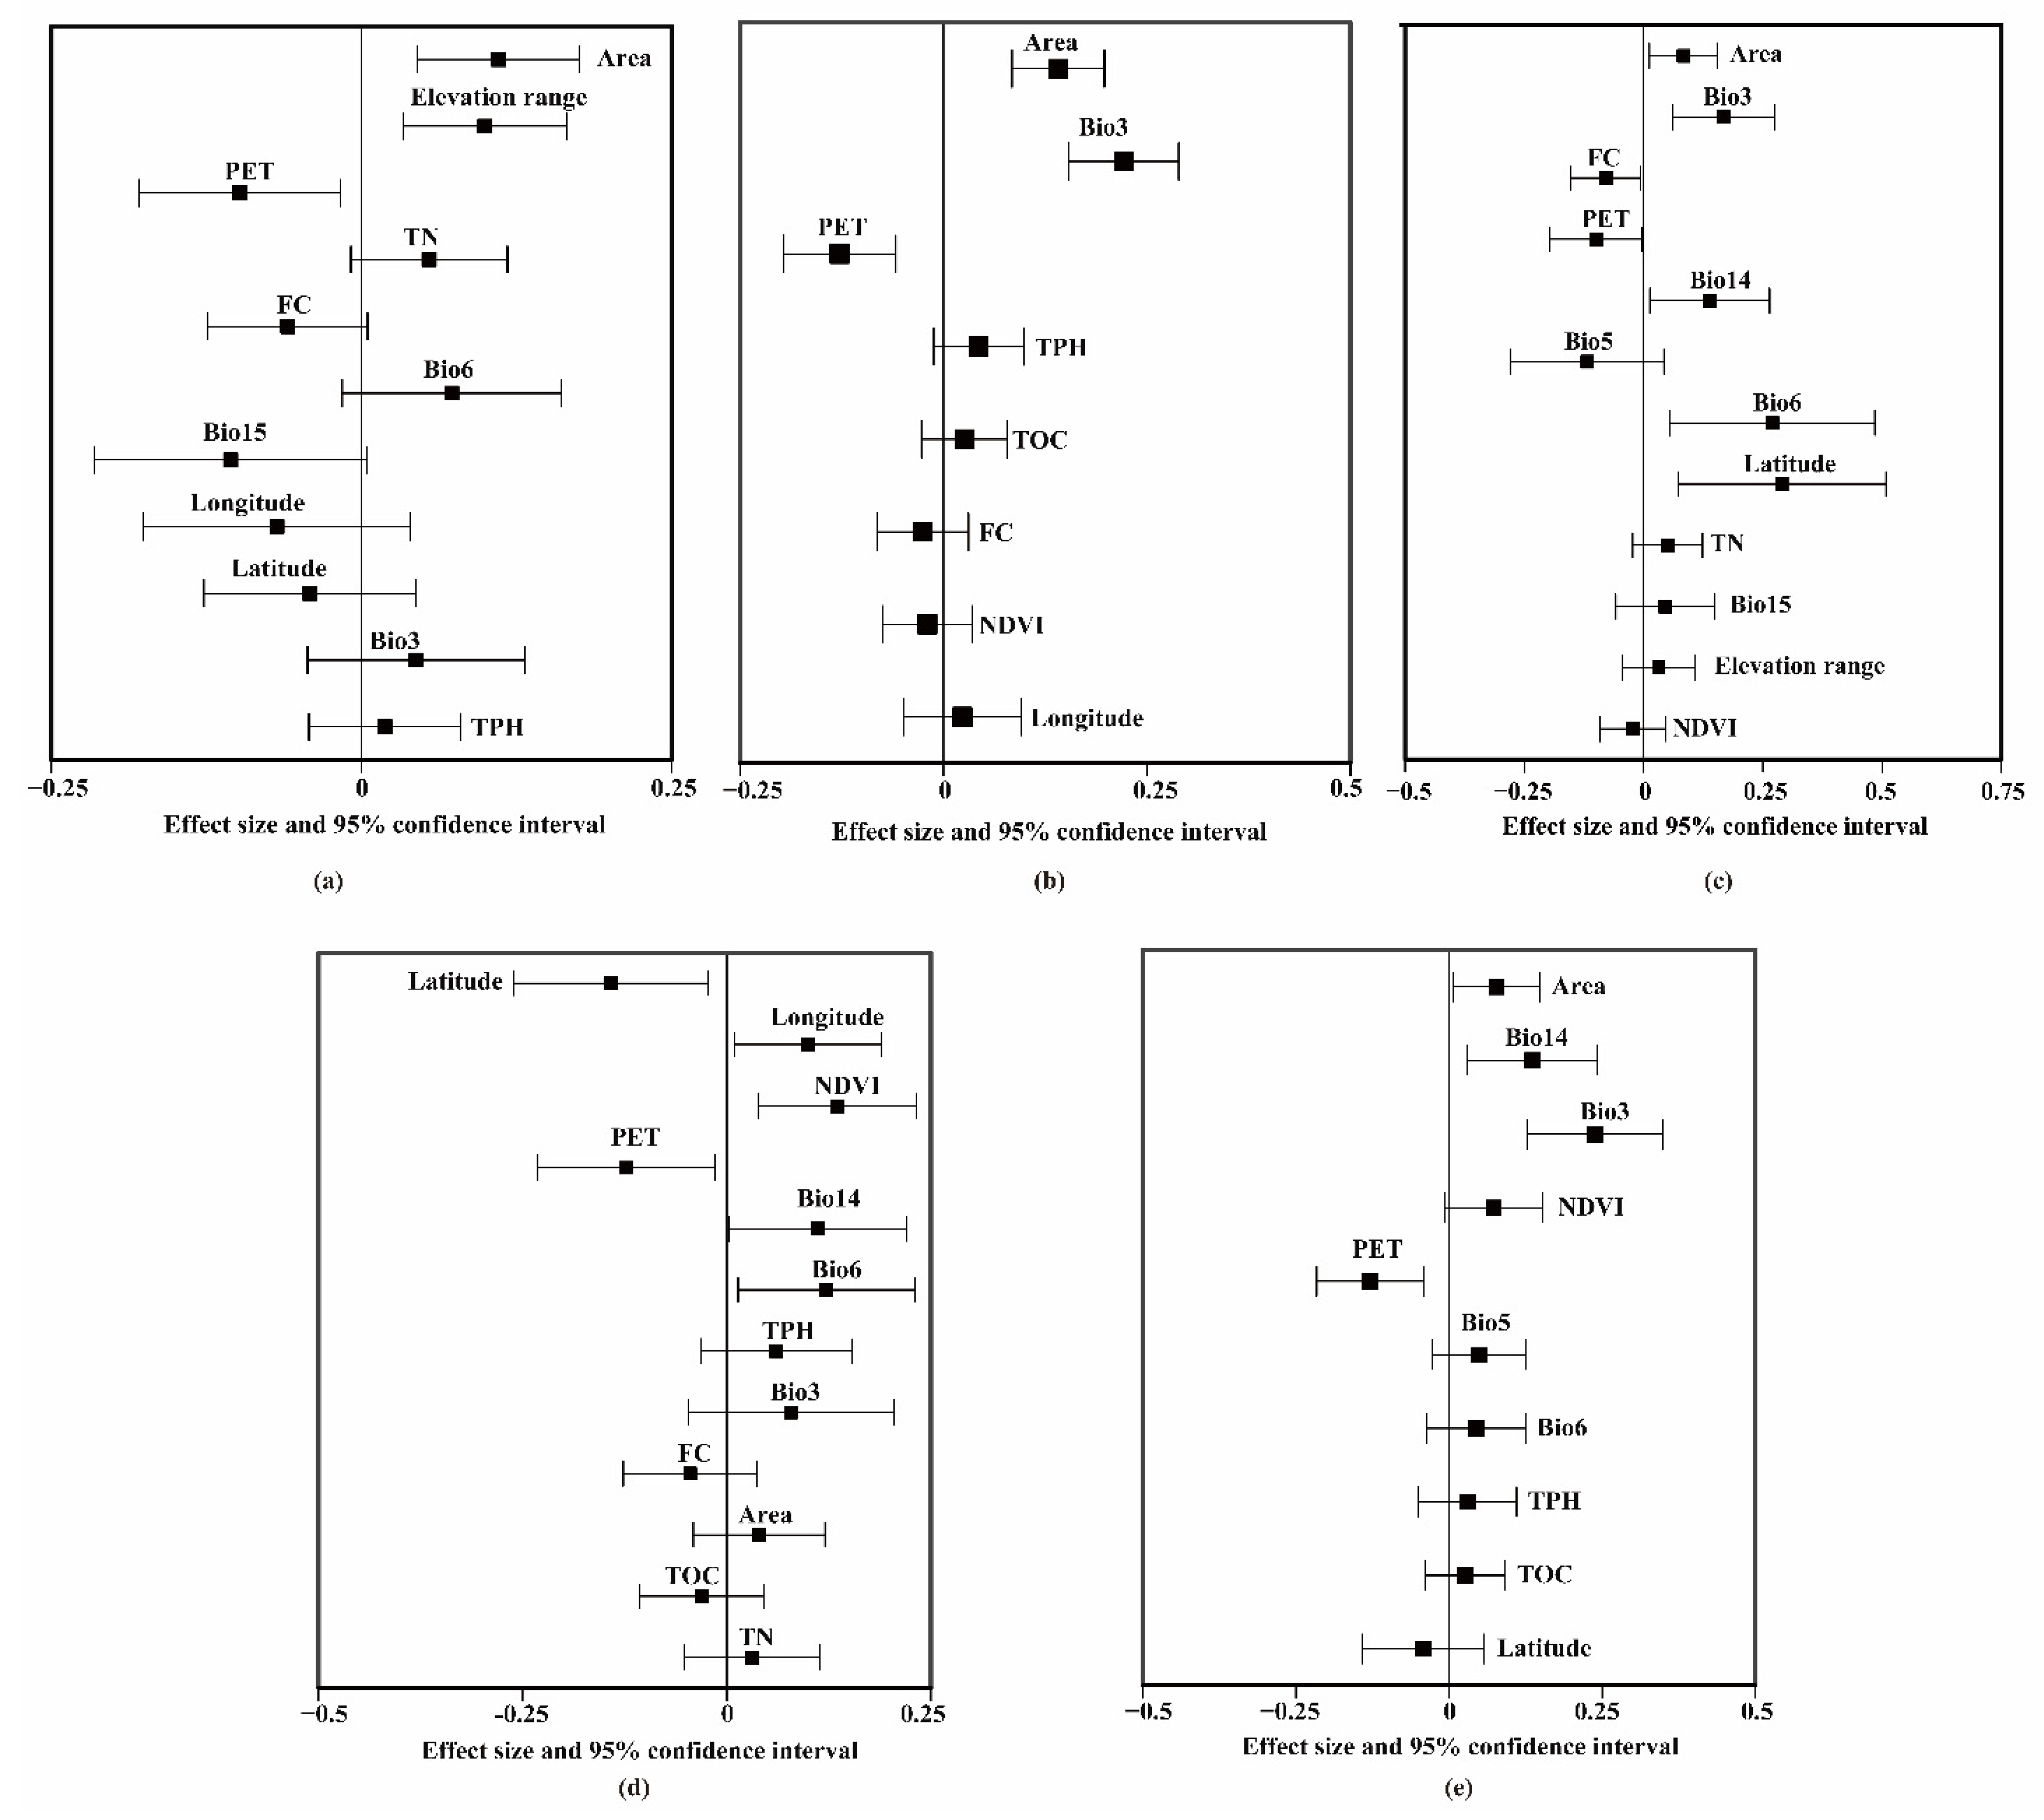
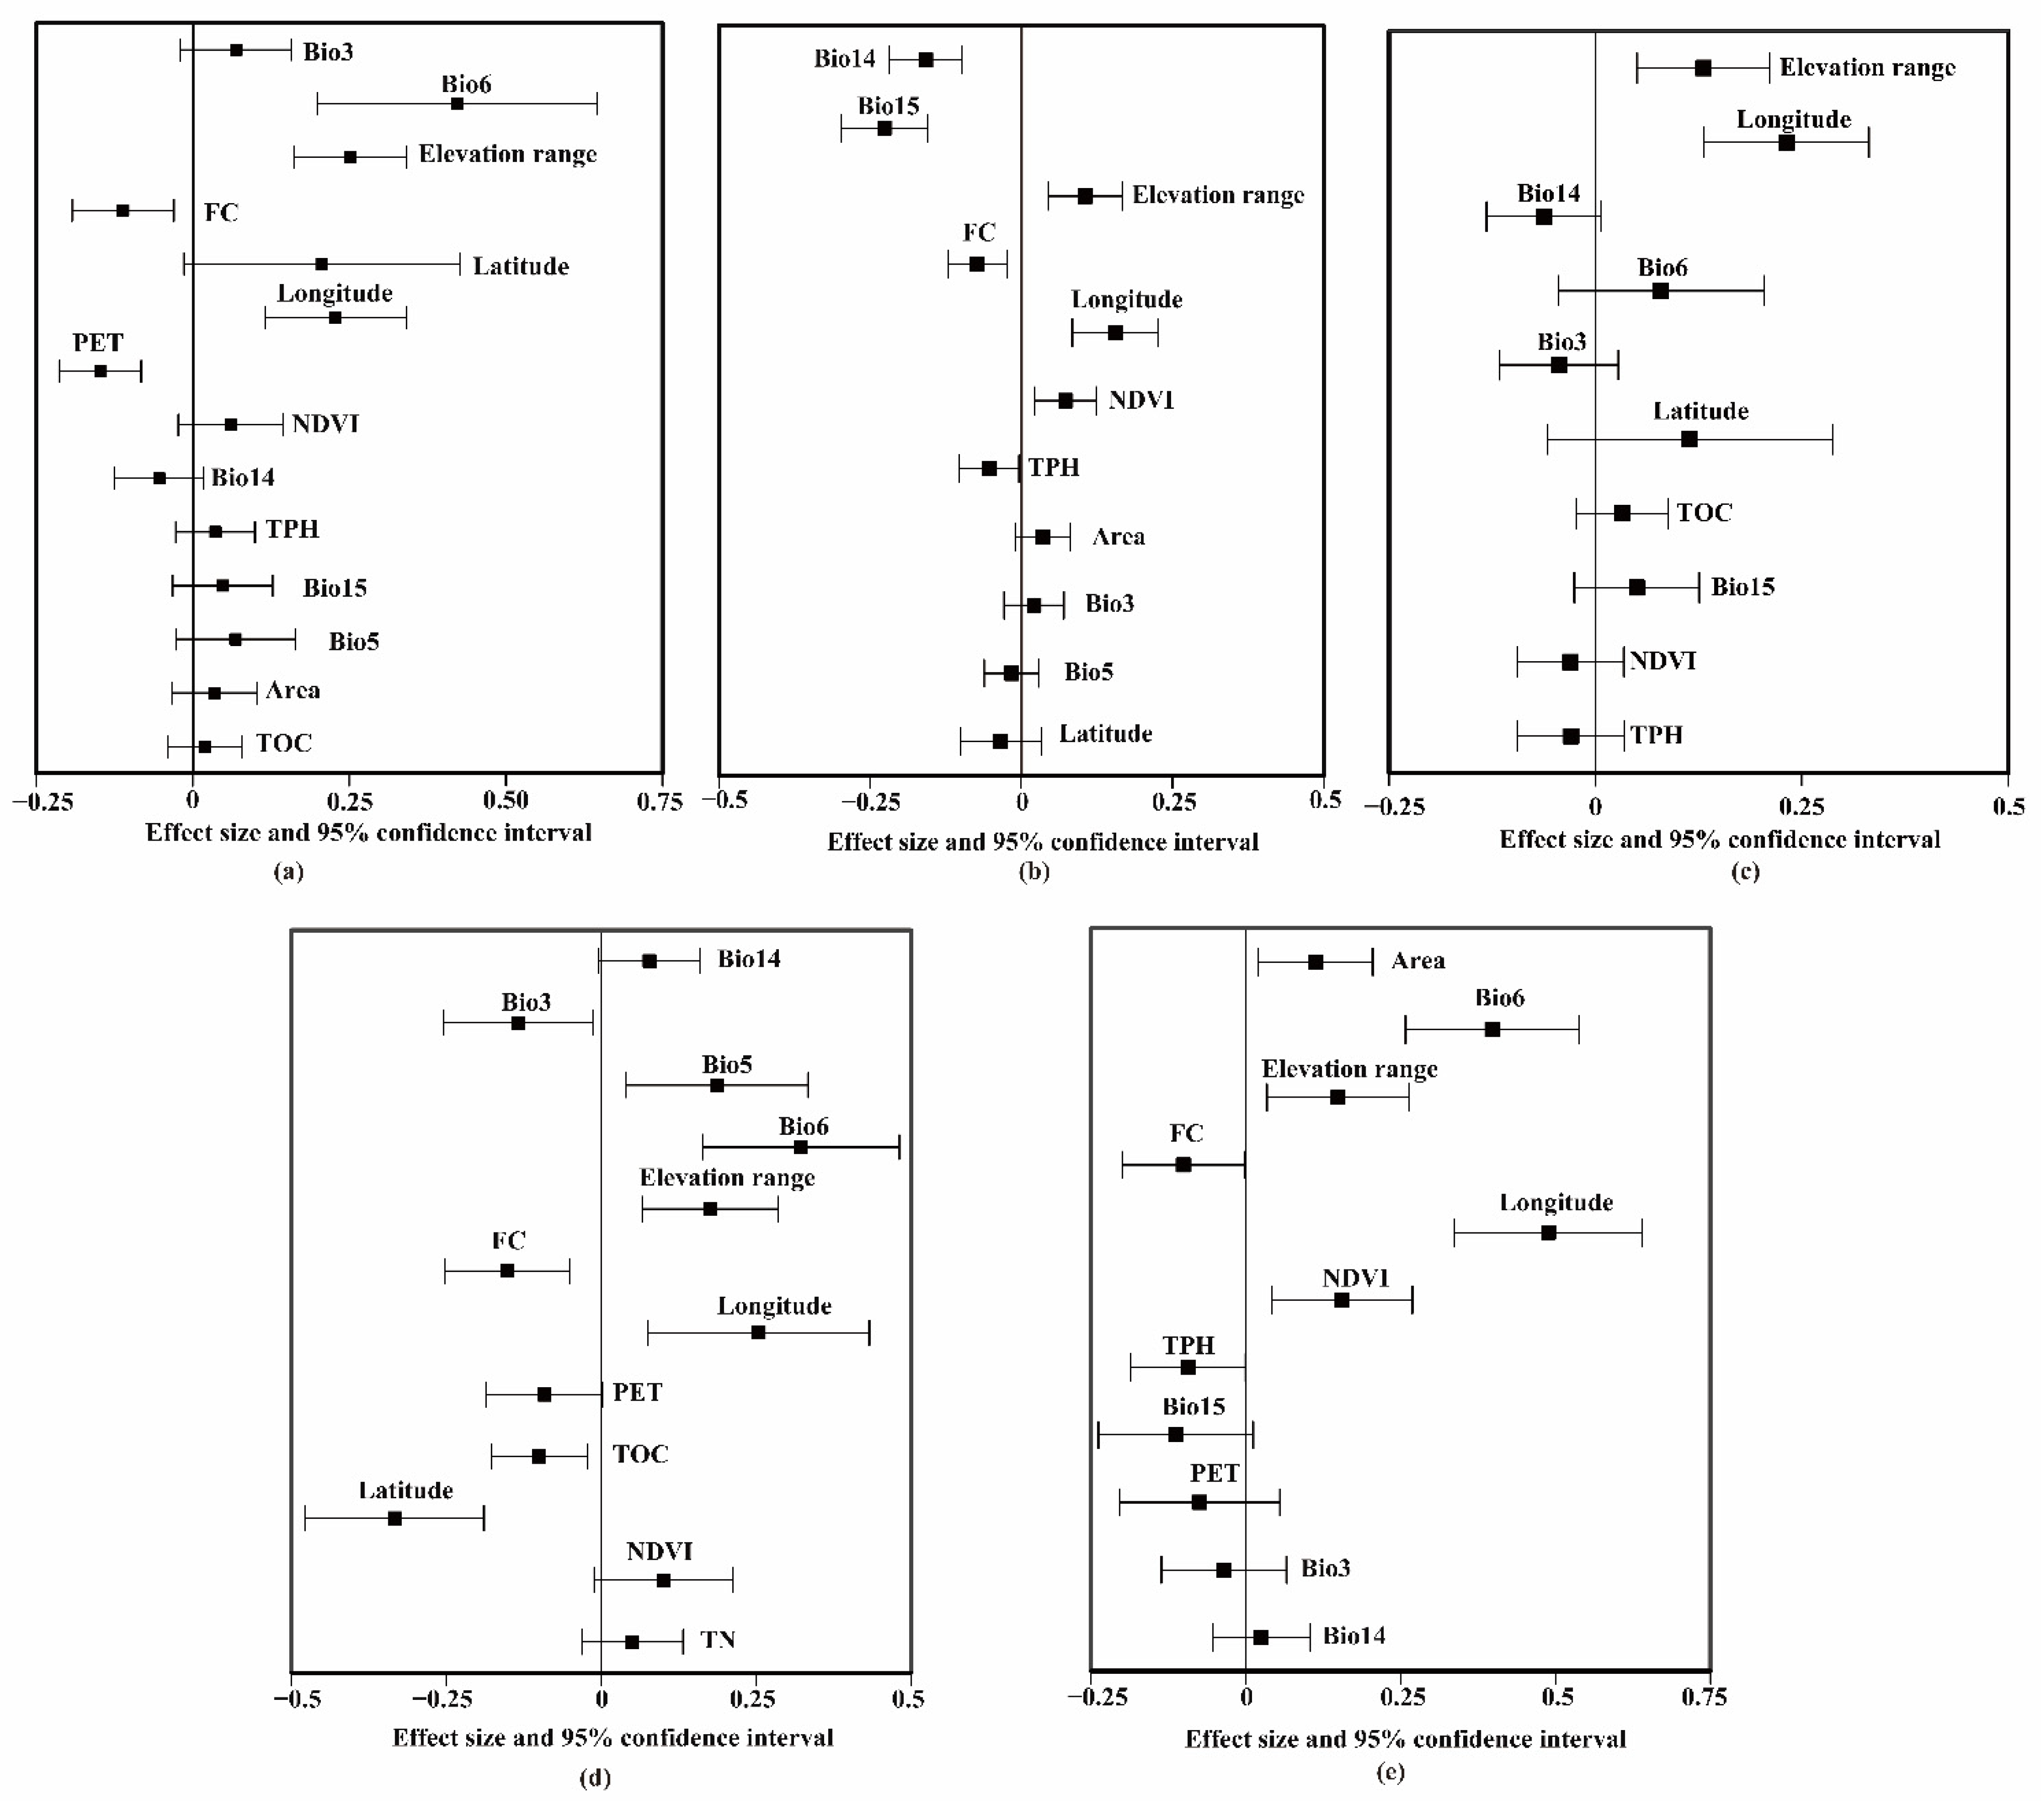
3.2. Common Environmental Factors Contributing to Richness Patterns of Vascular Plants and Vertebrates

The effects of the common environmental factors on vascular plants and mammals in subtropical and temperate regions were as follows:
  • Subtropical regions (Figure 3a): Area for vascular plants (β = 0.11, p < 0.001) and mammals (β = 0.14, p < 0.001), and PET for vascular plants (β = −0.1, p < 0.001) and mammals (β = −0.13, p < 0.001).
  • Temperate regions (Figure 3b): Elevation ranges for vascular plants (β = 0.25, p < 0.001) and mammals (β = 0.11, p < 0.001), longitude for vascular plants (β = 0.23, p < 0.001) and mammals (β = 0.16, p < 0.001), and FC for vascular plants (β = −0.11, p < 0.001) and mammals (β = −0.07, p < 0.001).
For vascular plants and birds in the subtropical and temperate regions, the effects of the common environmental factors were as follows:
  • Subtropical regions (Figure 3a): Area for vascular plants (β = 0.11, p < 0.001) and birds (β = 0.08, p < 0.001), and PET for vascular plants (β = −0.1, p < 0.001) and birds (β = −0.09, p < 0.001).
  • Temperate regions (Figure 3b): Elevation range for vascular plants (β = 0.25, p < 0.001) and birds (β = 0.23, p < 0.001), and longitude for vascular plants (β = 0.23, p < 0.001) and birds (β = 0.23, p < 0.001).
For vascular plants and reptiles in the subtropical and temperate regions, the effects of the common environmental factors were as follows:
  • Subtropical regions (Figure 3a): PET for vascular plants (β = −0.1, p < 0.001) and reptiles (β = −0.12, p < 0.001).
  • Temperate regions (Figure 3b): Bio6 for vascular plants (β = 0.42, p < 0.001) and reptiles (β = 0.32, p < 0.001), elevation range for vascular plants (β = 0.25, p < 0.001) and reptiles (β = 0.18, p <0.01), longitude for vascular plants (β = 0.23, p < 0.001) and reptiles (β = 0.25, p < 0.001), and FC for vascular plants (β = −0.11, p < 0.001) and reptiles (β = −0.15, p < 0.01).
For vascular plants and amphibians in the subtropical and temperate regions, the effects of the common environmental factors were as follows:
  • Subtropical regions (Figure 3a): Area for vascular plants (β = 0.11, p < 0.001) and amphibians (β = 0.08, p < 0.001), and PET for vascular plants (β = −0.1, p < 0.001) and amphibians (β = −0.12, p < 0.001).
  • Temperate regions (Figure 3b): Bio6 for vascular plants (β = 0.42, p < 0.001) and amphibians (β = 0.40, p < 0.05), elevation range for vascular plants (β = 0.25, p < 0.001) and amphibians (β = 0.15, p < 0.05), longitude for vascular plants (β = 0.23, p < 0.001) and amphibians (β = 0.49, p < 0.001), and FC for vascular plants (β = −0.11, p < 0.001) and amphibians (β = −0.10, p < 0.05).

4. Discussion

4.1. Difference between Climatic Regions in the Effectiveness of Vascular Plants as Indicator Taxa

Strong positive RCs among taxonomic groups are vital to select indicator taxa [8,28,30,49]. The RC is considered strong when the between-taxon correlation coefficient exceeds 0.5 [50]. Our results were consistent with previous studies and supported significant positive RCs between vascular plants and vertebrates in most cases [23,24,51,52], indicating that vascular plants have application value to be indicator taxa for vertebrates. Note that the effectiveness of vascular plants as indicator taxa for vertebrates varied with climatic regions and taxonomic groups (Figure 2). However, there are a few outliers in the correlation populations. Indeed, the effects of these outliers on the correlation population estimation were small since we used 999 repeated random samples to estimate the overall correlation parameters.
The strength of vascular plants as predictors of species richness of reptiles and amphibians was greater in temperate regions than in subtropical regions (Figure 2c,d). In contrast, the strength of vascular plants as predictors of species richness of birds was weaker in temperate regions than in subtropical regions (Figure 2b). Furthermore, the RCs of subtropical and temperate regions were larger than 0.5 (i.e., the effectiveness of vascular plants as indicator taxa for mammals in subtropical regions was similar to that in temperate regions). However, they were significantly different (Figure 2a). Our results echo those of previous studies that had no consistent conclusions about the effectiveness of vascular plants as an effective indicator taxon when the predictions varied with taxa [5,9,14,15,49,53]. However, vascular plants were considered indicator taxa because they were easy to survey, widely distributed, and stable in taxonomy [15,54]. For example, at China’s regional and local scales, there are significant strong RCs between vascular plants and a few taxonomic groups (vertebrates, insects), and vascular plants have been considered potential indicator taxa [23,24,39,51]. Brunbjerg et al. [15] also confirmed that vascular plants are suitable indicator taxa for many taxonomic groups in Denmark (e.g., bryophytes, lichens, macro-fungi). However a review of the effectiveness of vascular plants as indicator taxa for bryophytes in 27 papers found that vascular plants are not suitable indicator taxa for bryophytes. Therefore, vascular plants might be suitable indicator taxa for some taxonomic groups in given regions. From our results, vascular plants were suitable indicator taxa for reptiles and amphibians in temperate regions and birds in subtropical regions. However vascular plants are certainly not the perfect indicator taxa for predicting the species richness of all other taxonomic groups in all regions [11,55].

4.2. Ecological Mechanisms Promoting RCs between Vascular Plants and Vertebrates in Subtropical and Temperate Regions

Richness correlations among taxonomic groups are closely related to the effects of shared environmental factors on the species richness of the taxa [28,56]. Toranza and Arim [29] confirmed three common environmental factors (latitude, potential evapotranspiration, and temperature) significantly contributed to RCs between mammals and birds in the Brazilian savanna. The RC between aquatic plants and fishes in 214 catchments of China is related to some key mechanisms, such as the energy hypothesis and area/habitat heterogeneity [39]. Our results were in accord with the above literature providing evidence that the consistent response of species richness of taxonomic groups to shared environmental factors such as potential annual evapotranspiration, temperature, area, and elevation range promoted RCs between vascular plants and vertebrates (Figure 3). Our results also provided evidence of the significant effects of longitude and FC on RCs among taxonomic groups in temperate regions. In previous studies, NDVI and latitude were considered common environmental factors that drive the richness pattern of vascular plants and vertebrates [25]. Unfortunately, our findings were not supported because only the significant effect of NDVI and latitude on the species richness of vertebrates were found (Figure A1 and Figure A2).
Interestingly, the shared environmental factors contributing to RCs varied with target taxa and climatic regions. However that is not surprising because of the habitat heterogeneity among climatic regions [26] and different habitat tolerance ranges not only in different climatic regions [57] but also in the different taxonomic groups [58]. In temperate regions with low annual mean temperatures, RCs between vascular plants and ectotherms (reptiles and amphibians) were affected not only by habitat heterogeneity, longitude, and FC but also by the minimum temperature of the coldest month. However, RCs between vascular plants and endotherms (mammals and birds) were promoted by longitude, habitat heterogeneity, and FC. The difference might be caused by the thermal tolerance range between endotherms and ectotherms [58]. Compared with endotherms, species richness of ectotherms was more sensitive to the external environment and was limited by the frost tolerance hypothesis because they keep body temperature balanced via the external environment [59]. In subtropical regions with high annual mean temperatures and abundant precipitation, the energy hypothesis (annual potential evapotranspiration) and habitat heterogeneity (area) notably contributed to RCs between vascular plants and vertebrates (Figure 3). Energy factors and habitat heterogeneity were common ecological drivers of RCs between vascular plants and vertebrates in subtropical and temperate regions [11,31] rather than climatic stability, the productivity hypothesis, and soil properties. That might be correlated with the dominant and unique effects of energy and habitat heterogeneity on the richness patterns of multiple taxonomic groups at the regional or local scale via direct effects on the rate of genetic evolution [60,61,62,63].

4.3. Differences in Richness Correlations in Subtropical and Temperate Regions Caused by Abiotic Factors

There was a significant difference in RCs between vascular plants and vertebrates in subtropical and temperate regions (p < 0.001, Figure 2). The variation trend of RCs between vascular plants and birds from subtropical regions to temperate regions was consistent with the conclusion from Wolters et al. [18]. That confirmed that the RCs among taxonomic groups in subtropical regions were stronger than those in temperate regions (p < 0.001, Figure 2b). The above differences might be related to the effect of abiotic factors on species richness of multiple taxonomic groups: energy generally plays more an important role in driving richness patterns of taxonomic groups than longitude [61,63,64,65]. Further, RCs between vascular plants were promoted by area and PET (energy factor) in subtropical regions, whereas they were promoted by elevation range and longitude in temperate regions.
Biological factors might also contribute to the difference in RCs among taxonomic groups between subtropical and temperate regions. However, the effect of biological factors on the RC was weaker than the effect of abiotic factors [30]. Organisms have more opportunities to communicate with other organisms in subtropical regions than in temperate regions [26]. Further, taxonomic groups in different tropical levels could promote RCs among taxonomic groups via biological relations such as symbiosis, parasitism, and competition [18]. Contrary to the conclusion of Wolters et al. [18], but similar to the results of Westgate et al. [19], RCs between vascular plants and other taxonomic groups (mammals, reptiles, and amphibians) in subtropical regions were found to be weaker than those in temperate regions (p < 0.001, Figure 2a,c,d). That might have resulted from the different effects of abiotic factors on the species richness of multiple taxonomic groups in different climatic regions. The consistent response of species richness of vascular plants and other vertebrates (mammals, reptiles, amphibians) to common variables in temperate regions was stronger than that in subtropical regions (Figure 3). Therefore, the differences in RCs among taxonomic groups between climatic regions were probably caused by abiotic factors.

5. Conclusions

Richness correlations among taxonomic groups in various climatic regions were explored using data on flora and fauna across 219 nature reserves in China. It was found that the climatic region was one factor causing variation of RCs across climatic regions. Our findings still supported the potential application value of vascular plants as a suitable indicator taxon, although there are limitations to the application range of vascular plants as good indicator taxa across climatic regions. Furthermore, it was discovered that abiotic factors (e.g., annual potential evapotranspiration, the maximum temperature of the warmest month, minimum temperature of coldest month, longitude, elevation range, and FC) caused RCs and differences between the two climatic regions studied. That highlights that energy factors and habitat heterogeneity were the main drivers of RCs between vascular plants and vertebrates in the two climatic regions. However, to comprehensively understand the effect of climatic regions on the variation of RCs, we would like to collect data on more taxonomic groups in the future to analyse RCs in more climatic regions.

Supplementary Materials

The following supporting information can be downloaded at: https://www.mdpi.com/article/10.3390/d14060499/s1; Table S1: Species richness of five taxonomic groups and environmental variables in subtropical nature reserves; Table S2: Species richness of five taxonomic groups and environmental variables in temperate nature reserves.

Author Contributions

Conceptualization, S.J. and F.K.; methodology, S.J.; formal analysis, S.J.; data curation, S.J.; writing—original draft preparation, S.J., R.H. and J.Z.; writing—review and editing, S.J., M.Z. and F.K.; visualization, S.J.; funding acquisition, M.Z. All authors have read and agreed to the published version of the manuscript.

Funding

This research was funded by the National Natural Science Foundation of China (Grant number 31901105).

Institutional Review Board Statement

Not applicable.

Informed Consent Statement

Not applicable.

Data Availability Statement

Data can be found within the manuscript supplementary materials.

Conflicts of Interest

There is no conflict of interest.

Appendix A

Figure A1. Standardized coefficients of the averaged model and their 95% confidence intervals for vascular plants and vertebrates in the subtropical regions; (a) vascular plants, (b) mammals, (c) birds, (d) reptiles, (e) amphibians.
Diversity 14 00499 g0a1
Figure A2. Standardized coefficients of the averaged model and their 95% confidence intervals for vascular plants and vertebrates in temperate regions; (a) vascular plants, (b) mammals, (c) birds, (d) reptiles, (e) amphibians.
Diversity 14 00499 g0a2

References

  1. Scheffers, B.R.; Joppa, L.N.; Pimm, S.L.; Laurance, W.F. What we know and don’t know about Earth’s missing biodiversity. Trends Ecol. Evol. 2012, 27, 501–510. [Google Scholar] [CrossRef] [PubMed]
  2. Souza, J.L.P.; Baccaro, F.B.; Landeiro, V.L.; Franklin, E.; Magnusson, W.E.; Pequeno, P.A.C.L.; Fernandes, I.O. Taxonomic sufficiency and indicator taxa reduce sampling costs and increase monitoring effectiveness for ants. Divers. Distrib. 2016, 22, 111–122. [Google Scholar] [CrossRef]
  3. Howard, P.C.; Viskanic, P.; Davenport, T.R.B.; Kigenyi, F.W.; Baltzer, M.; Dickinson, C.J.; Lwanga, J.S.; Matthews, R.A.; Balmford, A. Complementarity and the use of indicator groups for reserve selection in Uganda. Nature 1998, 394, 472–475. [Google Scholar] [CrossRef]
  4. Caro, T.; Girling, S. Conservation by Proxy: Indicator, Umbrella, Keystone, Flagship, and Other Surrogate Species; The University of Chicago Press: Chicago, IL, USA, 2010. [Google Scholar]
  5. Santi, E.; Maccherini, S.; Rocchini, D.; Bonini, I.; Brunialti, G.; Favilli, L.; Perini, C.; Pezzo, F.; Piazzini, S.; Rota, E.; et al. Simple to sample: Vascular plants as surrogate group in a nature reserve. J. Nat. Conserv. 2010, 18, 2–11. [Google Scholar] [CrossRef]
  6. Hunter, M.; Westgate, M.; Barton, P.; Calhoun, A.; Pierson, J.; Tulloch, A.; Beger, M.; Branquinho, C.; Caro, T.; Gross, J.; et al. Two roles for ecological surrogacy: Indicator surrogates and management surrogates. Ecol. Indic. 2016, 63, 121–125. [Google Scholar] [CrossRef]
  7. Bal, P.; Tulloch, A.I.; Addison, P.F.; McDonald-Madden, E.; Rhodes, J.R. Selecting indicator species for biodiversity management. Front. Ecol. Environ. 2018, 16, 589–598. [Google Scholar] [CrossRef]
  8. de Morais, G.F.; dos Santos Ribas, L.G.; Ortega, J.C.G.; Heino, J.; Bini, L.M. Biological surrogates: A word of caution. Ecol. Indic. 2018, 88, 214–218. [Google Scholar] [CrossRef]
  9. Pharo, E.J.; Beattie, A.J.; Binns, D. Vascular plant diversity as a surrogate for bryophyte and lichen fiversity. Conserv. Biol. 1999, 13, 282–292. [Google Scholar] [CrossRef]
  10. Lovell, S.; Hamer, M.; Slotow, R.; Herbert, D. Assessment of congruency across invertebrate taxa and taxonomic levels to identify potential surrogates. Biol. Conserv. 2007, 139, 113–125. [Google Scholar] [CrossRef]
  11. Kirkman, L.K.; Smith, L.L.; Quintana-Ascencio, P.F.; Kaeser, M.J.; Golladay, S.W.; Farmer, A.L. Is species richness congruent among taxa? Surrogacy, complementarity, and environmental correlates among three disparate taxa in geographically isolated wetlands. Ecol. Indic. 2012, 18, 131–139. [Google Scholar] [CrossRef]
  12. Ruhí, A.; Batzer, D.P. Assessing congruence and surrogacy among wetland macroinvertebrate taxa towards efficiently measuring biodiversity. Wetlands 2014, 34, 1061–1071. [Google Scholar] [CrossRef]
  13. Larrieu, L.; Gosselin, F.; Archaux, F.; Chevalier, R.; Corriol, G.; Dauffy-Richard, E.; Deconchat, M.; Gosselin, M.; Ladet, S.; Savoie, J.-M.; et al. Cost-efficiency of cross-taxon surrogates in temperate forests. Ecol. Indic. 2018, 87, 56–65. [Google Scholar] [CrossRef]
  14. Zhang, K.; Lin, S.; Ji, Y.; Yang, C.; Wang, X.; Yang, C.; Wang, H.; Jiang, H.; Harrison, R.D.; Yu, D.W. Plant diversity accurately predicts insect diversity in two tropical landscapes. Mol. Ecol. 2016, 25, 4407–4419. [Google Scholar] [CrossRef] [PubMed]
  15. Brunbjerg, A.K.; Bruun, H.H.; Dalby, L.; Fløjgaard, C.; Frøslev, T.G.; Høye, T.T.; Goldberg, I.; Læssøe, T.; Hansen, M.D.D.; Brøndum, L.; et al. Vascular plant species richness and bioindication predict multi-taxon species richness. Methods Ecol. Evol. 2018, 9, 2372–2382. [Google Scholar] [CrossRef]
  16. Eglington, S.M.; Noble, D.G.; Fuller, R.J. A meta-analysis of spatial relationships in species richness across taxa: Birds as indicators of wider biodiversity in temperate regions. J. Nat. Conserv. 2012, 20, 301–309. [Google Scholar] [CrossRef]
  17. Gossner, M.M.; Fonseca, C.R.; Pašalić, E.; Türke, M.; Lange, M.; Weisser, W.W. Limitations to the use of arthropods as temperate forests indicators. Biodivers. Conserv. 2014, 23, 945–962. [Google Scholar] [CrossRef]
  18. Wolters, V.; Bengtsson, J.; Zaitsev, A. Relationship among species richness of different taxa. Ecology 2006, 87, 1886–1895. [Google Scholar] [CrossRef]
  19. Westgate, M.J.; Barton, P.S.; Lane, P.W.; Lindenmayer, D.B. Global meta-analysis reveals low consistency of biodiversity congruence relationships. Nat. Commun. 2014, 5, 3899. [Google Scholar] [CrossRef] [Green Version]
  20. Chave, J. The problem of pattern and scale in ecology: What have we learned in 20 years? Ecol. Lett. 2013, 16, 4–16. [Google Scholar] [CrossRef]
  21. Pearson, D.L.; Carroll, S.S. The Influence of spatial scale on cross-taxon congruence patterns and prediction accuracy of species richness. J. Biogeogr. 1999, 26, 1079–1090. [Google Scholar] [CrossRef]
  22. Burrascano, S.; de Andrade, R.B.; Paillet, Y.; Ódor, P.; Antonini, G.; Bouget, C.; Campagnaro, T.; Gosselin, F.; Janssen, P.; Persiani, A.M.; et al. Congruence across taxa and spatial scales: Are we asking too much of species data? Glob. Ecol. Biogeogr. 2018, 27, 980–990. [Google Scholar] [CrossRef]
  23. Qian, H.; Kissling, W.D. Spatial scale and cross-taxon congruence of terrestrial vertebrate and vascular plant species richness in China. Ecology 2010, 91, 1172–1183. [Google Scholar] [CrossRef] [PubMed]
  24. Xu, H.; Cao, Y.; Cao, M.; Wu, J.; Wu, Y.; Le, Z.; Cui, P.; Li, J.; Ma, F.; Liu, L.; et al. Varying congruence among spatial patterns of vascular plants and vertebrates based on habitat groups. Ecol. Evol. 2017, 7, 8829–8840. [Google Scholar] [CrossRef] [PubMed] [Green Version]
  25. Gillman, L.N.; Wright, S.D.; Cusens, J.; McBride, P.D.; Malhi, Y.; Whittaker, R.J. Latitude, productivity and species richness. Glob. Ecol. Biogeogr. 2015, 24, 107–117. [Google Scholar] [CrossRef]
  26. Willig, M.R.; Kaufman, D.M.; Stevens, R.D. Latitudinal gradients of biodiversity: Pattern, process, scale, and synthesis. Annu Rev. Ecol. Evol. Syst. 2003, 34, 273–309. [Google Scholar] [CrossRef]
  27. Hillebrand, H. On the generality of the latitudinal diversity gradient. Am. Nat. 2004, 163, 192–211. [Google Scholar] [CrossRef] [Green Version]
  28. Gaston, K.J. Biodiversity—Congruence. Prog. Phys. Geog. 1996, 20, 105–112. [Google Scholar] [CrossRef]
  29. Toranza, C.; Arim, M. Cross-taxon congruence and environmental conditions. BMC Ecol. 2010, 10, 18. [Google Scholar] [CrossRef] [Green Version]
  30. Duan, M.; Liu, Y.; Yu, Z.; Baudry, J.; Li, L.; Wang, C.; Axmacher, J.C. Disentangling effects of abiotic factors and biotic interactions on cross-taxon congruence in species turnover patterns of plants, moths and beetles. Sci. Rep. 2016, 6, 23511. [Google Scholar] [CrossRef] [Green Version]
  31. de Andrade, R.B.; Barlow, J.; Louzada, J.; Mestre, L.; Silveira, J.; Vaz-de-Mello, F.Z.; Cochrane, M.A. Biotic congruence in humid tropical forests: A multi-taxa examination of spatial distribution and responses to forest disturbance. Ecol. Indic. 2014, 36, 572–581. [Google Scholar] [CrossRef]
  32. Gao, J.; Liu, Y. Climate stability is more important than water–energy variables in shaping the elevational variation in species richness. Ecol. Evol. 2018, 8, 6872–6879. [Google Scholar] [CrossRef] [PubMed]
  33. Werneck, F.P.; Nogueira, C.; Colli, G.R.; Sites, J.W., Jr.; Costa, G.C. Climatic stability in the Brazilian Cerrado: Implications for biogeographical connections of south American savannas, species richness and conservation in a biodiversity hotspot. J. Biogeogr. 2012, 39, 1695–1706. [Google Scholar] [CrossRef]
  34. Pandey, B.; Khatiwada, J.R.; Zhang, L.; Pan, K.; Dakhil, M.A.; Xiong, Q.; Yadav, R.K.P.; Siwakoti, M.; Tariq, A.; Olatunji, O.A.; et al. Energy–water and seasonal variations in climate underlie the spatial distribution patterns of gymnosperm species richness in China. Ecol. Evol. 2020, 10, 9474–9485. [Google Scholar] [CrossRef] [PubMed]
  35. Peppler-Lisbach, C.; Kleyer, M. Patterns of species richness and turnover along the pH gradient in deciduous forests: Testing the continuum hypothesis. J. Veg. Sci. 2009, 20, 984–995. [Google Scholar] [CrossRef]
  36. Palpurina, S.; Wagner, V.; von Wehrden, H.; Hájek, M.; Horsák, M.; Brinkert, A.; Hölzel, N.; Wesche, K.; Kamp, J.; Hájková, P.; et al. The relationship between plant species richness and soil pH vanishes with increasing aridity across Eurasian dry grasslands. Glob. Ecol. Biogeogr. 2017, 26, 425–434. [Google Scholar] [CrossRef]
  37. Jordan, S.; Palmquist, K.; Bradford, J.; Lauenroth, W. Soil water availability shapes species richness in mid-latitude shrub steppe plant communities. J. Veg. Sci. 2020, 31, 646–657. [Google Scholar] [CrossRef]
  38. Chase, J.M.; Leibold, M.A. Spatial scale dictates the productivity–biodiversity relationship. Nature 2002, 416, 427–430. [Google Scholar] [CrossRef]
  39. Xu, J.; García Molinos, J.; Su, G.; Matsuzaki, S.-i.S.; Akasaka, M.; Zhang, H.; Heino, J. Cross-taxon congruence of multiple diversity facets of freshwater assemblages is determined by large-scale processes across China. Freshw. Biol. 2019, 64, 1492–1503. [Google Scholar] [CrossRef]
  40. Zhang, B.; Zhu, G. Climate Regionalization in China (First Draft); Science Press: Beijing, China, 1959. [Google Scholar]
  41. Administration, N.M. Climatological Atlas for the People’s Republic of China; Maps Press: Beijing, China, 1979. [Google Scholar]
  42. Wang, K. National Nature Reserves of China; Anhui Scientific and Technology Press: Hefei, China, 2003. [Google Scholar]
  43. Zhang, J. Nature Reserves in Guangdong Province; China Forestry Publishing House: Beijing, China, 2016. [Google Scholar]
  44. Tang, W. Nature Reserves in Guangxi Province; China Environmental Press: Beijing, China, 2014. [Google Scholar]
  45. Ge, J.; Wang, X. Nature Reserves in Hubei Province; Hubei Science and Technology Press: Wuhan, China, 2014. [Google Scholar]
  46. Dormann, C.F.; Elith, J.; Bacher, S.; Buchmann, C.; Carl, G.; Carré, G.; Marquéz, J.R.G.; Gruber, B.; Lafourcade, B.; Leitão, P.J.; et al. Collinearity: A review of methods to deal with it and a simulation study evaluating their performance. Ecography 2013, 36, 27–46. [Google Scholar] [CrossRef]
  47. Grueber, C.E.; Nakagawa, S.; Laws, R.J.; Jamieson, I.G. Multimodel inference in ecology and evolution: Challenges and solutions. J. Evol. Biol. 2011, 24, 699–711. [Google Scholar] [CrossRef]
  48. Peters, M.K.; Hemp, A.; Appelhans, T.; Behler, C.; Classen, A.; Detsch, F.; Ensslin, A.; Ferger, S.W.; Frederiksen, S.B.; Gebert, F.; et al. Predictors of elevational biodiversity gradients change from single taxa to the multi-taxa community level. Nat. Commun 2016, 7, 13736. [Google Scholar] [CrossRef] [PubMed] [Green Version]
  49. Bagella, S. Does cross-taxon analysis show similarity in diversity patterns between vascular plants and bryophytes? some answers from a literature review. Comptes Rendus. Biol. 2014, 337, 276–282. [Google Scholar] [CrossRef] [PubMed]
  50. Lamoreux, J.F.; Morrison, J.C.; Ricketts, T.H.; Olson, D.M.; Dinerstein, E.; McKnight, M.W.; Shugart, H.H. Global tests of biodiversity concordance and the importance of endemism. Nature 2006, 440, 212–214. [Google Scholar] [CrossRef]
  51. Qian, H. Relationships between plant and animal species richness at a regional scale in China. Conserv. Biol. 2007, 21, 937–944. [Google Scholar] [CrossRef] [PubMed]
  52. Zhao, S.; Fang, J.; Peng, C.; Tang, Z. Relationships between species richness of vascular plants and terrestrial vertebrates in China: Analyses based on data of nature reserves. Divers. Distrib. 2006, 12, 189–194. [Google Scholar] [CrossRef]
  53. Shinohara, N.; Yoshida, T. Why species richness of plants and herbivorous insects do or do not correlate. Ecol. Res. 2021, 36, 258–265. [Google Scholar] [CrossRef]
  54. Lewandowski, A.S.; Noss, R.F.; Parsons, D.R. The effectiveness of surrogate taxa for the representation of biodiversity. Conserv. Biol. 2010, 24, 1367–1377. [Google Scholar] [CrossRef]
  55. Gioria, M.; Bacaro, G.; Feehan, J. Evaluating and interpreting cross-taxon congruence: Potential pitfalls and solutions. Acta OEcol. 2011, 37, 187–194. [Google Scholar] [CrossRef]
  56. van Weerd, M.; Udo de Haes, H.A. Cross-taxon congruence in tree, bird and bat species distributions at a moderate spatial scale across four tropical forest types in the Philippines. Biodivers. Conserv. 2010, 19, 3393–3411. [Google Scholar] [CrossRef] [Green Version]
  57. Compton, T.J.; Rijkenberg, M.J.A.; Drent, J.; Piersma, T. Thermal tolerance ranges and climate variability: A comparison between bivalves from differing climates. J. Exp. Mar. Biol. Ecol. 2007, 352, 200–211. [Google Scholar] [CrossRef] [Green Version]
  58. Sunday, J.; Bennett, J.M.; Calosi, P.; Clusella-Trullas, S.; Gravel, S.; Hargreaves, A.L.; Leiva, F.P.; Verberk, W.C.E.P.; Olalla-Tárraga, M.Á.; Morales-Castilla, I. Thermal tolerance patterns across latitude and elevation. Philos. Trans. R. Soc. B Biol. Sci. 2019, 374, 20190036. [Google Scholar] [CrossRef] [PubMed] [Green Version]
  59. Lu, S.; Zhou, S.; Yin, X.; Zhang, C.; Li, R.; Chen, J.; Ma, D.; Wang, Y.; Yu, Z.; Chen, Y. Patterns of tree species richness in southwest China. Environ. Monit. Assess. 2021, 193, 97. [Google Scholar] [CrossRef]
  60. Moreno-Rueda, G.; Pizarro, M. Relative influence of habitat heterogeneity, climate, human disturbance, and spatial structure on vertebrate species richness in Spain. Ecol. Res. 2009, 24, 335–344. [Google Scholar] [CrossRef]
  61. Gillman, L.N.; Wright, S.D. Species richness and evolutionary speed: The influence of temperature, water and area. J. Biogeogr. 2014, 41, 39–51. [Google Scholar] [CrossRef]
  62. Stein, A.; Gerstner, K.; Kreft, H. Environmental heterogeneity as a universal driver of species richness across taxa, biomes and spatial scales. Ecol. Lett. 2014, 17, 866–880. [Google Scholar] [CrossRef]
  63. Moser, D.; Dullinger, S.; Englisch, T.; Niklfeld, H.; Plutzar, C.; Sauberer, N.; Zechmeister, H.G.; Grabherr, G. Environmental determinants of vascular plant species richness in the Austrian Alps. J. Biogeogr. 2005, 32, 1117–1127. [Google Scholar] [CrossRef]
  64. Currie, D.J. Energy and large-scale patterns of animal- and plant-species richness. Am. Nat. 1991, 137, 27–49. [Google Scholar] [CrossRef]
  65. Qian, H.; Wang, X.; Wang, S.; Li, Y. Environmental determinants of amphibian and reptile species richness in China. Ecography 2007, 30, 471–482. [Google Scholar] [CrossRef]
Figure 1. Distribution map of studied nature reserves of China. The blue dots represent subtropical nature reserves, and the black dots represent temperate nature reserves.
Diversity 14 00499 g001
Figure 2. Richness correlations between vascular plants and vertebrates in different climate regions: (a) Vascular plants and mammals. (b) Vascular plants and birds. (c) Vascular plants and reptiles. (d) Vascular plants and amphibians. Spearman correlation analysis was used to compute the RCs between vascular plants and vertebrates. The Wilcoxon rank test was used to test the difference in RCs between the two climatic regions. Different letter markings in different climatic regions mean a significant difference in RCs between the different climatic regions (p < 0.001).
Diversity 14 00499 g002
Figure 3. Standardized coefficients of shared significant factors and 95% confidence intervals for vascular plants and vertebrates in (a) subtropical and (b) temperate regions.
Diversity 14 00499 g003
Table 1. The 15 selected environmental variables.
HypothesisVariables
Geographic factorsLongitude
Latitude
Habitat heterogeneityArea
Elevation range
Energy hypothesisMax temperature of the warmest month (Bio5)
Min temperature of the coldest month (Bio6)
Precipitation of the driest month (Bio14)
Annual potential evapotranspiration (PET)
Productivity hypothesisNormalized difference vegetation index (NDVI)
Climatic stabilityIsothermality (Bio3)
Precipitation seasonality (Bio15)
Soil propertiesTopsoil PH
Field capacity (FC)
Topsoil organic carbon
Total nitrogen density
Table 2. Richness correlation between vascular plants and vertebrates in different climatic regions. ρ represents Spearman correlation coefficient, and P represents the significance.
TaxaClimatic Regionsρmean (±ρsd)PmeanPsd)
Vascular plants–mammalsSubtropical regions0.51 (±0.084)1.95 × 10⁻³ (±0.008)
Vascular plants–mammalsTemperate regions0.52 (±0.089)2.24 × 10⁻³ (±0.011)
Vascular plants–birdsSubtropical regions0.58 (±0.075)2.13 × 10⁻⁴ (±0.001)
Vascular plants–birdsTemperate regions0.12 (±0.110)0.428 (±0.293)
Vascular plants–reptilesSubtropical regions0.30 (±0.086)0.068 (±0.100)
Vascular plants–reptilesTemperate regions0.63 (±0.073)4.86 × 10⁻⁵ (±0.001)
Vascular plants–amphibiansSubtropical regions0.40 (±0.089)0.02 (±0.004)
Vascular plants–amphibiansTemperate regions0.54 (±0.081)8.55 × 10⁻⁴ (±0.004)
Publisher’s Note: MDPI stays neutral with regard to jurisdictional claims in published maps and institutional affiliations.

