
Towards Solving the “Colomerus vitis Conundrum”: Genetic Evidence Reveals a Complex of Highly Diverged Groups with Little Morphological Differentiation

 , , , and
Abstract
:1. Introduction
2. Materials and Methods
2.1. Grapevine Mite Samples
2.2. Genetic Analyses
2.2.1. DNA Extraction, PCR Amplification, and DNA Sequencing
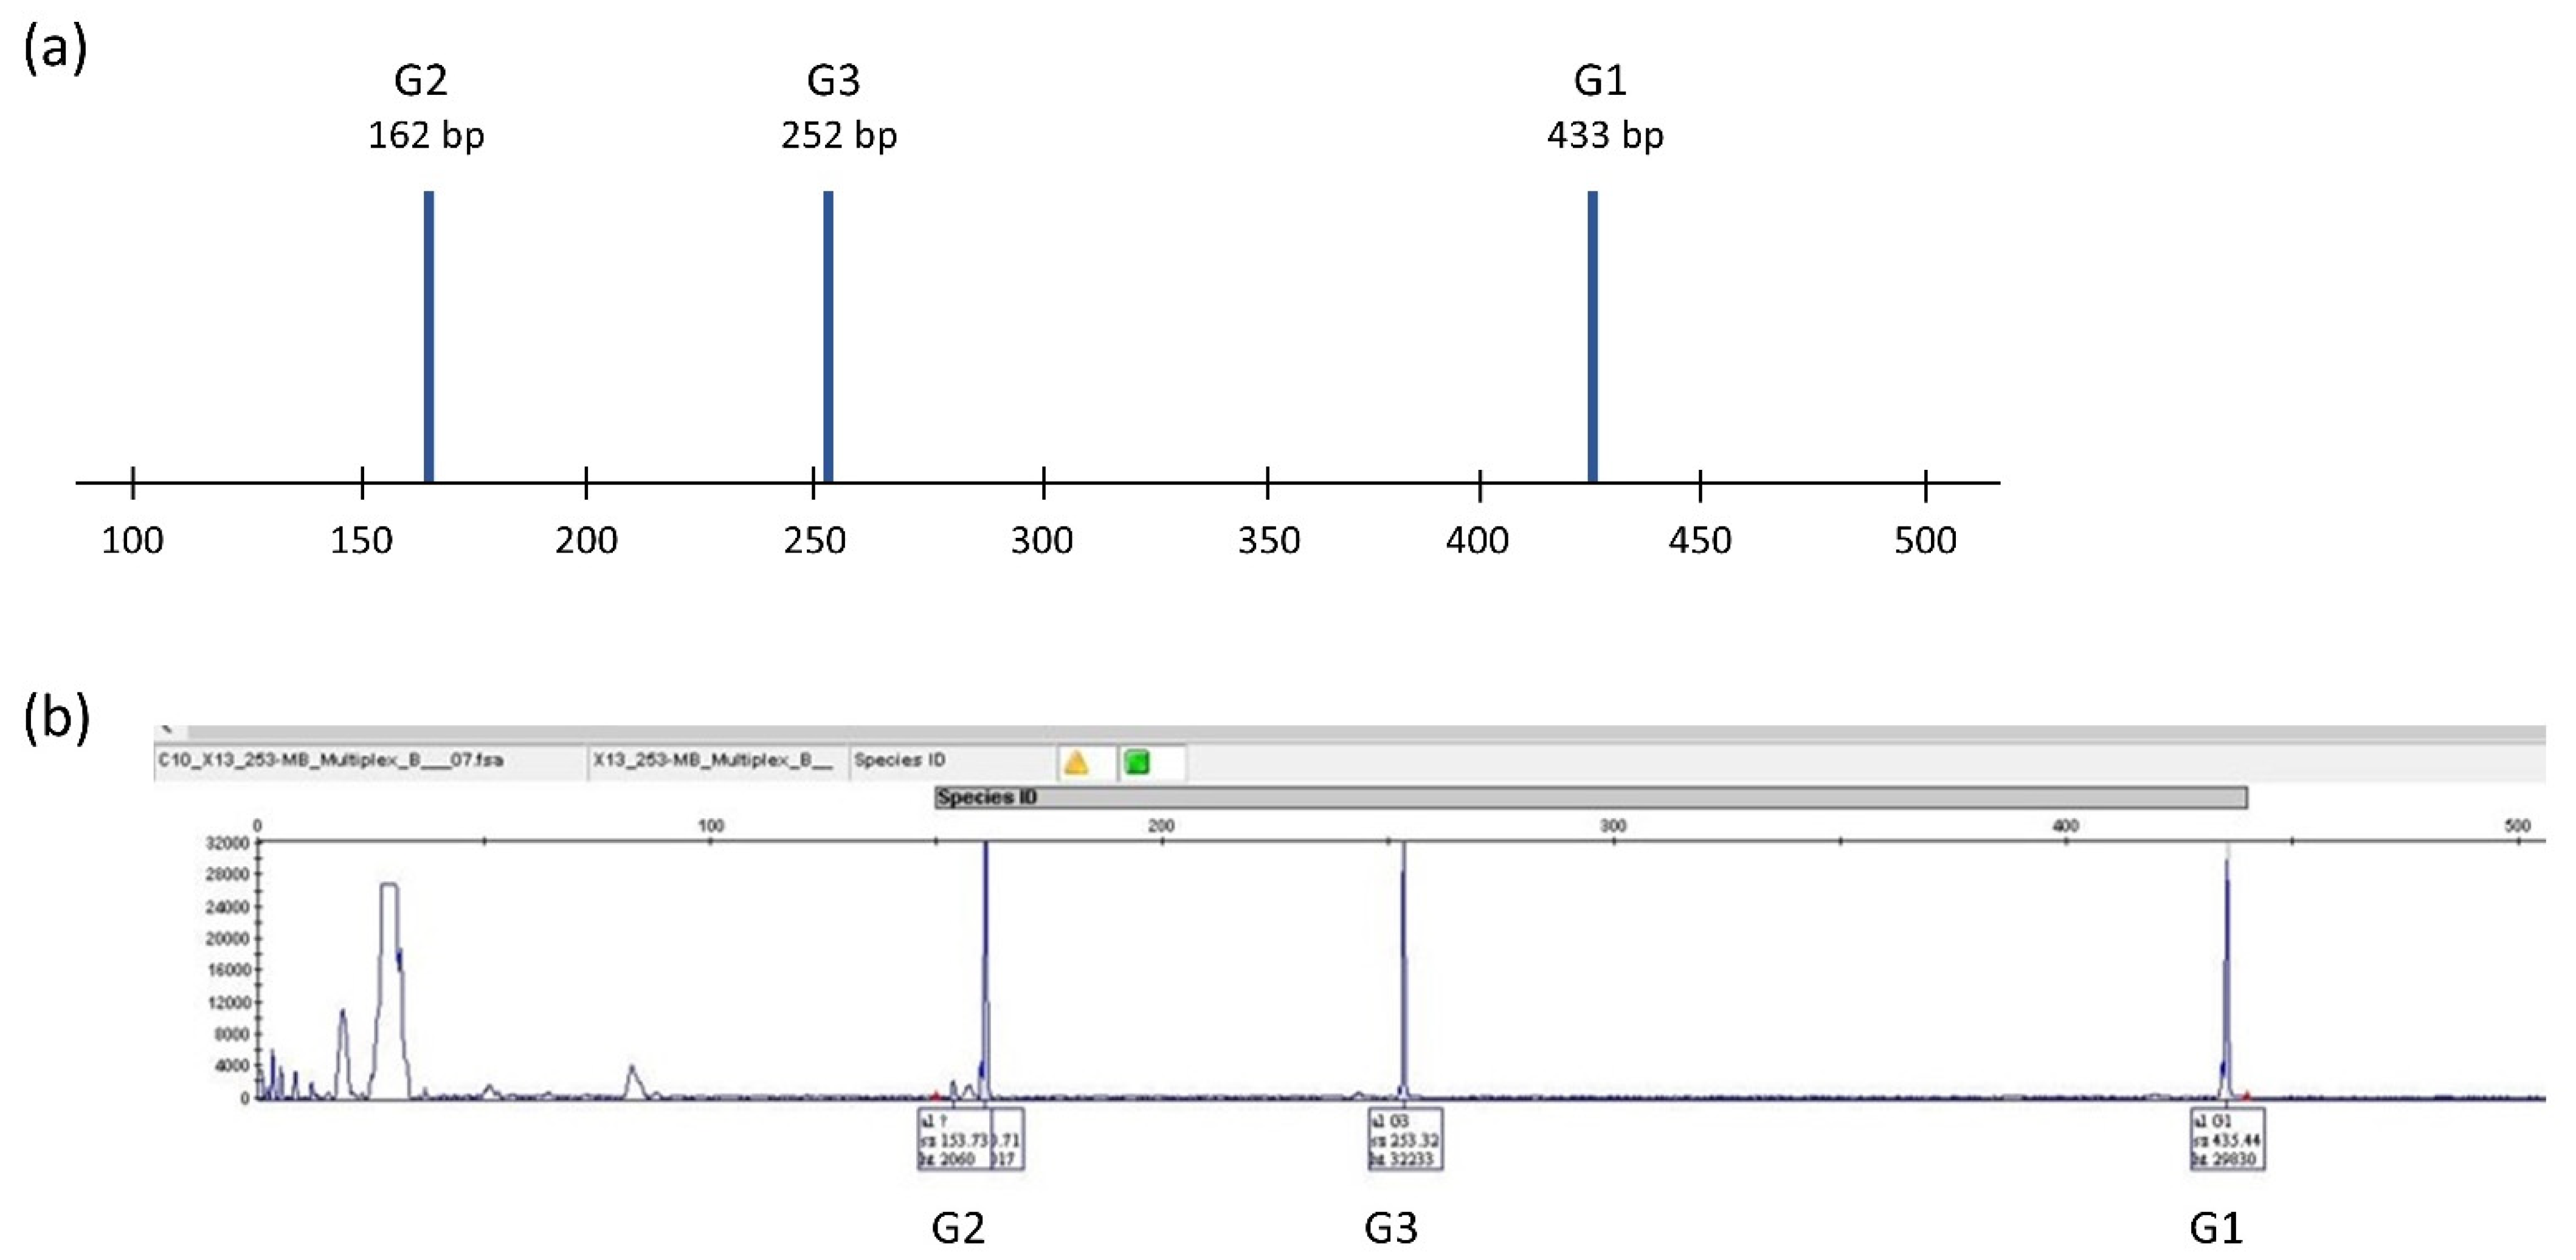
2.2.2. Multiplex PCR
2.2.3. Phylogenetic Analysis and Genetic Divergence
2.3. Morphological Analyses
3. Results
3.1. Genetic Analyses
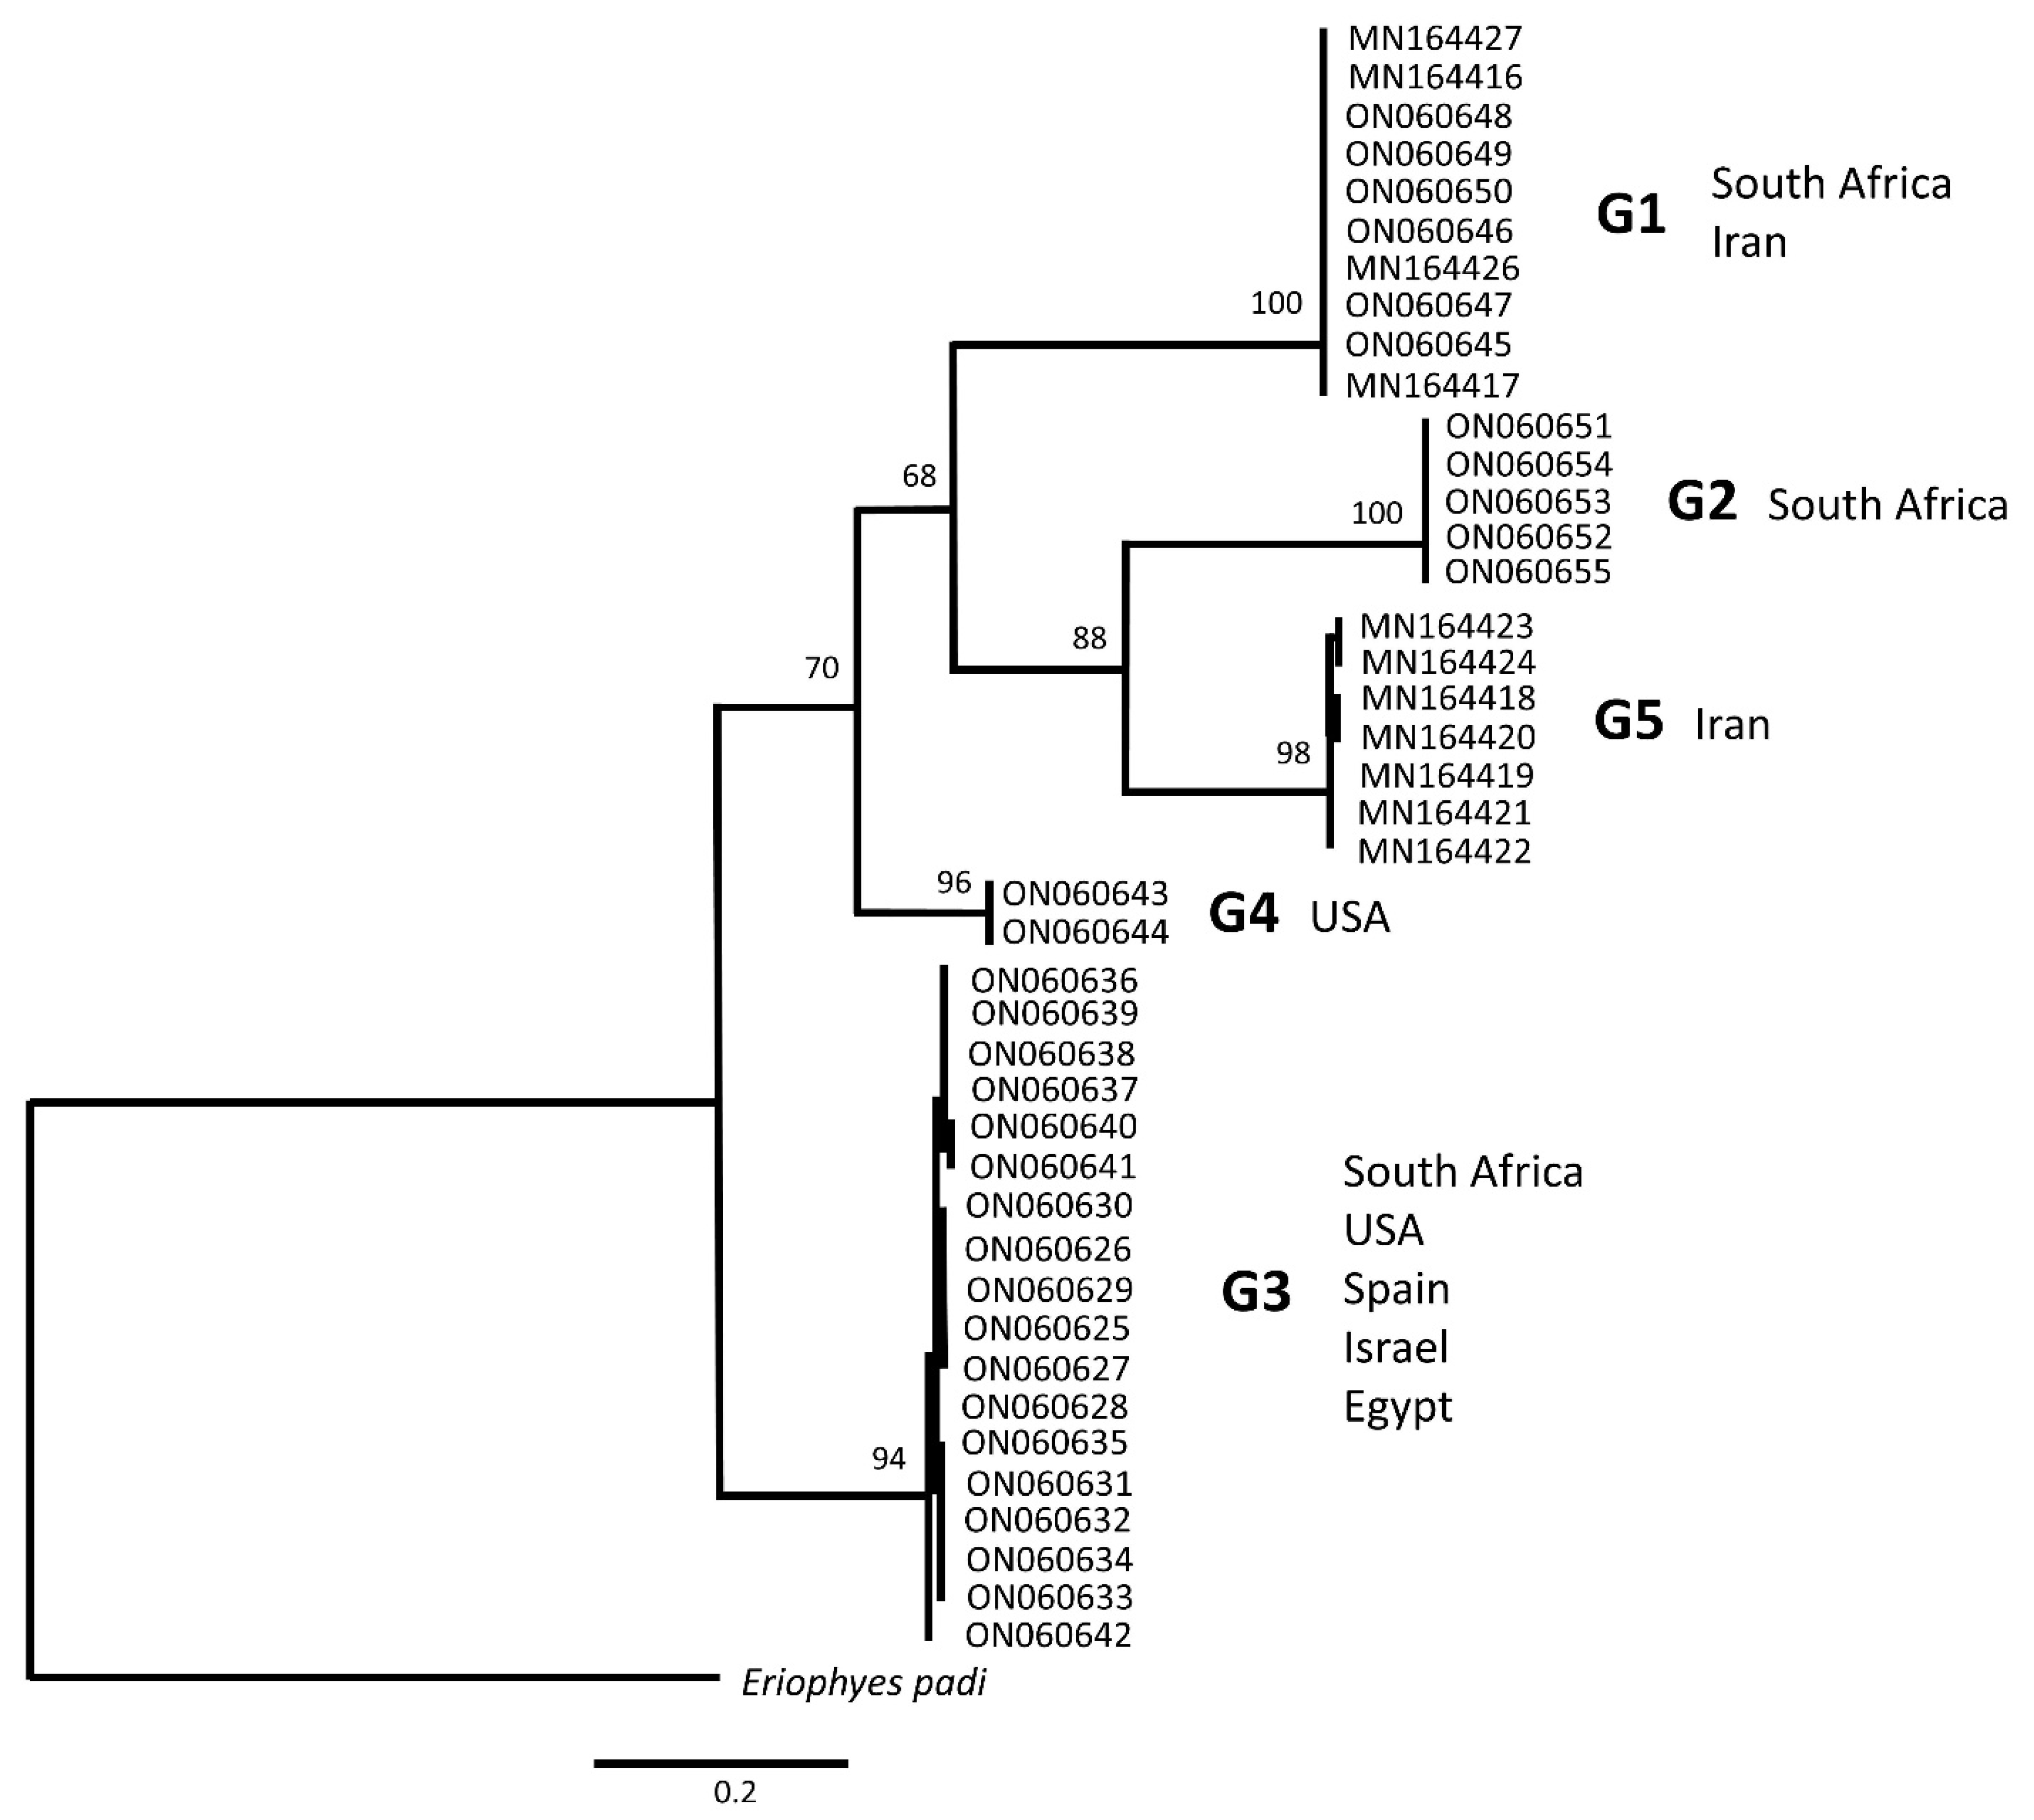
3.1.1. Phylogenetics and Genetic Clustering
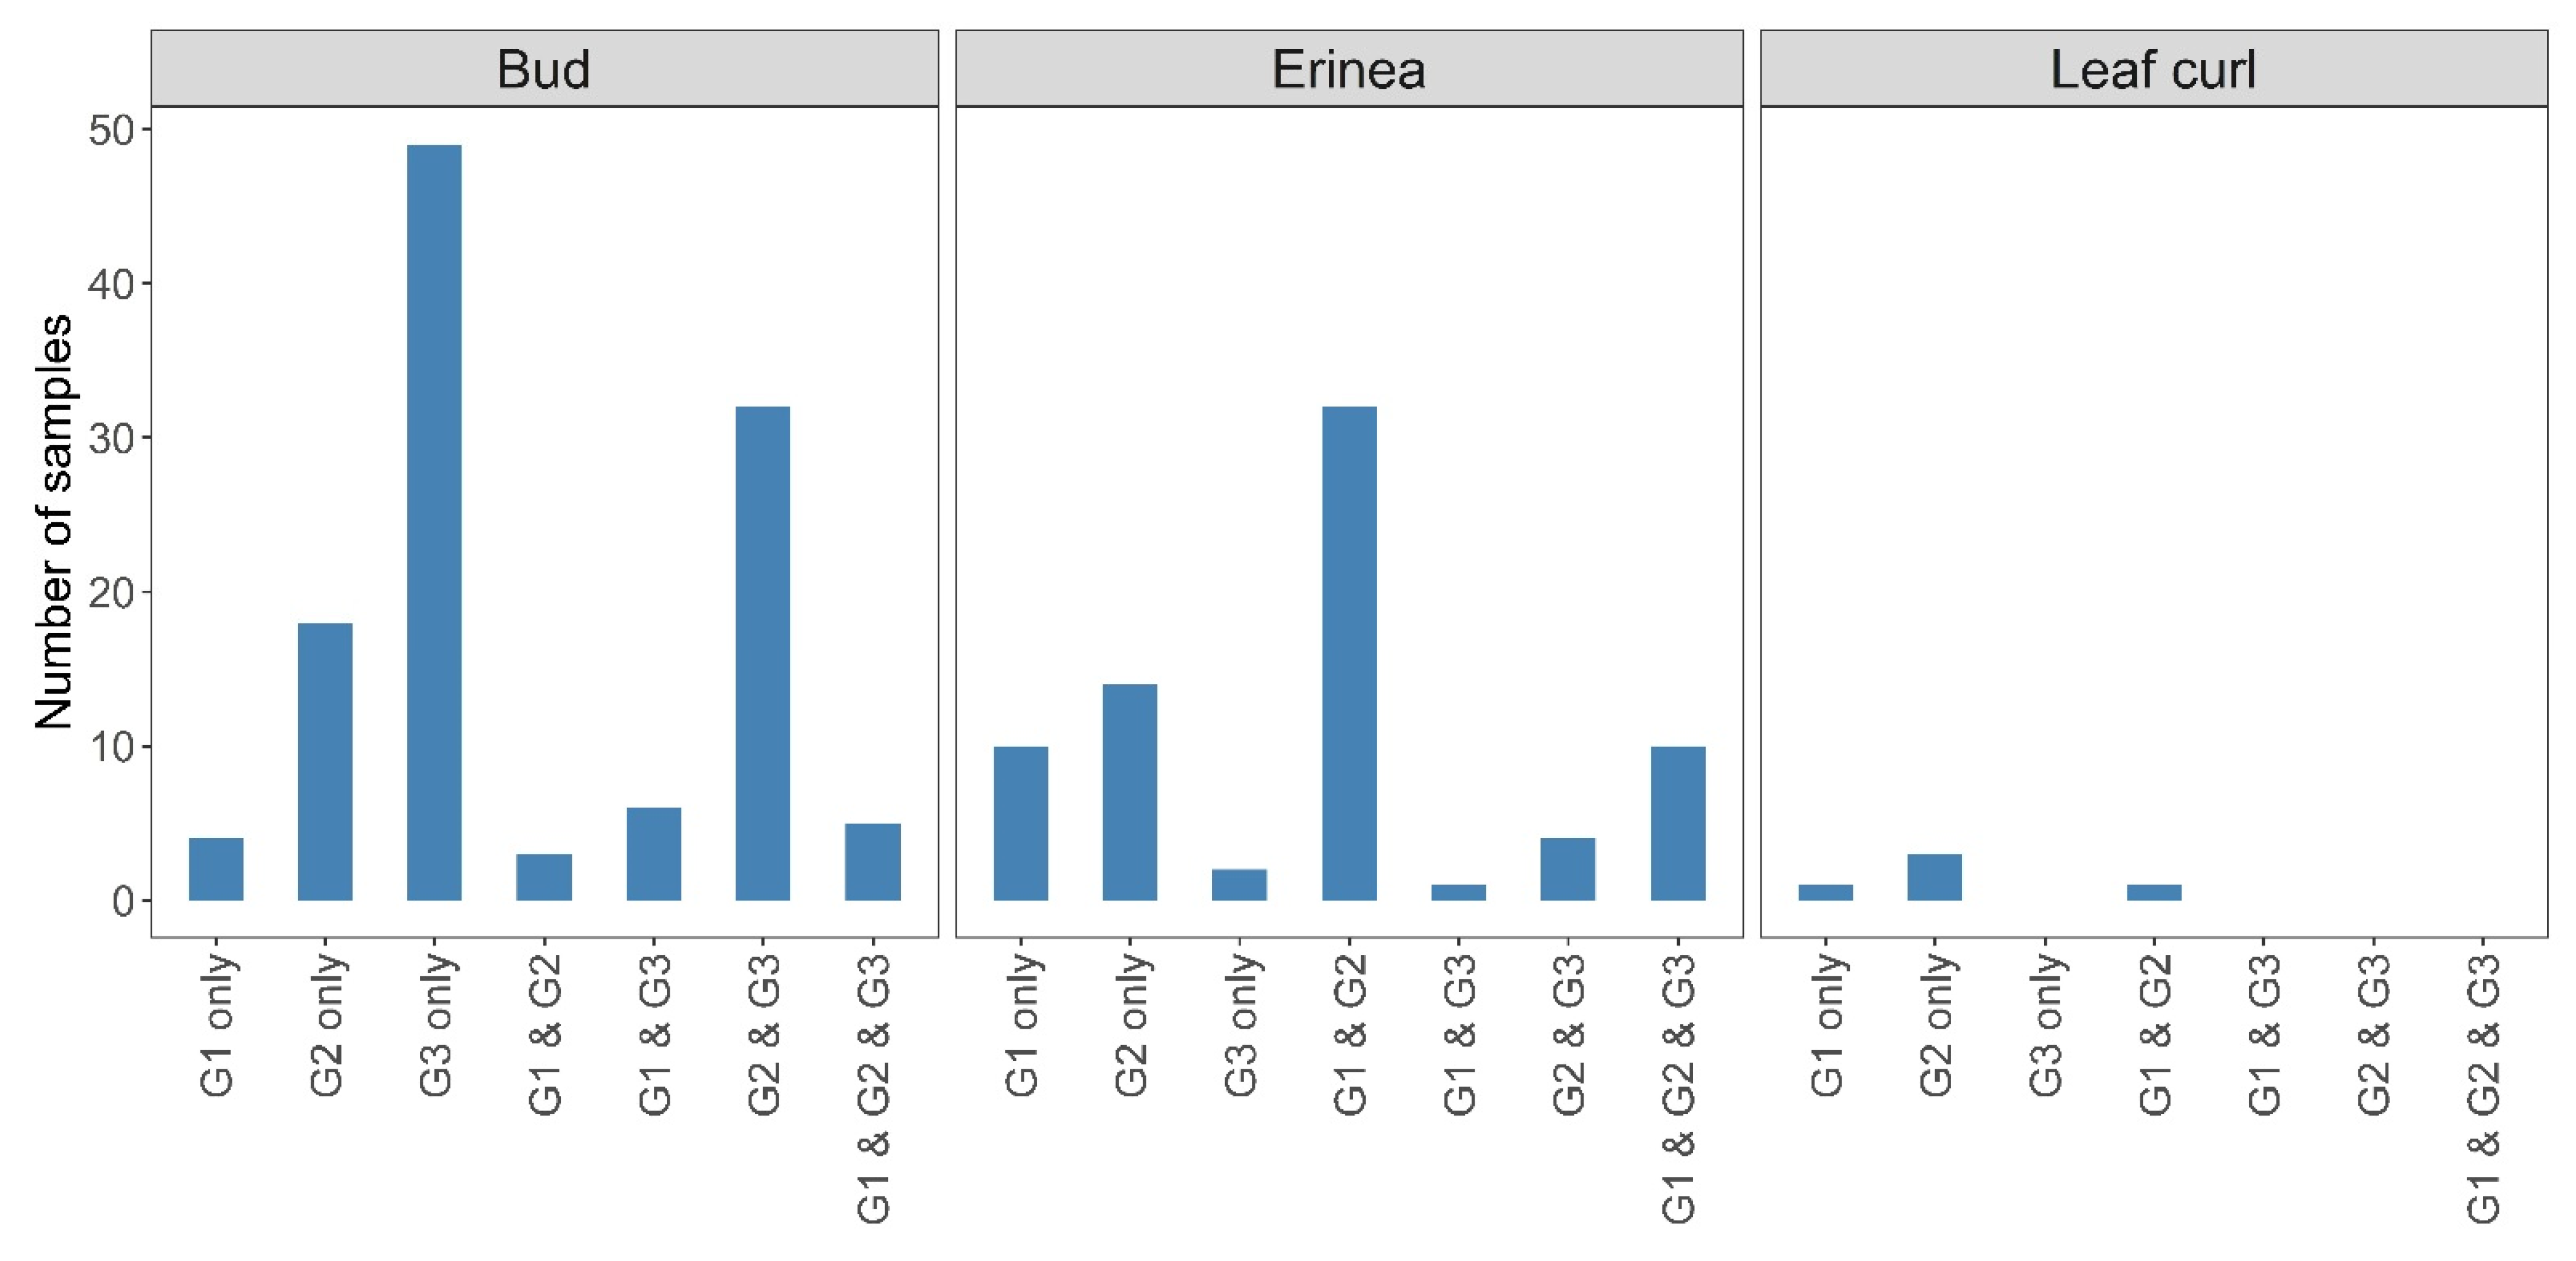
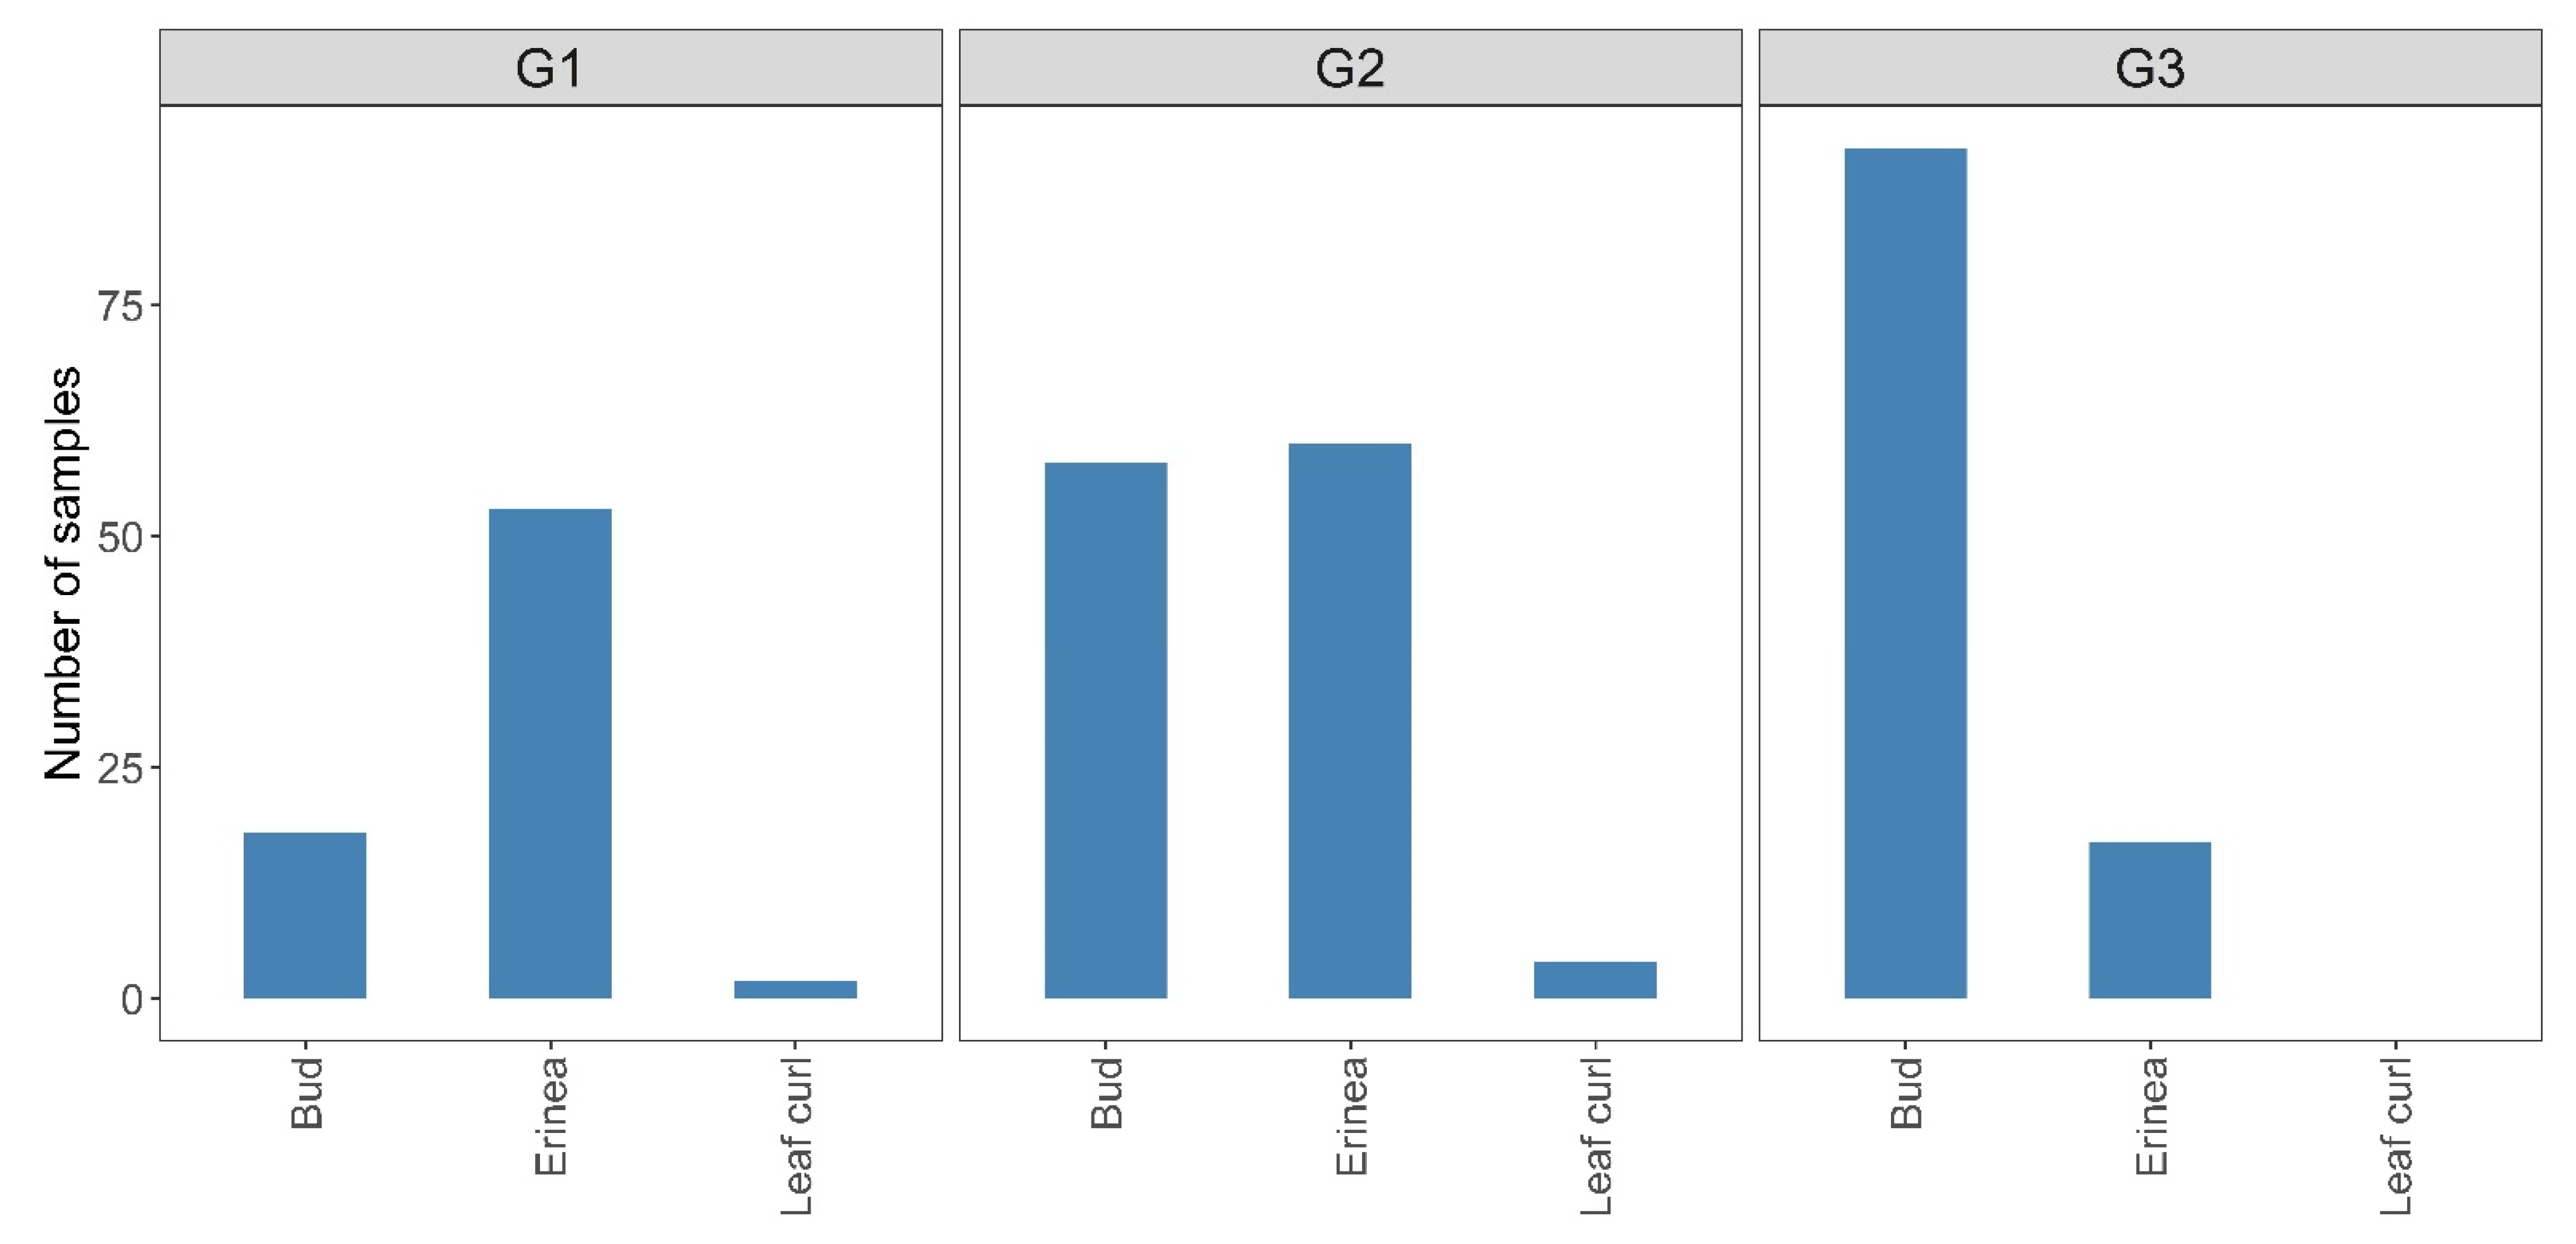
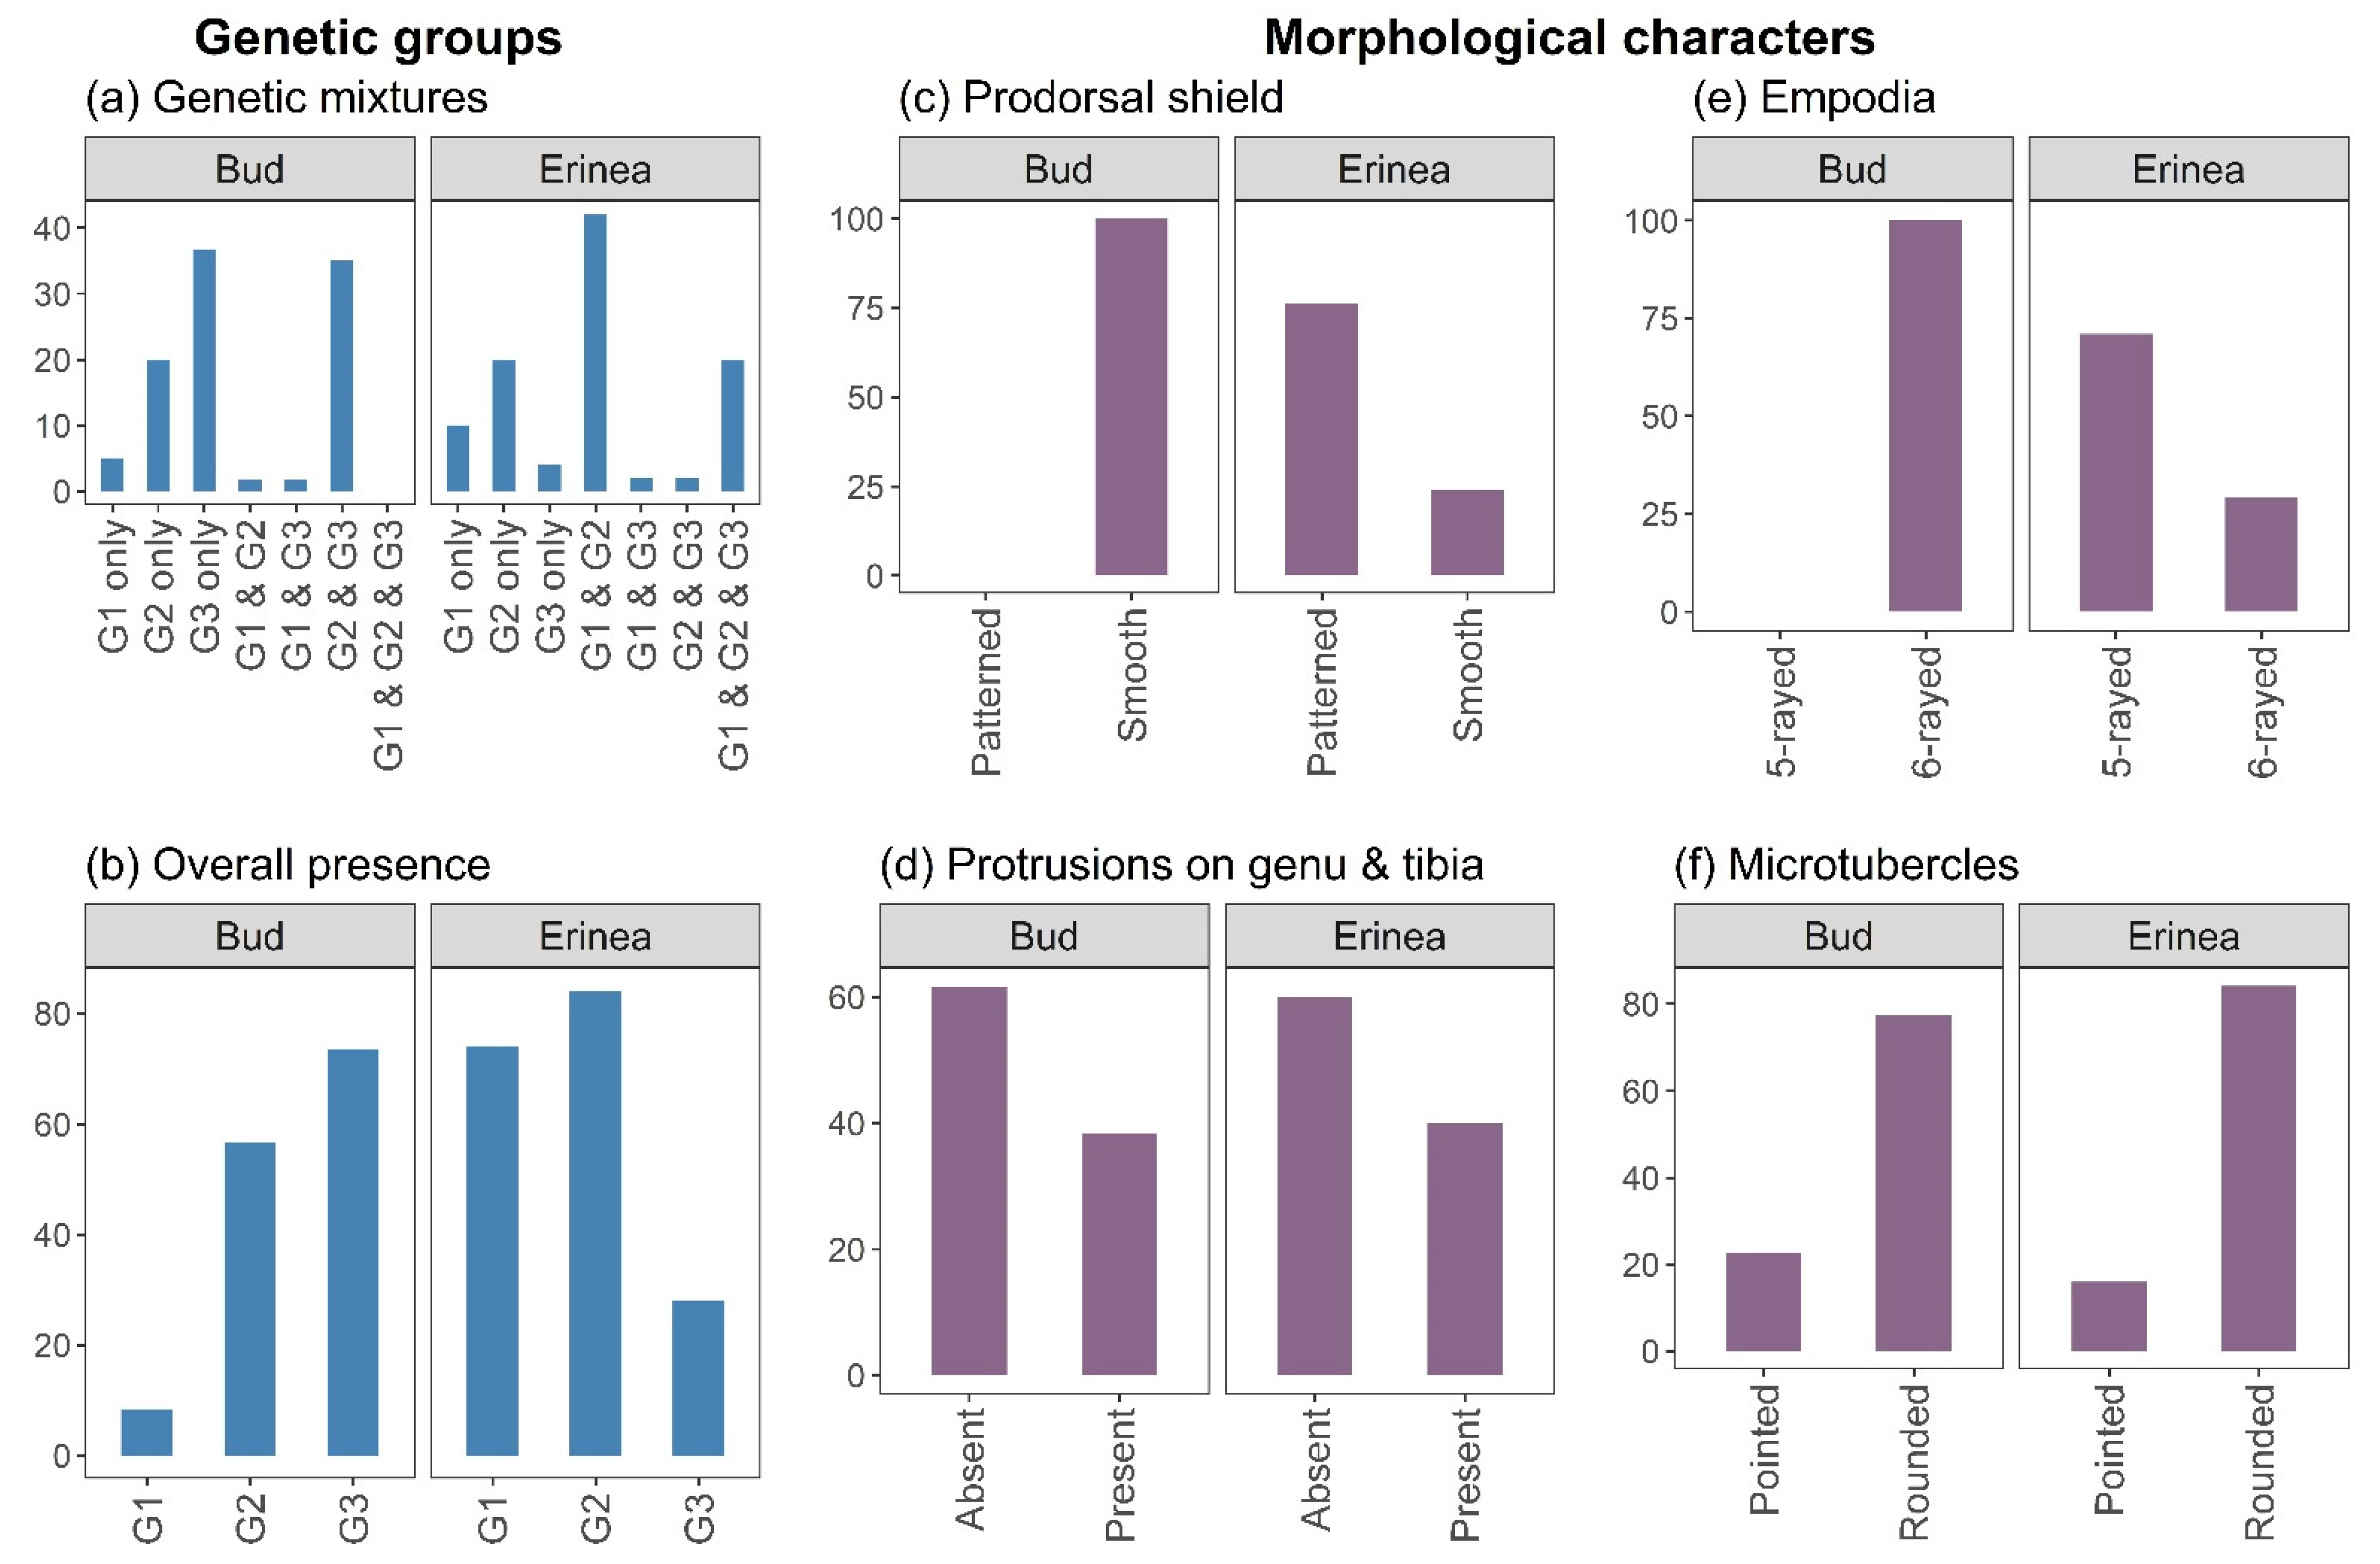
3.1.2. Association of Genetic Groups with Plant Symptoms
3.2. Morphological Analyses
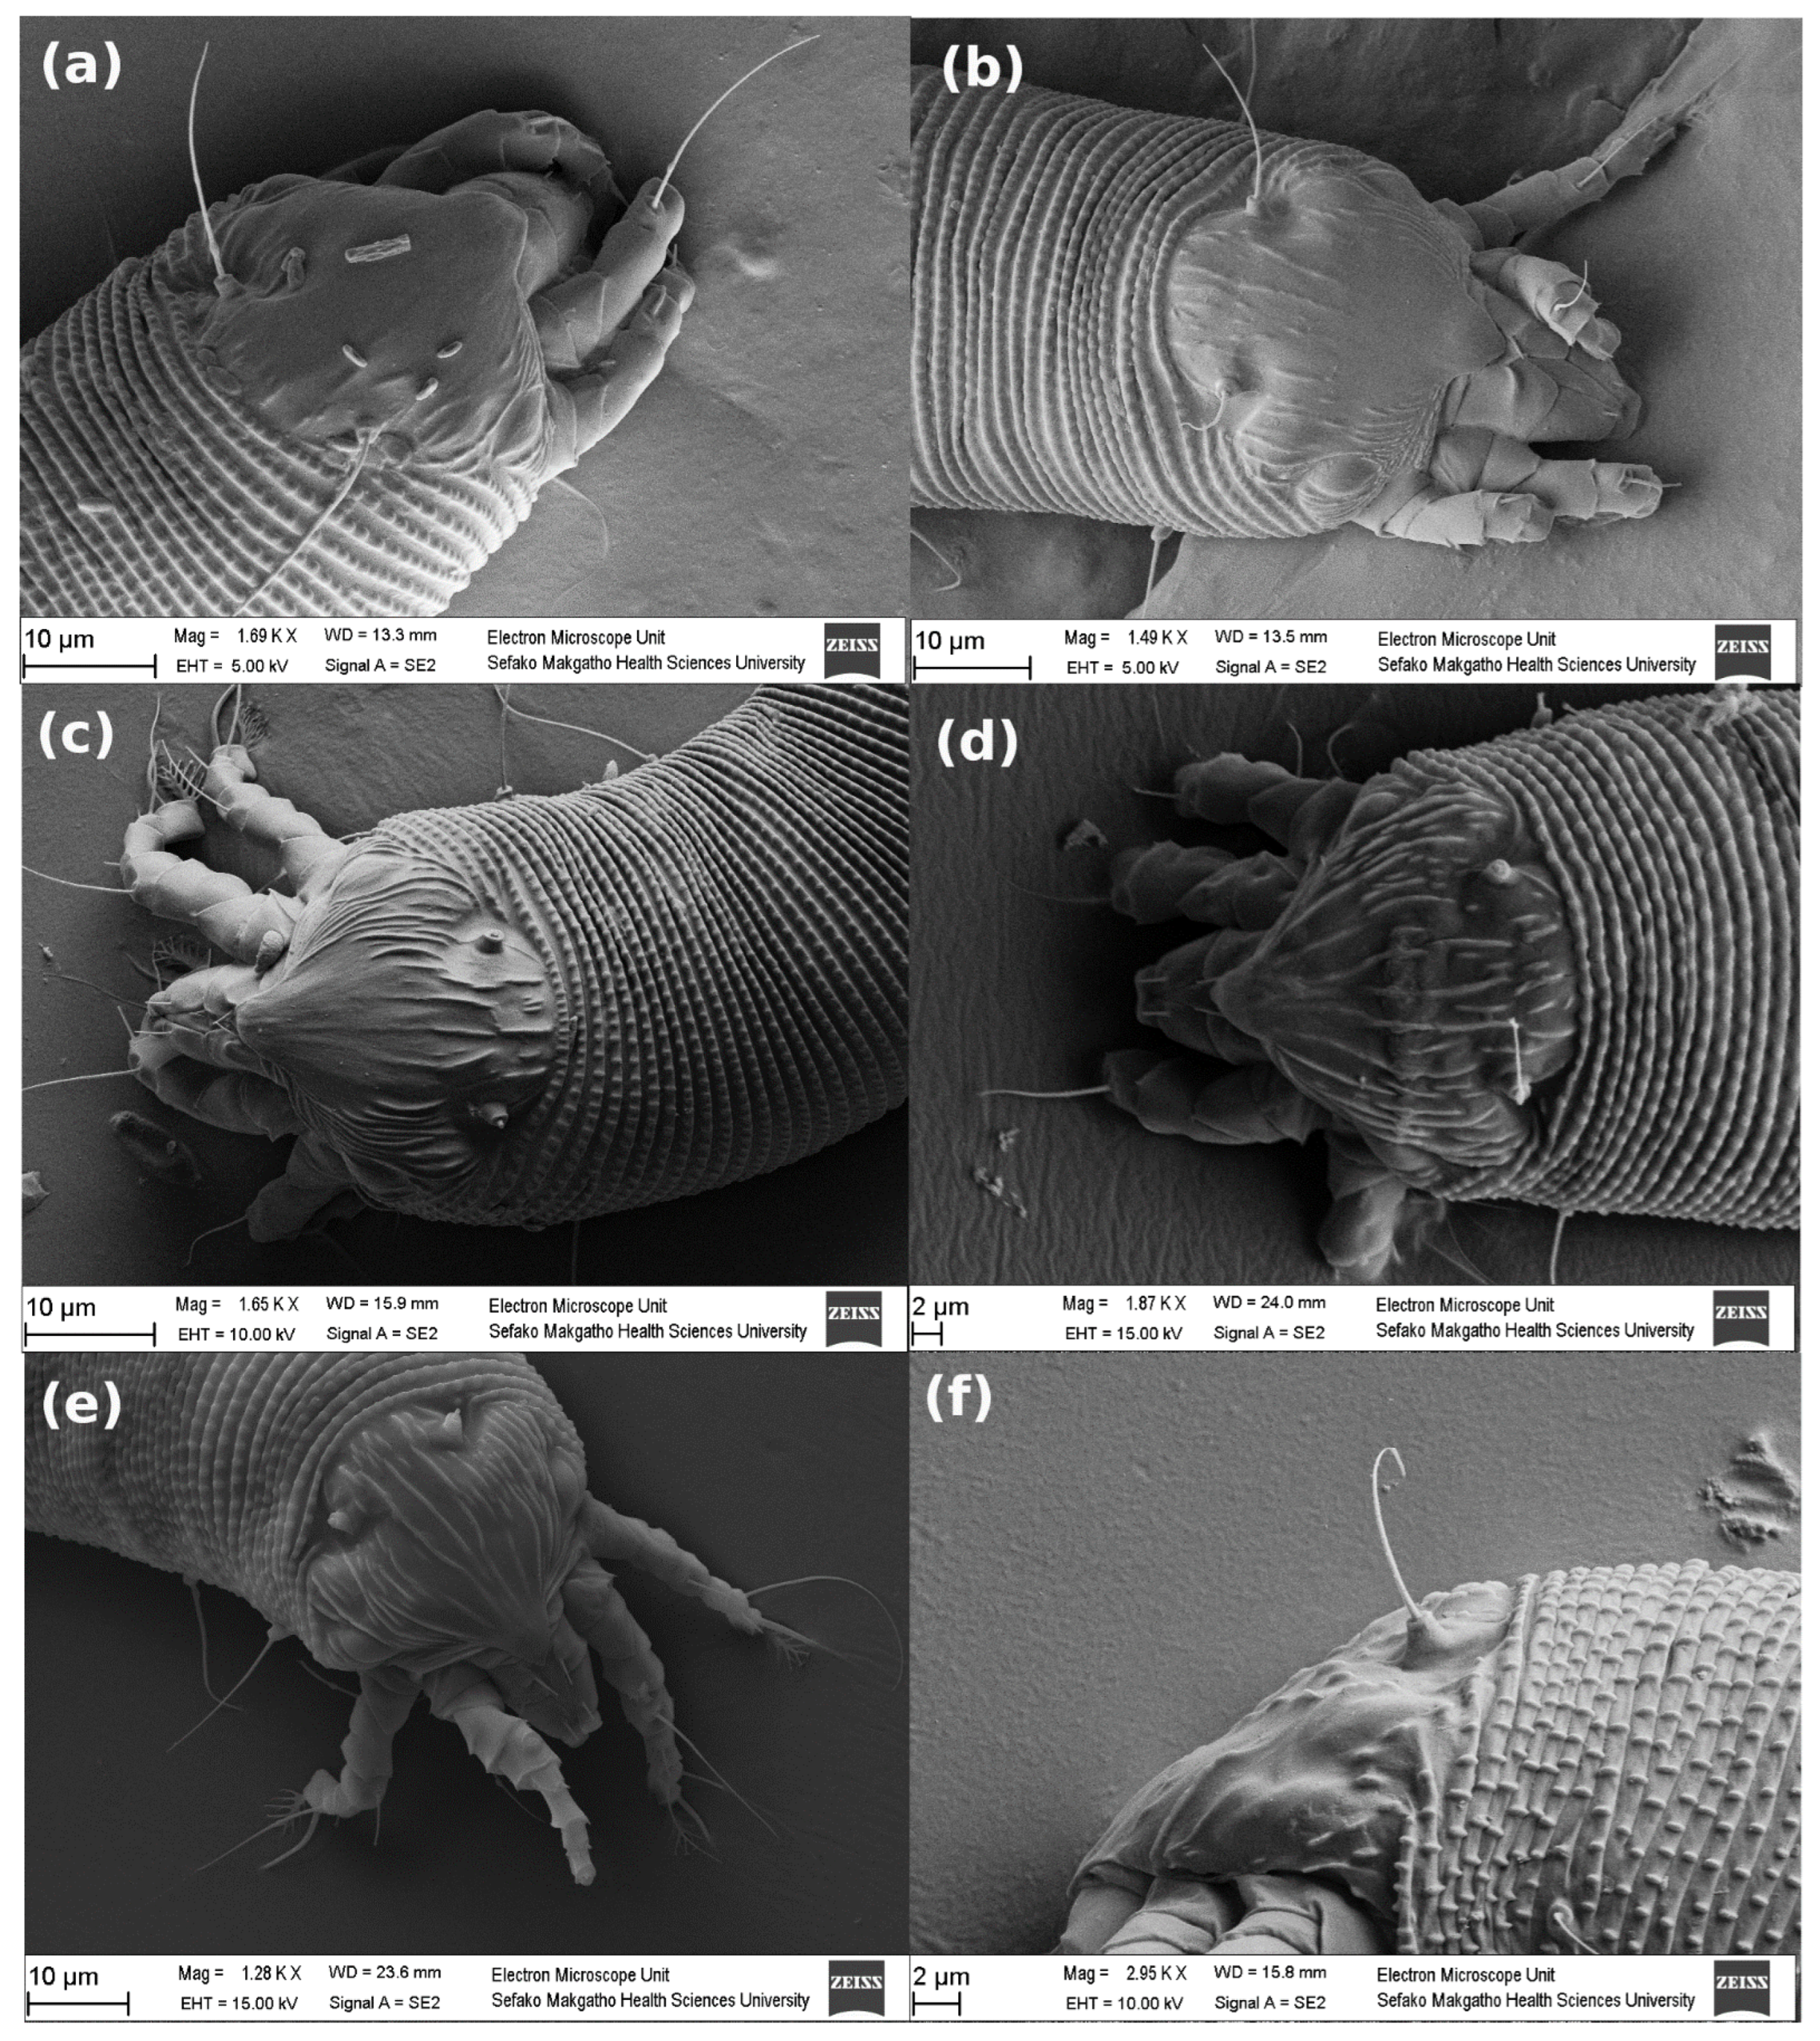
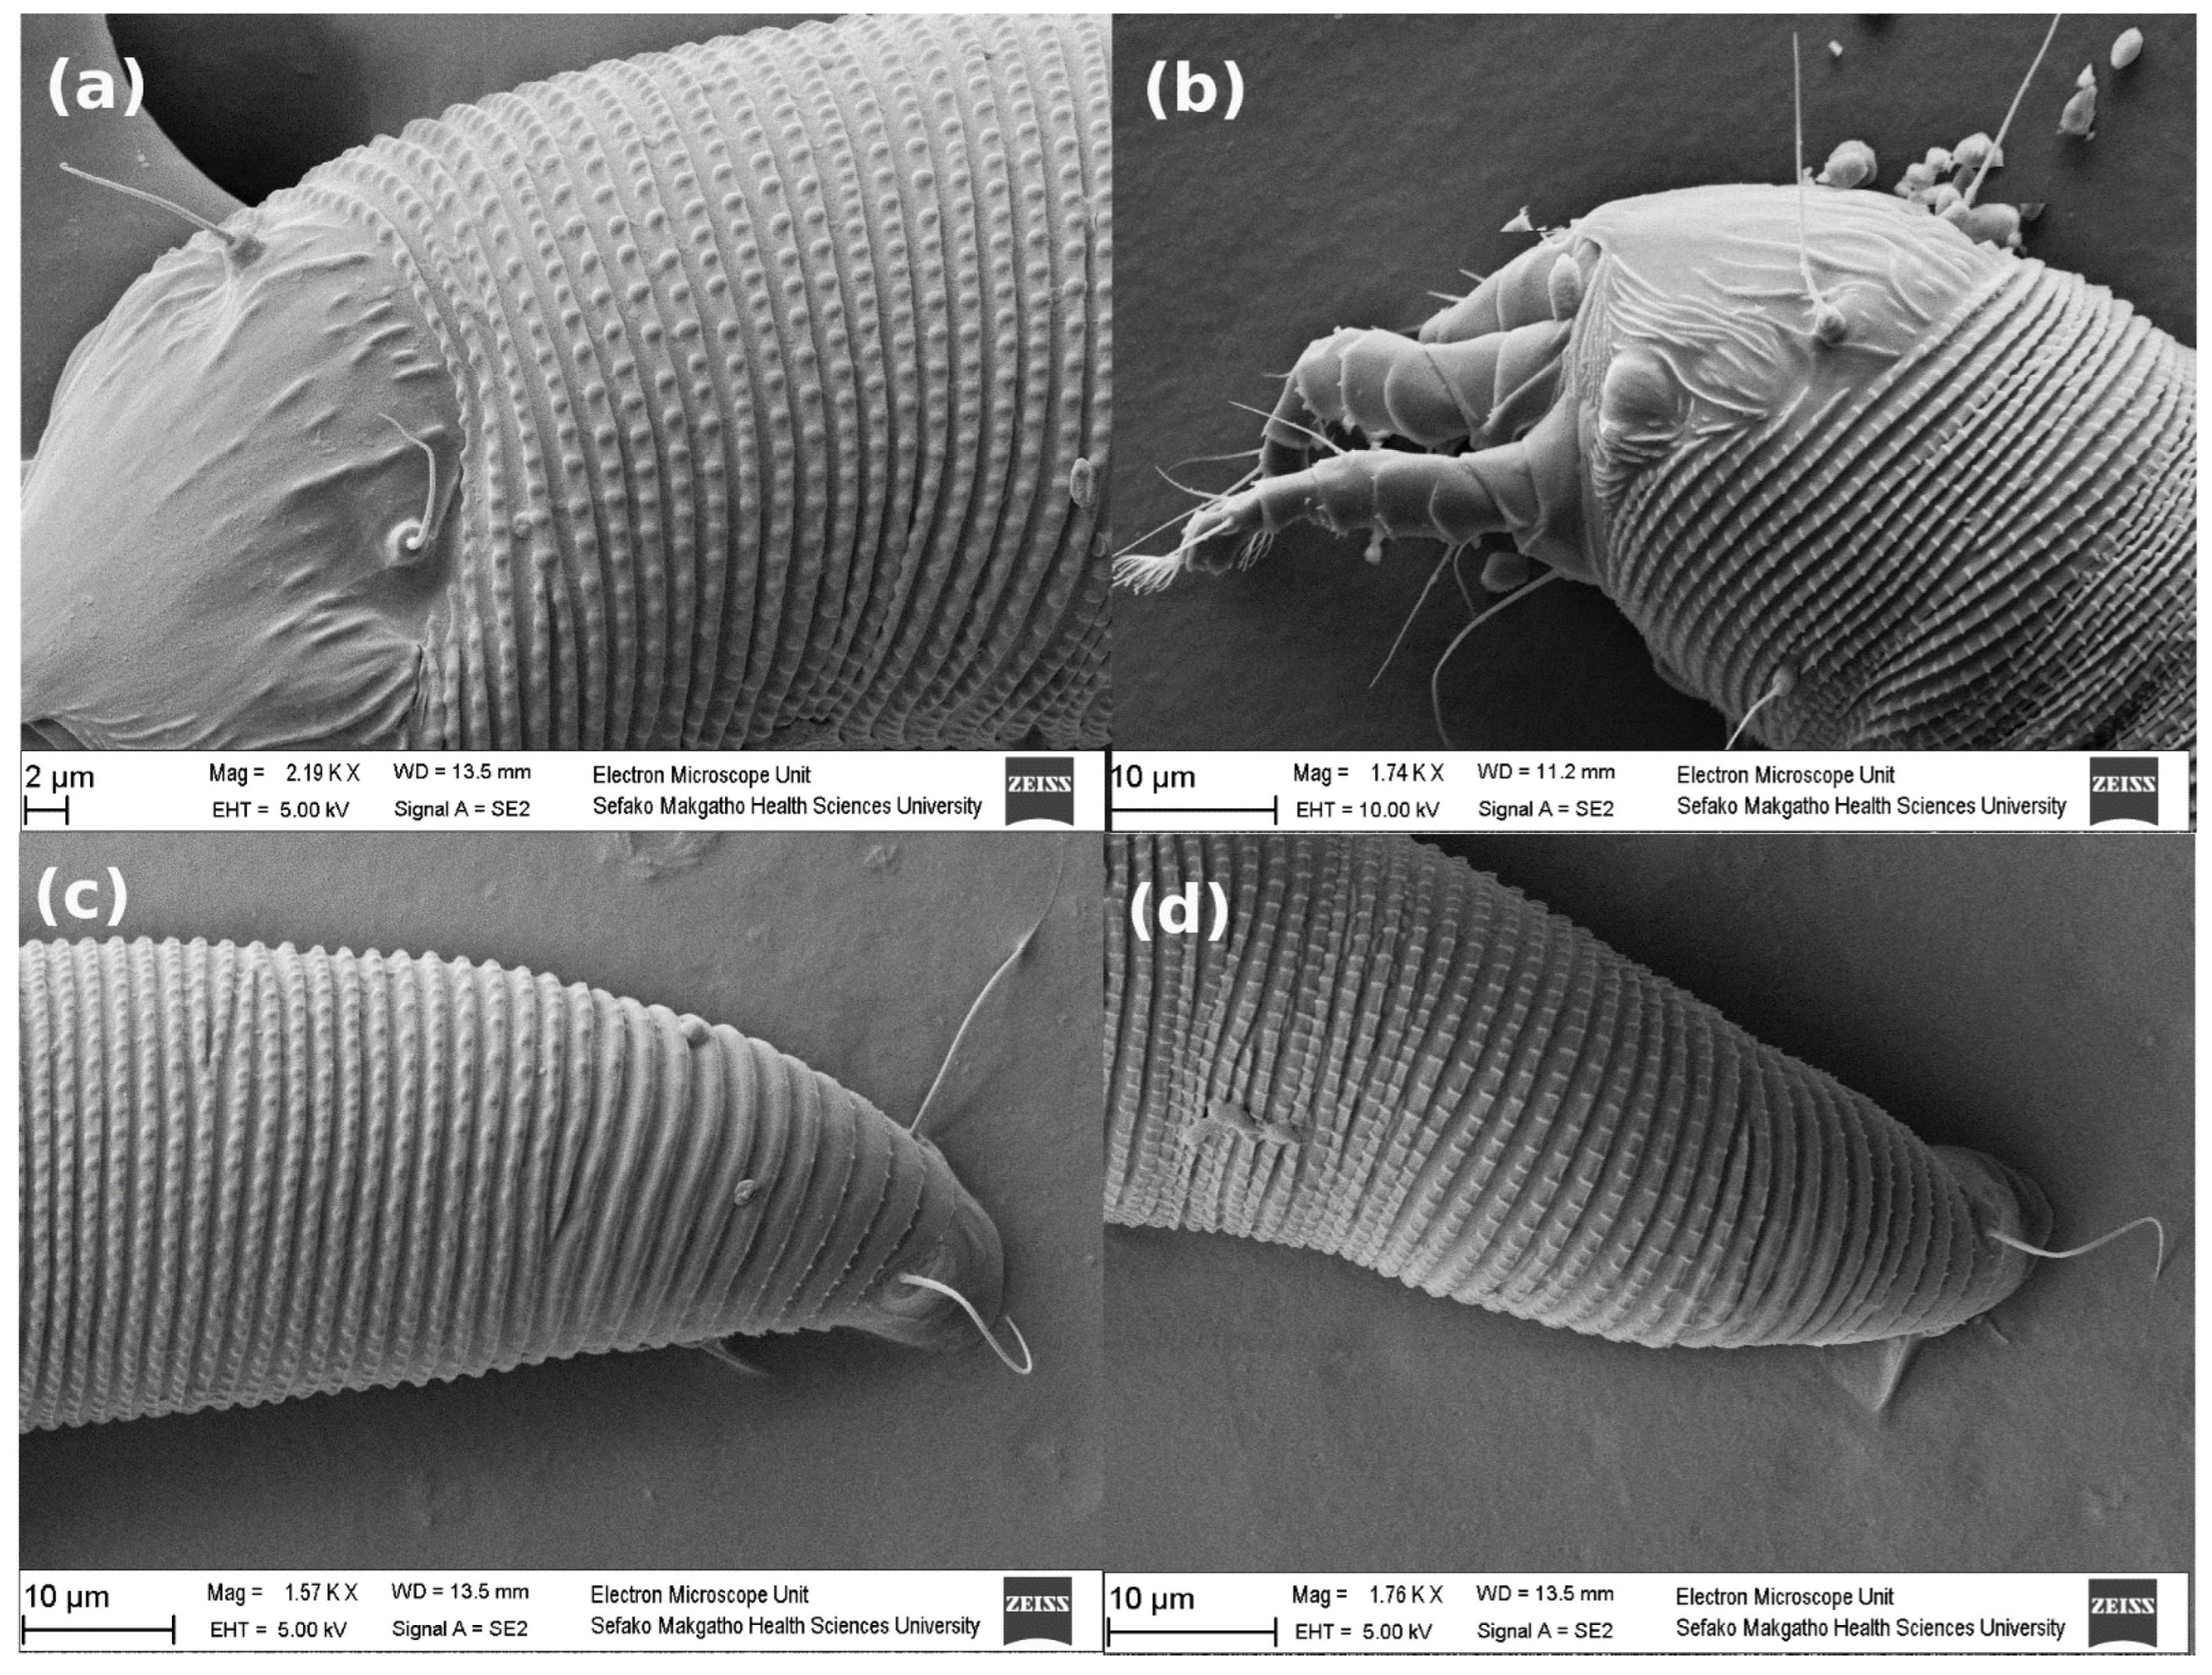
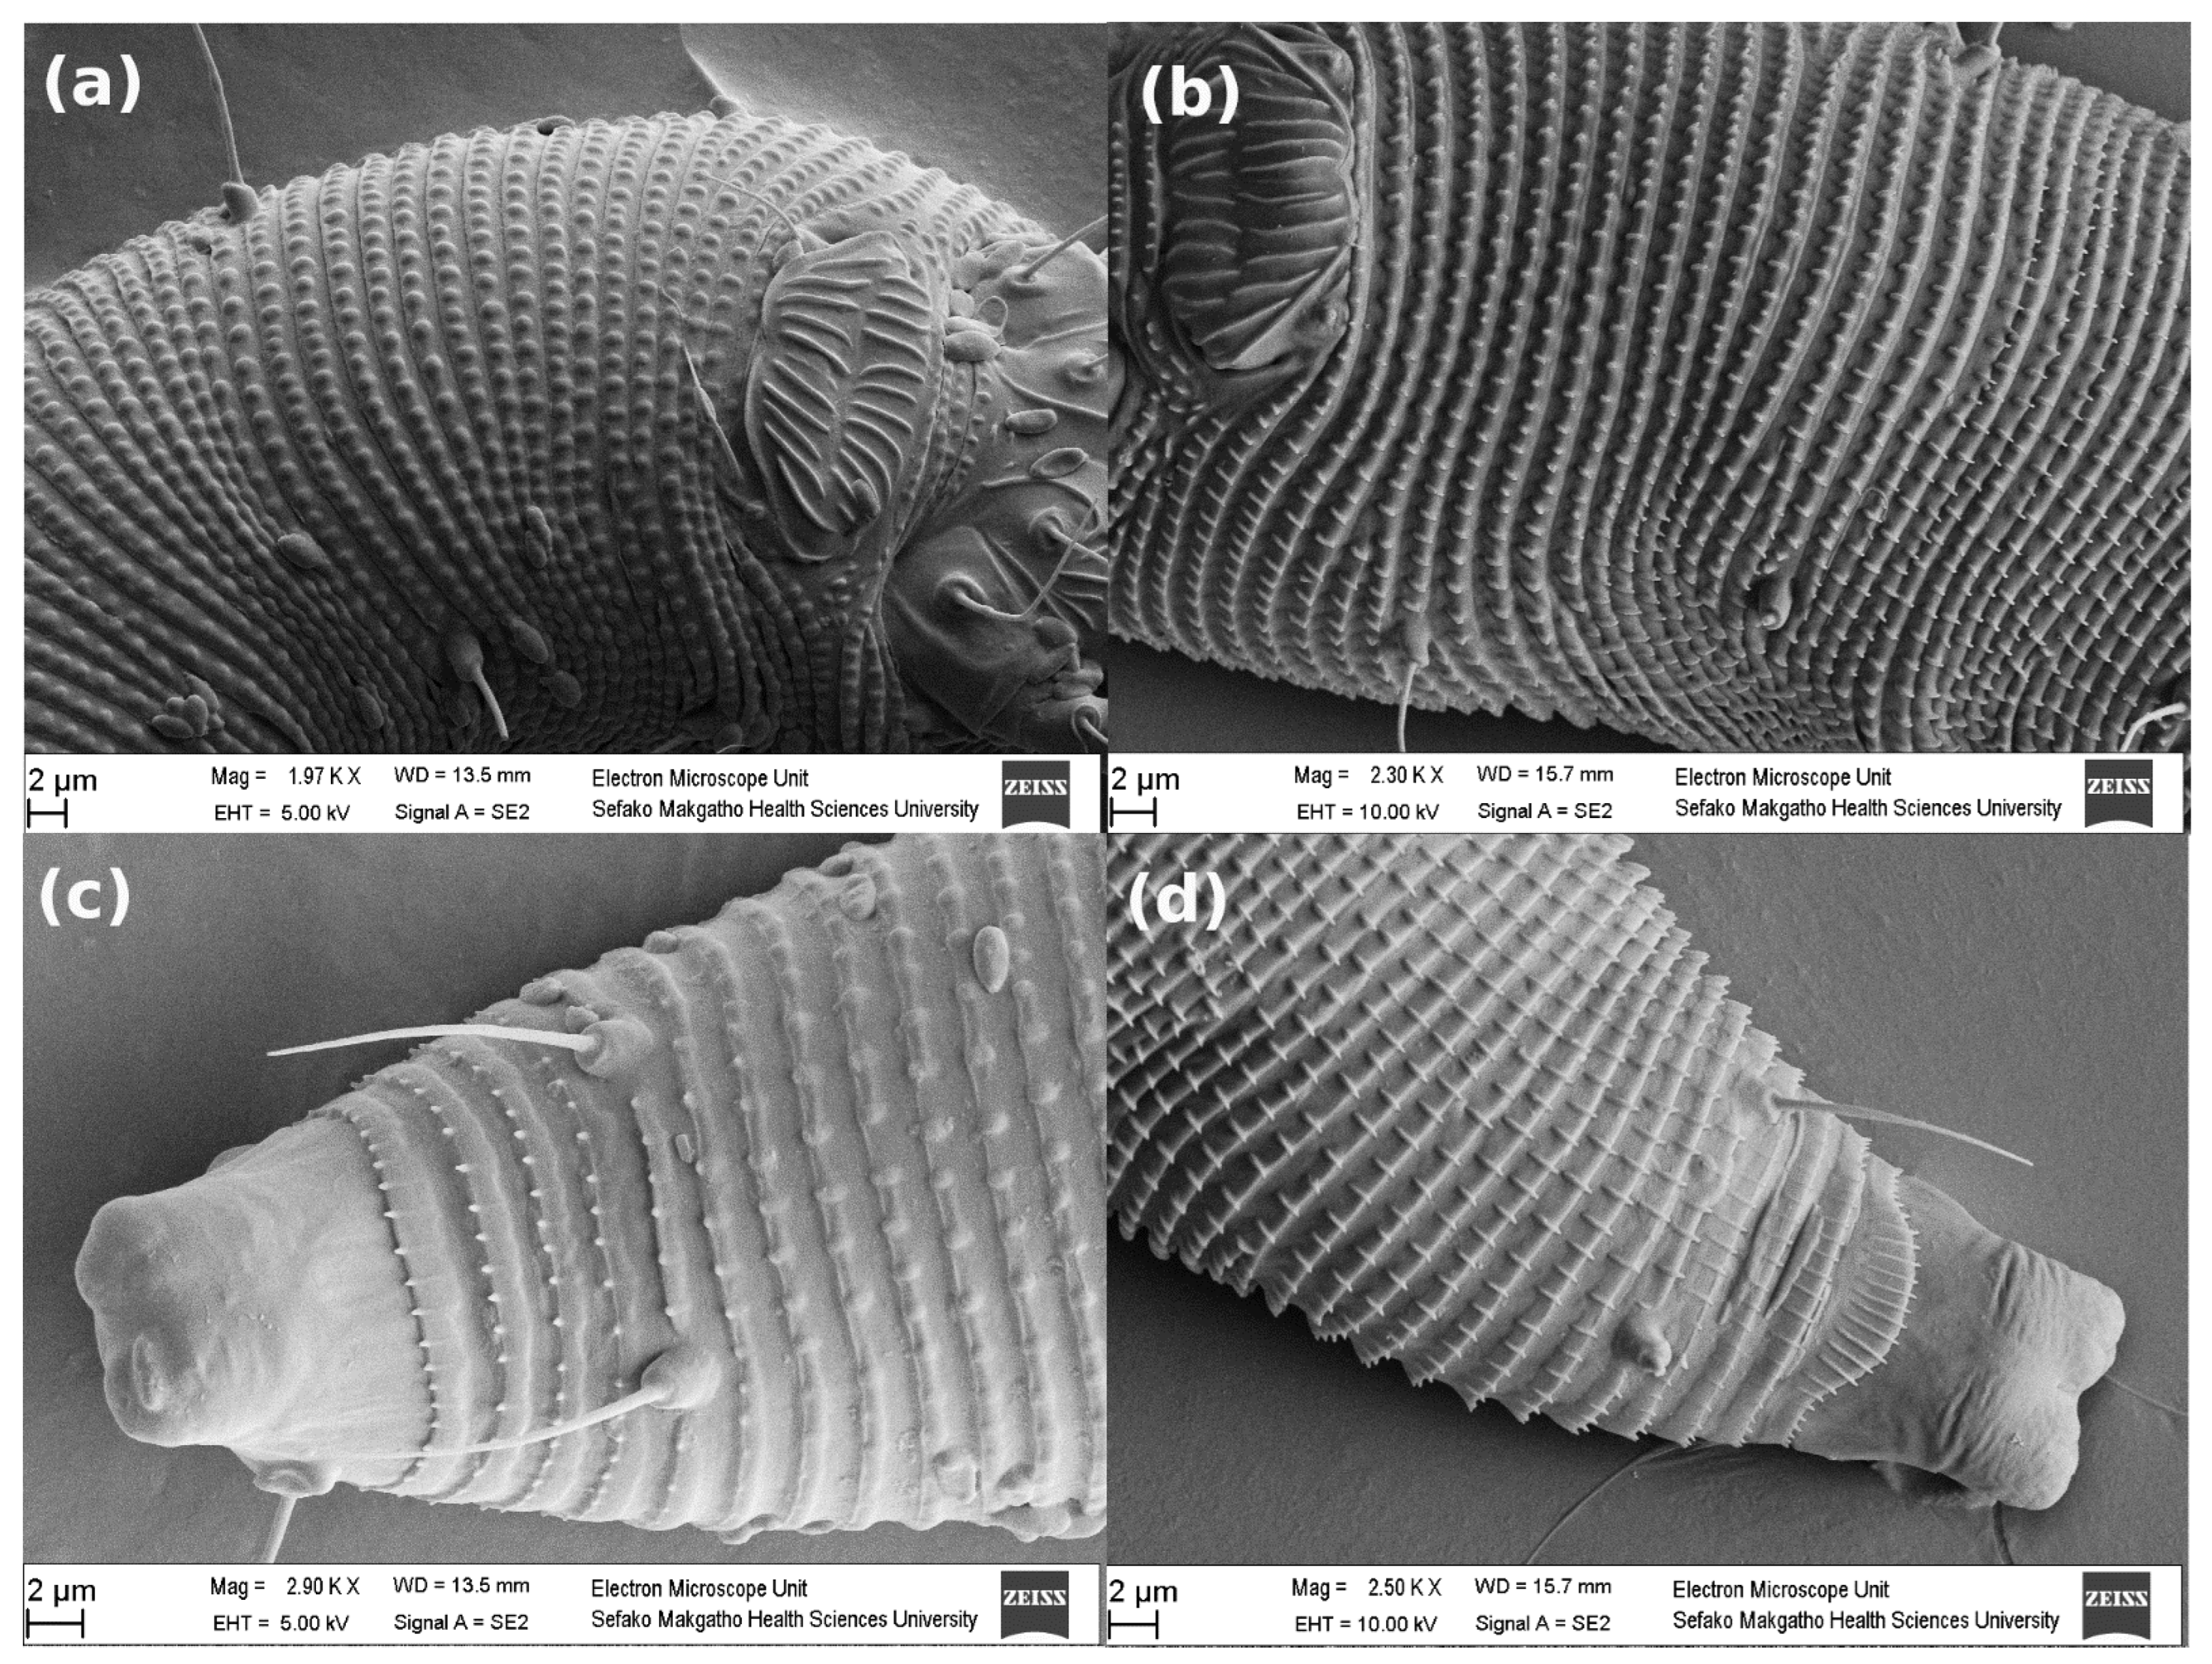
3.2.1. Whole Body
3.2.2. Prodorsal Shield
3.2.3. Coxal Area and Genitalia
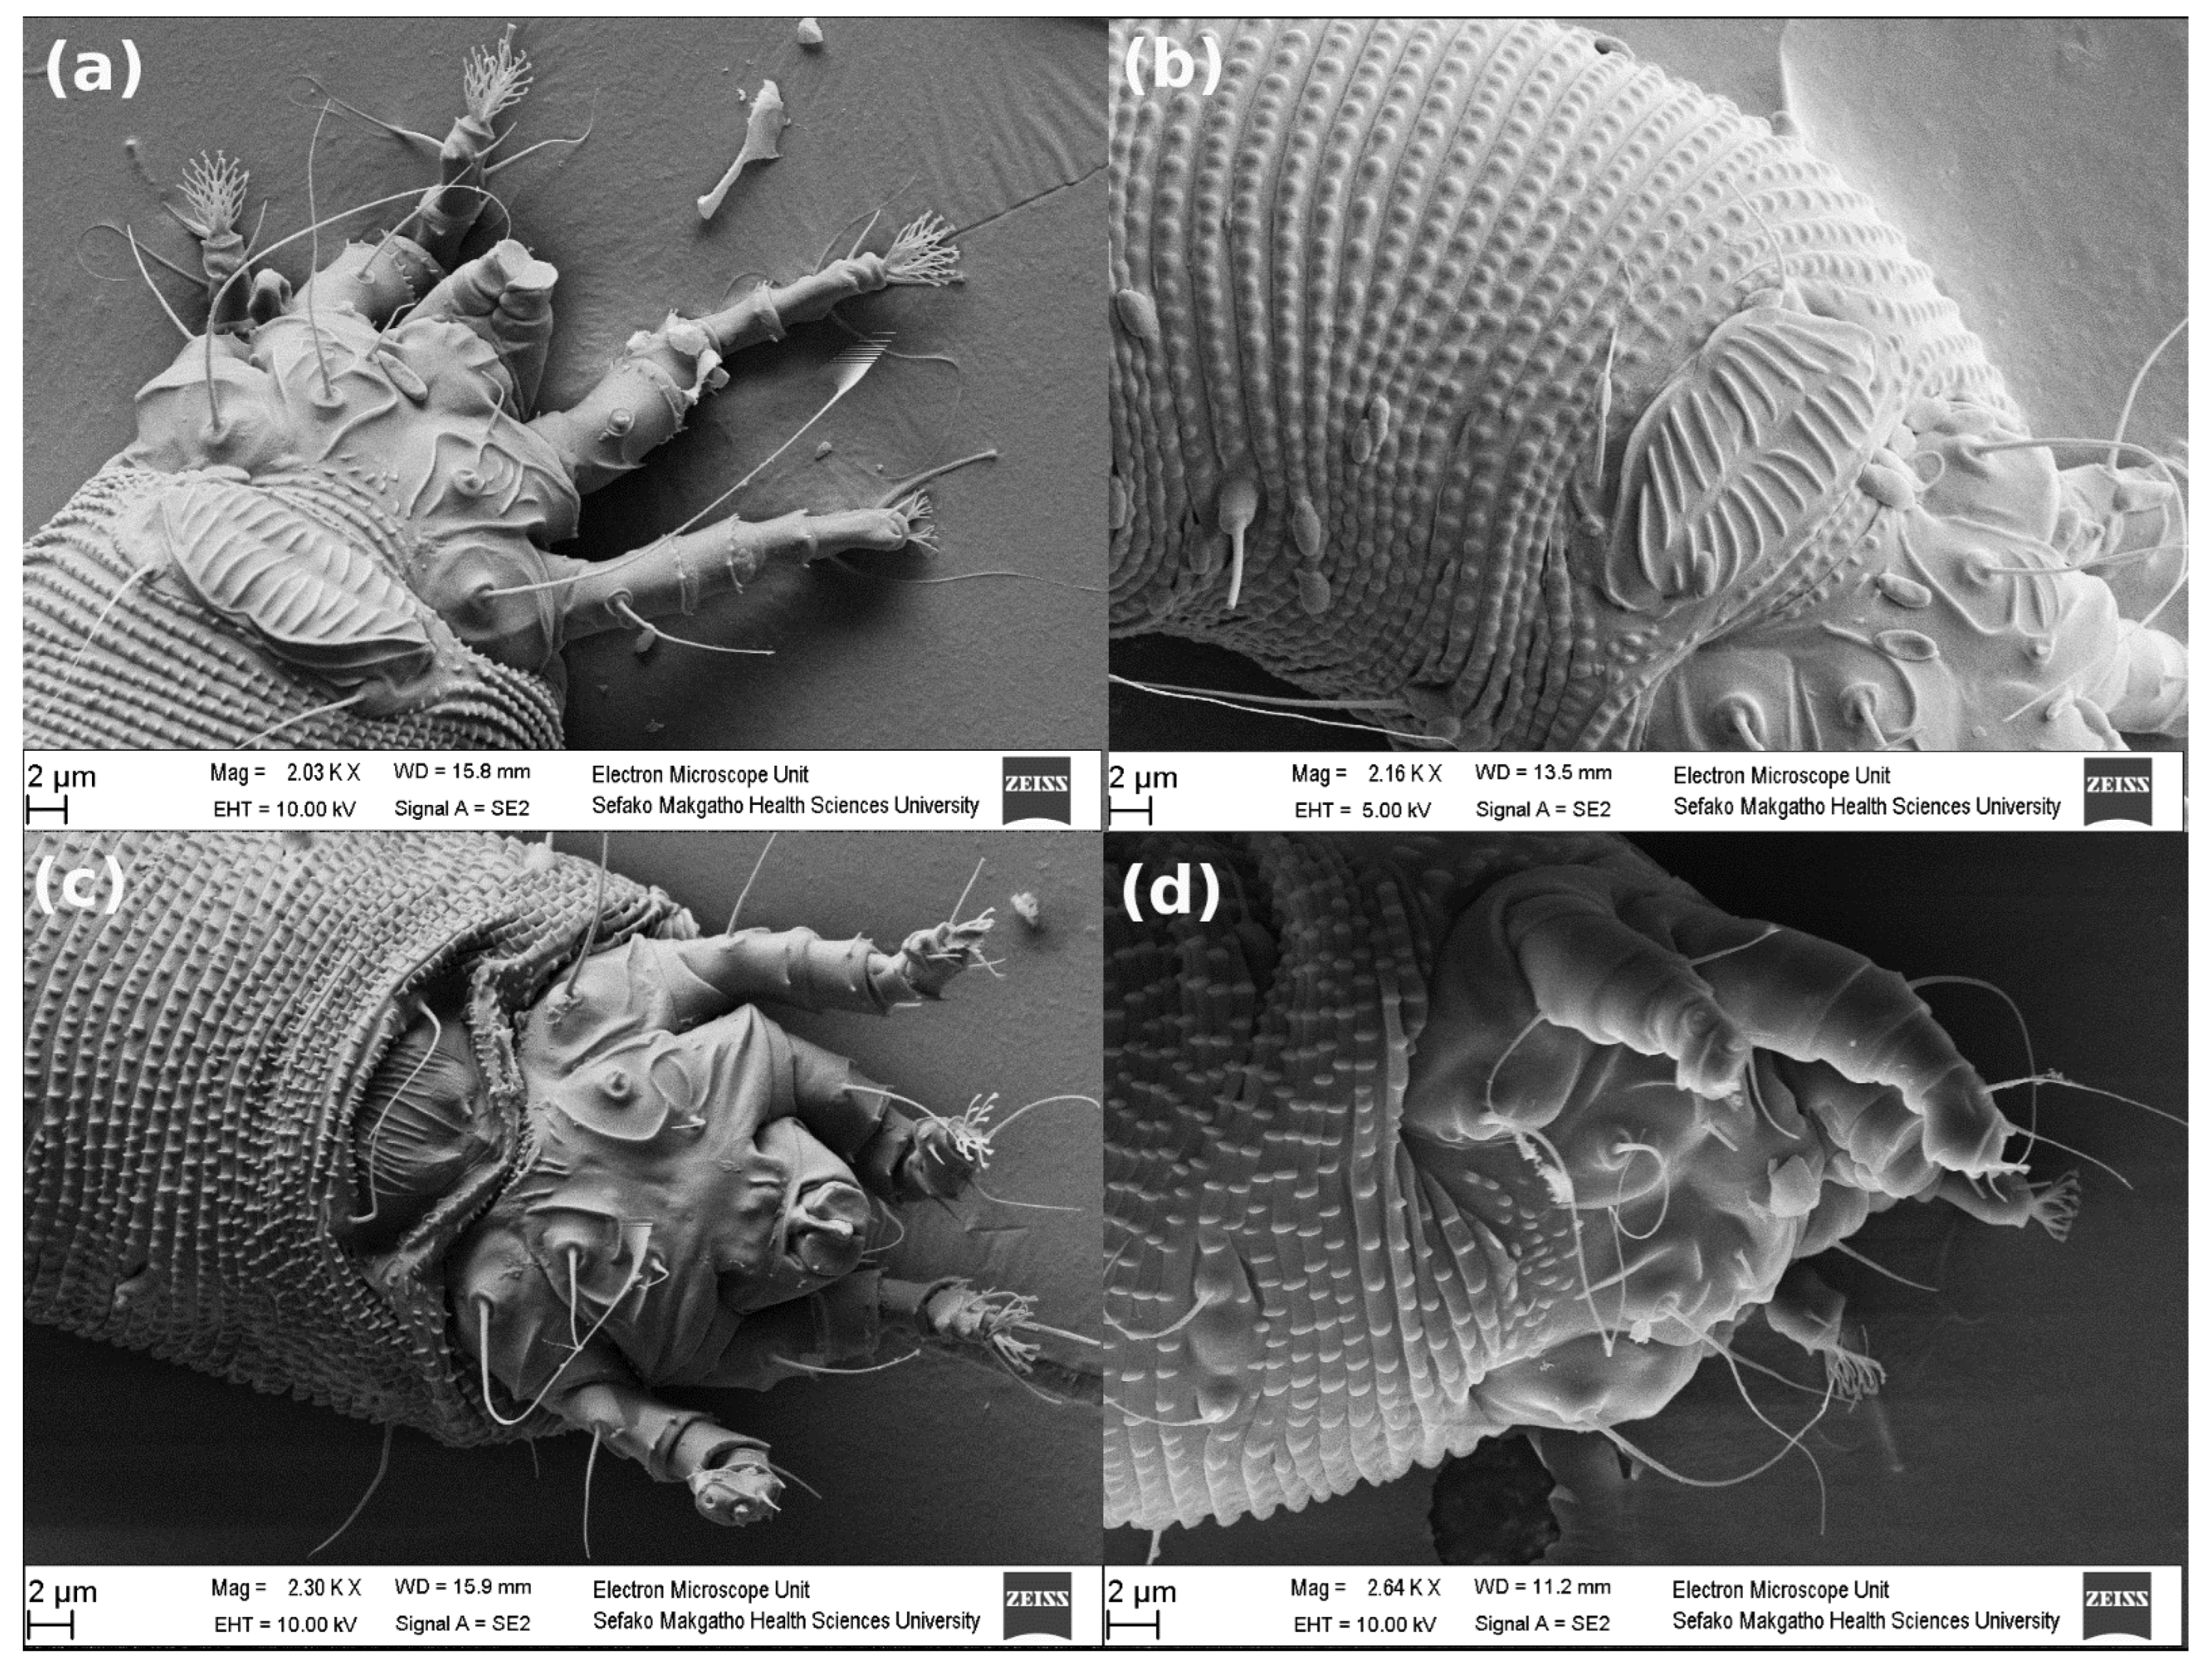
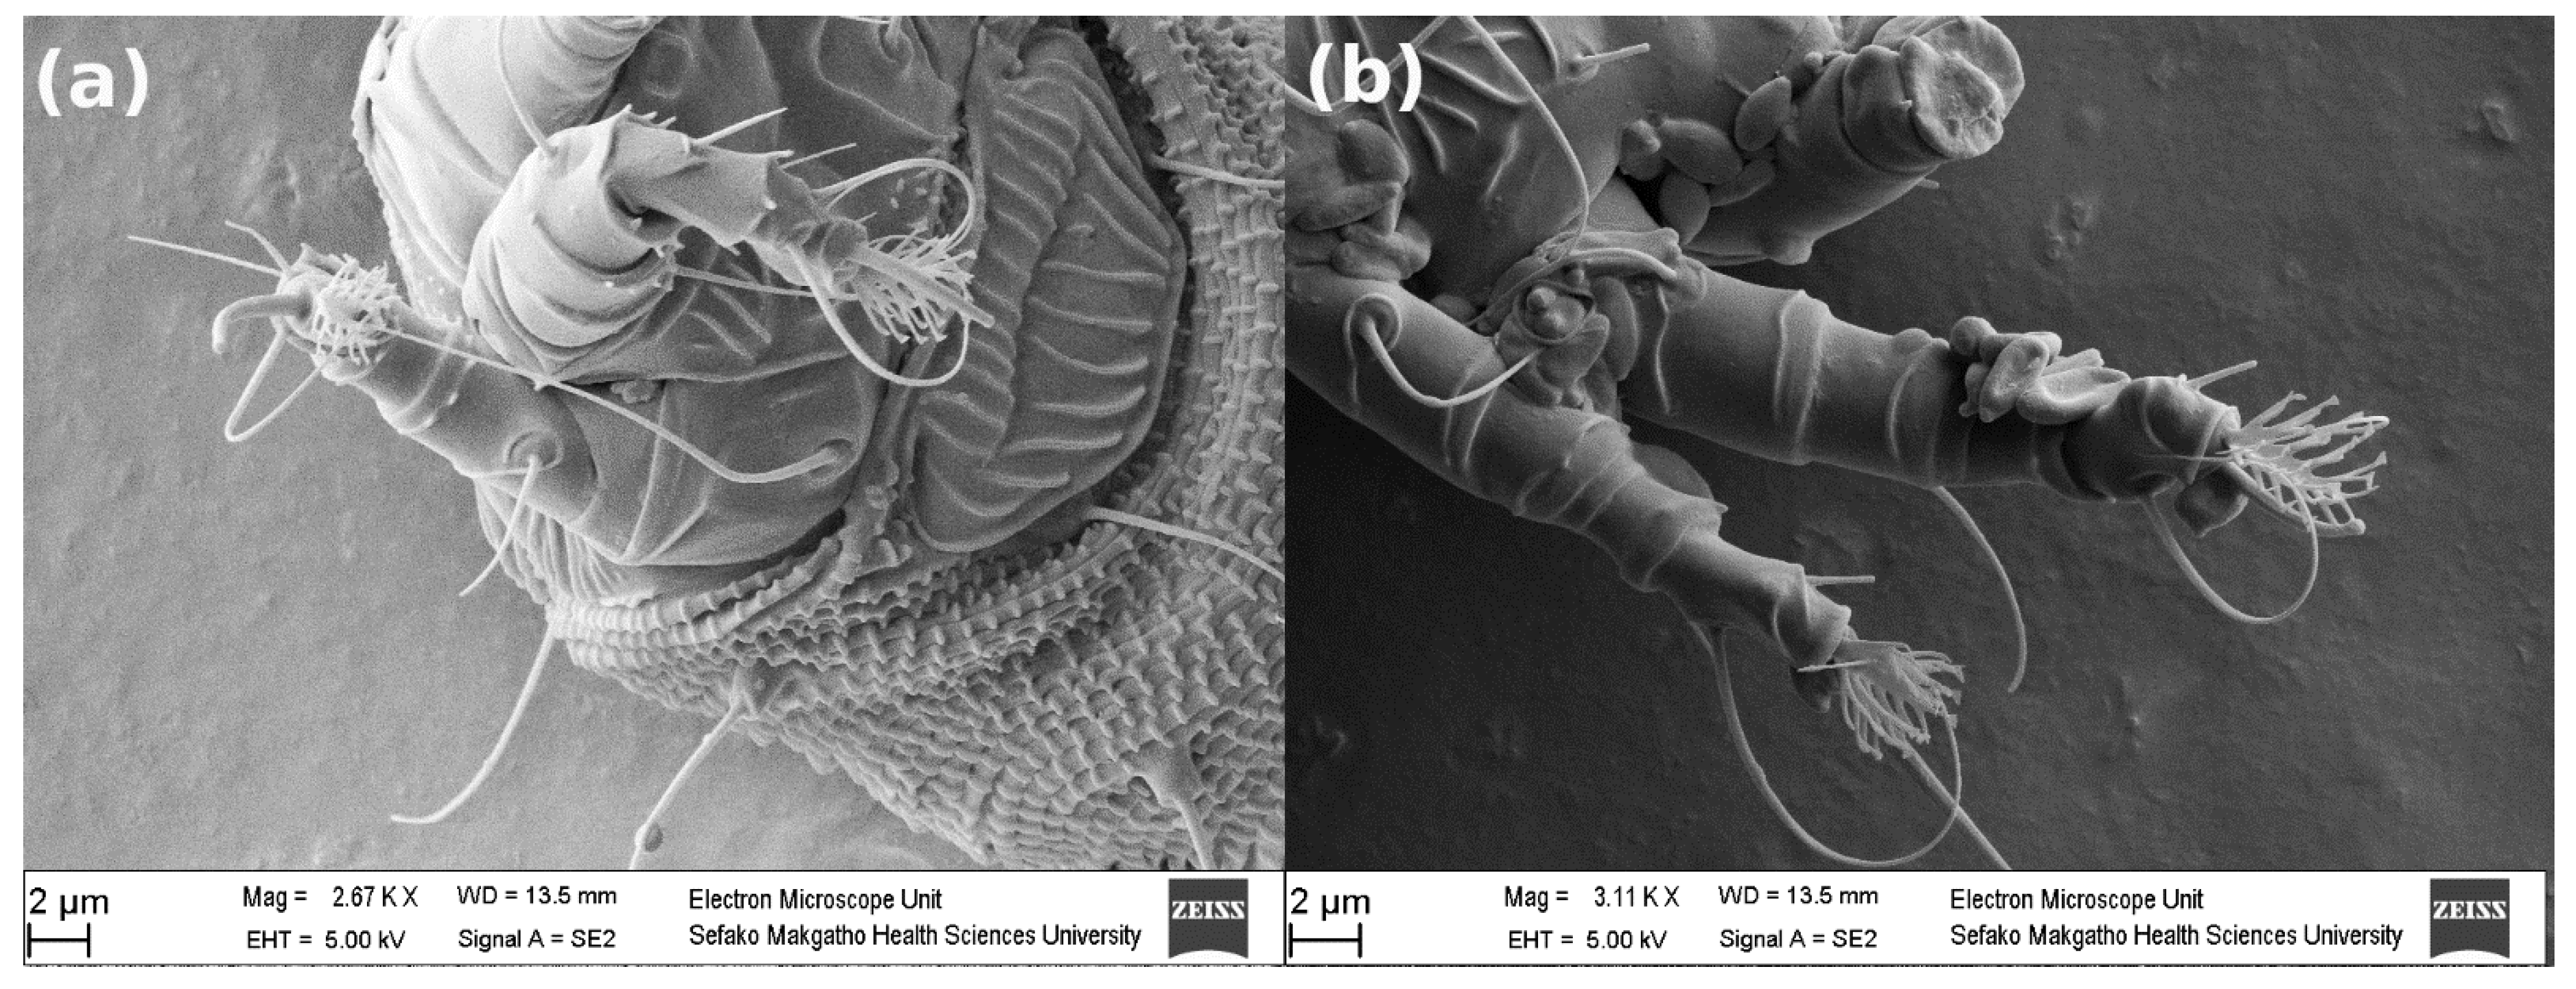
3.2.4. Legs
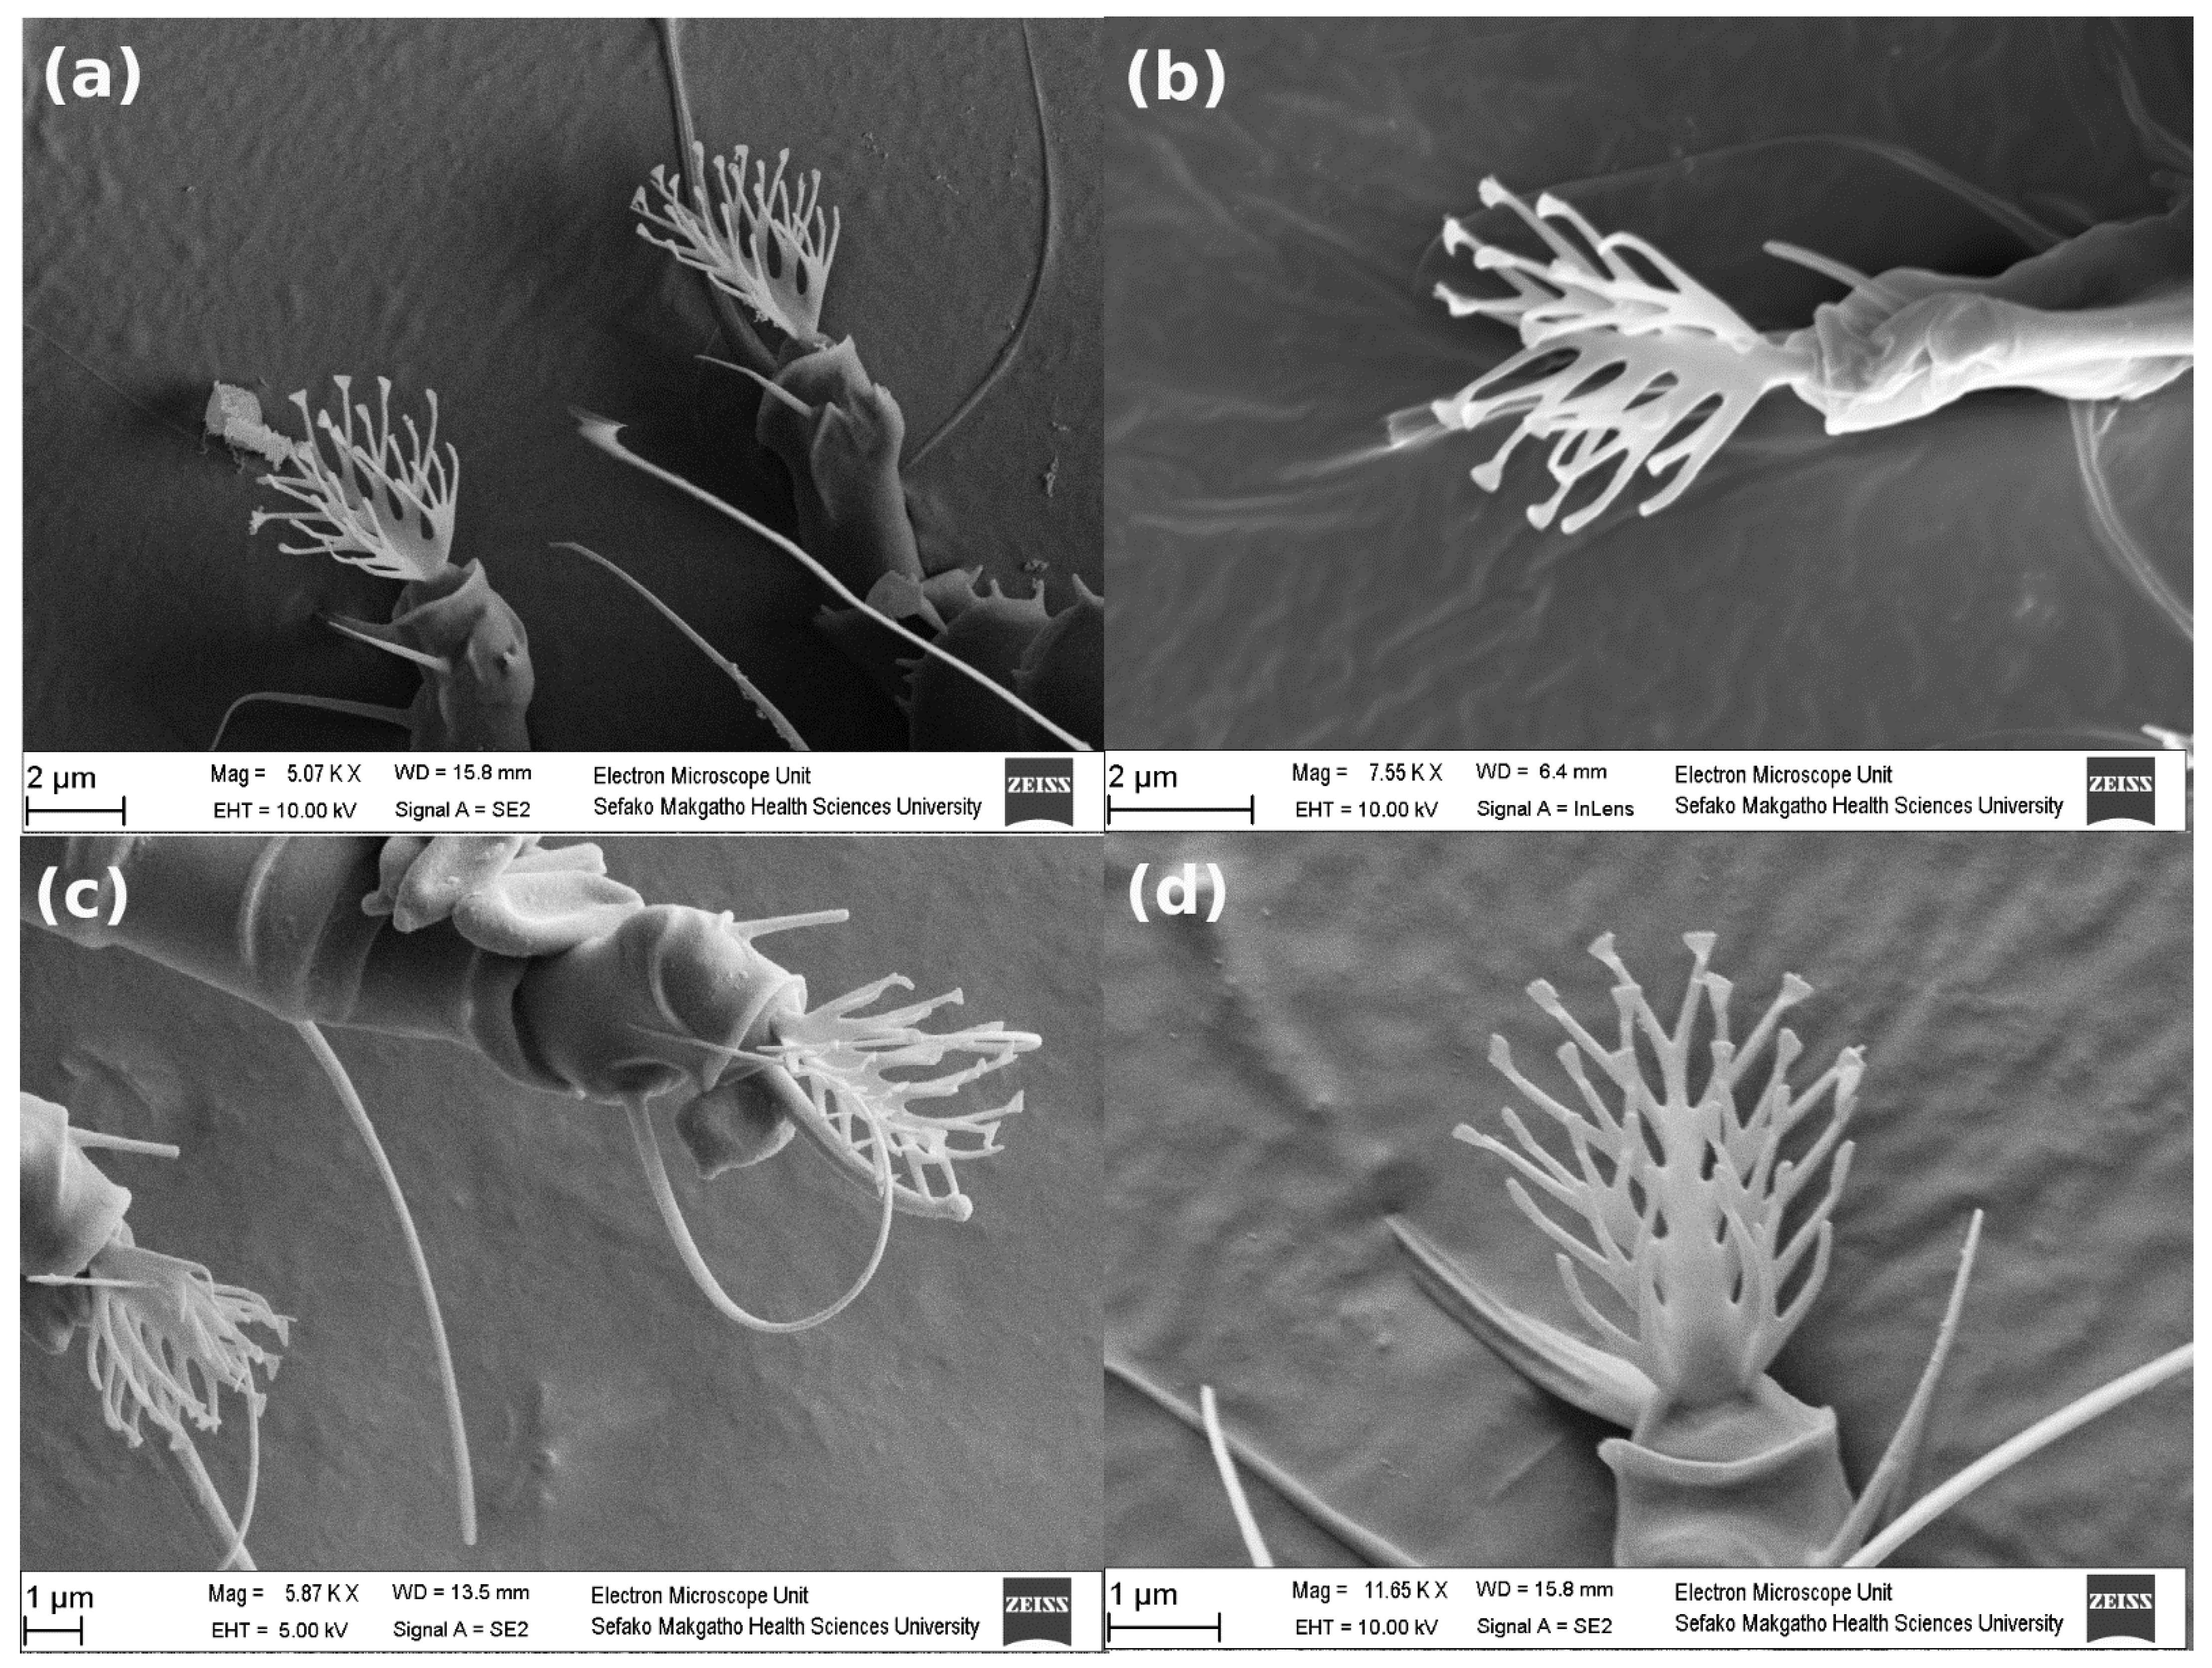
3.2.5. Empodia
3.2.6. Microtubercles
3.2.7. Associations of Characteristics
4. Discussion
4.1. Grapevine Eriophyoid Mites Likely Include Five Distinct Species
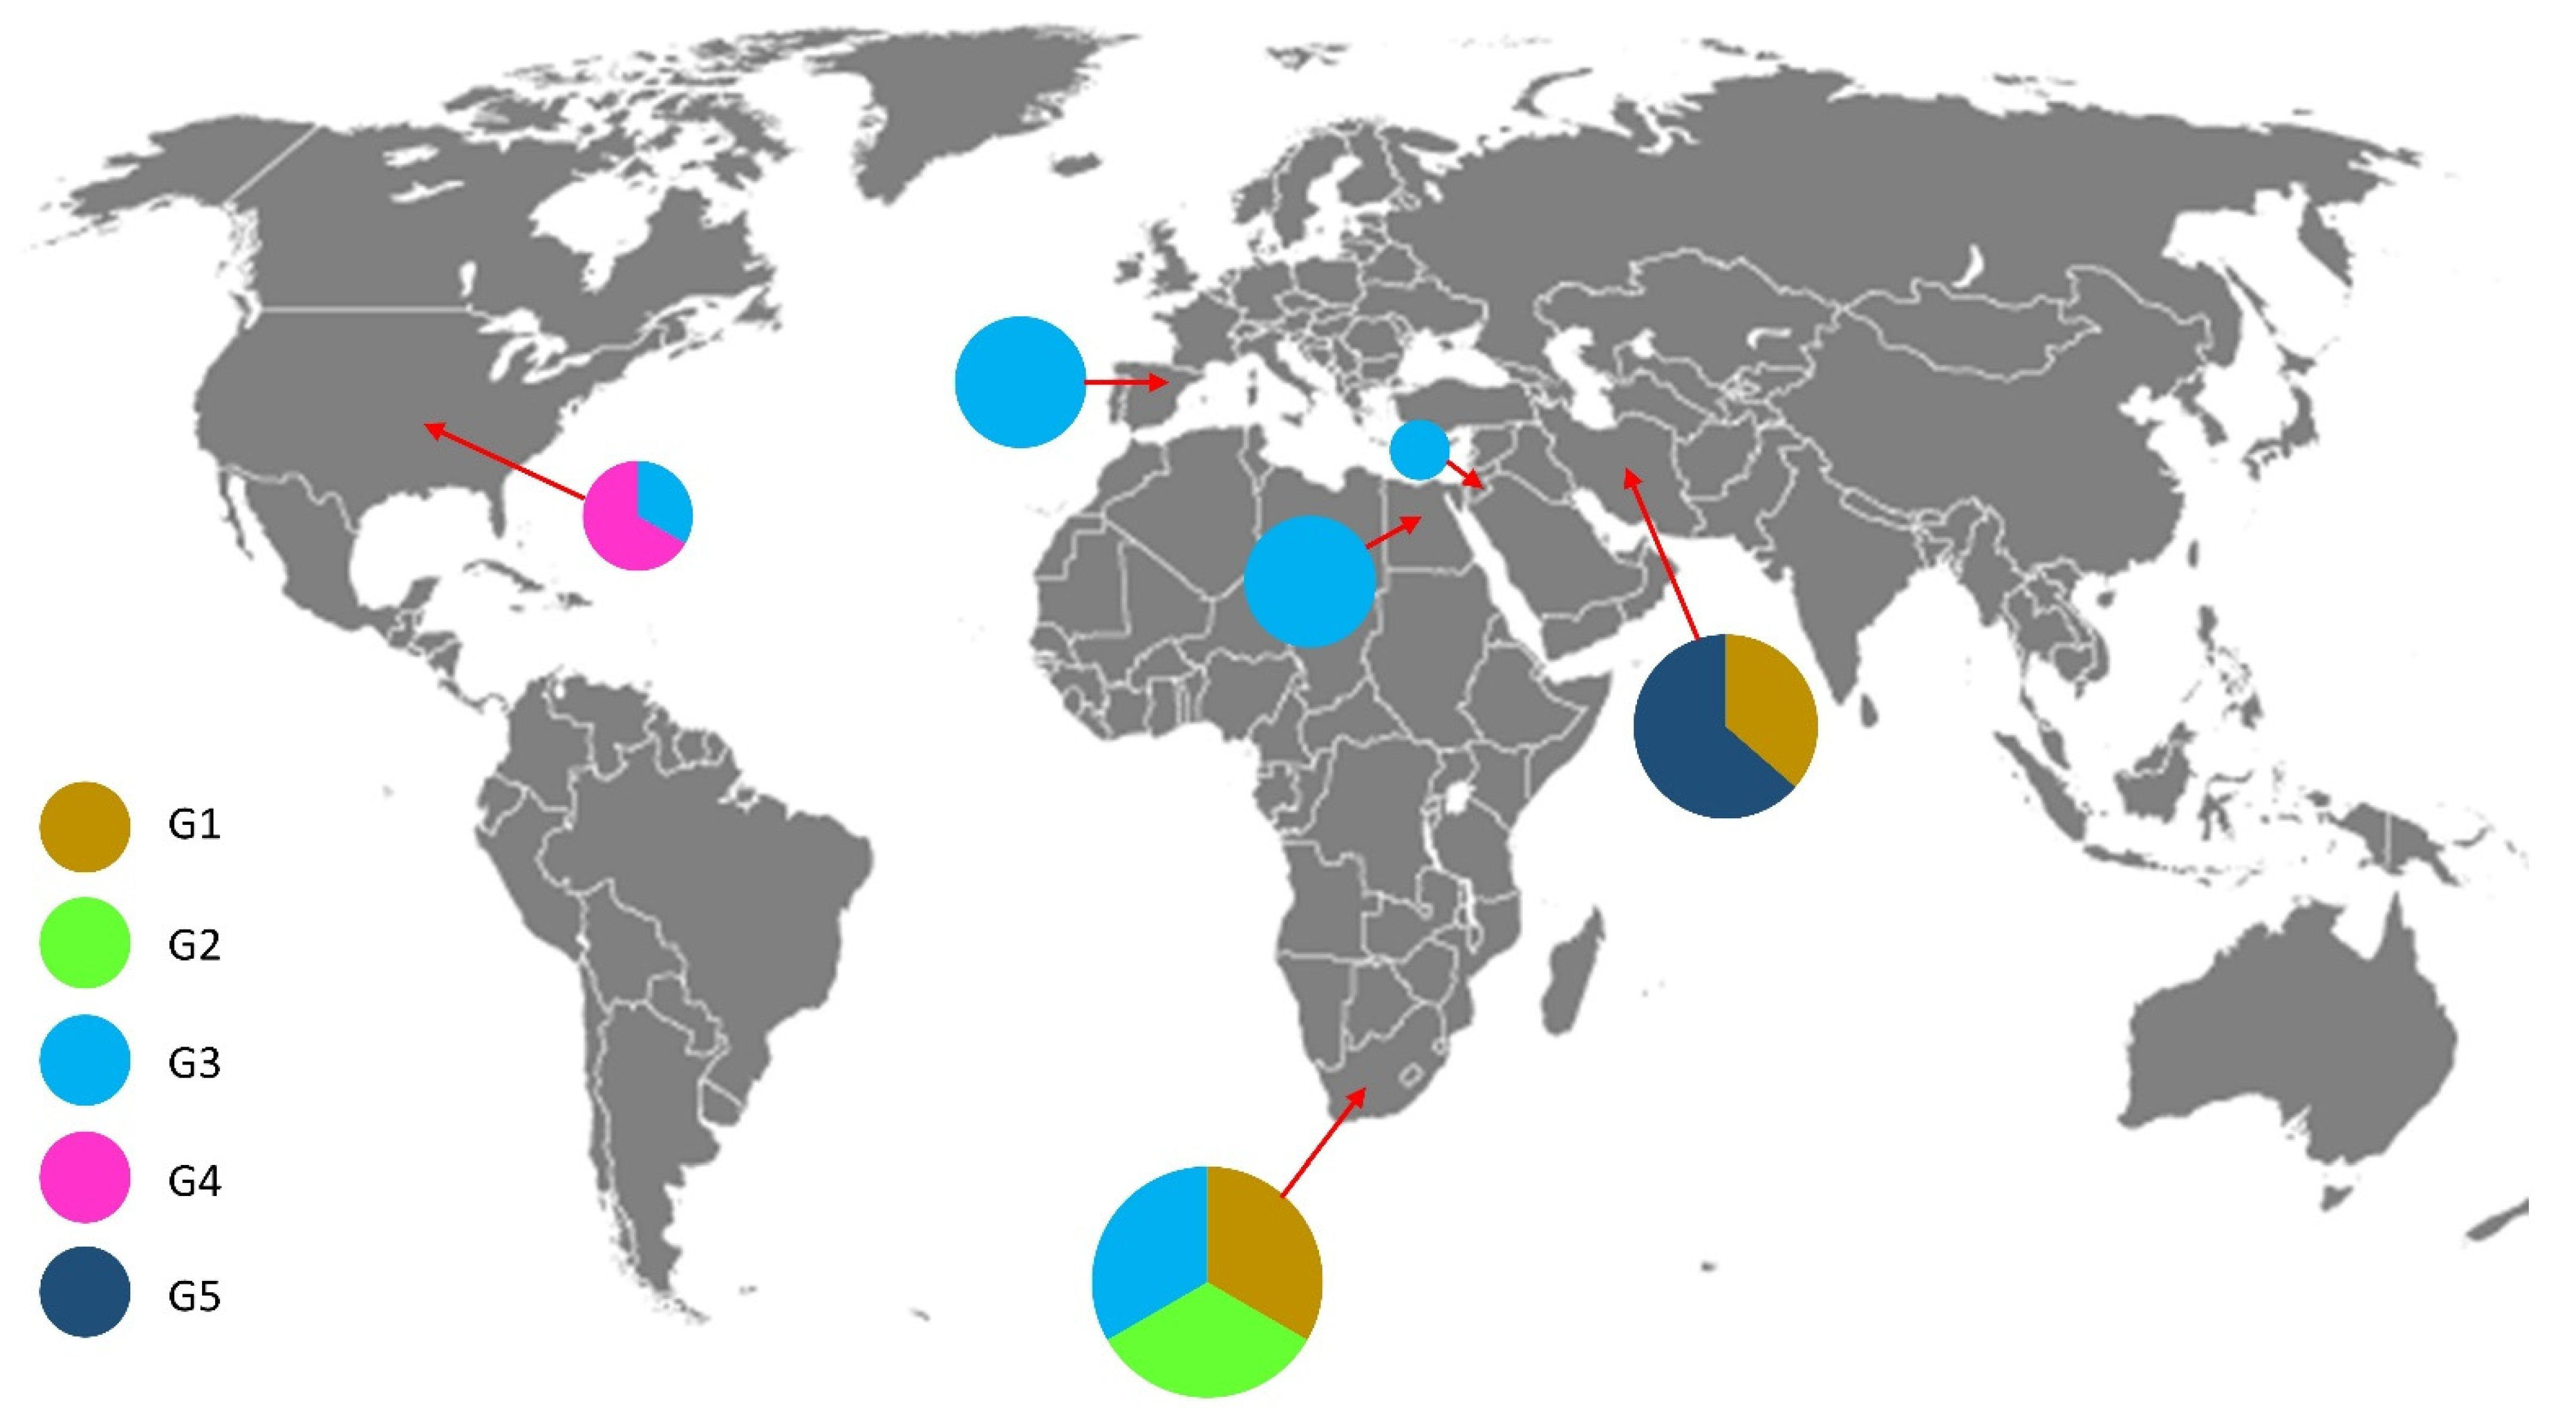
4.2. Phylogeography of Grapevine Colomerus Mites
4.3. LT-SEM Enhances Observable Morphological Detail
4.3.1. Prodorsal Shield
4.3.2. Coxal Area and Genitalia
4.3.3. Legs and Empodia
4.3.4. Microtubercles
5. Conclusions
Supplementary Materials
Author Contributions
Funding
Institutional Review Board Statement
Informed Consent Statement
Data Availability Statement
Acknowledgments
Conflicts of Interest
References
- Duso, C.; De Lillo, E. 3.2.5 Grape. In World Crop Pests; Elsevier: Amsterdam, The Netherlands, 1996; Volume 6, pp. 571–582. ISBN 9780444886286. [Google Scholar]
- Smith, L.M.; Stafford, E.M. The Bud Mite and the Erineum Mite of Grapes. Hilgardia 1948, 18, 317–334. [Google Scholar] [CrossRef]
- Keifer, H.H. Eriophyid Studies XIV. Bull. Calif. Dep. Agric. 1944, 33, 1–24. [Google Scholar]
- Craemer, C.; Saccaggi, D.L. Frequent Quarantine Interception in South Africa of Grapevine Colomerus Species (Trombidiformes: Prostigmata: Eriophyidae): Taxonomic and Distributional Ambiguities. Int. J. Acarol. 2013, 39, 239–243. [Google Scholar] [CrossRef]
- Smith Meyer, M.; Ueckermann, E.A. African Eriophyoidea: The Genus Colomerus Newkirk & Keifer, 1971 (Acari: Eriophyidae). Phytophylactica 1990, 22, 15–21. [Google Scholar]
- Halawa, A.M.; Ebrahim, A.A.; Abdullah, A.A.M.; Mohamed, A.A. Taxonomical Revision of the Genus Colomerus Newkirk & Keifer (Acari: Eriophyidae) in Egypt. Middle East J. Agric. Res. 2015, 4, 67–76. [Google Scholar]
- Attiah, H.H. Eriophyes oculivitis n. Sp., a New Bud Mite Infesting Grapes in the U.A.R. Bull. Soc. Entomol. Egypt 1967, 51, 17–19. [Google Scholar]
- Bagdasarian, A.T.T. The Eriophyoid Mites of Fruit Trees and Shrubs of Armenia; Akademii Nauk Armyanskoi SSR [Academy of Science, Armenian SSR]: Yerevan, Armenia, 1981. [Google Scholar]
- Carew, M.E.; Goodisman, M.A.D.; Hoffmann, A.A. Species Status and Population Genetic Structure of Grapevine Eriophyoid Mites. Entomol. Exp. Appl. 2004, 111, 87–96. [Google Scholar] [CrossRef]
- Valenzano, D.; Tumminello, M.T.; Gualandri, V.; de Lillo, E.; Teresa, M.; Valeria, T.; de Lillo, E. Morphological and Molecular Characterization of the Colomerus vitis Erineum Strain (Trombidiformes: Eriophyidae) from Grapevine Erinea and Buds. Exp. Appl. Acarol. 2020, 80, 183–201. [Google Scholar] [CrossRef]
- Bickford, D.; Lohman, D.J.; Sodhi, N.S.; Ng, P.K.L.; Meier, R.; Winker, K.; Ingram, K.K.; Das, I. Cryptic Species as a Window on Diversity and Conservation. Trends Ecol. Evol. 2007, 22, 148–155. [Google Scholar] [CrossRef] [PubMed]
- Skoracka, A.; Magalhães, S.; Rector, B.G.; Kuczyński, L. Cryptic Speciation in the Acari: A Function of Species Lifestyles or Our Ability to Separate Species? Exp. Appl. Acarol. 2015, 67, 165–182. [Google Scholar] [CrossRef] [PubMed] [Green Version]
- Skoracka, A. Host Specificity of Eriophyoid Mites: Specialists or Generalists? Biol. Lett. 2006, 43, 289–298. [Google Scholar]
- Petanović, R. Towards an Integrative Approach to Taxonomy of Eriophyoidea (Acari, Prostigmata)—An Overview. Ecol. Montenegrina 2016, 7, 580–599. [Google Scholar] [CrossRef]
- Navajas, M.; Navia, D. DNA-Based Methods for Eriophyoid Mite Studies: Review, Critical Aspects, Prospects and Challenges. Exp. Appl. Acarol. 2010, 51, 257–271. [Google Scholar] [CrossRef]
- Skoracka, A.; Dabert, M. The Cereal Rust Mite Abacarus hystrix (Acari: Eriophyoidea) Is a Complex of Species: Evidence from Mitochondrial and Nuclear DNA Sequences. Bull. Entomol. Res. 2010, 100, 263–272. [Google Scholar] [CrossRef]
- Skoracka, A.; Kuczyski, L.; Santos De Mendoņa, R.; Dabert, M.; Szydło, W.; Knihinicki, D.; Truol, G.; Navia, D. Cryptic Species within the Wheat Curl Mite Aceria tosichella (Keifer) (Acari: Eriophyoidea), Revealed by Mitochondrial, Nuclear and Morphometric Data. Invertebr. Syst. 2012, 26, 417–433. [Google Scholar] [CrossRef] [Green Version]
- Miller, A.D.; Skoracka, A.; Navia, D.; de Mendonca, R.S.; Szydło, W.; Schultz, M.B.; Michael Smith, C.; Truol, G.; Hoffmann, A.A. Phylogenetic Analyses Reveal Extensive Cryptic Speciation and Host Specialization in an Economically Important Mite Taxon. Mol. Phylogenet. Evol. 2013, 66, 928–940. [Google Scholar] [CrossRef] [PubMed]
- Li, H.-S.; Xue, X.-F.; Hong, X.-Y. Cryptic Diversity in Host-Associated Populations of Tetra pinnatifidae (Acari: Eriophyoidea): What Do Morphometric, Mitochondrial and Nuclear Data Reveal and Conceal? Bull. Entomol. Res. 2014, 104, 221–232. [Google Scholar] [CrossRef] [PubMed]
- Skoracka, A.; Lewandowski, M.; Rector, B.G.; Szydło, W.; Kuczy, L. Spatial and Host-Related Variation in Prevalence and Population Density of Wheat Curl Mite (Aceria tosichella) Cryptic Genotypes in Agricultural Landscapes. PLoS ONE 2017, 12, e0169874. [Google Scholar] [CrossRef]
- Laska, A.; Majer, A.; Szydło, W.; Karpicka-Ignatowska, K.; Hornyák, M.; Labrzycka, A.; Skoracka, A. Cryptic Diversity within Grass-Associated Abacarus Species Complex (Acariformes: Eriophyidae), with the Description of a New Species, Abacarus plumiger n. sp. Exp. Appl. Acarol. 2018, 76, 1–28. [Google Scholar] [CrossRef] [PubMed] [Green Version]
- Cvrković, T.; Chetverikov, P.; Vidović, B.; Petanović, R. Cryptic Speciation within Phytoptus avellanae s.l. (Eriophyoidea: Phytoptidae) Revealed by Molecular Data and Observations on Molting Tegonotus-like Nymphs. Exp. Appl. Acarol. 2016, 68, 83–96. [Google Scholar] [CrossRef] [PubMed]
- Lewandowski, M.; Skoracka, A.; Szydło, W.; Kozak, M.; Druciarek, T.; Griffiths, D.A. Genetic and Morphological Diversity of Trisetacus Species (Eriophyoidea: Phytoptidae) Associated with Coniferous Trees in Poland: Phylogeny, Barcoding, Host and Habitat Specialization. Exp. Appl. Acarol. 2014, 63, 497–520. [Google Scholar] [CrossRef] [PubMed] [Green Version]
- Chetverikov, P.E.; Cvrković, T.; Efimov, P.G.; Klimov, P.B.; Petanović, R.U.; Romanovich, A.E.; Schubert, M.A.; Sukhareva, S.I.; Zukoff, S.N.; Amrine, J. Molecular Phylogenetic Analyses Reveal a Deep Dichotomy in the Conifer-Inhabiting Genus Trisetacus (Eriophyoidea: Nalepellidae), with the Two Lineages Differing in Their Female Genital Morphology and Host Associations. Exp. Appl. Acarol. 2020, 81, 287–316. [Google Scholar] [CrossRef] [PubMed]
- Živković, Z.; Vidović, B.; Jojić, V.; Cvrković, T.; Petanović, R. Phenetic and Phylogenetic Relationships among Aceria spp. (Acari: Eriophyoidea) Inhabiting Species within the Family Brassicaceae in Serbia. Exp. Appl. Acarol. 2017, 71, 329–343. [Google Scholar] [CrossRef]
- Saccaggi, D.L.; Arendse, M.; Wilson, J.R.U.; Terblanche, J.S. Contaminant Organisms Recorded on Plant Product Imports to South Africa 1994–2019. Sci. Data 2021, 8, 83. [Google Scholar] [CrossRef] [PubMed]
- Folmer, O.; Black, M.; Hoeh, W.; Lutz, R.; Vrijenhoek, R. DNA Primers for Amplification of Mitochondrial Cytochrome c Oxidase Subunit I from Diverse Metazoan Invertebrates. Mol. Mar. Biol. Biotechnol. 1994, 3, 294–299. [Google Scholar] [CrossRef] [Green Version]
- Kearse, M.; Moir, R.; Wilson, A.; Stones-Havas, S.; Cheung, M.; Sturrock, S.; Buxton, S.; Cooper, A.; Markowitz, S.; Duran, C.; et al. Geneious Basic: An Integrated and Extendable Desktop Software Platform for the Organization and Analysis of Sequence Data. Bioinformatics 2012, 28, 1647–1649. [Google Scholar] [CrossRef]
- Biomatters. User Manual Geneious Prime. Data Base 2012, 3304, 1–322. [Google Scholar]
- Katoh, K.; Standley, D.M. MAFFT Multiple Sequence Alignment Software Version 7: Improvements in Performance and Usability. Mol. Biol. Evol. 2013, 30, 772–780. [Google Scholar] [CrossRef] [PubMed] [Green Version]
- Minh, B.Q.; Schmidt, H.A.; Chernomor, O.; Schrempf, D.; Woodhams, M.D.; Von Haeseler, A.; Lanfear, R.; Teeling, E. IQ-TREE 2: New Models and Efficient Methods for Phylogenetic Inference in the Genomic Era. Mol. Biol. Evol. 2020, 37, 1530–1534. [Google Scholar] [CrossRef] [PubMed] [Green Version]
- Lanfear, R.; Calcott, B.; Ho, S.Y.W.; Guindon, S. PartitionFinder: Combined Selection of Partitioning Schemes and Substitution Models for Phylogenetic Analyses. Mol. Biol. Evol. 2012, 29, 1695–1701. [Google Scholar] [CrossRef] [Green Version]
- Chernomor, O.; Von Haeseler, A.; Minh, B.Q. Terrace Aware Data Structure for Phylogenomic Inference from Supermatrices. Syst. Biol. 2016, 65, 997–1008. [Google Scholar] [CrossRef] [PubMed] [Green Version]
- Kalyaanamoorthy, S.; Minh, B.Q.; Wong, T.K.F.; Von Haeseler, A.; Jermiin, L.S. ModelFinder: Fast Model Selection for Accurate Phylogenetic Estimates. Nat. Methods 2017, 14, 587–589. [Google Scholar] [CrossRef] [PubMed] [Green Version]
- Guindon, S.; Dufayard, J.-F.; Lefort, V.; Anisimove, M.; Hordijk, W.; Gascuel, O. New Algorithms and Methods to Estimate Maximum-Likelihood Phylogenies: Assessing the Performance of PhyML 3.0. Syst. Biol. 2010, 59, 307–321. [Google Scholar] [CrossRef] [Green Version]
- Hoang, D.T.; Chernomor, O.; Von Haeseler, A.; Minh, B.Q.; Vinh, L.S. UFBoot2: Improving the Ultrafast Bootstrap Approximation. Mol. Biol. Evol. 2017, 35, 518–522. [Google Scholar] [CrossRef]
- Kumar, S.; Stecher, G.; Li, M.; Knyaz, C.; Tamura, K. MEGA X: Molecular Evolutionary Genetics Analysis across Computing Platforms. Mol. Biol. Evol. 2018, 35, 1547–1549. [Google Scholar] [CrossRef] [PubMed]
- Kimura, M. A Simple Method for Estimating Evolutionary Rates of Base Substitutions through Comparative Studies of Nucleotide Sequences. J. Mol. Evol. 1980, 16, 111–120. [Google Scholar] [CrossRef] [PubMed]
- Rahbani, J.; Behzad, A.R.; Khashab, N.M.; Al-Ghoul, M. Characterization of Internal Structure of Hydrated Agar and Gelatin Matrices by Cryo-SEM. Electrophoresis 2013, 34, 405–408. [Google Scholar] [CrossRef] [PubMed]
- Amrine, J.W.J.; Manson, D.C.M. Preparation, Mounting and Descriptive Study of Eriophyoid Mites. In Eriophyoid Mites: Their Biology, Natural Enemies and Control; Lindquist, E.E., Sabelis, M.W., Bruin, J., Eds.; Elsevier: Amsterdam, The Netherlands, 1996; pp. 383–396. [Google Scholar]
- de Lillo, E.; Craemer, C.; Amrine, J.W., Jr.; Nuzzaci, G. Recommended Procedures and Techniques for Morphological Studies of Eriophyoidea (Acari: Prostigmata). Exp. Appl. Acarol. 2010, 51, 283–307. [Google Scholar] [CrossRef]
- Meier, R.; Zhang, G.; Ali, F. The Use of Mean Instead of Smallest Interspecific Distances Exaggerates the Size of the “Barcoding Gap” and Leads to Misidentification. Syst. Biol. 2008, 57, 809–813. [Google Scholar] [CrossRef]
- Navia, D.; Mendonça, R.S.; Ferragut, F.; Miranda, L.C.; Trincado, R.C.; Michaux, J.; Navajas, M. Cryptic Diversity in Brevipalpus Mites (Tenuipalpidae). Zool. Scr. 2013, 42, 406–426. [Google Scholar] [CrossRef]
- Hebert, P.D.N.; Penton, E.H.; Burns, J.M.; Janzen, D.H.; Hallwachs, W. Ten Species in One: DNA Barcoding Reveals Cryptic Species in the Neotropical Skipper Butterfly Astraptes fulgerator. Proc. Natl. Acad. Sci. USA 2004, 101, 14812–14817. [Google Scholar] [CrossRef] [PubMed] [Green Version]
- Skoracka, A.; Kuczyński, L.; Szydlo, W.; Rector, B. The Wheat Curl Mite Aceria tosichella (Acari: Eriophyoidea) Is a Complex of Cryptic Lineages with Divergent Host Ranges: Evidence from Molecular and Plant Bioassay Data. Biol. J. Linn. Soc. 2013, 109, 165–180. [Google Scholar] [CrossRef] [Green Version]
- Meyer, C.P.; Paulay, G. DNA Barcoding: Error Rates Based on Comprehensive Sampling. PLoS Biol. 2005, 3, e422. [Google Scholar] [CrossRef] [Green Version]
- Skoracka, A.A.; Rector, B.; Kuczyński, L.; Szydło, W.; Hein, G.; French, R. Global Spread of Wheat Curl Mite by Its Most Polyphagous and Pestiferous Lineages. Ann. Appl. Biol. 2014, 165, 222–235. [Google Scholar] [CrossRef] [Green Version]
- Mathez, F. Contribution to the Study of the Morphology and Biology of Eriophyes vitis Pgst., the Causal Agent of Grapevine Erineum. Mitt. Schweiz. Entomol. Ges. 1965, 37, 233–283. [Google Scholar]
- Manson, D.C.M. Eriophyinae (Arachnida: Acari: Eriophyoidea). Fauna N. Z. 1984, 5, 128. [Google Scholar] [CrossRef]
- Manson, D.C.M.; Oldfield, G.N. Life forms, deuterogyny, diapause and seasonal development. In Eriophyoid Mites: Their Biology, Natural Enemies and Control; Lindquist, E.E., Sabelis, M., Bruin, J., Eds.; Elsevier: Amsterdam, The Netherlands, 1996; pp. 173–183. [Google Scholar]


| Primer Name | Sequence (5′–3′) | Amplicon (bp) | Primer Type | Reference |
|---|---|---|---|---|
| LCO1490 | GGTCAACAAATCATAAAGATATTGG | 710 | Universal | Folmer et al. [27] |
| HC02198 | TAAACTTCAGGGTGACCAAAAAATCA | |||
| G1-F | GAATAGAATTATCGCAGACAGG | 433 | Group-specific | This study |
| G1-R | CTAACACGATCTATACAAGAC | |||
| G2-F | GCGTCTAGAACTATCTCAAAC | 162 | Group-specific | This study |
| G2-R | TCATTACAACCAAGCATCAATG | |||
| G3-F | ACGAATGGAATTGTCTCATAC | 252 | Group-specific | This study |
| G3-R | CCAGAAGCTAACAAAGAGGA |
| Genetic Group | Sample Size (n) | Max p-Distance (%) |
|---|---|---|
| Group 1 | 10 | 0.00 |
| Group 2 | 5 | 0.00 |
| Group 3 | 2 | 1.57 |
| Group 4 | 18 | 0.00 |
| Group 5 | 7 | 0.86 |
| All sequences | 42 | 24.76 |
| Group 1 | Group 3 | Group 4 | Group 2 | Group 5 | |
|---|---|---|---|---|---|
| Group 1 | 2.30 | 1.90 | 2.28 | 2.04 | |
| Group 3 | 23.13 | 1.92 | 2.40 | 2.12 | |
| Group 4 | 18.33 | 17.78 | 2.26 | 2.01 | |
| Group 2 | 23.56 | 23.72 | 22.04 | 2.13 | |
| Group 5 | 20.01 | 20.72 | 19.41 | 19.59 |
Publisher’s Note: MDPI stays neutral with regard to jurisdictional claims in published maps and institutional affiliations. |
© 2022 by the authors. Licensee MDPI, Basel, Switzerland. This article is an open access article distributed under the terms and conditions of the Creative Commons Attribution (CC BY) license (https://creativecommons.org/licenses/by/4.0/).
Share and Cite
Saccaggi, D.L.; Maboeei, P.; Powell, C.; Ngubane-Ndhlovu, N.P.; Allsopp, E.; Wesley-Smith, J.; van Asch, B. Towards Solving the “Colomerus vitis Conundrum”: Genetic Evidence Reveals a Complex of Highly Diverged Groups with Little Morphological Differentiation. Diversity 2022, 14, 342. https://doi.org/10.3390/d14050342
Saccaggi DL, Maboeei P, Powell C, Ngubane-Ndhlovu NP, Allsopp E, Wesley-Smith J, van Asch B. Towards Solving the “Colomerus vitis Conundrum”: Genetic Evidence Reveals a Complex of Highly Diverged Groups with Little Morphological Differentiation. Diversity. 2022; 14(5):342. https://doi.org/10.3390/d14050342
Chicago/Turabian StyleSaccaggi, Davina L., Palesa Maboeei, Chanté Powell, Nompumelelo P. Ngubane-Ndhlovu, Elleunorah Allsopp, James Wesley-Smith, and Barbara van Asch. 2022. "Towards Solving the “Colomerus vitis Conundrum”: Genetic Evidence Reveals a Complex of Highly Diverged Groups with Little Morphological Differentiation" Diversity 14, no. 5: 342. https://doi.org/10.3390/d14050342