Article

Contrasting Impact of Viral Activity on Prokaryotic Populations in the Coastal and Offshore Regions of the Eastern Arabian Sea

by
PK Shruthi
1,2,
Ammini Parvathi
1,2,*,
Angia Sriram Pradeep Ram
3,
Shyla Hafza
1,2,
Jose K. Albin
2,
Erathodi Rajagopalan Vignesh
2,
Jaleel Abdul
2 and
Telesphore Sime-Ngando
3
1
Department of Biotechnology, Cochin University of Science and Technology, Kochi 682022, Kerala, India
2
National Institute of Oceanography-CSIR, Regional Centre, Dr. Salim Ali Road, Kochi 682018, Kerala, India
3
Laboratoire Microorganismes: Génome et Environnement (UMR CNRS 6023), Université Clermont-Auvergne, 1 Impasse Amélie Murat, CEDEX, 63178 Aubière, France
*
Author to whom correspondence should be addressed.
Diversity 2022, 14(3), 230; https://doi.org/10.3390/d14030230
Submission received: 21 January 2022 / Revised: 7 March 2022 / Accepted: 17 March 2022 / Published: 21 March 2022
(This article belongs to the Special Issue Ecology of Microbes in Marine and Estuarine Ecosystems)

Abstract

:
Viral processes in the coastal and offshore regions of the Eastern Arabian Sea (west coast of India) and their contribution of viral lysis to the organic carbon and nitrogen pool was examined. Water samples were collected during the southwest monsoon season at different depths (up to 1000 m) from four transects, with each transect consisting of two sampling points (S1–S8). Abundances of viruses and prokaryotes together with viral mediated prokaryotic mortality (up to 49.7%) were significantly (p < 0.001) higher in eutrophic coastal stations, whereas high percent lysogeny (up to 93%) was observed in the offshore regions. High viral-mediated carbon (Mean ± SD = 67.47 ± 2.0 μM C L−1 d−1) and nitrogen (Mean ± SD = 13.49 ± 14.0 μM N L−1 d−1) release was evident in the surface coastal waters compared to offshore regions. The percentage contributions of carbon and nitrogen released by viral lysis to the total dissolved organic carbon and nitrogen pool were estimated to be 7.4% and 3.9%, respectively, in the coastal surface waters. Our findings suggest that the contribution of viral lysis to DOM production through viral shunt could be crucial for the cycling of major biogeochemical elements and functioning of the studied tropical ecosystem.

Graphical Abstract

1. Introduction

Viruses are the most abundant biological entities infecting almost all living organisms in the ocean. They play significant roles in the nutrient cycling and energy flow in the sea through the viral shunt [1]. Most of the viruses in the sea are phages, the viruses that infect prokaryotes [1]. It is estimated that viruses can infect approximately 1023 prokaryotes per second, accounting for the removal of 20–40% of prokaryotic standing stock per day [2]. Numerous studies suggest that viruses are generally 10-fold more abundant than prokaryotes, with large variations in the virus-prokaryote ratio across various aquatic environments [1,3]. Apart from host abundances and community composition, environmental factors like temperature, salinity, inorganic nutrient concentration, solar radiation, etc., can influence viral-mediated prokaryotic lysis [2]. Physicochemical parameters impact the temporal and spatial distribution of viruses, their population structure and function [1]. Studies on virus-host dynamics have shown that the viral population changes with seasonal fluctuations in host diversity [4] and viral infection remains one of the most important top-down mechanisms influencing microbial diversity and community structure [2,5]. Considering the significance of viruses in marine systems, it is important to quantify, identify, and ascertain the impact of viruses in aquatic environments.
The unique biophysical processes in the Arabian Sea include high biological productivity, presence of intense oxygen minimum zones (OMZs), and upwelling phenomenon [6,7]. The Arabian Sea contains one of the most intense OMZs in the world. OMZs are unique oceanographic areas with reduced oxygen concentrations. A combination of strong organic matter decomposition, poor ventilation and high biological production in the surface waters explains the presence OMZs. Microbial life in the OMZ are adapted to thrive under oxygen-starved conditions through anaerobic respiration for the transformation of nutrients [8,9]. The hydrography of the Arabian Sea is largely influenced by monsoons, which are a seasonal reversal of prevailing winds accompanied by corresponding changes in precipitation. Over the Arabian Sea, monsoon winds alternately blow from the southwest and the northeast, reversing their dominant direction with the seasons, resulting in two monsoons, the southwest monsoon (summer monsoon, June to September) and the northeast monsoon (winter monsoon, November–January) with inter monsoon periods in between. During the monsoon, the dissolved organic carbon (DOC) produced by phytoplankton supports the growth of prokaryotes. Upwelling during the monsoon makes the Arabian Sea highly productive due to high nutrient availability [10]. During the winter monsoon in the northeast Arabian Sea, convective mixing of surface waters takes place due to cooling, rendering the water column well mixed [6,10]. On the contrary, the water column becomes highly stratified with warmer nutrient-deficient surface waters during inter-monsoons. Recent reports have brought out the significance of viral-mediated lysis in highly productive coastal waters of the Red Sea [11] and also the existence of inter-annual and intra-annual variability influencing viral-mediated processes in the south-eastern Arabian Sea, especially during the pre-monsoon season [12].
The viral activities and their processes are well studied in oceanic environments like the North Adriatic Sea, Gulf of Mexico, Mediterranean Sea, and Baltic Sea [13,14,15]. Recent advances in sequence analysis of environmental viromes have demonstrated diversity of DNA viruses in the surface and deep sea of the South China Sea and have suggested the possible passive transport of marine viruses by the horizontal and vertical physical transportations [16]. The Pacific Ocean Virome (POV), the largest viral metagenomic sampling of the Pacific Ocean was carried out for future comparative viral metagenomic study [17]. As a part of the TARA Ocean expedition, the morphological diversity of the viruses was studied [18]. However, in the Arabian sea, there are only a few reports on viral distribution, processes, and their life strategies. Investigations in the Cochin estuary (southwest coast of India) have reported on the seasonal variations in viral abundance, viral production, and viral processes [19,20]. A recent study has brought out the presence of clear seasonality in viral abundance and viral-mediated processes in the south eastern Arabian Sea [12]. The above studies are limited to only a single geographical location. In this study, which was carried out on a large-scale region in the Arabian Sea, we hypothesise viral activities to be more prevalent in coastal waters compared to offshore regions. Our aim was to ascertain various viral processes (life strategies, viral production) operating between coastal and offshore deep-sea waters and to draw comparison in terms of the release of both organic carbon and nitrogen through the viral shunt in this tropical marine ecosystem.

2. Materials and Methods

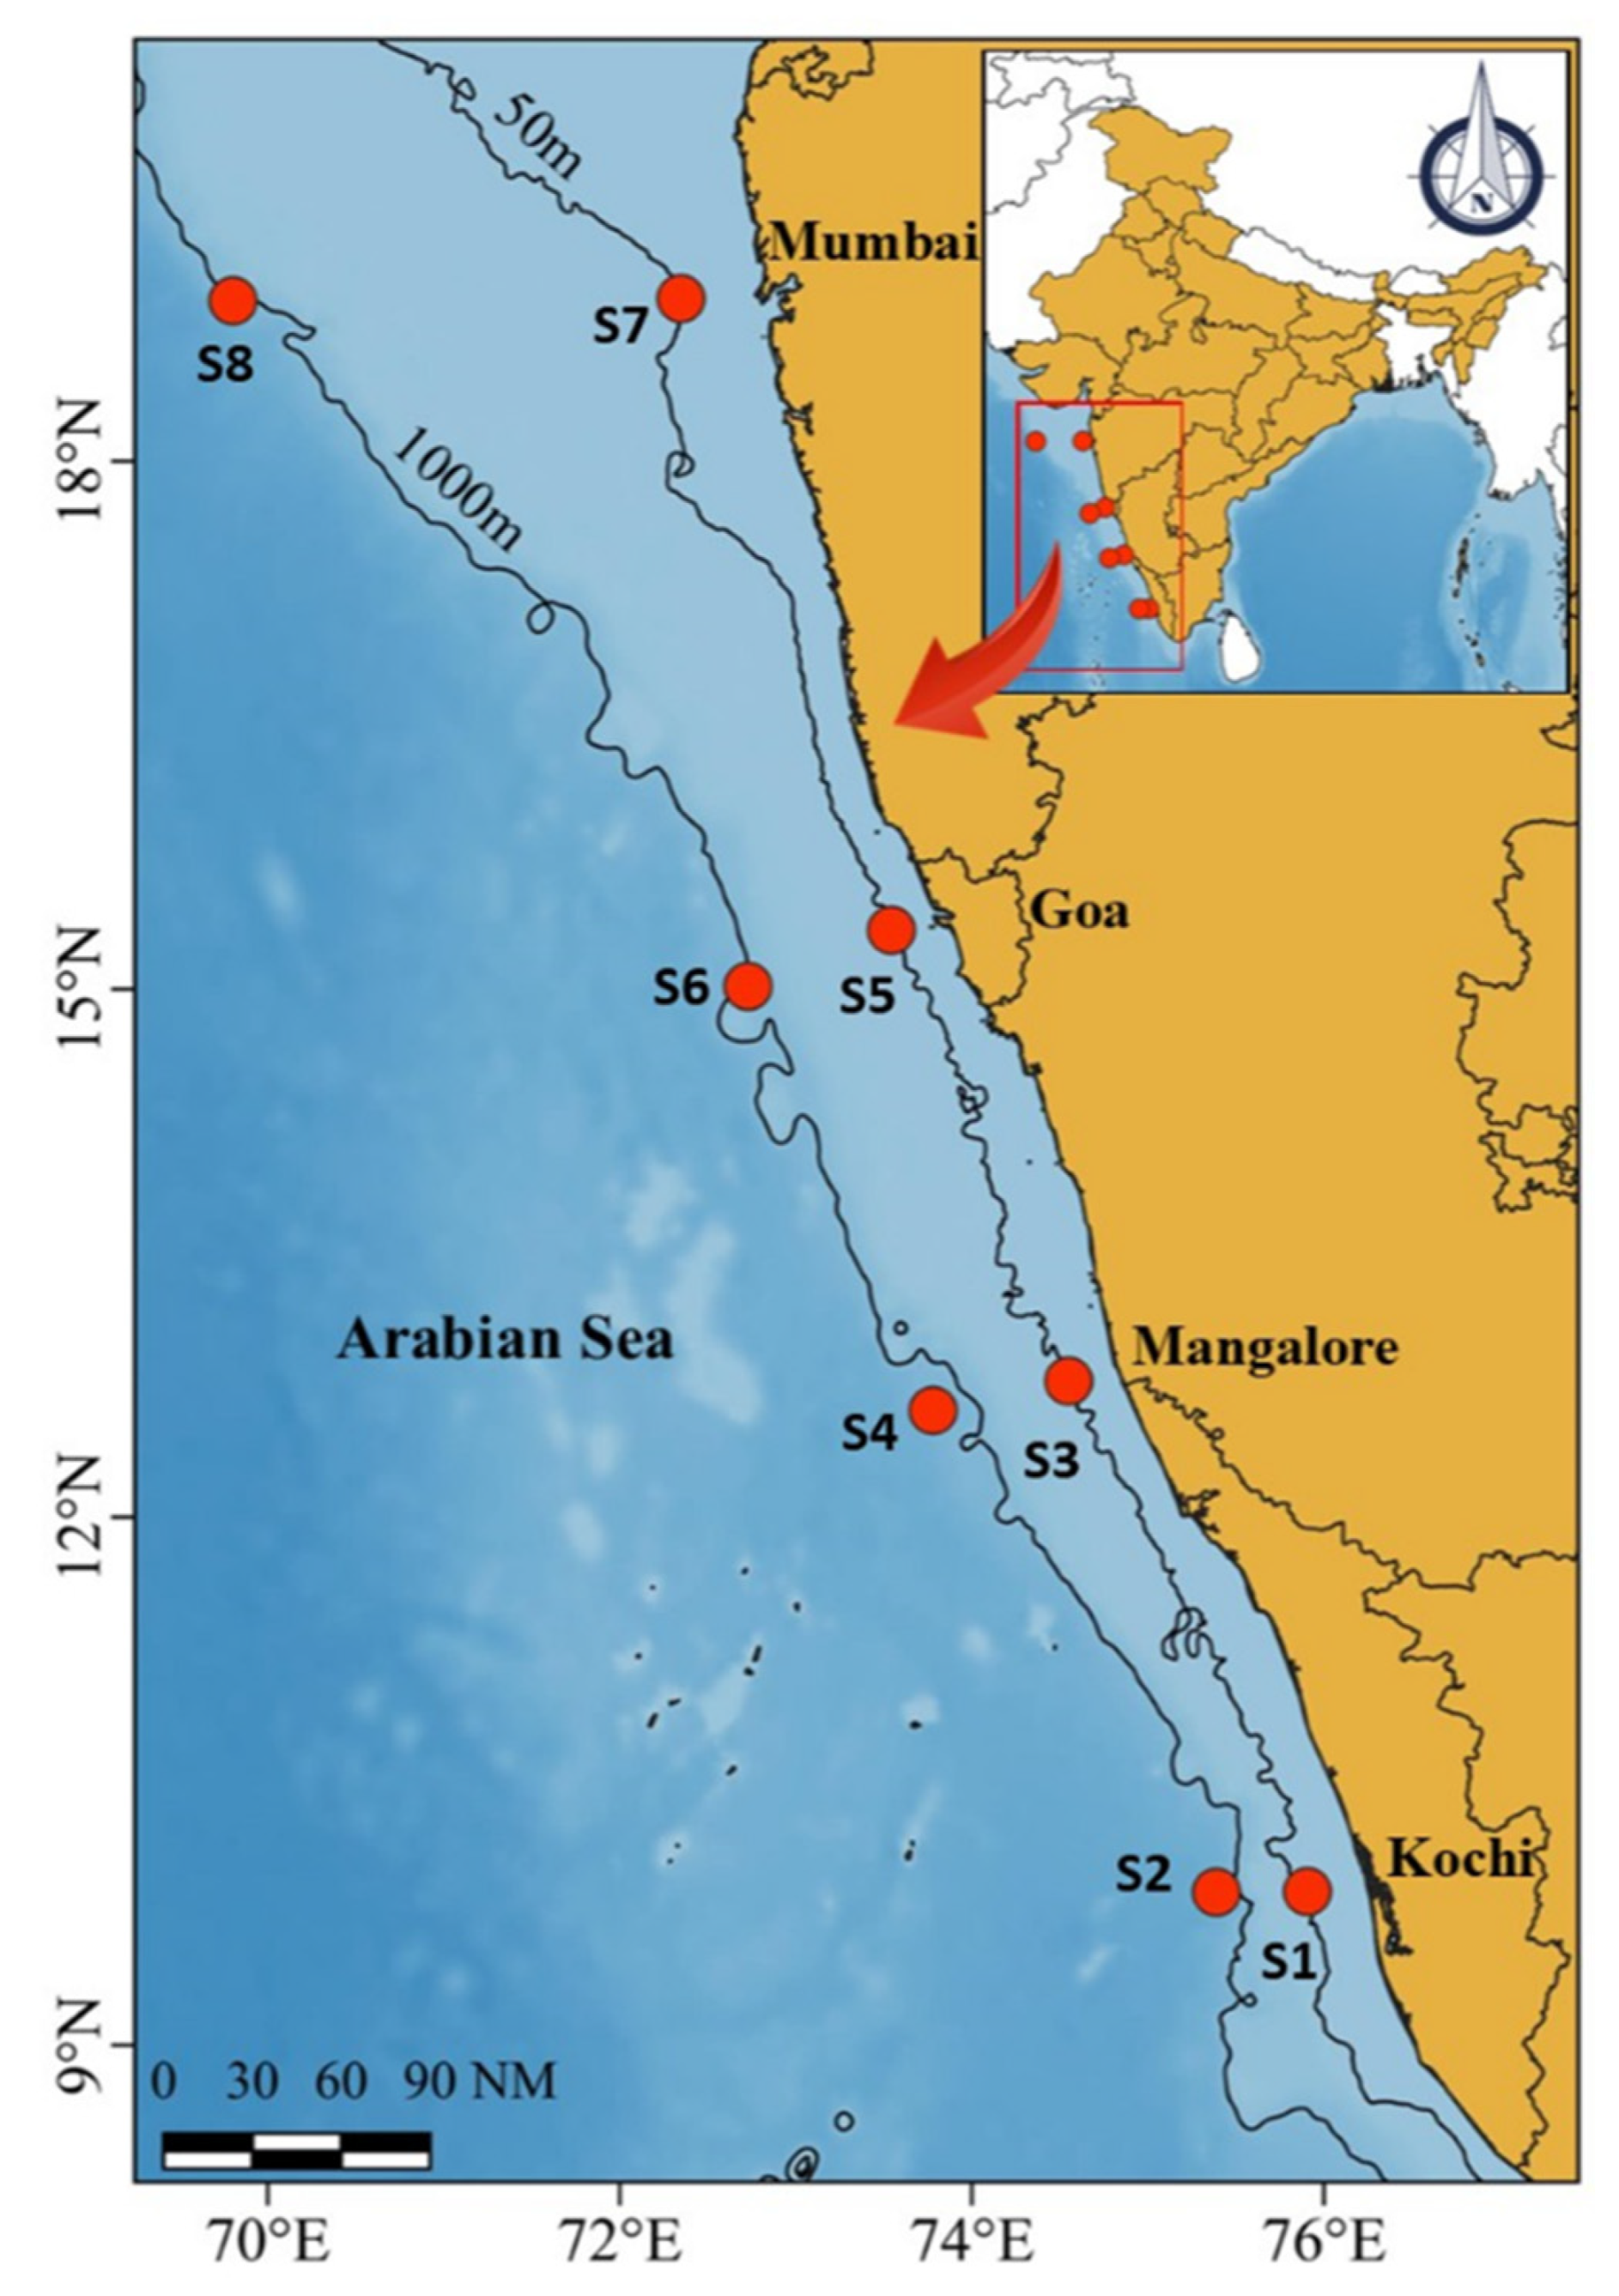
2.1. Study Location and Sample Collection

Water samples were collected during a multidisciplinary oceanographic cruise onboard FORV Sagar Sampada along the west coast of India coinciding with southwest monsoon season from 4 September 2019 to 20 September 2019. The study area extended from 9.76–18.54° N to 69.4–75.88° E in the Arabian sea, consisting of four transects from Kochi to Mumbai (Figure 1). Each transect consisted of two locations: a coastal station with 50 m depth and an offshore station with 1000 m depth. Water samples were collected from the surface and bottom layer for coastal stations and at different depths (~50 m, ~200 m, ~300 m, ~500 m, ~800 m, ~1000 m) for offshore stations, based on the chlorophyll a and dissolved oxygen concentrations along the vertical water column (Table S1). The water samples at respective depths were collected using Niskin samplers (12 L capacity, Hydrobios, Kiel, Germany) attached to a Conductivity Temperature Depth (CTD) profiler (SBE Seabird 19, Sea-Bird Scientific, Bellevue, WA, USA).

2.2. Estimation of Physicochemical Parameters

The CTD profiler was equipped with sensors for the estimation of salinity, temperature, dissolved oxygen (DO), turbidity, Chlorophyll a, and photosynthetically active radiation (PAR). Dissolved oxygen concentration was estimated by Winkler’s method [21]. Dissolved inorganic nutrients (NH4+1, NO2−1, NO3−1, PO4−3, SiO4−4) were analyzed using an auto-analyzer (Skalar SAN++, Breda, The Netherlands) [22]. The dissolved organic carbon (DOC) and dissolved organic nitrogen (DON) were measured using high temperature catalytic oxidation method using TOC analyzer [23].

2.3. Viral Abundance (VA), Prokaryotic Abundance (PA), and Total Viable Prokaryotic Count (TVC)

Water samples were analyzed for the abundance of viruses and prokaryotes (both bacteria and archaea) using epifluorescence microscopy as described by Patel et al. [24]. Briefly, a 5 mL of water sample was fixed with 0.02 µm filtered formalin (final concentration 2% v/v from a 37% w/v solution of commercial formaldehyde) and stored at −80 °C until further analysis. A 1 mL of water sample was filtered through a 0.02 µm filter paper (Anodic, 25 mm, Whatman, Ronkonkoma, NY, USA), stained with SYBR Green I (diluted 1:400, Invitrogen, Waltham, MA, USA), and incubated for 15 min. After the incubation, the filter paper was treated with an antifading agent, p-phenylenediamine, and observed under an epifluorescence microscope (Olympus BX 41, Olympus, Center Valley, PA, USA) under 1000× oil immersion using Green Interference Filter. Viruses and prokaryotes were distinguished based on their size differences. Negative controls were prepared using Milli-Q water to check for contamination.
The total viable count (TVC) was used to check the abundance of physiologically active prokaryotes in the environment by incubating the samples with yeast extract (final conc. of 0.05%) and antibiotic cocktail (final conc. of 0.05% of nalidixic acid, pipemidic acid, piromidic acid, and cephalexin) for 6 h in the dark. After the incubation, samples were fixed with formalin (final concentration 2% v/v) and stained with acridine orange (0.1 g/100 mL) [25]. The viable elongated cells were observed and enumerated under an epifluorescence microscope (Olympus BX 41, Olympus, Center Valley, PA, USA).

2.4. Viral Production (VP) and Viral-Mediated Mortality of Prokaryotes (VMM)

The dilution method was used for the direct measurement of viral production as described previously [26]. Seawater samples (100 mL) were diluted with 3 volumes of virus-free water (0.02 µm ANOTOP, Whatman) and incubated in the dark for 24 h. Subsamples were taken at every 3 h interval and viral abundance was examined under the epifluorescence microscope. Viral production was estimated from the regression line plotted based on the increase in viral abundance according to time [27].
VP = m × (B/b)
where m = slope of the regression line; b = Prokaryotic concentration after dilution; B = Prokaryotic concentration prior to dilution.
Viral mediated mortality (VMM) was calculated as a ratio between viral production and burst size (determined from transmission electron microscopy) [28].

2.5. Induction Assays for Lysogenic Prokaryotes

The fraction of lysogenic cells (FLC) was estimated using Mitomycin C (Sigma, Ronkonkoma, NY, USA), a powerful and an effective phage inducing agent. A 25 mL water sample (in triplicates) was treated with mitomycin C (1 μg mL−1 final conc) and incubated for 24 h [29]. To check the lysogenic activity, subsamples (2 mL) were collected every 3 h and the abundance of virus and prokaryotes were enumerated after SYBR Green staining using epifluorescence microscopy. From these values, the percentage of lysogenic cells was estimated using the equation, FLC = (VAMC × VAC)/BS × PAt0) × 100 (where, VAMC: Viral abundance treated with mitomycin C, VAC: viral abundances control assays, PAt0—prokaryotic abundance at t0, BS—maximum burst size) and viral-mediated prokaryotic mortality was calculated. To estimate the amount of dissolved organic carbon and dissolved organic nitrogen released due to viral-mediated prokaryotic lysis, 20 fg C cell−1 for carbon (Dissolved organic carbon, DOC) and, 4 fg N cell−1 for nitrogen (Dissolved organic nitrogen, DON) was used [30], using the following formula.
DOC release (C L−1 d−1) = Viral mediated mortality × elemental carbon content of a bacterium
DON release (N L−1 d−1) = Viral mediated mortality × elemental nitrogen content of a bacterium

2.6. Viral Lytic Infection and Burst Size Estimates (BS)

A transmission electron microscope was used to determine the frequency of visibly infected prokaryotic cells (FVIC), burst size, viral morphotypes, and viral infected prokaryotic morphotypes. Due to some technical difficulties encountered during sample collection, water samples could not be collected from S5 and S6. Viral lytic infection was inferred from FVIC measured according to Pradeep Ram et al. [31]. Prokaryotes present in 8 mL of glutaraldehyde fixed (final concentration 2% v/v) water samples were collected onto 400-mesh carbon-coated formvar grids by centrifugation (70,000× g, 20 min at 4 °C) using an SW 40Ti rotor (Optima LE-80K, Beckman Coulter, Brea, CA, USA). The grids were then stained at room temperature for 30 s with uranyl acetate stain (2% w/v) and washed twice with 0.02 μm filtered distilled water to remove the excess stain and dried on a filter paper. Grids were examined under a transmission electron microscope (TEM) operated at 80 kV at a magnification between 20,000 and 60,000× (JEOL 1200Ex, Tokyo, Japan) to distinguish between prokaryotic cells with and without intracellular viruses. FVIC was determined by examining 300–500 prokaryotic cells per grid. The viral mean burst size (BS, viruses per prokaryote) was estimated for every sample as the average number of viral particles in infected cells (at least 15 infected cells were examined per sample). The frequency of infected cells (FIC) and viral-induced prokaryotic mortality (VIPM) was estimated using the following equation: FIC = 9.524 FVIC − 3.256 and VIPM = (FIC + 0.6 × FIC2)/(1 − 1.2 × FIC) [32].
Bacterial morphotypes were identified as elongated rod, thin rod, short rod, fat rod, filamentous, and cocci based on observations during TEM examination. Viruses were classified as myoviruses, podoviruses, siphoviruses, and non-tailed viruses based on their morphology [33] by JEOL 1200EX TEM at a magnification of 40,000–80,000× [34].

2.7. Statistical Analysis

The correlation between prokaryotic and viral parameters along with physicochemical parameters was determined using Pearson correlation analysis. To determine whether the spatial variations were significant, an analysis of PERMANOVA was performed using PRIMER-e. Canonical redundancy analysis (RDA), a multivariate method, was used to elucidate the relationships between biological and environmental variables by using a statistical software package CANOCO 4.5.

3. Results

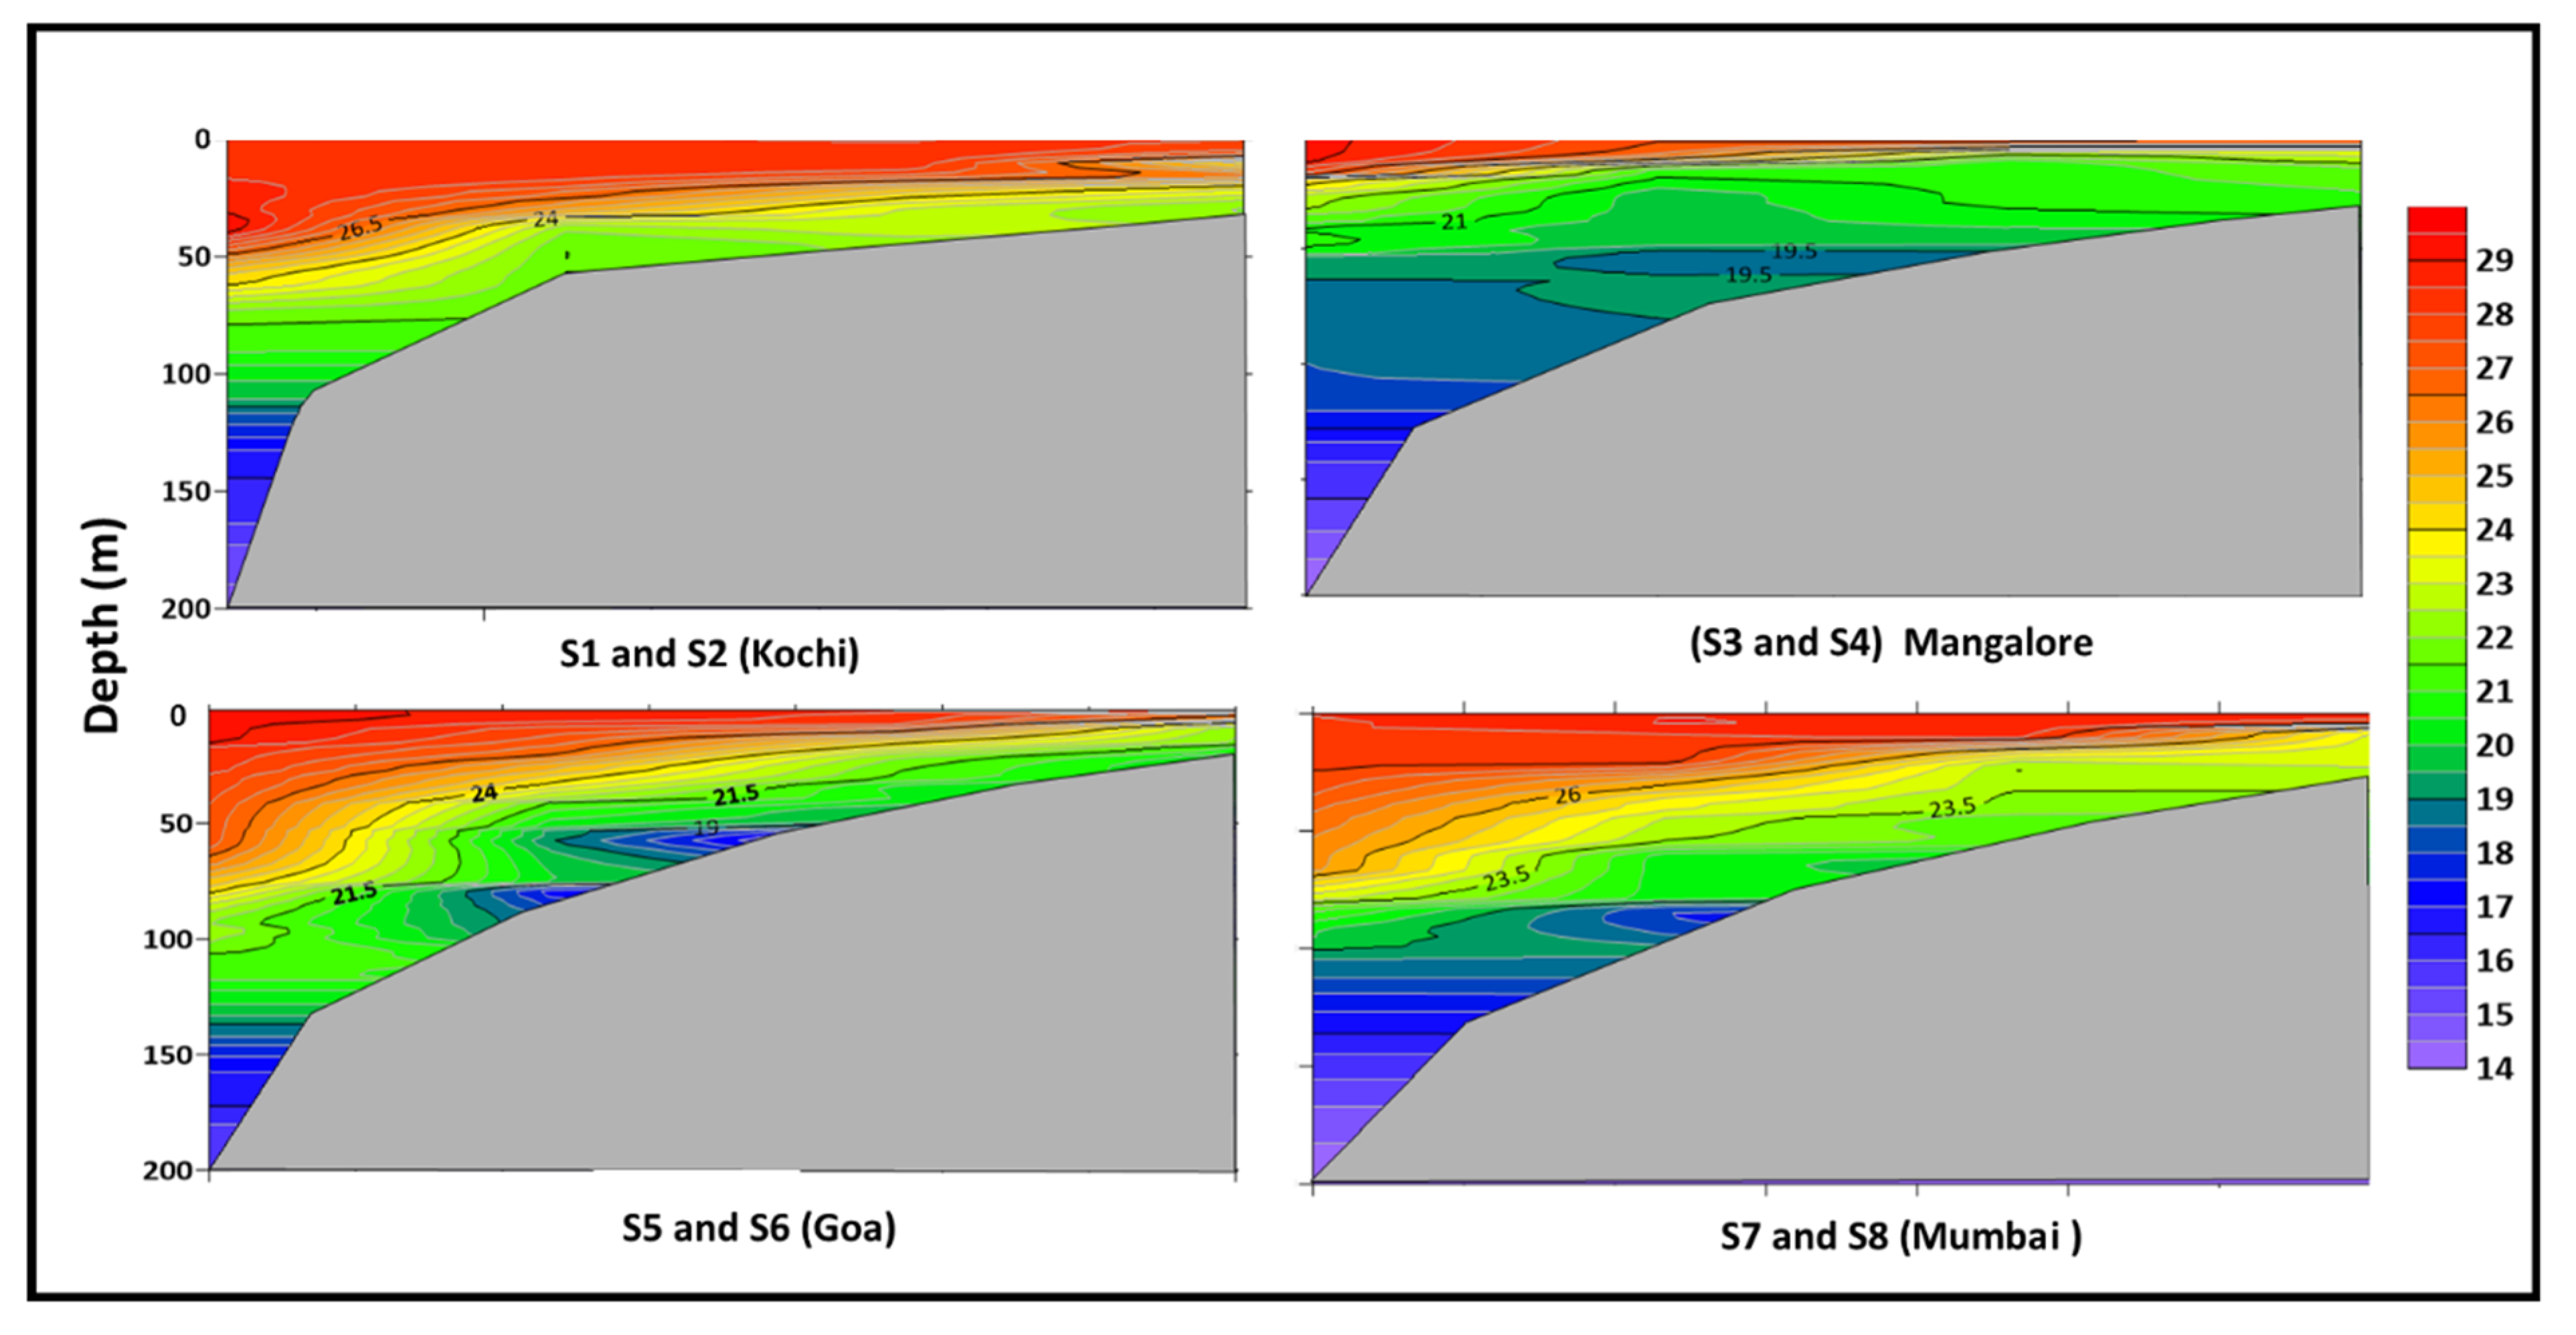
3.1. Prevailing Environmental Conditions in The Eastern Arabian Sea

The physiochemical parameters in the study area were influenced by monsoonal rains that occurred during the study period. The surface temperature observed in the sampling stations was consistent along the study region in the Eastern Arabian Sea (28.0 ± 0.5 °C). The highest sea surface temperature was recorded in the offshore station S2 (28.7 °C) and the lowest at S1 station (28.1 °C). The temperature variations were not significant in the coastal and offshore surface waters. Salinity increased from coastal to offshore waters and also from surface to deeper waters. The average salinity in coastal and offshore stations was 28.5 ± 1.8 and 35.3 ± 1.3 psu, respectively. The dissolved oxygen concentration ranged from 0.18 to 4.73 mg L−1. The average chlorophyll a concentration was higher at the coastal stations (0.83 ± 0.005 mg m−3) when compared to offshore stations (0.15 ± 0.02 mg m−3) (Table S2). Upwelling signals were evident with the presence of cooler subsurface waters in the entire study region (Figure 2). The upsloping of isotherms in the coastal regions, together with upsloping of dissolved oxygen and salinity from offshore to coastal stations, indicated the presence of upwelling. In the case of inorganic nutrients, phosphate, nitrate, silicate, and ammonia showed significantly lower values (p < 0.05) in the surface compared to deeper waters at both coastal and offshore stations.

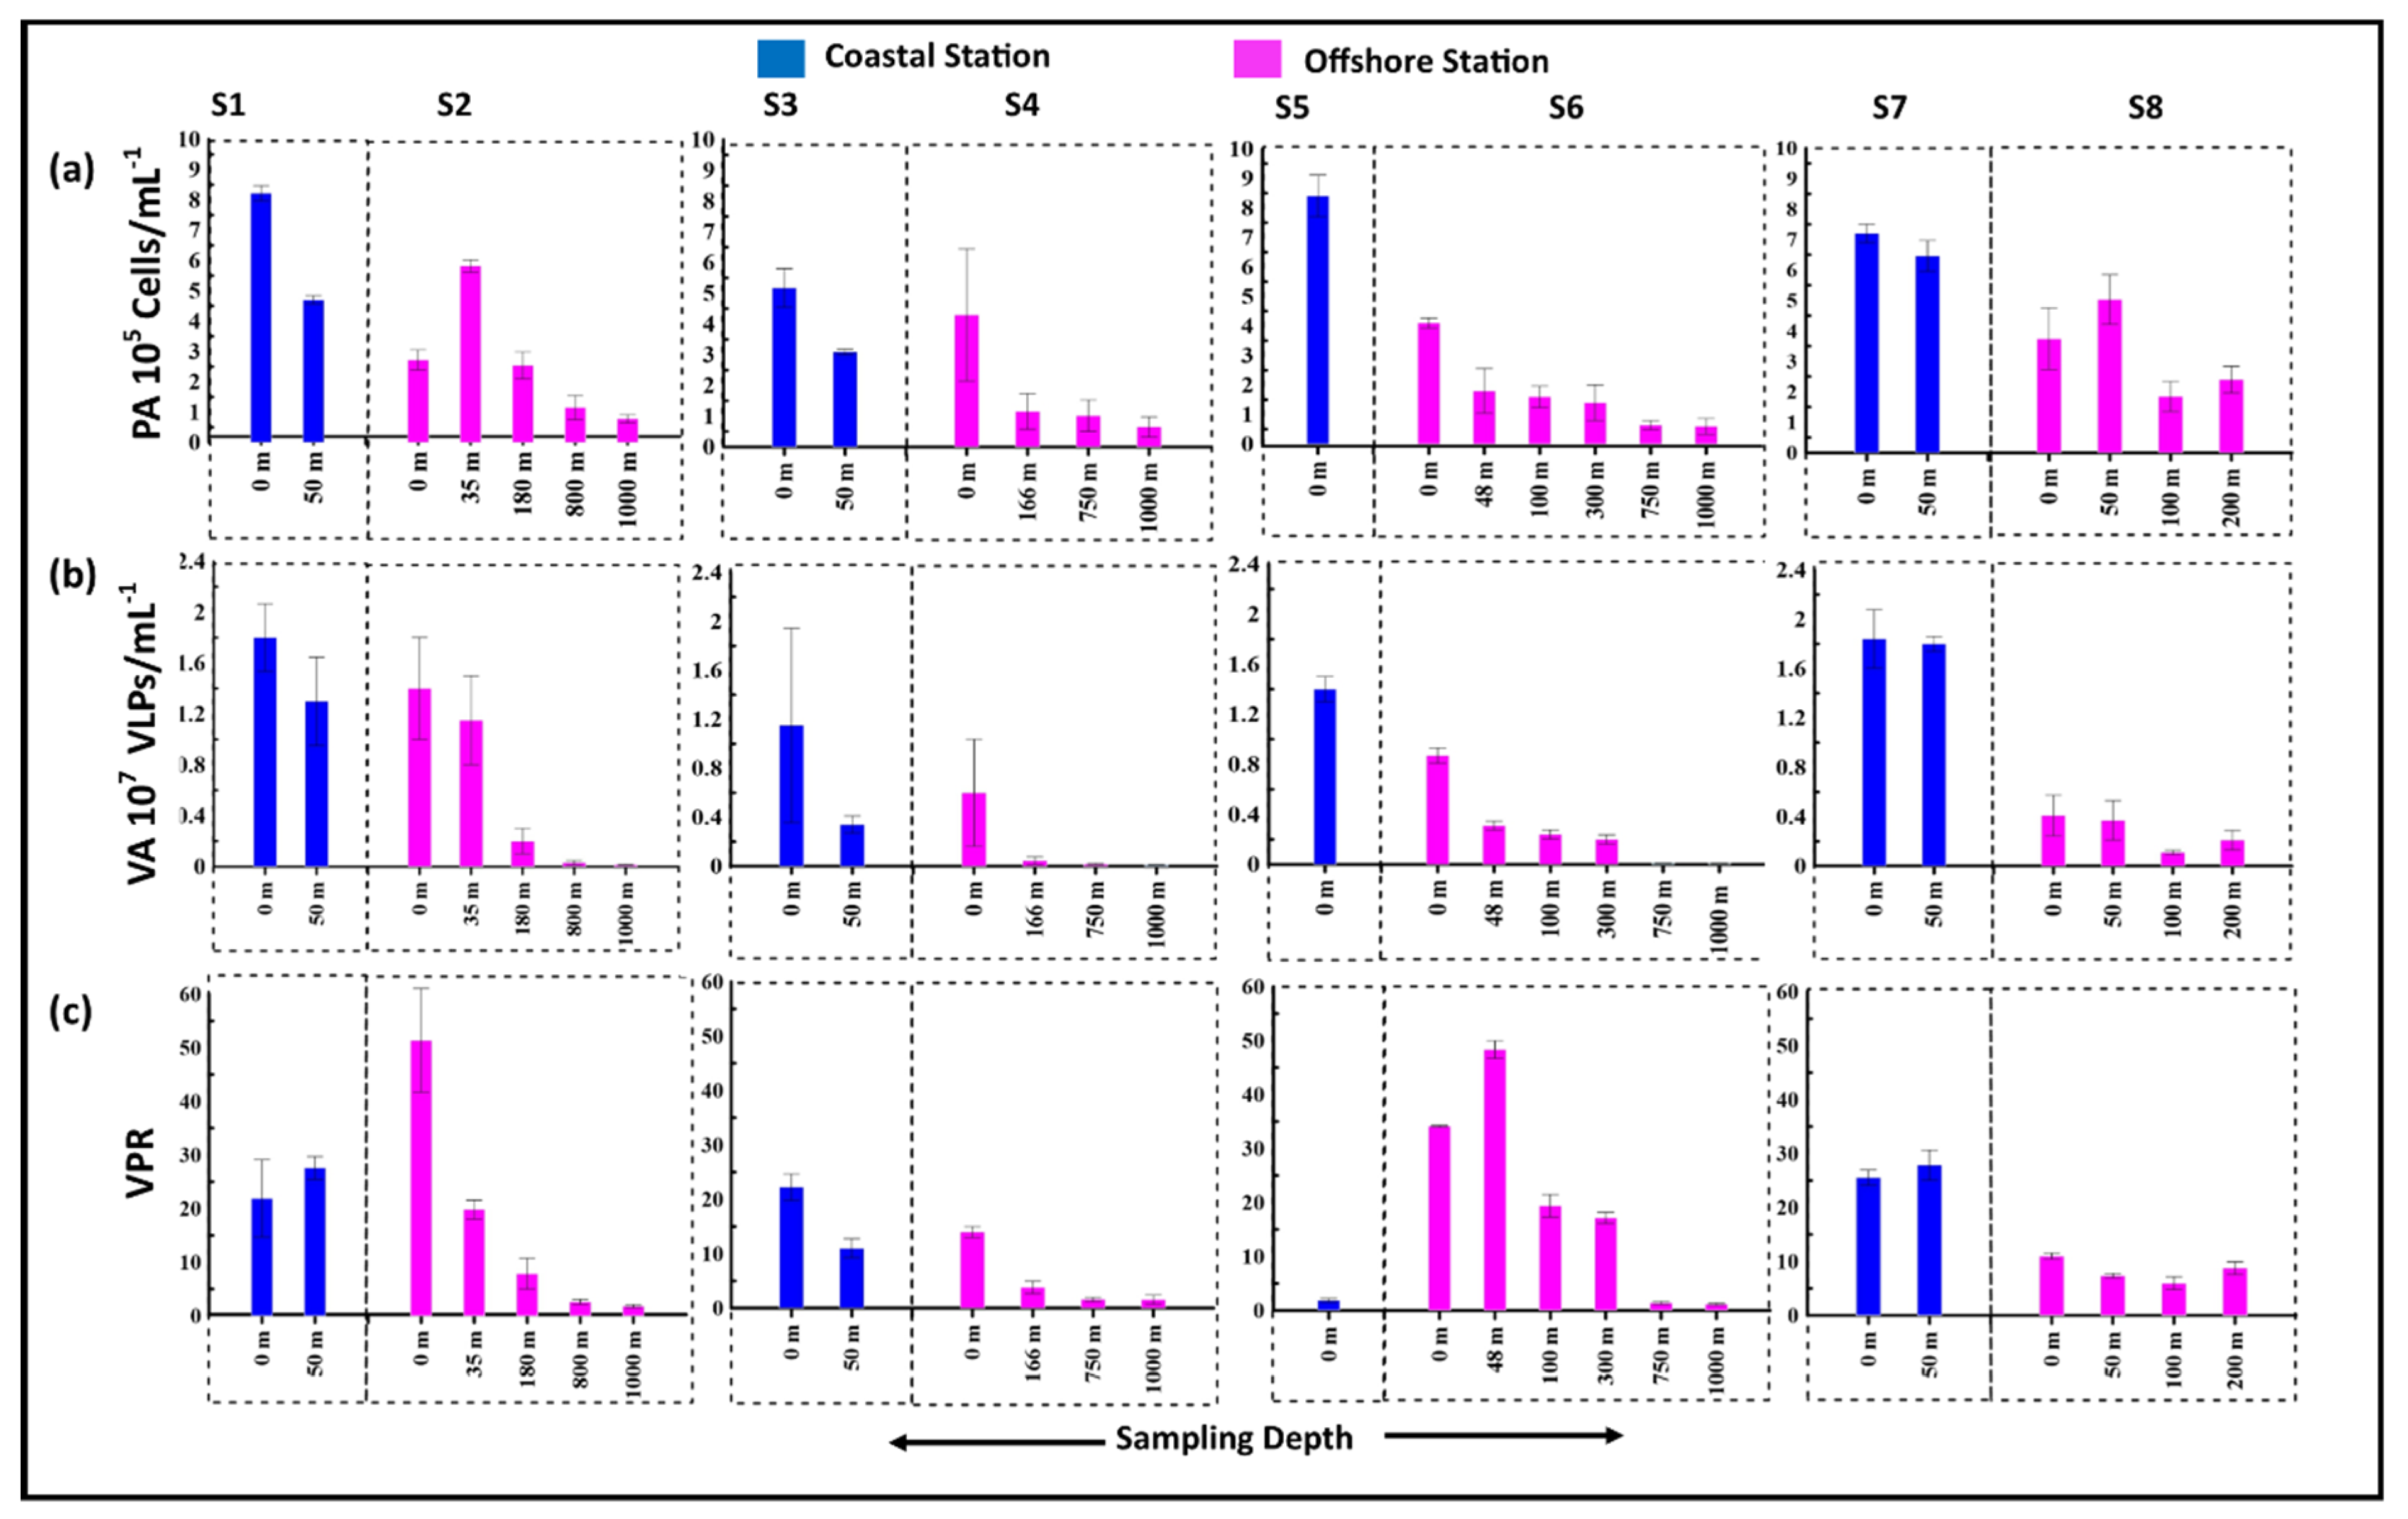
3.2. Standing Stocks of Viruses and Prokaryotes

Viral abundance (VA) was significantly higher (p < 0.001) in the coastal waters (Mean ± SD = 1.19 ± 0.26 × 10⁷ VLPs mL−1) throughout the study region compared to offshore waters (Mean ± SD = 0.38 ±0.05 × 10⁷ VLPs mL−1). VA decreased drastically with depth with a maximum at the surface (Mean ± SD = 1.41 ± 0.1 × 10⁷ VLPs mL−1) to a minimum at the bottom (Mean ± SD = 1.0 ± 0.1 × 10⁷ VLPs mL−1) (Figure 3b). The highest VA was recorded in the coastal waters of S7 (Mean ± SD = 1.84 ± 0.28 × 10⁷ VLPs mL−1) and the lowest VA in the deeper waters (1000 m) of the S6 (Mean ± SD = 1.0 ± 0.2 × 10⁷ VLPs mL−1). Prokaryotic abundance (PA) also showed a similar trend with higher counts in the coastal waters (Mean ± SD = 6.18 ± 1.9 × 10⁵ cells mL1) compared to the offshore region (Mean ± SD = 2.21 ± 1.5 × 10⁵ cells mL−1). The highest PA was recorded in the coastal surface waters of S5 (8.4 ± 0.7 × 10⁵ cells mL−1) and S1 (8.2 ± 0.8 × 10⁵ cells mL−1) (Figure 3a), and the lowest was estimated in the offshore station S6 (0.6 ± 0.2 × 10⁵ cells mL−1). The virus to the prokaryotic ratio (VPR) ranged from 1.16 to 51.7. The VPR was maximum in the surface waters of the offshore station of S1 (51.7 ± 9.6) and the minimum was recorded in the deeper waters (1000 m) of the S6 station (1.16 ± 0.2) (Figure 3c).

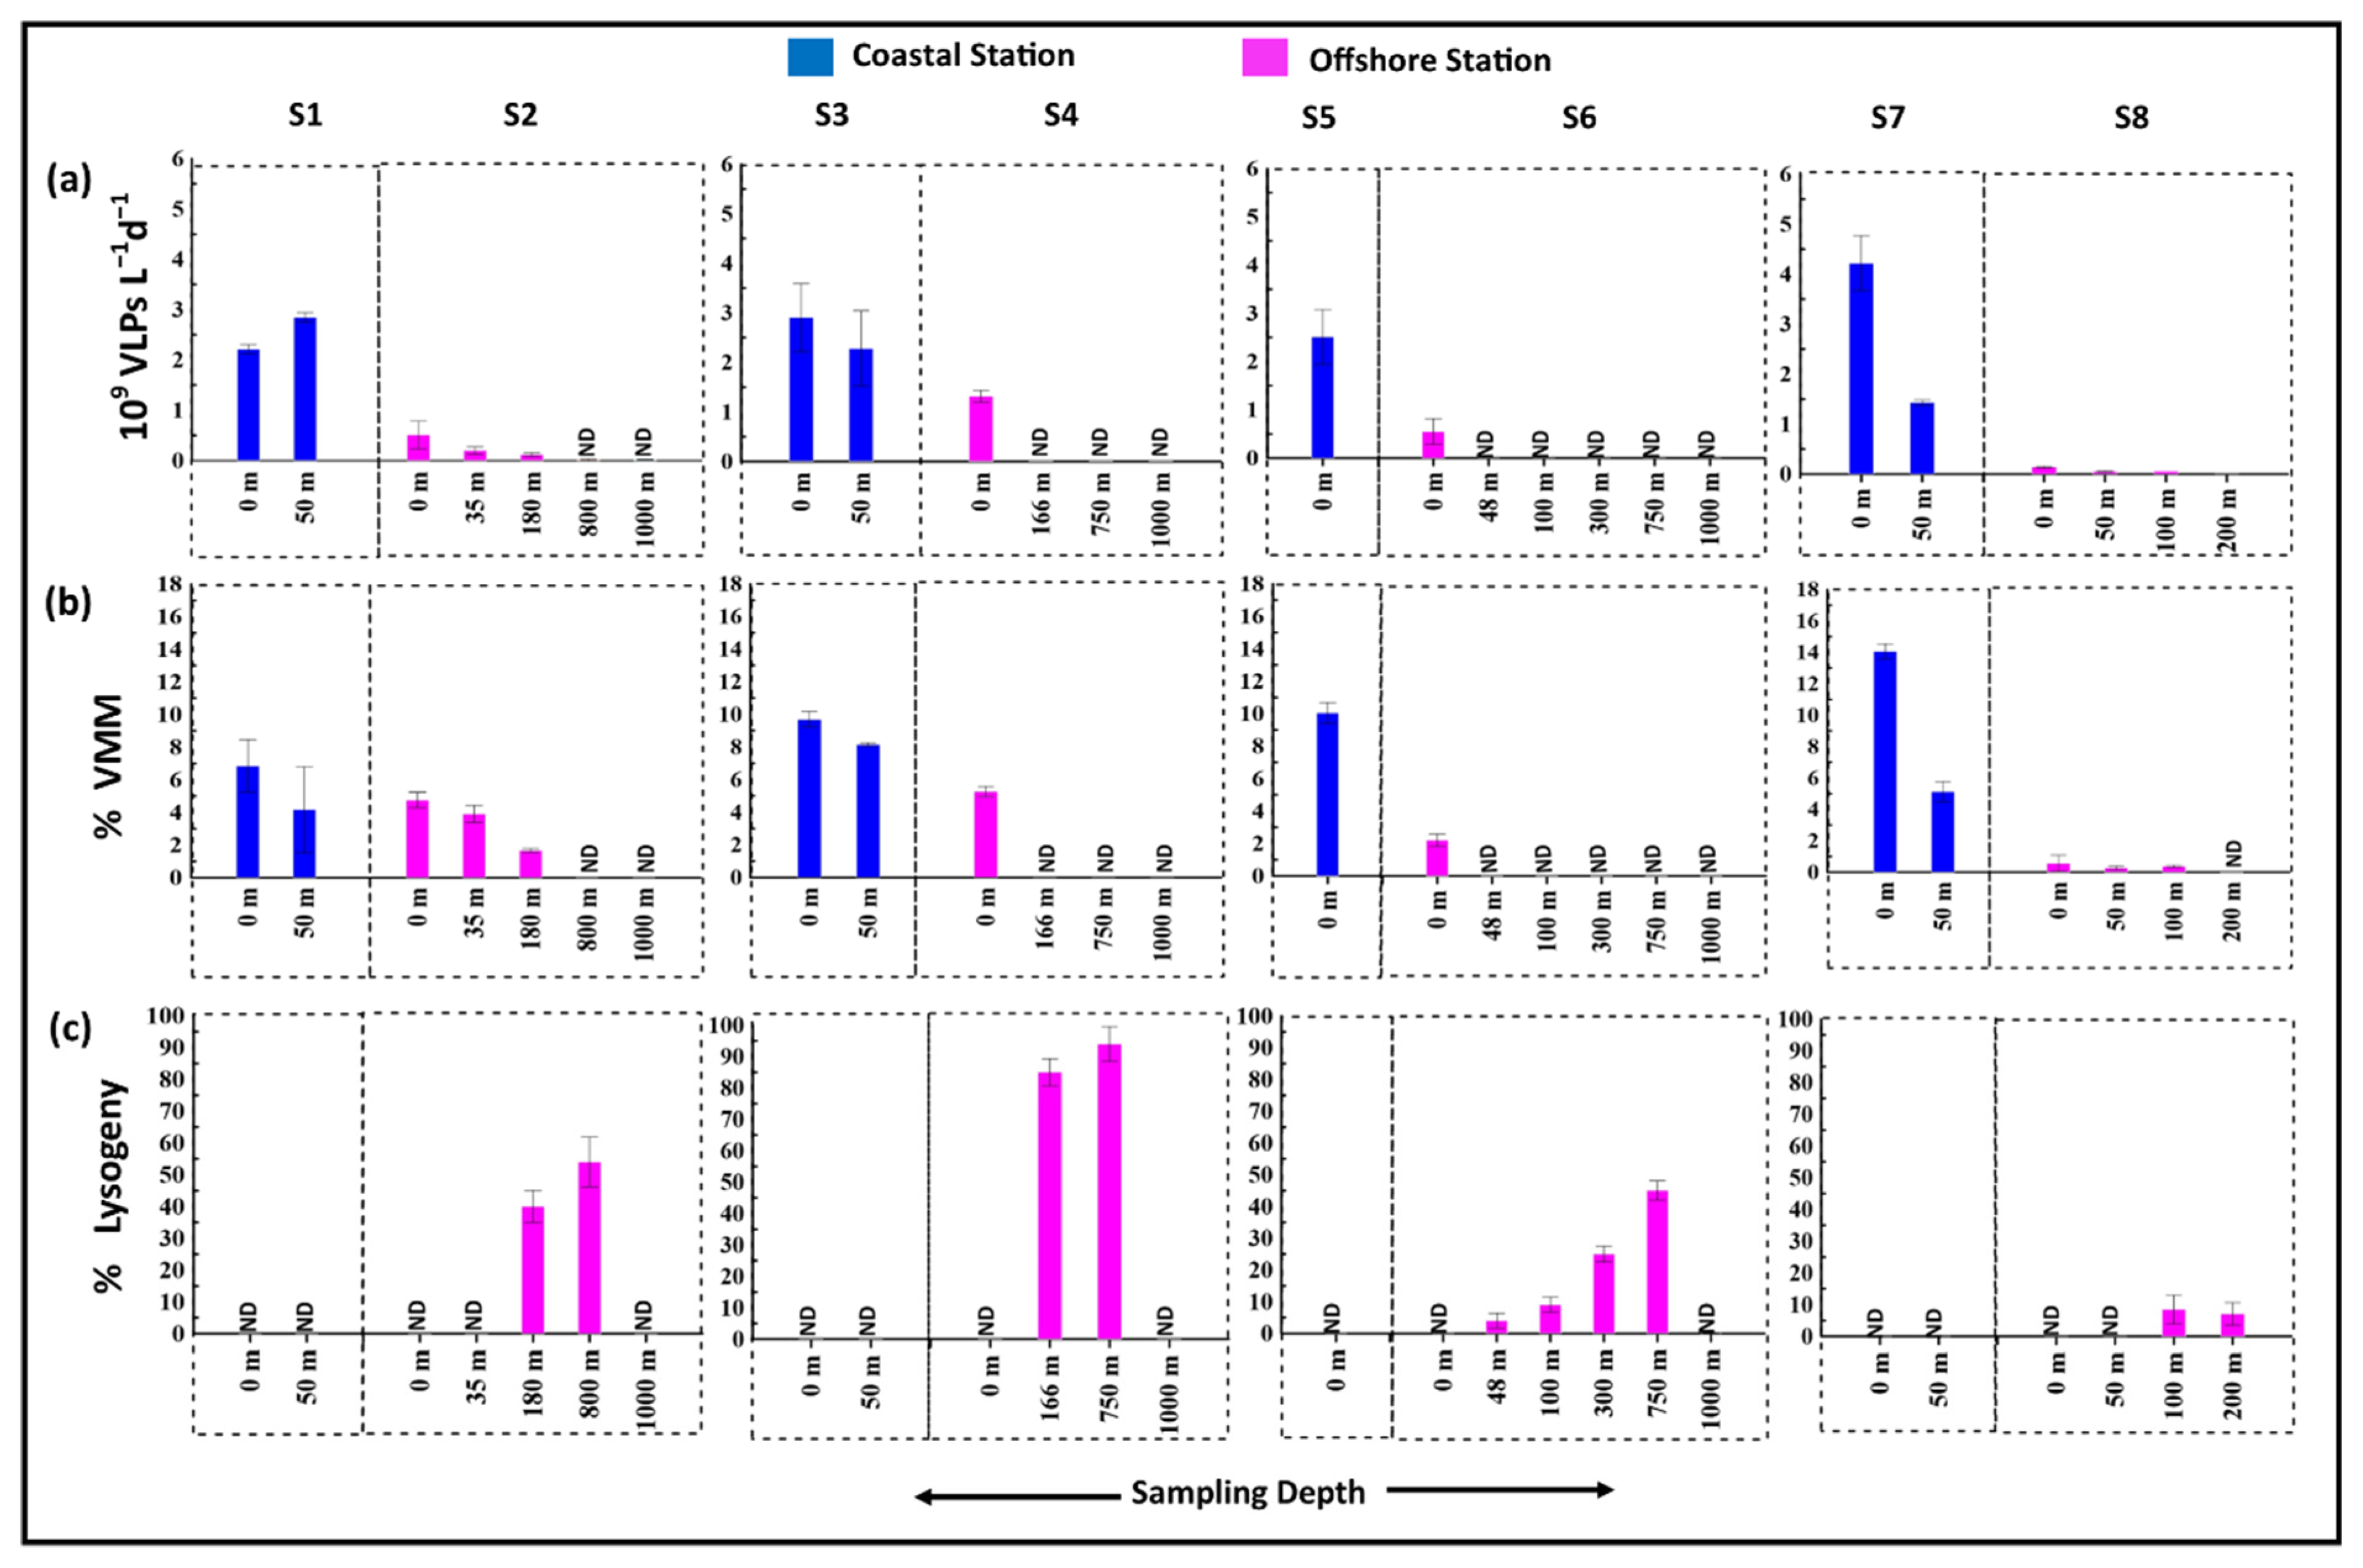
3.3. Viral Production and Viral Mediated Prokaryotic Mortality

Viral production ranged between 0.01–4.21 × 10⁹ VLPs L−1d−1 (Figure 4a). High viral production rates were recorded in the coastal waters which decreased towards the offshore. In general, VP rates decreased with increasing depth. In offshore stations, VP was detectable up to 180 m in S6 (0.25 ± 0.01 × 10⁹ VLPs L−1d−1). Beyond 180 m depth, lytic viral production was not detectable. The highest viral production rate was observed in the coastal waters of S7 (4.21 ± 0.55 × 10⁹ VLPs L−1d−1) (Figure 4a). Viral-mediated prokaryotic mortality (VMM) followed the same pattern as viral production with an average of 8.09 ± 3.27% and 2.73 ± 2.35% in coastal and offshore stations, respectively. Maximum (14.05 ± 0.47%) and minimum (0.37 ± 0.047%) prokaryotic mortality were recorded in the coastal waters and deeper waters (100 m) of S7 and S8 stations, respectively (Figure 4b).

3.4. Lysogenic Induction

The percentage of lysogenic induction (LI) showed a contrasting pattern with that of viral production. Lysogeny ranged from 4% to 93%. Interestingly, lysogeny was undetectable in the surface waters of all the coastal and offshore waters. Percentage lysogeny increased with depth. Maximum lysogeny was recorded at 750 m depth in the offshore station, S4. However, lysogeny was not detectable beyond this depth in the present study (Figure 4c).

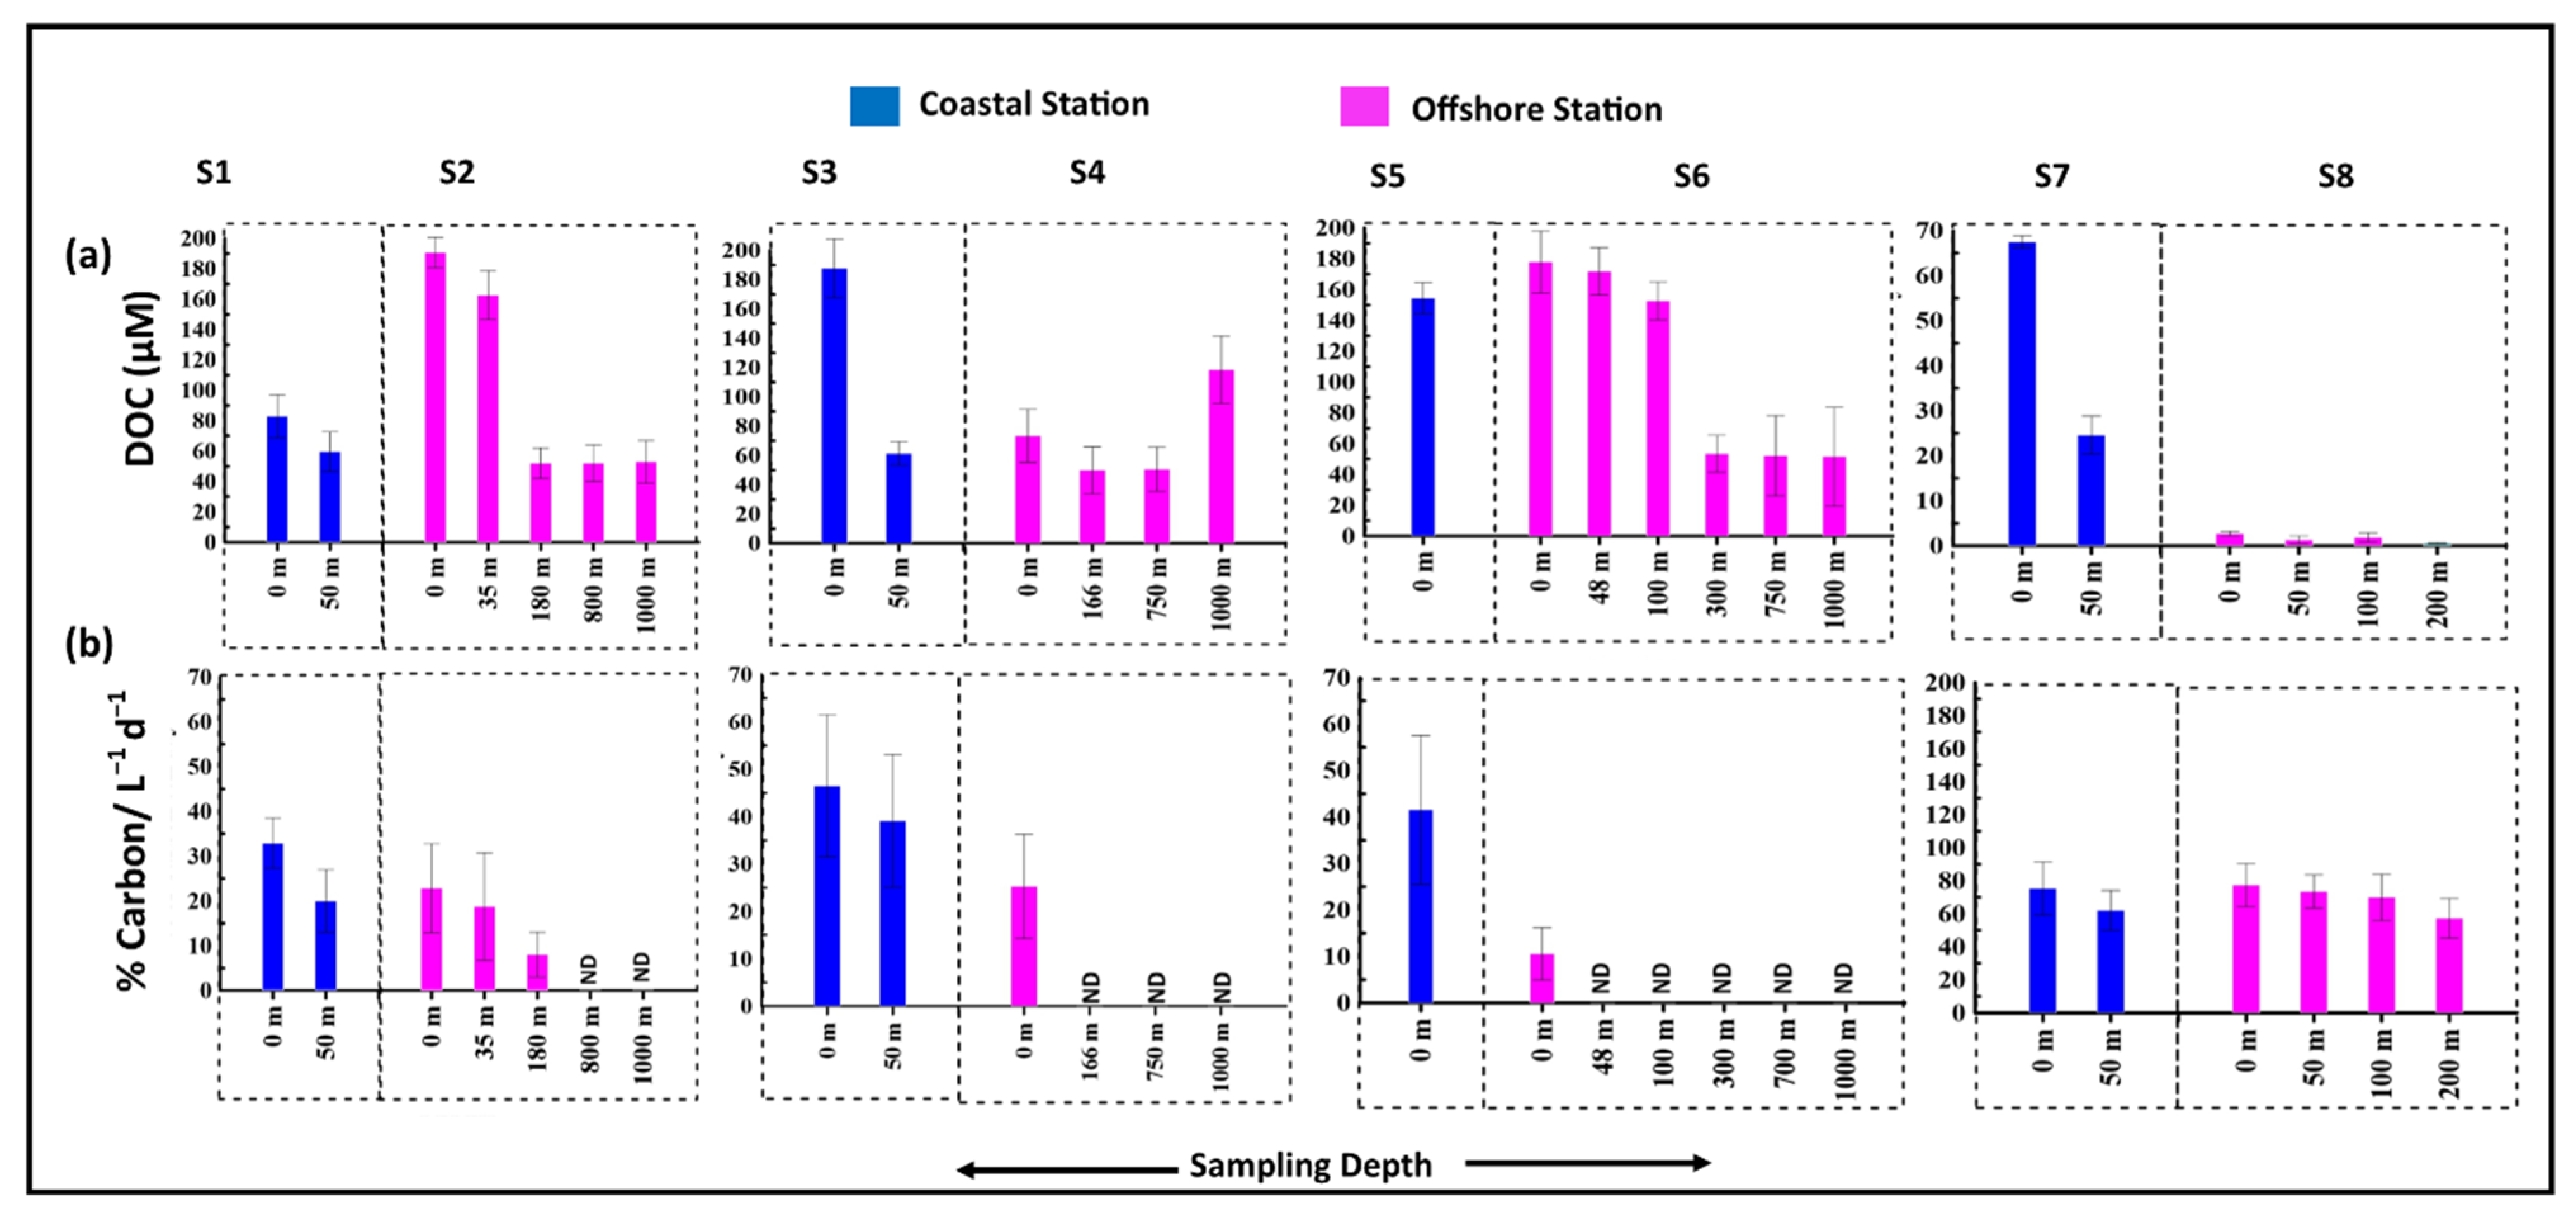
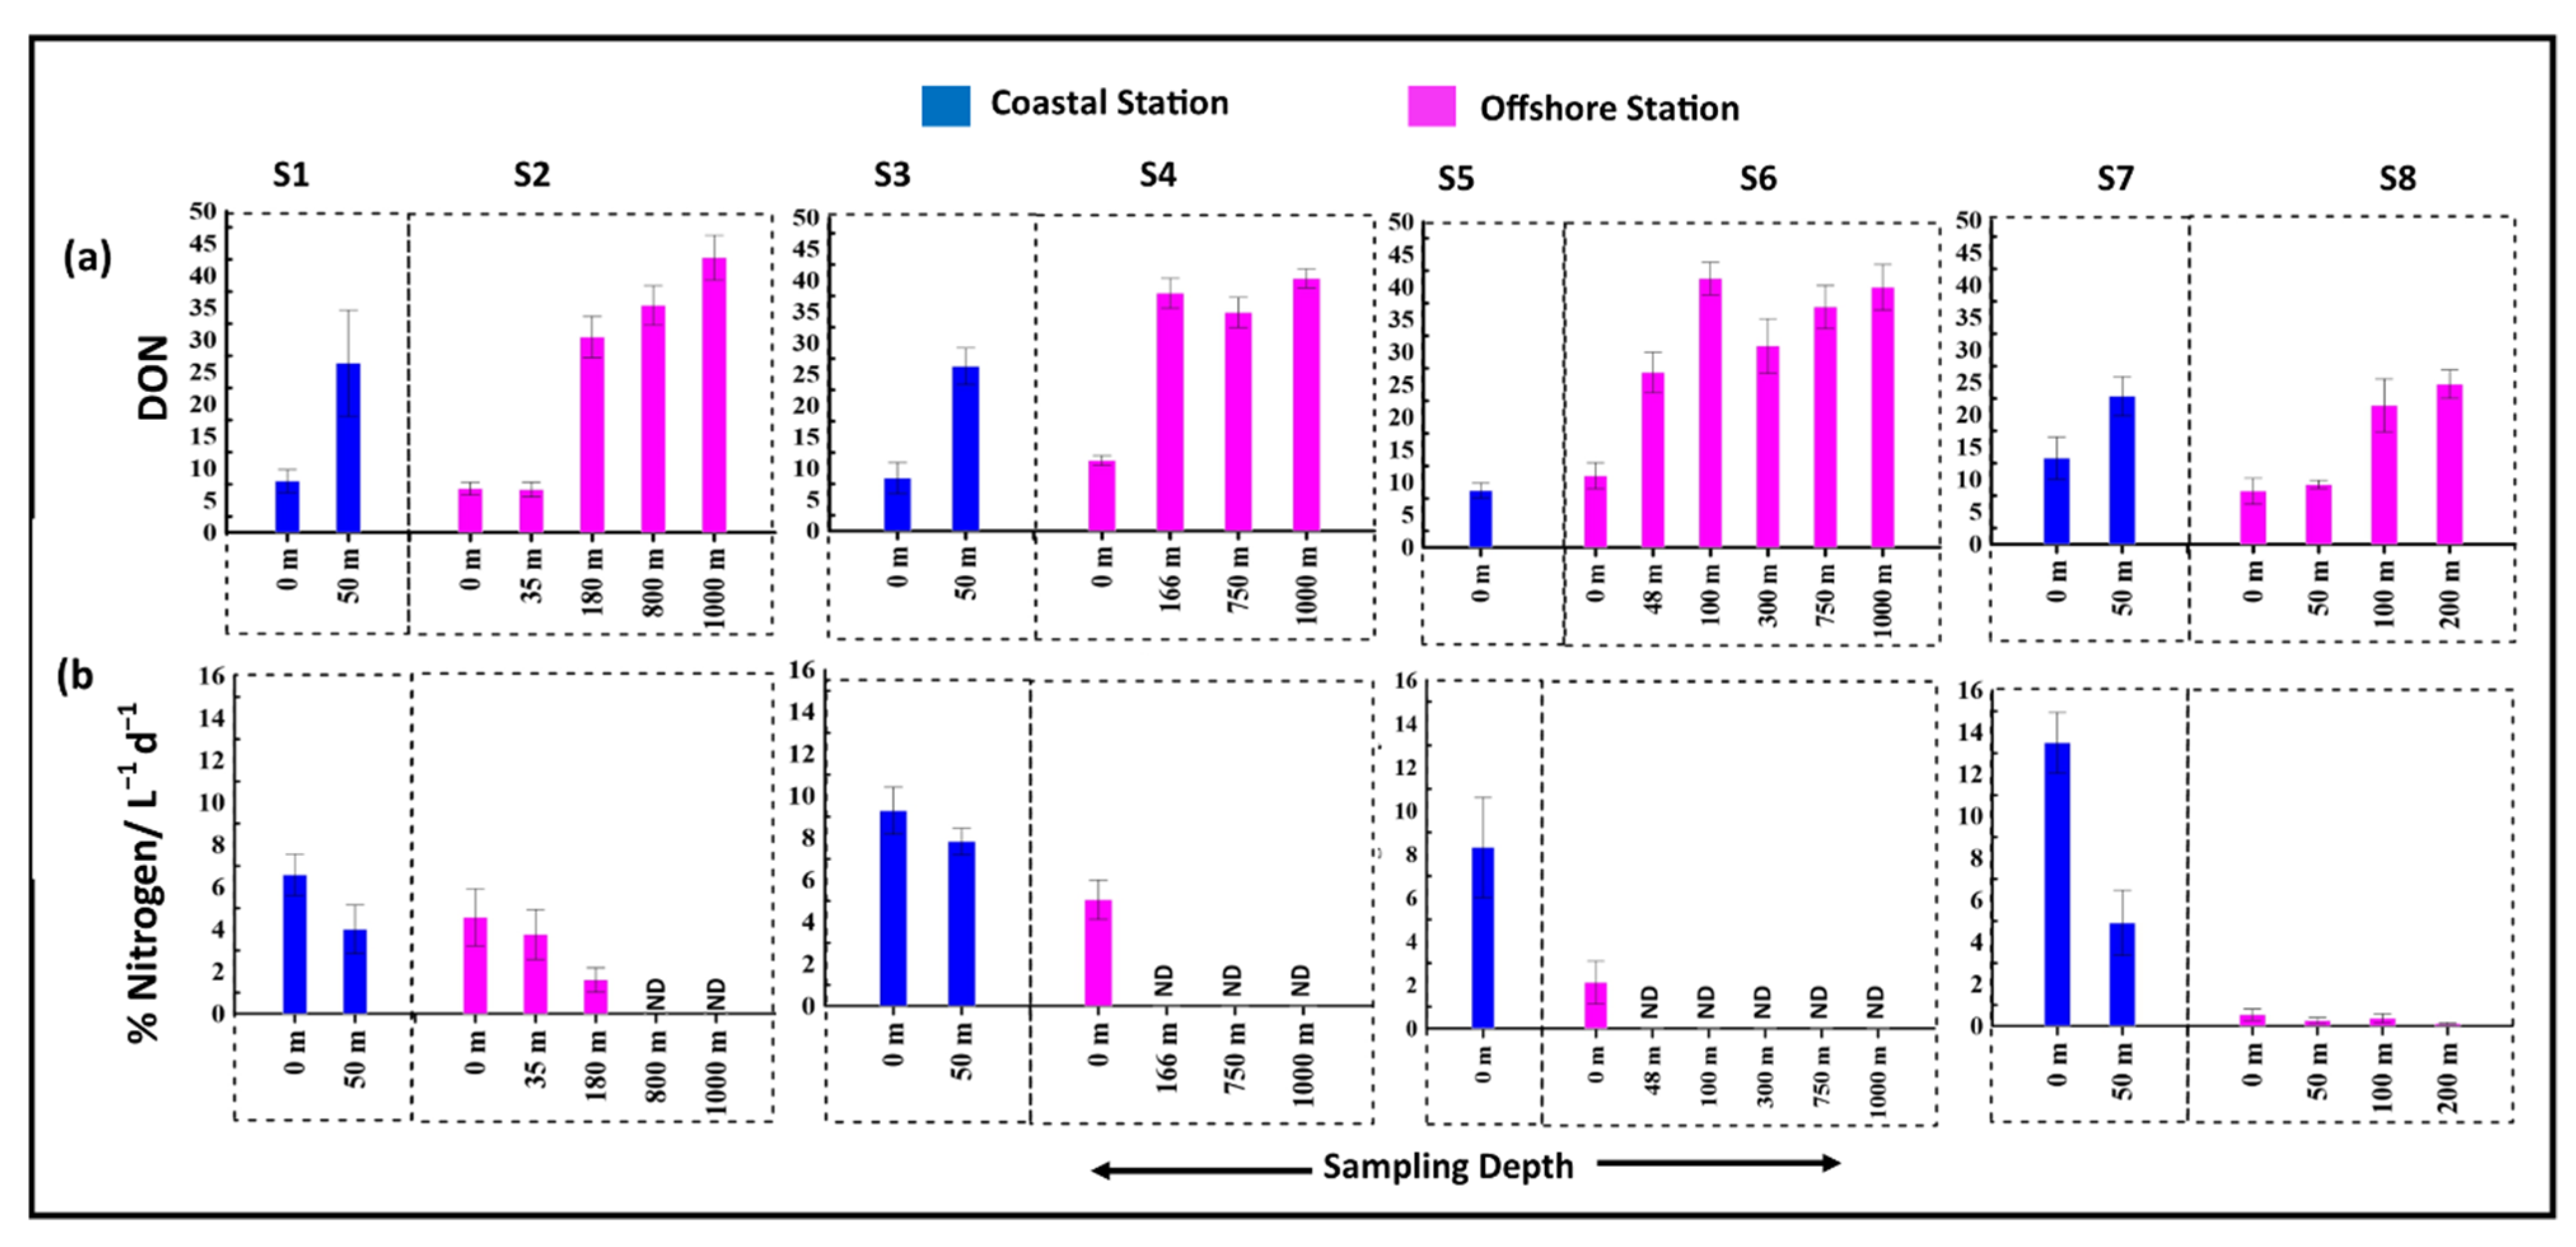
3.5. Release of Organic Carbon and Nitrogen Due to Viral Mediated Prokaryotic Mortality

An estimate of the amount of organic carbon and nitrogen released by viral lysis was calculated from the estimates of viral production. The dissolved organic carbon (DOC) in the study area was high with maximum concentration in the coastal surface waters of S3 (187.75 µM) and minimum concentration in S4 (49.83 µM at 166 m) (Figure 5a). In the case of total DOC distribution, there were negligible variations from coastal to offshore stations, but these mostly decreased from surface to deeper waters. In this study, based on assumptions made on the C and N content in the bacterial cells and calculated viral production, estimates of DOC and DON released due to viral-mediated prokaryotic lysis were calculated as previously done by Ordulj et al. [13]. Carbon released due to prokaryotic lysis ranged from 0.5 ± 0.3 to 67 ± 7.9 μM C L−1 d1, decreased from coastal to offshore. The maximum amount of carbon released was observed in the surface of S7 (67.47 ± 2 μM C L−1 d−1) and the minimum in the offshore station, S8 (0.5 ± 0.21 μM C L−1 d−1) at 200 m depth. In this study, there was no viral-mediated release of carbon after 180 m, obviously due to non-detectable viral lytic production beyond this depth. The estimated dissolved organic nitrogen (DON) released due to viral lysis was high in the offshore deeper waters and it decreased towards the coastal waters. The maximum concentration of DON was measured at 1000 m depth of S2 (42.75 µM), and the minimum at 35 m depth of S2 (6.67 µM) (Figure 6a). The estimated nitrogen released due to vial activity ranged from 0.1 ± 0.09 to 13.49 ± 1.5 μg N L−1 d−1, and the activity decreased from coastal to offshore waters. Maximum values were observed in the surface waters of S7 (13.49 µM) and minimum at 200 m of S8 (0.1 µM). The percentage contribution of carbon released by viral activity to total DOC was as high as 7.4% in the coastal surface waters of S7and DON was 3.9% in the coastal surface waters of S3 (Figure 5b and Figure 6b).

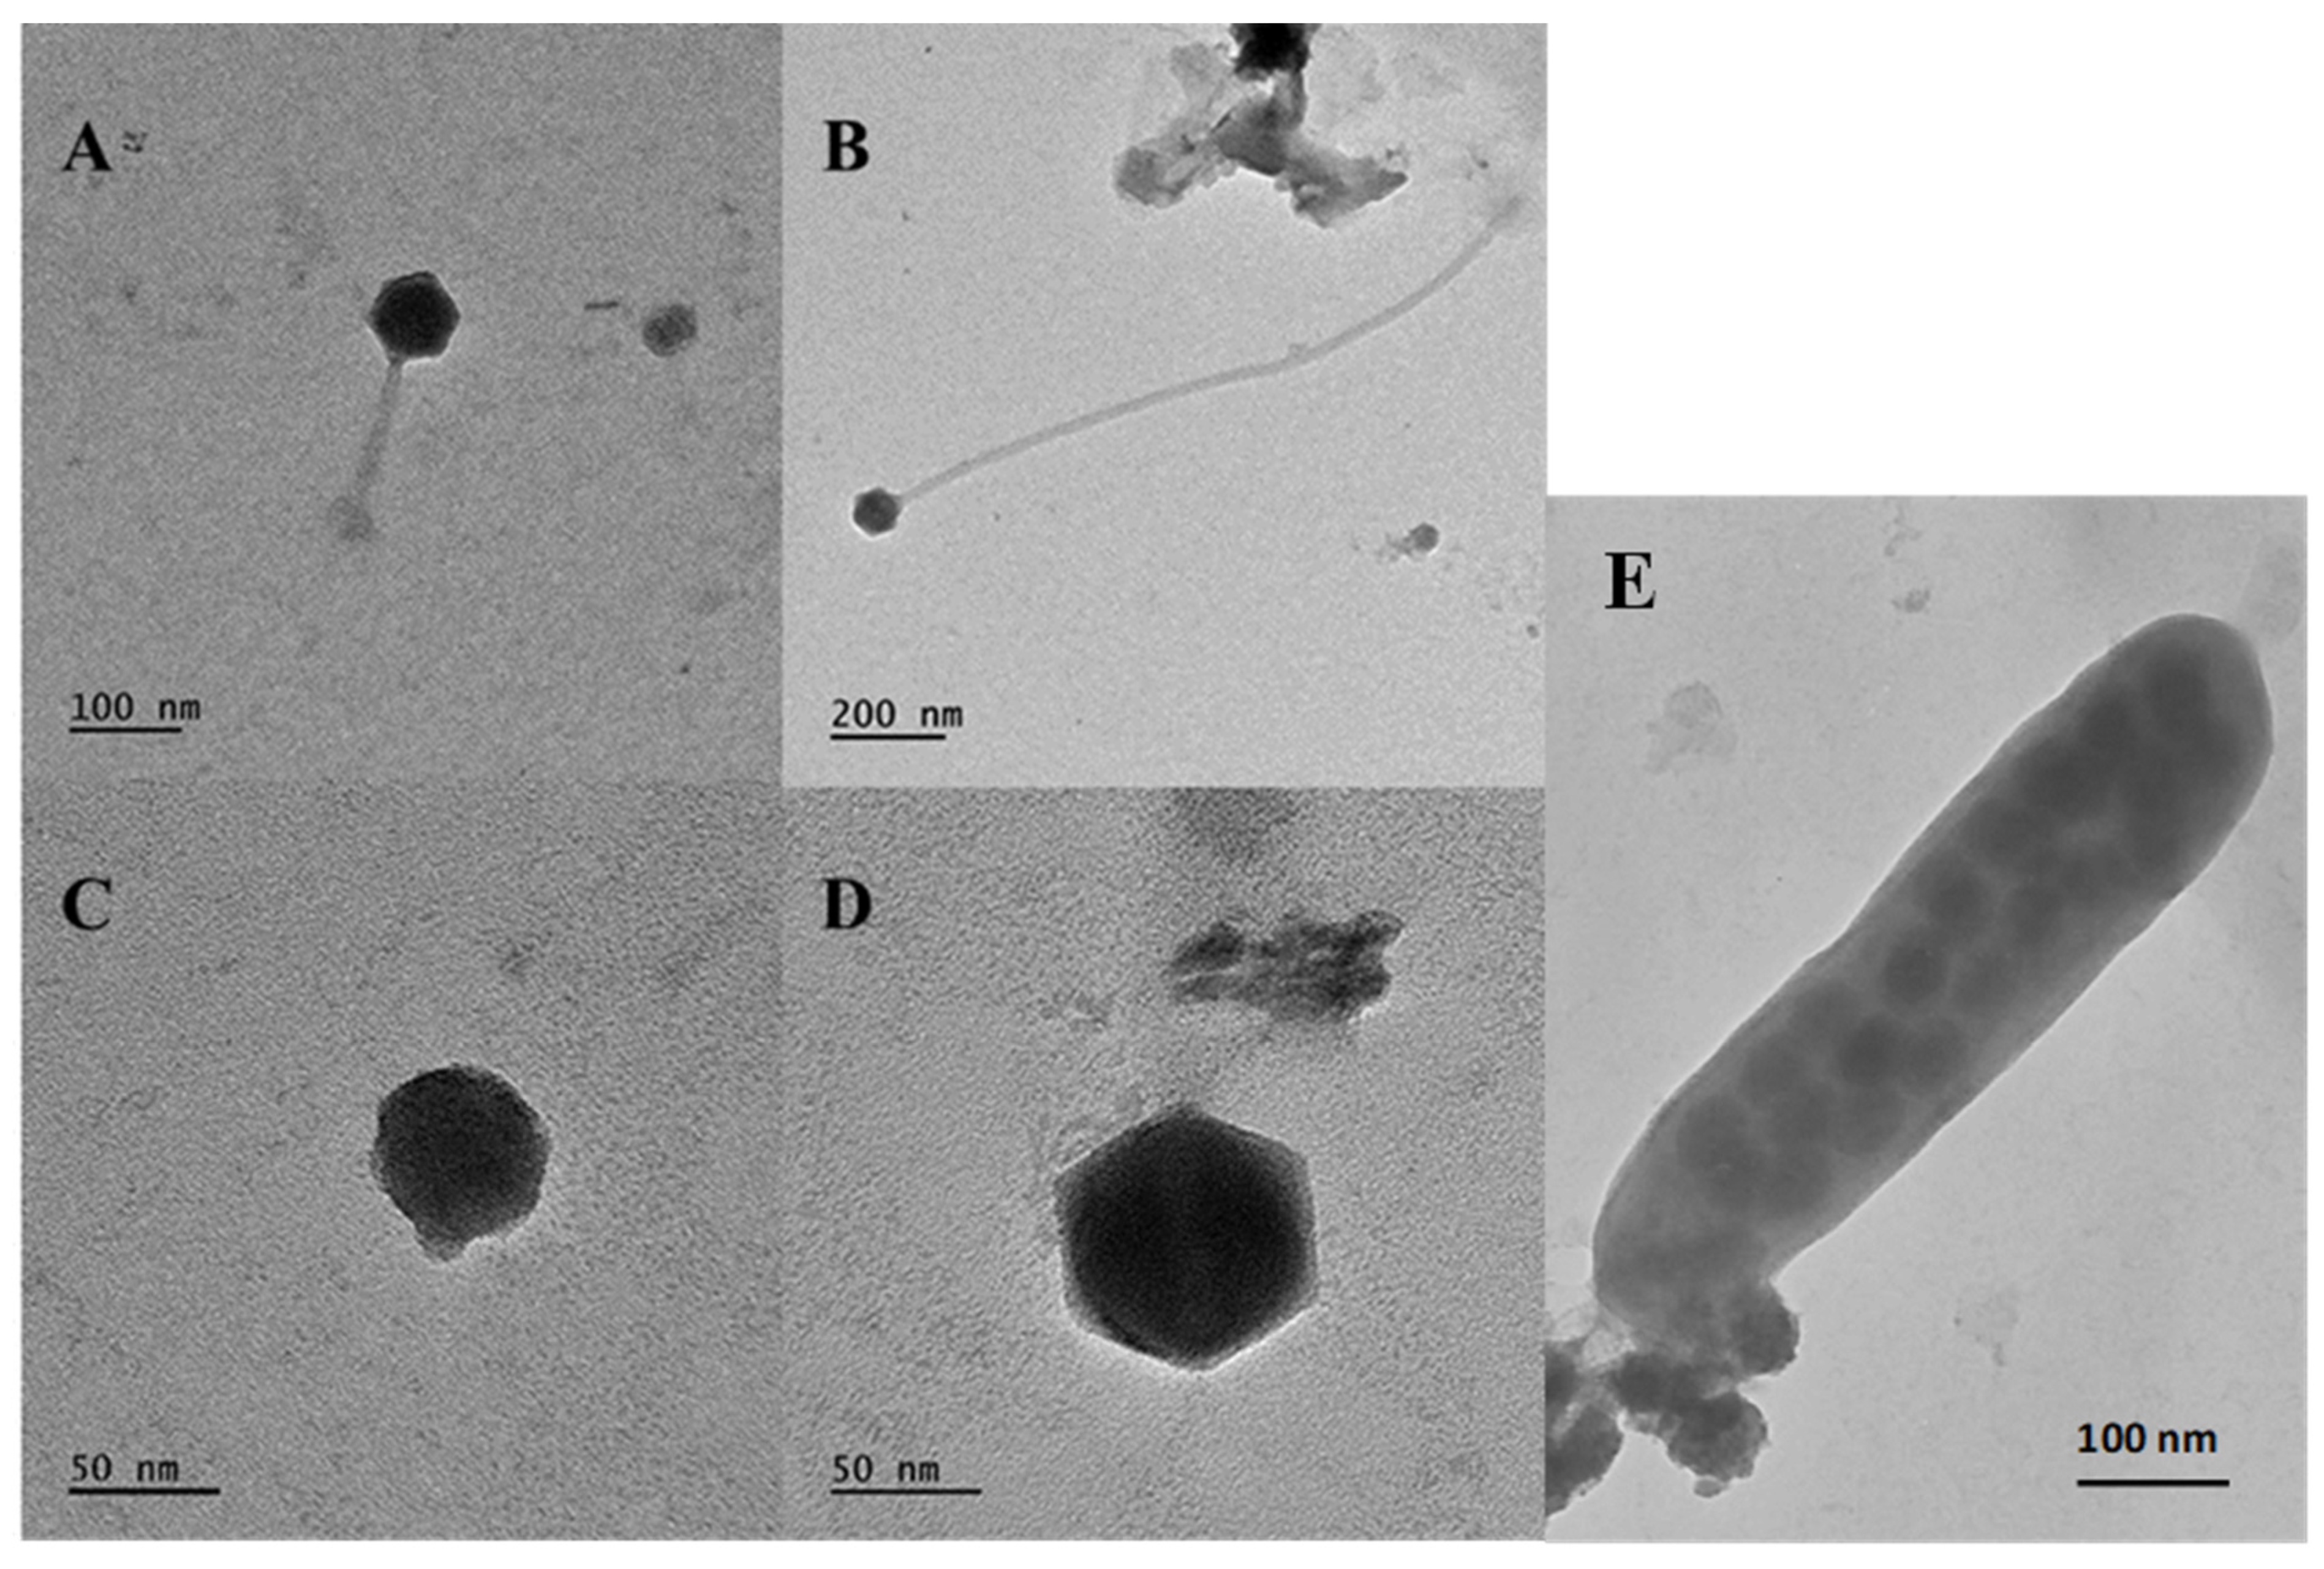
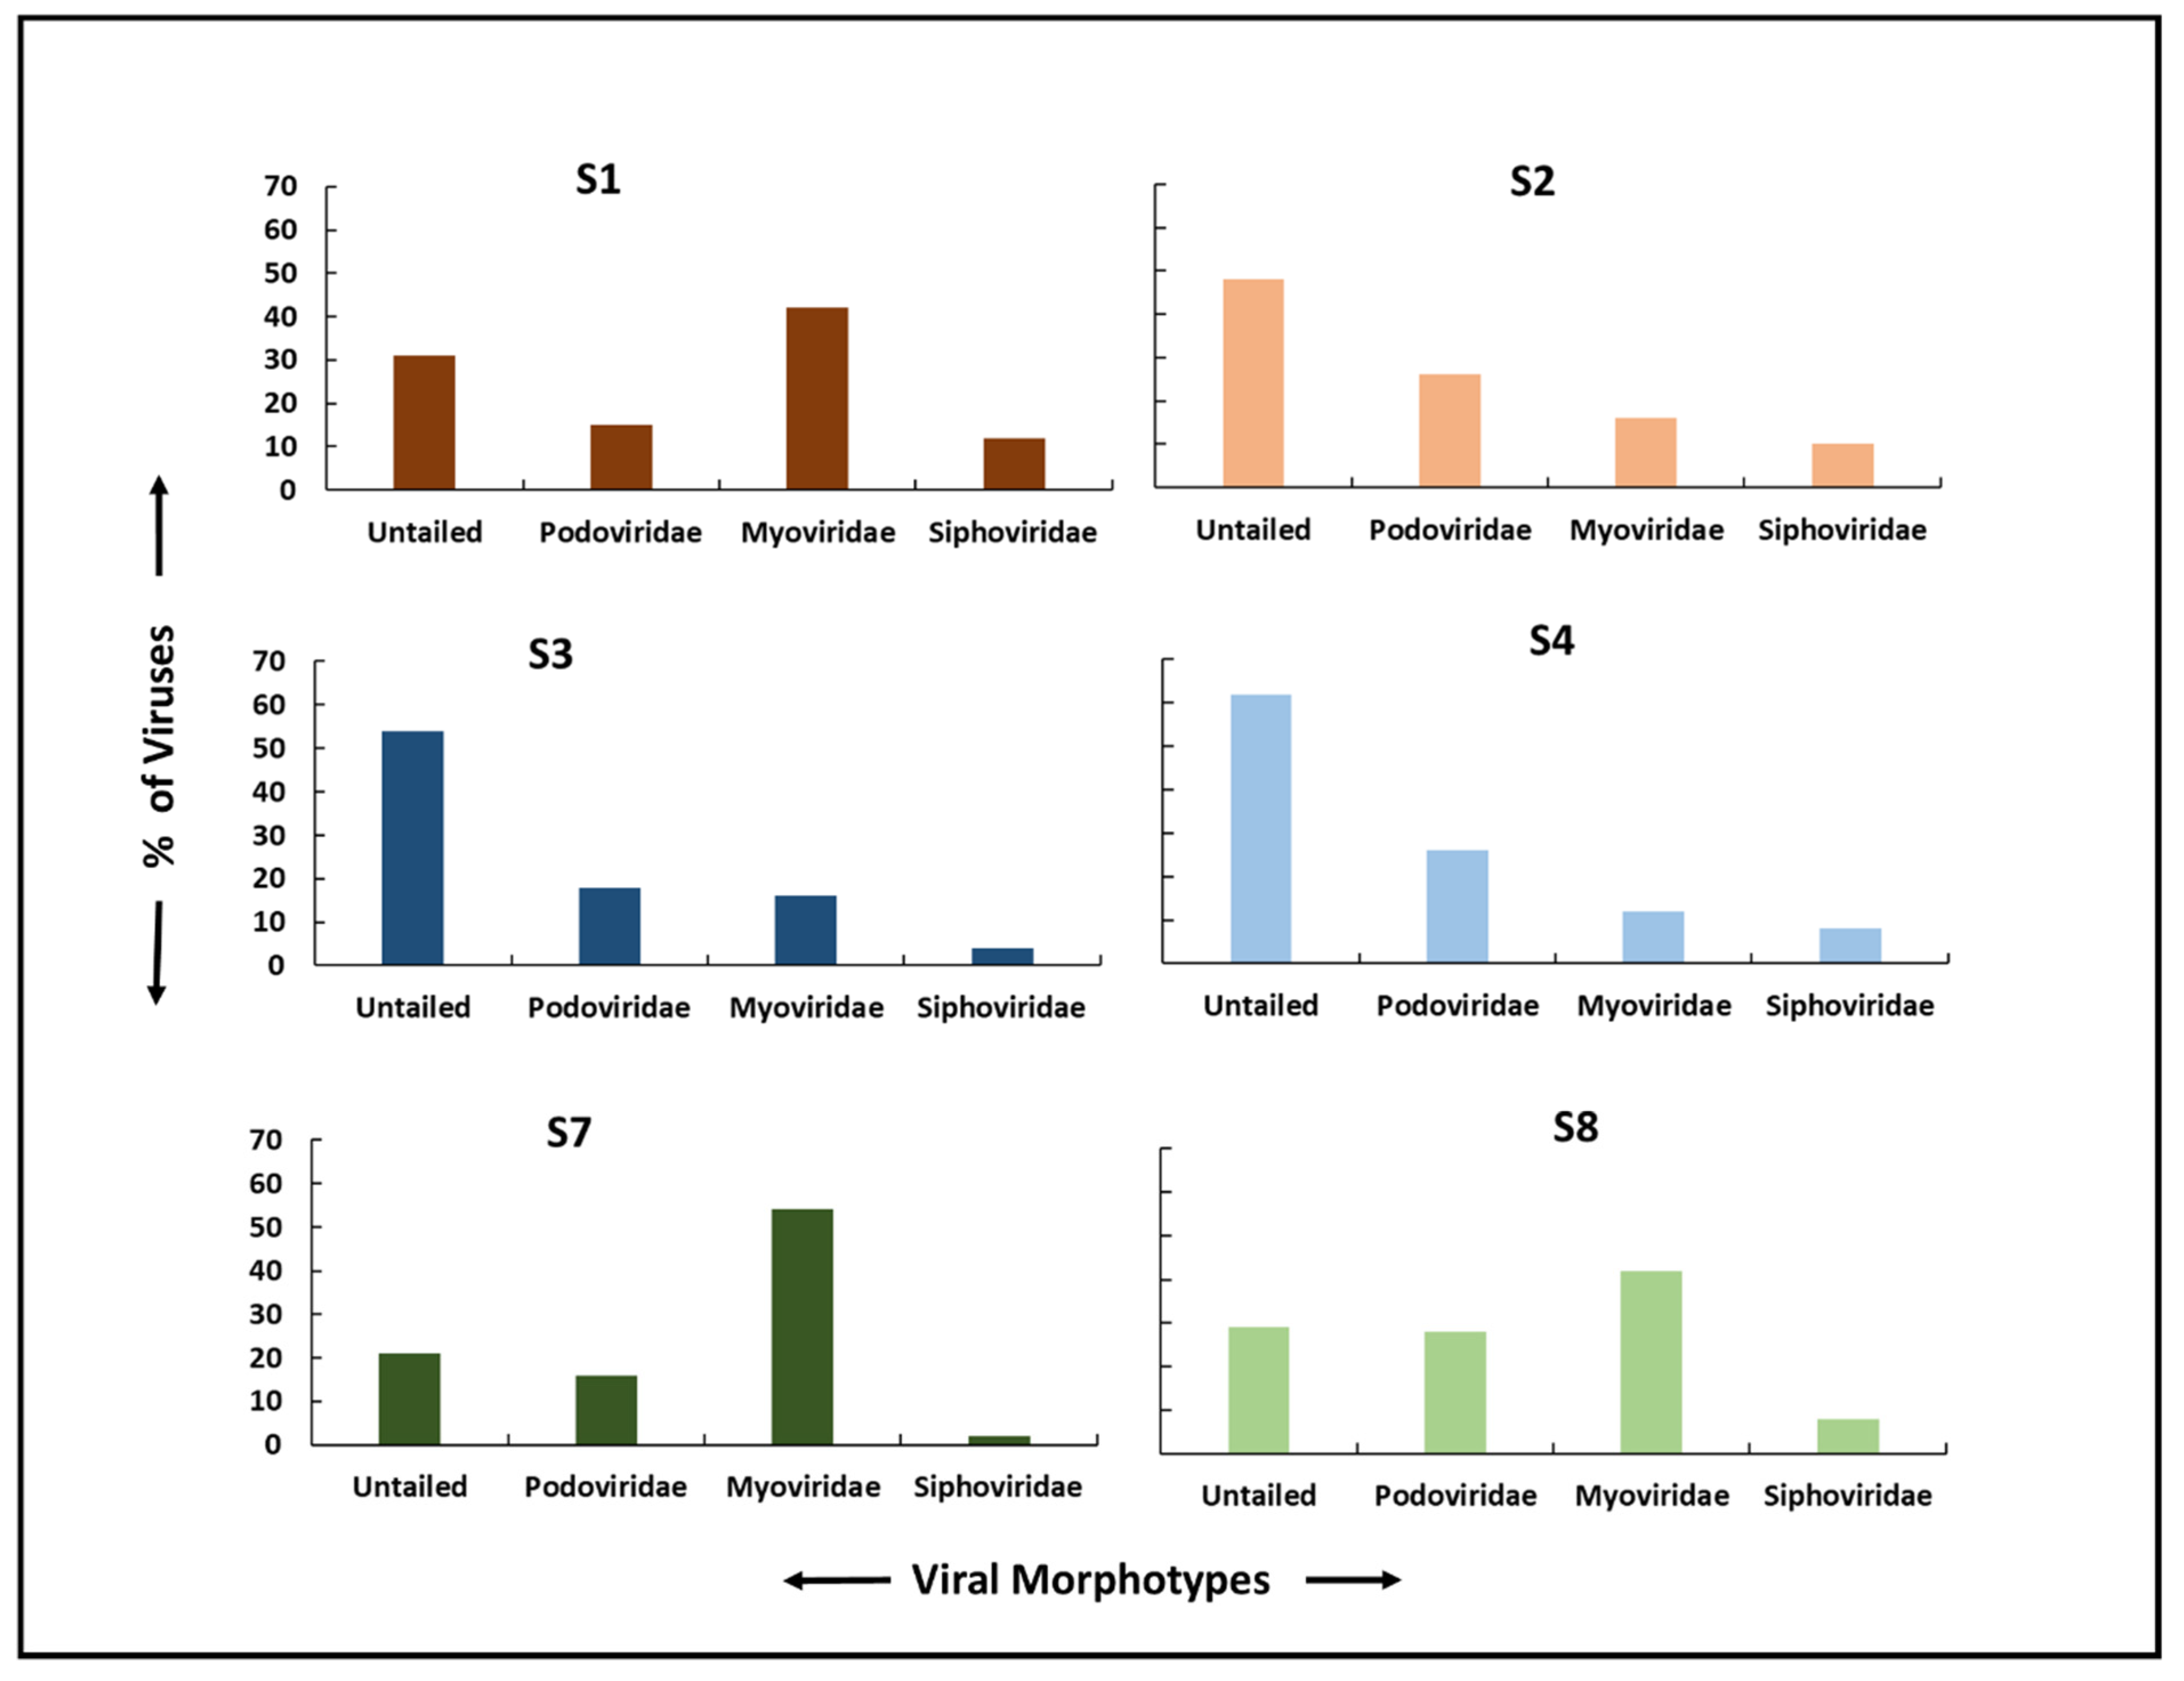
3.6. Viral Morphotypes and Size Classification

Transmission electron microscopy revealed viral morphotypes belonging to Siphoviridae (long non-contractile tail), Myoviridae (non-enveloped viruses with contractile tail), Podoviridae (short non-contractile tails), and non-tailed viruses (Figure 7). In S1 (coastal) and S2 (offshore) stations off Kochi, there was a clear difference in viral morphotype distribution, with dominance of non-tailed viruses (48%) followed by podoviruses (26%) in offshore stations and myoviruses being (42%) dominant in coastal stations followed by non-tailed viruses (31%). At S3 and S4 stations (off Mangalore), non-tailed viruses dominated (58%), whereas, in S7 and S8 stations (off Mumbai), myoviridae (48%) was found to be dominant (Figure 8). Overall, rod bacterial morphotypes were the most infected. TEM analyses indicated that >75% of the head size diameter of free-living phages was ≤60 nm suggesting that they were typical bacteriophages.

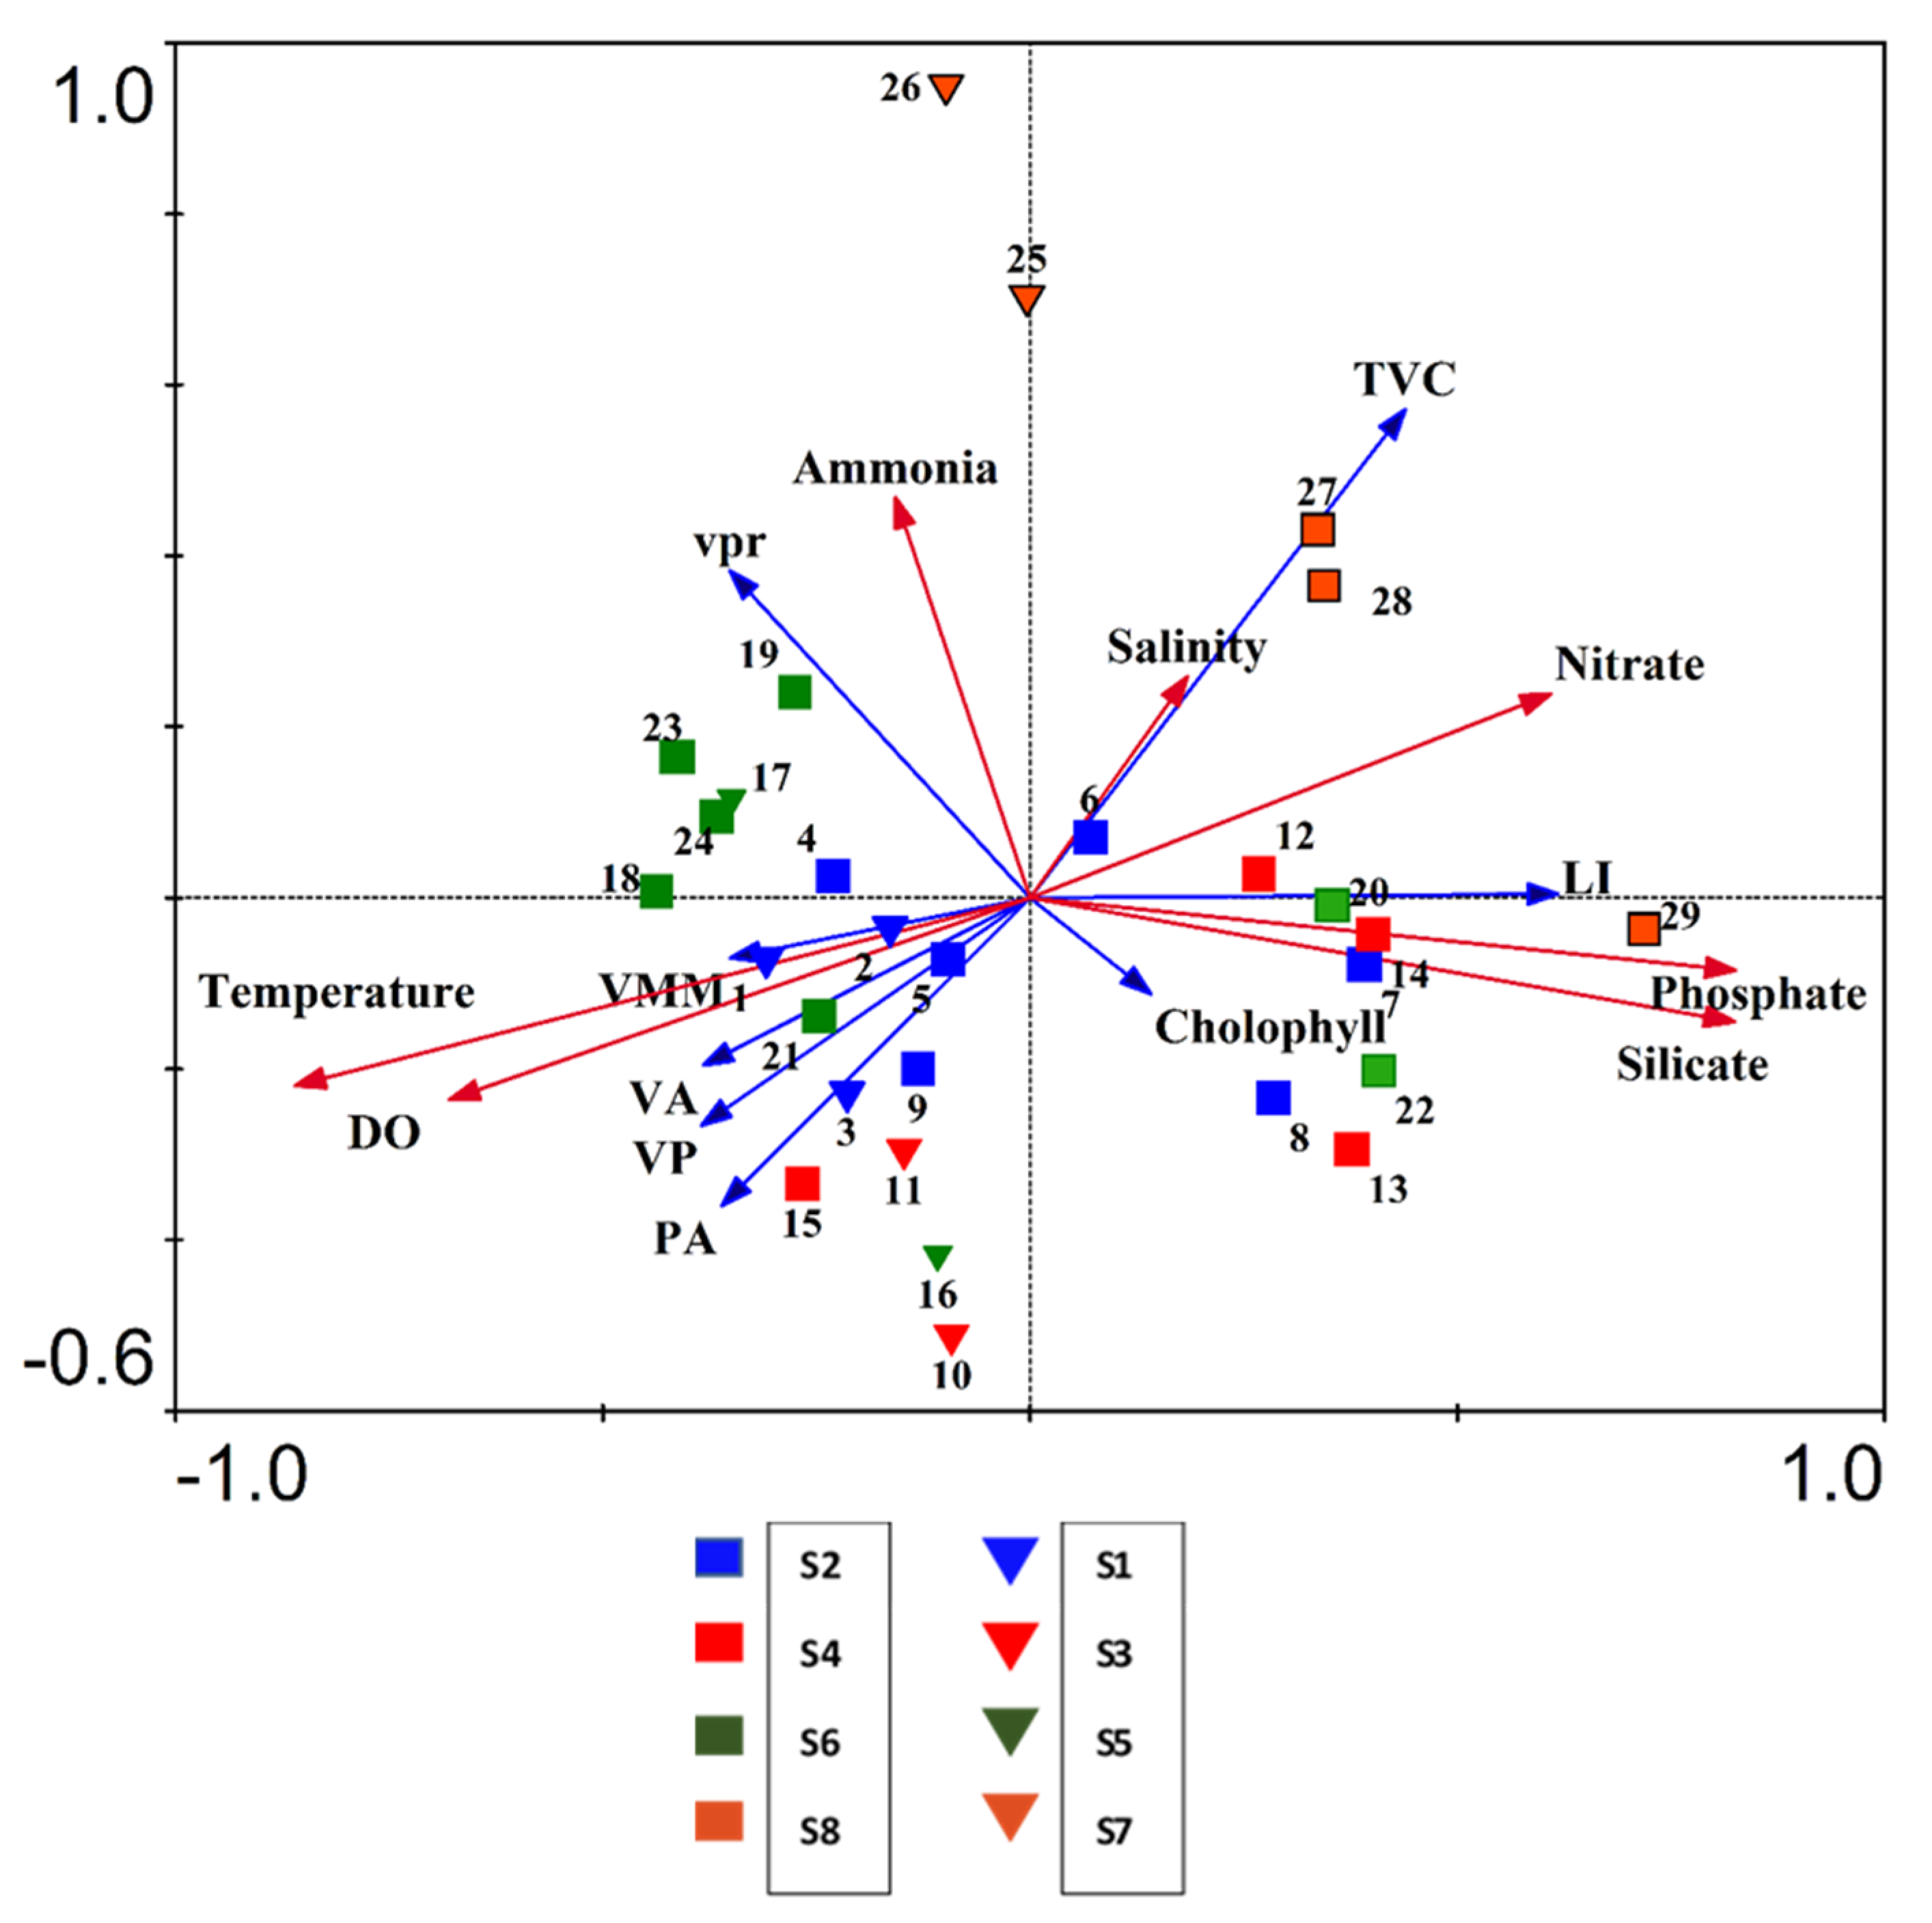
3.7. Impact of Physico—Chemical Factors on Viral Activity

Pearson correlation analysis revealed that prokaryotic abundance was the most important determinant of viral abundance (p < 0.001), followed by DO (p < 0.001), temperature (p < 0.001), and Chl a (p < 0.01). Other physicochemical variables such as phosphate, nitrate, silicate, and salinity were negatively correlated with viral abundance (Table S3). RDA was used to interpret the relationship between the biotic and abiotic variables. The ordination significance was tested with Monte Carlo permutation tests (499 unrestricted permutations) (p < 0.05). The results indicated that prokaryotic abundance, DO, temperature, and Chl a indirectly influenced the viral dynamics. The RDA results showed that salinity did not affect the viral and prokaryotic abundance (Figure 9).

4. Discussion

Investigations revealed that the Eastern Arabian Sea region experienced coastal upwelling during the study period, which brings subsurface waters to the surface. The presence of cooler hypoxic subsurface waters, together with upsloping of isotherms, indicated the presence of upwelling (Figure 2). The upwelling process starts in the deeper layers of about 90 m from the southern-most regions during April and the upwelled water reaches the surface by the end of May. Upwelling shows maximum intensity in June and July due to the presence of strong southwest monsoon winds. Upwelling gradually moves and extends towards the north due to the presence of these winds and Ekman transport. Upwelling leads to a remarkable increase in nutrient availability, phytoplankton community structure, and total productivity [34,35]. The upwelling zone on the west coast of India is economically very important because maximum fish catches are obtained during or immediately after the upwelling season [36]. The upwelling signals dwindle at the end of September due to the weakening of southwest monsoonal winds [37].
In the present study, upwelling signals were visible from 09°52.24′ N 075°54.35′ E to 18°54.64′ N 069°48.12′ E. The intensity of upwelling was high at station S1, which could be due to varying forcing, such as Ekman transport and strong southwest monsoon winds in the region [38]. The vertical distribution of temperature along 10° N and 15° N exhibited gentle upsloping of isotherms towards the coast producing colder surface waters. The down sloping of isotherms towards the coast was observed up 50 m along 10° to 13° N, and up to 100 m from 13 to 15° N. However, the manifestation of upwelling was less conspicuous towards north above 15° N latitude. These latitudinal variations also bring in variations in nutrient availability and biological productivity [38].
The studies on viral and microbial dynamics during coastal upwelling systems are very limited. Upwelling brought high saline, low temperature and nutrient rich deeper waters to the surface layers, leading to high phytoplankton production along the south eastern Arabian Sea, which in turn supported the abundance of heterotrophic microbial populations. In the present study, viral abundance, which was high in coastal waters, decreased towards offshore regions and deeper waters. Coastal upwelling can have a significant effect on viral and prokaryotic abundance [39]. Viral abundance typically ranged from 105 to 108 viral-like particles mL−1 in the surface waters of the marine environment [40]. The coastal regions are generally more productive and dynamic than offshore regions as the former continue to receive large amount of nutrient discharge from the land that supports high abundance of prokaryotic and eukaryotic organisms. The results of our study show similarity with regard to distribution of viral abundances reported from other tropical marine environments such as in the North Adriatic Sea [41], the Mediterranean Sea, the Baltic Sea [42], and other coastal and offshore regions [43,44,45] with higher abundance in coastal regions with decreasing trend towards the offshore. A recent database on viral abundance and activity known as “A global viral oceanography database (gVOD)” by Le Xie et al., also shows viral abundance in Arabian sea to be in the range of 106 VLPs mL−1 [46]. The studied region experienced upwelling-led nutrient enrichment that supported high primary and secondary production as evident from the high Chl a and high prokaryotic abundance. This vast abundance of phytoplankton biomass and prokaryotes requires a strong viral community to control the host population and functions. The viral abundance in these tropical seas was mainly influenced by prokaryotic abundance, Chl a, temperature and dissolved oxygen concentrations.
The viral to prokaryote ratio (VPR) was high in the offshore waters of Kochi and Goa, compared to coastal waters. In the productive coastal waters, high viral abundances were accompanied by disproportionately high prokaryotic numbers, resulting in a lower VPR. Low VPR values in eutrophic coastal waters could also be due to grazing by the nanoflagellates or bacterivory, adsorption to particulate matter [27], temperature [47,48], and degradation by heat-labile organic matter (e.g., enzymes) [49] and other anthropogenic activities [50]. In upwelled waters, the nutrients support the prokaryotic population which in turn facilitate viral activity and virus-mediated lysis of prokaryotic cells.
Viral production (VP) showed a similar pattern as viral abundance with high activity at coastal stations due to the high nutrient availability imparted by the riverine influx and coastal upwelling. The viral production in the coastal region was in agreement with previous studies from the Adriatic Sea [41], but lower compared to reports from the Mediterranean Sea [42]. VP rates decreased with increasing depth, similar to the Baltic Sea [42]. The VP rates along with the prokaryotic abundance and Chl a decreased drastically with depth in the mesopelagic waters (120 m). Environmental conditions directly influence host abundance which indirectly govern viral processes as they are dependent entirely on hosts. Our results indicated that viral lytic production was not detectable when the host cell concentration was lower than 1.8 × 10⁵ cells mL−1. The host cell concentrations ranged from 1.4 to 0.6 × 10⁵ cells mL−1 at stations deeper than 200 m depths. Low VP in deeper waters could be due to the lack of sufficient number of host cells to establish successful infection. Low oxygen availability, low nutrients together with low host abundance could also be responsible for low VP rates in offshore waters. Earlier studies from the same study region have also indicated the maintenance of minimum host abundance for lytic production was 5 × 10⁵ cells mL−1 [51]. Burst size represents the number of viruses released per cell upon successful viral lysis [52]. In the present study, burst size decreased from the coastal to offshore region, suggesting that increased nutrient availability leads to the faster cell growth of the prokaryotic community and larger cell size [29].
Lysogeny largely coincided with low host abundance and low nutrient concentrations, similar to those reported from oligotrophic marine systems [53]. A negative correlation of environmental parameters such as temperature, salinity, or nutrient concentrations with percent lysogeny has been observed. The temperature affects the elasticity and conformation of membrane proteins and denaturation of genetic material in viruses. Hence, the low temperature in deeper waters negatively affects the proliferation of both viruses and prokaryotes. In the present study, lytic viral production was undetectable at a temperature lower than 14 °C and prokaryotic abundance lower than 1.8 × 10⁵ cells mL−1. Lysogeny was undetectable beyond 800 m depth, at a temperature lower than 8 °C, and prokaryotic abundance lower than 6.4 × 10⁴ cells mL−1.
Viral lytic infection results in the release of dissolved organic matter (DOM), which is then available for prokaryotic uptake. In aquatic environments, the recycling of nutrients is very important to maintain ecosystem stability and nutrient cycling. Little is known about how transformation of dissolved and colloidal organic matter through viral lysis occurs in the Arabian Sea and how much amount of carbon and nitrogen are released through viral activity. Organic carbon in marine systems is generally separated into operational pools: dissolved organic carbon (DOC) and particulate organic carbon (POC). During lytic viral infection, the prokaryotic host cells release cytoplasmic components that probably cycle through the DOC pool, and the structural materials might undergo biological assimilation and cycle through the POC pool. This study estimates the amount of DOC released due to viral production through prokaryotic lysis, which otherwise would have been consumed by grazers to enter the food chain directly, as POC. Thus, the viral mediated mortality is estimated and discussed as contributors to the DOC pool, accounting to up to 64.47 µM L−1 d−1and 7.4% of organic C through viral activity. The average DOC due to VMM was higher compared to reports from NW Mediterranean Sea [54]. These estimates can have important implications in the Arabian Sea ecosystem and biogeochemical processes, suggesting that organic matter released by viral activity can serve as a significant source of energy for prokaryotes. Even though these are indirect estimates of viral activity, it does reflect the pattern of viral lysis and its impact in the coastal and offshore waters. The estimated amounts of organic carbon and nitrogen released by viral lysis were higher than those reported from central and north Adriatic Sea [42,55].

5. Conclusions

To conclude, our study demonstrates that viral distribution and their mediated activity are influenced by a multitude of factors in the Arabian Sea. Lytic viral production is high in productive eutrophic coastal waters and lysogeny predominated in the deeper waters (between 200 m to 800 m) of the offshore regions. The reproductive strategies of viruses seem to be dependent on the host abundance, nutrients, and temperature. However, lack of detection of lytic and lysogenic reproductive cycles beyond certain depths could also be due to the current methodological constraints. The results on adoption of reproductive strategies of viruses is discussed in relation to host abundance for its detection. Furthermore, the release of DOC and DON due to viral activity was estimated indirectly. Future studies must focus on direct measurements of the impact of viral lysis on hosts through dilution experiments and also additionally include the effect of flagellate grazing.

Supplementary Materials

The following supporting information can be downloaded at: https://www.mdpi.com/article/10.3390/d14030230/s1, Table S1: Geographical coordinates, location name, and depth of the study stations, S1 and S2 (Kochi coastal and offshore stations), S3 and S4 (Mangalore coastal and offshore stations), S5 and S6 (Goa coastal and offshore stations), S7 and S8 (Mumbai coastal and offshore stations); Table S2: Environmental and biological parameters of the sampling stations, S1 and S2 (Kochi coastal and offshore), S3 and S4 (Mangalore coastal and offshore stations), S5 and S6 (Goa coastal and offshore stations), S7 and S8 (Mumbai coastal and offshore stations). Temp: Temperature (°C), DO: Dissolved Oxygen (mL/L), NO3: Nitrate (µM), PO4: Phosphate (µM), NH4: Ammonia (µM), SiO4: Silicate (µM), Salinity: SAL (psu), Chlorophyll a: Chl a (mg/m3); Table S3: Pearson Correlation Table. TEMP: Water temperature (°C), DO: Dissolved oxygen (mL/L), NO3: Nitrate (µM), NH4: Ammonia (µM), PO4: Phosphate (µM), SiO4: Silicate (µM), Salinity: SAL (psu), PA: Prokaryotic abundance (105 Cells mL−1), VA: Viral abundance (107 VLP mL−1), TVC: Total viable prokaryotes (109 Cells mL−1), TVC: 105 Cells mL−1) VMM: Viral mediated Mortality: Viral Production, VPR: Virus to prokaryote ratio and Chl a: Chlorophyll a (mg/m3).

Author Contributions

Conceptualization, P.S. and A.P.; methodology, P.S. and A.P.; software, J.K.A., J.A. and P.S.; validation, A.P.; formal analysis, A.P., A.S.P.R., E.R.V., S.H. and T.S.-N.; investigation, P.S.; resources, A.P; data curation, P.S. and A.P.; writing—original draft preparation, A.P. and P.S.; writing—review and editing, A.P., A.S.P.R. and T.S.-N.; visualization, P.S. and A.P.; supervision, A.P.; project administration, A.P.; funding acquisition, A.P. All authors have read and agreed to the published version of the manuscript.

Funding

This study formed a part of the project, Marine Ecosystem Dynamics of Eastern Arabian Sea (MEDAS) GAP 3274 funded by Ministry of Earth Sciences (MoES), Government of India.

Institutional Review Board Statement

This study did not require any ethical approval.

Data Availability Statement

Data related to this work will be submitted to National Data Depository -Indian National Centre for Ocean Information Services (INCOIS), Government of India.

Acknowledgments

The authors are grateful to Department of Biotechnology, Cochin University of Science and Technology (CUSAT), CSIR-NIO, Goa, and the Scientist-in-Charge, CSIR-NIO (RC), Kochi for their support and advice. The authors are grateful to the Council of Scientific and Industrial Research (CSIR) and University Grand Commission (UGC) New Delhi, for the senior research fellowship grant. Marine Ecosystem Dynamics of eastern Arabian Sea (MEDAS) GAP 3274. The authors are grateful to the Directors of ICMAM-PD and CMLRE, Kochi, of MOES-Government of India for the financial assistance and Jyothibabu R, CSIR- NIO, PI, GAP 3274, for the financial support.

Conflicts of Interest

The authors declare that there is no conflict of interest.

References

  1. Middelboe, M.; Brussaard, C.P. Marine Viruses: Key Players in Marine Ecosystems. Viruses 2017, 9, 302. [Google Scholar] [CrossRef] [Green Version]
  2. Suttle, C.A. Marine Viruses—Major Players in the Global Ecosystem. Nat. Rev. Microbiol. 2007, 5, 801–812. [Google Scholar] [CrossRef]
  3. Wigington, C.H.; Sonderegger, D.; Brussaard, C.P.D.; Buchan, A.; Finke, J.F.; Fuhrman, J.A.; Lennon, J.T.; Middelboe, M.; Suttle, C.A.; Stock, C.; et al. Re-Examination of the Relationship between Marine Virus and Microbial Cell Abundances. Nat. Microbiol. 2016, 1, 15024. [Google Scholar] [CrossRef] [Green Version]
  4. Johannessen, T.V.; Larsen, A.; Bratbak, G.; Pagarete, A.; Edvardsen, B.; Egge, E.D.; Sandaa, R.-A. Seasonal Dynamics of Haptophytes and DsDNA Algal Viruses Suggest Complex Virus-Host Relationship. Viruses 2017, 9, 84. [Google Scholar] [CrossRef]
  5. Thingstad, T.; Heldal, M.; Bratbak, G.; Dundas, I. Are Viruses Important Partners in Pelagic Fend Webs? Trends Ecol. Evol. 1993, 8, 209–213. [Google Scholar] [CrossRef]
  6. Gerson, V.J.; Madhu, N.; Jyothibabu, R.; Balachandran, K.; Nair, M.; Revichandran, C. Oscillating Environmental Responses of the Eastern Arabian Sea. Indian J. Geo-Mar. Sci. 2014, 43, 67–75. [Google Scholar]
  7. Naqvi, S.; Noronha, R.; Somasundar, K.; Gupta, R.S. Seasonal Changes in the Denitrification Regime of the Arabian Sea. Deep Sea Res. Part Oceanogr. Res. Pap. 1990, 37, 593–611. [Google Scholar] [CrossRef]
  8. Wright, J.J.; Konwar, K.M.; Hallam, S.J. Microbial Ecology of Expanding Oxygen Minimum Zones. Nat. Rev. Microbiol. 2012, 10, 381–394. [Google Scholar] [CrossRef]
  9. Naqvi, S.; Moffett, J.; Gauns, M.; Narvekar, P.; Pratihary, A.; Naik, H.; Shenoy, D.; Jayakumar, D.; Goepfert, T.; Patra, P. The Arabian Sea as a High-Nutrient, Low-Chlorophyll Region during the Late Southwest Monsoon. Biogeosciences 2010, 7, 2091–2100. [Google Scholar] [CrossRef] [Green Version]
  10. Kumar, S.P.; Madhupratap, M.; Kumar, M.D.; Gauns, M.; Muraleedharan, P.M.; Sarma, V.V.S.S.; De Souza, S.N. Physical Control of Primary Productivity on a Seasonal Scale in Central and Eastern Arabian Sea. J. Earth Syst. Sci. 2000, 109, 433–441. [Google Scholar] [CrossRef]
  11. Sabbagh, E.I.; Huete-Stauffer, T.M.; Calleja, M.L.L.; Silva, L.; Viegas, M.; Morán, X.A.G. Weekly Variations of Viruses and Heterotrophic Nanoflagellates and Their Potential Impact on Bacterioplankton in Shallow Waters of the Central Red Sea. FEMS Microbiol. Ecol. 2020, 96, fiaa033. [Google Scholar] [CrossRef]
  12. Aparna, S.; Parvathi, A.; Jasna, V.; Ram, A.S.P.; Sime-Ngando, T. Seasonal Variations in Viral Distribution, Dynamics, and Viral-Mediated Host Mortality in the Arabian Sea. Mar. Biol. 2021, 168, 28. [Google Scholar] [CrossRef]
  13. Ordulj, M.; Krstulović, N.; Šantić, D.; Jozić, S.; Šolić, M. Viral Dynamics in Two Trophically Different Areas in the Central Adriatic Sea. Helgol. Mar. Res. 2017, 71, 1–11. [Google Scholar] [CrossRef] [Green Version]
  14. Long, A.; McDaniel, L.D.; Mobberley, J.; Paul, J.H. Comparison of Lysogeny (Prophage Induction) in Heterotrophic Bacterial and Synechococcus Populations in the Gulf of Mexico and Mississippi River Plume. ISME J. 2008, 2, 132–144. [Google Scholar] [CrossRef] [Green Version]
  15. Zeigler Allen, L.; McCrow, J.P.; Ininbergs, K.; Dupont, C.L.; Badger, J.H.; Hoffman, J.M.; Ekman, M.; Allen, A.E.; Bergman, B.; Venter, J.C. The Baltic Sea Virome: Diversity and Transcriptional Activity of DNA and RNA Viruses. MSystems 2017, 2, e00125-16. [Google Scholar] [CrossRef] [Green Version]
  16. Liang, Y.; Wang, L.; Wang, Z.; Zhao, J.; Yang, Q.; Wang, M.; Yang, K.; Zhang, L.; Jiao, N.; Zhang, Y. Metagenomic Analysis of the Diversity of DNA Viruses in the Surface and Deep Sea of the South China Sea. Front. Microbiol. 2019, 10, 1951. [Google Scholar] [CrossRef] [Green Version]
  17. Hurwitz, B.L.; Sullivan, M.B. The Pacific Ocean Virome (POV): A Marine Viral Metagenomic Dataset and Associated Protein Clusters for Quantitative Viral Ecology. PLoS ONE 2013, 8, e57355. [Google Scholar] [CrossRef]
  18. Brum, J.R.; Schenck, R.O.; Sullivan, M.B. Global Morphological Analysis of Marine Viruses Shows Minimal Regional Variation and Dominance of Non-Tailed Viruses. ISME J. 2013, 7, 1738–1751. [Google Scholar] [CrossRef] [Green Version]
  19. Jasna, V.; Parvathi, A.; Pradeep Ram, A.S.; Balachandran, K.K.; Madhu, N.V.; Nair, M.; Jyothibabu, R.; Jayalakshmy, K.V.; Revichandran, C.; Sime-Ngando, T. Viral-Induced Mortality of Prokaryotes in a Tropical Monsoonal Estuary. Front. Microbiol. 2017, 8, 895. [Google Scholar] [CrossRef]
  20. Jasna, V.; Parvathi, A.; Aswathy, V.; Aparna, S.; Dayana, M.; Aswathy, A.; Madhu, N. Factors Determining Variations in Viral Abundance and Viral Production in a Tropical Estuary Influenced by Monsoonal Cycles. Reg. Stud. Mar. Sci. 2019, 28, 100589. [Google Scholar]
  21. Grasshoff, K.; Kremling, K.; Ehrhardt, M. Methods of Seawater Analysis; John Wiley & Sons: Hoboken, NJ, USA, 2009; ISBN 3-527-61399-4. [Google Scholar]
  22. Grasshoff, K. Determination of Nitrite. Methods Sea Water Anal. 1983, 1, 139–142. [Google Scholar]
  23. Gupta, G.V.M.; Thottathil, S.D.; Balachandran, K.K.; Madhu, N.V.; Madeswaran, P.; Nair, S. CO2 Supersaturation and Net Heterotrophy in a Tropical Estuary (Cochin, India): Influence of Anthropogenic Effect: Carbon Dynamics in Tropical Estuary. Ecosystems 2009, 12, 1145–1157. [Google Scholar] [CrossRef]
  24. Patel, A.; Noble, R.T.; Steele, J.A.; Schwalbach, M.S.; Hewson, I.; Fuhrman, J.A. Virus and Prokaryote Enumeration from Planktonic Aquatic Environments by Epifluorescence Microscopy with SYBR Green I. Nat. Protoc. 2007, 2, 269–276. [Google Scholar] [CrossRef] [Green Version]
  25. Joux, F.; Lebaron, P. Ecological Implications of an Improved Direct Viable Count Method for Aquatic Bacteria. Appl. Environ. Microbiol. 1997, 63, 3643–3647. [Google Scholar] [CrossRef] [Green Version]
  26. Wilhelm, S.W.; Brigden, S.M.; Suttle, C.A. A Dilution Technique for the Direct Measurement of Viral Production: A Comparison in Stratified and Tidally Mixed Coastal Waters. Microb. Ecol. 2002, 43, 168–173. [Google Scholar] [CrossRef]
  27. Hewson, I.; Fuhrman, J.A. Covariation of Viral Parameters with Bacterial Assemblage Richness and Diversity in the Water Column and Sediments. Deep Sea Res. Part Oceanogr. Res. Pap. 2007, 54, 811–830. [Google Scholar] [CrossRef]
  28. Evans, C.; Archer, S.D.; Jacquet, S.; Wilson, W.H. Direct Estimates of the Contribution of Viral Lysis and Microzooplankton Grazing to the Decline of a Micromonas spp. Population. Aquat. Microb. Ecol. 2003, 30, 207–219. [Google Scholar] [CrossRef] [Green Version]
  29. Weinbauer, M.G.; Suttle, C.A. Lysogeny and Prophage Induction in Coastal and Offshore Bacterial Communities. Aquat. Microb. Ecol. 1999, 18, 217–225. [Google Scholar] [CrossRef] [Green Version]
  30. Fukuda, R.; Ogawa, H.; Nagata, T.; Koike, I. Direct Determination of Carbon and Nitrogen Contents of Natural Bacterial Assemblages in Marine Environments. Appl. Environ. Microbiol. 1998, 64, 3352–3358. [Google Scholar] [CrossRef] [Green Version]
  31. Pradeep Ram, A.; Arnous, B.; Danger, M.; Carrias, J.-F.; Lacroix, G.; Sime-Ngando, T. High and Differential Viral Infection Rates within Bacterial ‘Morphopopulations’ in a Shallow Sand Pit Lake (Lac de Créteil, France). FEMS Microbiol. Ecol. 2010, 74, 83–92. [Google Scholar] [CrossRef] [Green Version]
  32. Weinbauer, M.G.; Winter, C.; Höfle, M.G. Reconsidering Transmission Electron Microscopy Based Estimates of Viral Infection of Bacterio-Plankton Using Conversion Factors Derived from Natural Communities. Aquat. Microb. Ecol. 2002, 27, 103–110. [Google Scholar] [CrossRef] [Green Version]
  33. Brum, J.R.; Ignacio-Espinoza, J.C.; Roux, S.; Doulcier, G.; Acinas, S.G.; Alberti, A.; Chaffron, S.; Cruaud, C.; De Vargas, C.; Gasol, J.M. Patterns and Ecological Drivers of Ocean Viral Communities. Science 2015, 348, 1261498. [Google Scholar] [CrossRef] [Green Version]
  34. Barth, O.M. Estudos Sobre a Contrastacao Negativa de Suspensoes Virais. Rev. Bras. Biol. 1984, 44, 71–80. [Google Scholar]
  35. Karnan, C.; Jyothibabu, R.; Arunpandi, N.; Albin, K.J.; Parthasarathi, S.; Krishnan, S.S. Response of Microplankton Size Structure to Summer Stratification, Freshwater Influx and Coastal Upwelling in the Southeastern Arabian Sea. Cont. Shelf Res. 2020, 193, 104038. [Google Scholar] [CrossRef]
  36. Habeebrehman, H.; Prabhakaran, M.; Jacob, J.; Sabu, P.; Jayalakshmi, K.; Achuthankutty, C.; Revichandran, C. Variability in Biological Responses Influenced by Upwelling Events in the Eastern Arabian Sea. J. Mar. Syst. 2008, 74, 545–560. [Google Scholar] [CrossRef]
  37. Sharma, G.S. Upwelling off the Southwest Coast of India. Indian J. Mar. Sci. 1978, 7, 209–218. [Google Scholar]
  38. Gupta, G.; Sudheesh, V.; Sudharma, K.; Saravanane, N.; Dhanya, V.; Dhanya, K.; Lakshmi, G.; Sudhakar, M.; Naqvi, S. Evolution to Decay of Upwelling and Associated Biogeochemistry over the Southeastern Arabian Sea Shelf. J. Geophys. Res. Biogeosci. 2016, 121, 159–175. [Google Scholar] [CrossRef] [Green Version]
  39. Eissler, Y.; Letelier, J.; Cuevas, L.A.; Morales, C.E.; Escribano, R. The Microbial Community in the Coastal Upwelling System off Concepción, Chile, 36 S, 2002–2003 Period. Rev. Biol. Mar. Oceanogr. 2010, 45, 1–18. [Google Scholar] [CrossRef]
  40. Corinaldesi, C.; Crevatin, E.; Del Negro, P.; Marini, M.; Russo, A.; Fonda-Umani, S.; Danovaro, R. Large-Scale Spatial Distribution of Virioplankton in the Adriatic Sea: Testing the Trophic State Control Hypothesis. Appl. Environ. Microbiol. 2003, 69, 2664–2673. [Google Scholar] [CrossRef] [Green Version]
  41. Bongiorni, L.; Magagnini, M.; Armeni, M.; Noble, R.; Danovaro, R. Viral Production, Decay Rates, and Life Strategies along a Trophic Gradient in the North Adriatic Sea. Appl. Environ. Microbiol. 2005, 71, 6644–6650. [Google Scholar] [CrossRef] [Green Version]
  42. Weinbauer, M.G.; Brettar, I.; Höfle, M.G. Lysogeny and Virus-induced Mortality of Bacterioplankton in Surface, Deep, and Anoxic Marine Waters. Limnol. Oceanogr. 2003, 48, 1457–1465. [Google Scholar] [CrossRef] [Green Version]
  43. Cochlan, W.P.; Wikner, J.; Steward, G.F.; Smith, D.C.; Azam, F. Spatial Distribution of Viruses, Bacteria and Chlorophyll a in Neritic, Oceanic and Estuarine Environments. Mar. Ecol. Prog. Ser. 1993, 92, 77. [Google Scholar] [CrossRef]
  44. Weinbauer, M.G.; Fuks, D.; Peduzzi, P. Distribution of Viruses and Dissolved DNA along a Coastal Trophic Gradient in the Northern Adriatic Sea. Appl. Environ. Microbiol. 1993, 59, 4074–4082. [Google Scholar] [CrossRef] [Green Version]
  45. He, L.; Yin, K.; Yuan, X.; Li, D.; Zhang, D.; Harrison, P.J. Spatial Distribution of Viruses, Bacteria and Chlorophyll in the Northern South China Sea. Aquat. Microb. Ecol. 2009, 54, 153–162. [Google Scholar] [CrossRef] [Green Version]
  46. Xie, L.; Wei, W.; Cai, L.; Chen, X.; Huang, Y.; Jiao, N.; Zhang, R.; Luo, Y.-W. A Global Viral Oceanography Database (GVOD). Earth Syst. Sci. Data 2021, 13, 1251–1271. [Google Scholar] [CrossRef]
  47. Bettarel, Y.; Sime-Ngando, T.; Bouvy, M.; Arfi, R.; Amblard, C. Low Consumption of Virus-Sized Particles by Heterotrophic Nanoflagellates in Two Lakes of the French Massif Central. Aquat. Microb. Ecol. 2005, 39, 205–209. [Google Scholar] [CrossRef] [Green Version]
  48. Garza, D.; Suttle, C.A. The Effect of Cyanophages on the Mortality of Synechococcus spp. and Selection for UV Resistant Viral Communities. Microb. Ecol. 1998, 36, 281–292. [Google Scholar] [CrossRef]
  49. Noble, R.T.; Fuhrman, J. Virus Decay and Its Causes in Coastal Waters. Appl. Environ. Microbiol. 1997, 63, 77–83. [Google Scholar] [CrossRef] [Green Version]
  50. Clasen, J.L.; Brigden, S.M.; Payet, J.P.; Suttle, C.A. Evidence That Viral Abundance across Oceans and Lakes Is Driven by Different Biological Factors. Freshw. Biol. 2008, 53, 1090–1100. [Google Scholar] [CrossRef]
  51. Parvathi, A.; Jasna, V.; Aparna, S.; Pradeep Ram, A.S.; Aswathy, V.K.; Balachandran, K.K.; Muraleedharan, K.R.; Mathew, D.; Sime-Ngando, T. High Incidence of Lysogeny in the Oxygen Minimum Zones of the Arabian Sea (Southwest Coast of India). Viruses 2018, 10, 588. [Google Scholar] [CrossRef] [Green Version]
  52. Beman, J.M.; Shih, J.L.; Popp, B.N. Nitrite Oxidation in the Upper Water Column and Oxygen Minimum Zone of the Eastern Tropical North Pacific Ocean. ISME J. 2013, 7, 2192–2205. [Google Scholar] [CrossRef] [Green Version]
  53. Wilhelm, S.W.; Suttle, C.A. Viruses and Nutrient Cycles in the Sea: Viruses Play Critical Roles in the Structure and Function of Aquatic Food Webs. BioScience 1999, 49, 781–788. [Google Scholar] [CrossRef] [Green Version]
  54. Boras, J.A.; Sala, M.M.; Vázquez-Domínguez, E.; Weinbauer, M.G.; Vaqué, D. Annual Changes of Bacterial Mortality Due to Viruses and Protists in an Oligotrophic Coastal Environment (NW Mediterranean). Environ. Microbiol. 2009, 11, 1181–1193. [Google Scholar] [CrossRef]
  55. Karuza, A.; Del Negro, P.; Crevatin, E.; Umani, S.F. Viral Production in the Gulf of Trieste (Northern Adriatic Sea): Preliminary Results Using Different Methodological Approaches. J. Exp. Mar. Biol. Ecol. 2010, 383, 96–104. [Google Scholar] [CrossRef]
Figure 1. Sampling locations in the Arabian Sea (depth contour for 50 m and 1000 m). S1–S8 represent stations, S1 and S2 (Kochi coastal and offshore), S3 and S4 (Mangalore coastal and offshore), S5 and S6 (Goa coastal and offshore), S7 and S8 (Mumbai coastal and offshore). Image was drawn by using the software QGIS Version 3.14 (Quantum GIS) (Free and Open-Source Geographic Information System. http://qgis.osgeo.org).
Diversity 14 00230 g001
Figure 2. Vertical distribution of temperature in the study area indicating upsloping of isotherms in stations, S1 and S2 (Kochi coastal and offshore stations), S3 and S4 (Mangalore coastal and offshore stations), S5 and S6 (Goa coastal and offshore stations), and S7 and S8 (Mumbai coastal and offshore stations). The colour gradient represents variations in temperature. Contour lines indicates the isotherms.
Diversity 14 00230 g002
Figure 3. Represent the (a) prokaryotic abundance (105 Cells mL−1) (b) Viral abundance (107 VLPs mL−1) (c) Virus to Prokaryotic Ratio (VPR) in the Y axis; Whereas X axis represent the station depths, S1 and S2 (Kochi coastal and offshore stations), S3 and S4 (Mangalore coastal and offshore stations), S5 and S6 (Goa coastal and offshore stations), S7 and S8 (Mumbai coastal and offshore stations). Dotted lines separate the coastal and offshore stations of each transect.
Diversity 14 00230 g003
Figure 4. Represent the (a) Viral Production (109 VLPs L−1d−1) (b) VMM (%) (c) Percentage lysogeny at various stations in the Y axis; Whereas X axis represent the station depths, S1 and S2 (Kochi coastal and offshore stations), S3 and S4 (Mangalore coastal and offshore stations), S5 and S6 (Goa coastal and offshore stations), S7 and S8 (Mumbai coastal and offshore stations). Dotted lines separate the coastal and offshore stations of each transect.
Diversity 14 00230 g004
Figure 5. Represent the (a) Distribution of DOC (µM) (b) Amount of organic carbon release through viral activity (%) at various stations in Y axis; Whereas X axis represent the station depths, S1 and S2 (Kochi coastal and offshore stations), S3 and S4 (Mangalore coastal and offshore stations), S5 and S6 (Goa coastal and offshore stations), S7 and S8 (Mumbai coastal and offshore stations). Dotted lines separate the coastal and offshore stations of each transect.
Diversity 14 00230 g005
Figure 6. Represent the (a) Distribution of DON (µM), (b) Amount of organic Nitrogen release through viral activity (%) at various stations, in Y axis; Whereas X axis represent the station depths, S1 and S2 (Kochi coastal and offshore stations), S3 and S4 (Mangalore coastal and offshore stations), S5 and S6 (Goa coastal and offshore stations), S7 and S8 (Mumbai coastal and offshore stations). Dotted lines for separating the coastal and offshore stations of each transect.
Diversity 14 00230 g006
Figure 7. Transmission electron micrographs of viral morphotypes belonging to (A) Myoviridae (scale bar is 100 nm), (B) Siphoviridae (scale bar is 200 nm), (C) Podoviride (scale bar is 50 nm), (D) non-tailed viruses (scale bar is 50 nm) and (E) Rod shaped bacteria with viruses (scale bar is 100 nm).
Diversity 14 00230 g007
Figure 8. Represent the transmission electron microscopy of different viral morphotypes (in percentage). X axes represent the viral morphotypes and Y axis represent the % of viruses in following stations, S1 and S2 (Kochi coastal and offshore stations), S3 and S4 (Mangalore coastal and offshore stations) and S7 and S8 (Mumbai coastal and offshore stations). S5 and S6 (Goa coastal and offshore) were not sampled due to technical reasons.
Diversity 14 00230 g008
Figure 9. RDA biplot representing the relationship between biological parameters (blue lines) and environmental parameters (red lines) in the eastern Arabian Sea. Temperature (°C), DO: Dissolved Oxygen (mL/L), Nitrate (µM), Phosphate (µM), Silicate (µM), Salinity (psu), Chlorophyll a, VA: Viral abundance (107 VLPs mL−1), PA: Prokaryotic abundance (105 Cells mL−1), TVC: Total viable Count (TVC), VPR: Virus to prokaryote ratio, VP: Viral production (109 VLPs L−1d−1), LI: Lysogenic Induction. Triangle with solid color represents the coastal and squares with solid represent the offshore stations. Numbers represent the station depths (0 m—1, 3, 8, 10, 14, 16, 23, 25; 50 m—2, 9, 15, 17, 24, 26; 35 m—4; 166 m—11; 180 m—5; 200 m—28; 300 m—19; 500 m—20; 750 m—12, 2; 800 m—6; 1000 m—7, 13, 22).
Diversity 14 00230 g009
Publisher’s Note: MDPI stays neutral with regard to jurisdictional claims in published maps and institutional affiliations.

