Communication

Microsatellite Genotyping of Two Bulgarian Sheep Breeds

1
Research Centre of Stockbreeding and Agriculture, Agricultural Academy, 4700 Smolyan, Bulgaria
2
Department of Animal Diversity and Resources, Institute of Biodiversity and Ecosystem Research, Bulgarian Academy of Sciences, 1113 Sofia, Bulgaria
*
Author to whom correspondence should be addressed.
Diversity 2022, 14(3), 210; https://doi.org/10.3390/d14030210
Submission received: 1 February 2022 / Revised: 8 March 2022 / Accepted: 10 March 2022 / Published: 11 March 2022
(This article belongs to the Special Issue Biodiversity Research in Bulgaria)

Abstract

:
The aim of this study was to compare the genetic structure and genetic diversity of two Bulgarian sheep breeds. A total of 41 individuals from a modern Bulgarian sheep population (Rhodopean Tsigai, RT) and 46 representatives of a local Bulgarian sheep population (Middle Rhodopean Sheep, MRS) were investigated based on 12 STR (short tandem repeat, also known as microsatellite) markers. In total, 121 alleles were found in the two populations using 12 microsatellite loci. The mean number of alleles, the effective number of alleles, and the polymorphism information content (PIC) values per loci were 10.08, 4.96, and 0.73, respectively. When comparing the allelic diversity across the populations, the highest Na was observed in the MRS breed (10.58 ± 0.87), while the value of this parameter in the RT breed was 9.58 ± 0.71. The largest genetic diversity was found at locus INRA005 with 14.5 alleles and the smallest polymorphism was noted for locus ETH152 with 5.5 alleles. The level of observed heterozygosity was in the range of 0.60 to 0.860. The expected heterozygosity level range was 0.62 to 0.87. When 12 microsatellite loci were compared, the INRA005 locus showed the highest level of genetic variability. Using Nei’s standard genetic distance, the observed genetic distance between the RT and MRS breeds was 0.103. Both sheep breeds demonstrated mixed genetic profiles based on the studied microsatellite markers. The clustering obtained by STRUCTURE analysis showed that the MRS breed is a more homogenous population, whereas the RT breed is more heterogenous.

Graphical Abstract

1. Introduction

Considering the ever-changing dynamics of today’s reality, it is hard to anticipate what kind of animal breeds will be necessary tomorrow, what their productivity will be, what human needs for food substances should be provided for, and what will be required by the society and the common people thereof [1,2,3]. It has already been proposed that increasing only animal productivity should not be the final aim, and that the quality of particular animal products, designed for people, should be more important. In fact, people all over the world are becoming more and more demanding and looking for wholesome and healthy food [1,2]. Scientists keep on proving the beneficial effect of climatic and natural conditions upon the wholesomeness of animal production and, respectively, upon human health. The most important goal regarding animal breeds in future is to ensure that they are highly resistant to diseases and very well adapted to the conditions in every region, including the typical plant resources, so that breeds can express their production qualities in the best possible way [4,5].
Preservation of genetic diversity, especially in the context of breeding sheep that are well adapted to local conditions, resistant to diseases, healthy, and yielding milk, isrelated to the thousands of years long process of agriculture throughout the history of ancient human civilization [6,7]. The geographic location and the natural and climatic conditions of Bulgaria are favorable prerequisites for sheep breeding. The diversity in terms of nature and climate conditions in the different regions of the country has contributed to the creation of a significant number of indigenous breeds adapted to specific local conditions [8,9]. In Bulgaria, there are around 34 breeds of sheep, 17 of which are defined as autochthonous [10,11].
One of the local sheep breeds in Bulgaria is the Middle Rhodopean Sheep (MRS). This breed is common in the region of the Western, Middle, and Eastern Rhodopes. The sheep are bred in small- to medium-sized flocks [12]. Before the Second World War, a large number of these and other local breeds had been grazing on the high mountain pastures of the Rhodope Mountains in the summer and in the plains of the Aegean Thrace in the winter.
According to Hlebarov [13], the MRS has the lowest live weight compared to other local breeds in Bulgaria. The fleece of most of the animals is open or semi-open, with a fuselage construction and coarse wool (cabarlyavi), but there are animals with an almost closed fleece (rudavi). About 60–70% of the sheep are white and about 30–40% are brown, grey, and black [14]. The MRS can refer to short- and thin-tailed sheep breeds. It is closer to the Zackel than to the Tsigai. The MRS is highly mobile, can travel long distances, and graze in highly sloping areas unavailable to other farm animals. In general, the MRS is a combined type of breed, raised for wool, meat, and milk production. The population size is 8716 individuals, which defines the risk status as not in danger of extinction [15].
The sheep of the local breeds are of relatively low productivity. However, they are extremely valuable as a unique unrepeatable genetic resource that must be preserved. Most of these breeds are not an object of breeding activities. Selection work is only aimed at the conservation of the genetic resources, genotyping of the breed population structure, and increasing the number of the animals beyond the risk of extinction limit [16,17].
By cross-breeding local semi-mountain and mountain sheep breeds with introduced rams from the world’s best breeds of sheep producing wool (Merinoflaish, Stavropol, Caucasian, Askanian, Australian Merino, New Zealand Corriedale, Lincoln, etc.), a large number of modern sheep breeds have been created to meet the market’s need for wool [15].
A typical representative of fine soft wool sheep breeds is the Tsigai. This is an ancient sheep breed, widely distributed in different regions of Central, Eastern, and Southern Europe [18]. It is assumed that the breed belongs with similar types of sheep domesticated in ancient Anatolia. According to Schandl [19], the Tsigai type of sheep appeared for the first time in Central Europe during the second half of the 18th century. In Bulgaria, the Tsigai breed appeared for the first time before the Second World War [19]. As a result of the specific conditions in the regions of our country and the significant differences between the local breeds used in the breeding process, two types of Tsigai have emerged—one in Northern and southwestern Bulgaria (Staroplaninski Tsigai) and another in Southern Bulgaria (Rhodopean Tsigai).
The Rhodopean Tsigai was created in the mountainous parts of the Rhodopes, Rila, Pirin, Sredna Gora, and the Strandzha–Sakar region. Assimilative and reproductive cross-breeding between the local sheep bred in the respective areas and the introduced Tsigai rams was carried out. Male animals of mainly Azov type (Soviet Tsigai variants) were used because of their higher fertility, precocity, and meat-producing qualities. The Rhodopean Tsigai was officially recognized as a breed in 1992. With the significant increase in the use of artificial fibers and fabrics made from them at the beginning of the present century, there has been a sharp decrease in the demand for wool, which in turn has led to a reduction in the populations of wool-producing sheep breeds in Bulgaria [20,21].
This negative trend has affected the Rhodopean Tsigai as well. In Bulgaria, the number of these Tsigai populations is decreasing. According to Kukovics and Jávor [22], in 2006 the size of the population was about 8000 animals, and by 2017 it had decreased about two times—to 3896 [23].
One of the most commonly used techniques for elucidating the genetic structure and genetic identification of different breeds of sheep is genotyping using microsatellite markers [24,25]. Microsatellites or short tandem repeats (STRs) are well-known DNA markers, which have been used in a variety of applications requiring highly polymorphic and locus-specific genetic systems—for example, in paternity testing, linkage analysis, population and evolutionary genetics, calculation of genetic distances and inbreeding rates, and detection of genetic admixture [26,27]. Microsatellites are usually present in large quantities throughout eukaryotic genomic DNA (coding and non-coding nuclear and organellar DNA) and serve as a very useful tool for genetic mapping [28,29]. They are highly polymorphic, stable, and inherited co-dominantly [30,31].
Local breeds of farm animals are usually relatively less productive than intensively selected, specialized breeds. On the other hand, they are able to use low-nutrient feed, usually located in hard-to-reach areas where other breeds cannot survive. As a result of many years of selection, mainly under the influence of environmental factors, local breeds of farm animals are well adapted to the specific climatic and geographical conditions of the distribution area. They are characterized by increased resistance to many endemic diseases for a particular region. The uncontrolled cross-breeding of local sheep breeds in recent decades has led to a reduction in genetic diversity and loss of valuable genetic resources in the country.
Therefore, the aim of the current study was: (i) to evaluate the genetic diversity of two Bulgarian sheep breeds—one a modern sheep breed, namely, the Rhodopean Tsigai, and one local breed, uninvestigated so far, the Middle Rhodopean Sheep—and (ii) to evaluate the purity of the local breed and the possible influence of genetic admixture with other breeds.

2. Materials and Methods

2.1. Ethical Statement

All experimental procedures have been reviewed and approved by the Animal Research Ethics Committee of the Bulgarian Food Safety Agency (BFSA) (Identification code 154 Art. 381 of the Law on Veterinary Activity) in accordance with the European Union Directive 86/609.

2.2. Animal Sampling and DNA Isolation

A total of 87 blood samples were collected from one indigenous and one modern sheep breed, 41 of which were taken from the Rhodopean Tsigai (RT) and 47 from the Middle Rhodopean Sheep (MRS). Samples from the MRS sheep and the RT breed were collected from three different flocks from each breed to avoid sampling related individuals. Unrelated animals were selected by the pedigree record in the Association for Breeding of Middle Rhodopean Sheep, Karakachan Sheep, Rhodopean Tsigai and Karakachan Horse (Smolyan, Bulgaria).
Blood samples were collected from the vena jugularis into vacutainer tubes (Venoject®, Terumo, Lakewood, CA, USA), with K2EDTA used as an anticoagulant. The samples were placed in a cooler bag and transported immediately to a laboratory, where they were stored at −20 °C prior to DNA extraction.
The breeds have different habitats in Bulgaria (Figure 1). The RT breed belongs to a long, thin-tailed, and fat-tailed group of sheep breeds. It may be noted that the main area of distribution of the RT breed is Southern Bulgaria—the foothills and mountainous parts of the country. The population size is about 100,000 animals, which shows that the breed is not at risk of extinction.
The total DNA was isolated with DNeasy Blood & Tissue Kits (Cat. no. 69504, QIAGEN, Hilden, Germany), according to the manufacturer’s instructions. The quantity and quality of the extracted DNA were checked spectrophotometrically (Qubit® 3.0 Fluorometer, Thermo Fisher Scientific Inc., Waltham, MA, USA) and by 1% agarose gel electrophoresis in 1X TAE buffer staining with SimpliSafe™ (Cat. no. E4600, EURx Ltd., Gdansk, Poland) under UV light. The DNA was stored at −20 °C until PCR amplifications.

2.3. Microsatellite Markers

A set of twelve microsatellite markers was chosen, taking into consideration their level of allelic polymorphism and the location on different chromosomes, preferably unlinked, following the recommendations of the Food and Agriculture Organization (FAO) (http://www.fao.org/dad-is/ (accessed on 12 September 2021)) [32] and the International Society for Animal Genetics (ISAG) (http://www.isag.org.uk/Docs/2005_PanelsMarkersSheepGoats.Pdf (accessed on 23 November 2021)) [33] (Table 1).

2.4. PCR Amplification and Fragment Analysis

An Animaltype Sheep kit (Biotype GmbH, Dresden, Germany) for multiplex analysis of 12 microsatellite markers was used to perform PCR reactions. All PCR reactions were carried out in a total volume of 20 µL that contained 20 ng DNA template, 10 µL 2X Phusion HF Buffer (Thermo Fisher Scientific Inc., Waltham, MA, USA), 10 pmol of each primer (forward and reverse), and miliQ H20 up to the final volume. Forward primers for amplification of the microsatellite loci were labelled on their 5′ end, while using one of the following fluorescent dyes: VIC, PET, or FAM. The mulitiplex PCR reactions were carried out on a Veriti® Thermal Cycler (Thermo Fisher Scientific Inc., Waltham, MA, USA) under the following conditions: initial denaturation at 94 °C for 3 min, followed by 35 cycles with the following steps: 95 °C for 10 s, 57 °C for 30 s, and 68 °C for 1 min, and finally, extension at 68 °C for 7 min. The amplified PCR products were electrophoresed on an automated ABI PRISM® 3500 Genetic Analyzer (Applied Biosystem, Foster City, CA, USA) using size standard S550—a lyophilized mixture of fluorescent-labeled DNA fragments of different sizes, labeled with spectral analogue LIZ 500. The fragment length data were obtained using Gene Mapper software® v5.0.

2.5. Statistical Analysis

The number of alleles per locus (Na), the effective number of alleles (Ne), the mean number of alleles (Nm), the polymorphic information content (PIC), the observed heterozygosity (Ho), the expected heterozygosity (He), the Shannon’s information index (I), the Hardy–Weinberg equilibrium and heterozygote deficit (FIS) per locus across breeds, and the markers were calculated with GenAlEx 6.5 (New Brunswick, NJ, USA) [34]. Wright’s F-statistics (FIT, FIS, FST) [35] were calculated using POPGENE software [36]. The Nei’s gene diversity (HT), the diversity between populations (DST), and the coefficient of gene differentiation (GST) values were calculated with FSTAT 2.9.4 [37].
The STRUCTURE 2.3.4 software was utilized in order to assess the degree of population differentiation within and between the two populations [38]. Individuals were assigned into clusters using the Bayesian method under an admixture model. The simulation was run ten times for each value of K (2–12), where K was the number of tested clusters. All runs were performed with a length of 50,000, followed by 150,000 Markov chain Monte Carlo (MCMC) repeats after burn-in, with 20 replicate runs for each K, using an admixture model and independent allele frequencies. For determination of the optimal number of groups (K), we applied both the log-likelihood method of Prichard et al. [38] as well as the ΔK value of Evanno et al. [39], and each number of clusters was calculated and plotted using the Structure Harvester v 0.6.94 application (http://taylor0.biology.ucla.edu/structureHarvester/ (accessed on 12 September 2021)) [40]. The software Clumpak (http://clumpak.tau.ac.il/ (accessed on 12 September 2021)) was utilized to align multiple replicates for each K so as to facilitate the interpretation of the clustering results [41]. The DISTRUCT application was used in order to display the results graphically [42]. The factorial correspondence analysis (FCA) for the evaluation of the number of genetic groups was performed by GENETIX® software [43].

3. Results and Discussion

3.1. Population Genetic Diversity Based on Microsatellite Markers

All the markers were found to be polymorphic in the whole population. The mean number of alleles ranged from 5.5 at locus ETH152 to 14.5 at locus INRA005, where the average mean number of alleles (Na) was 10.08 (Table 2).
The expected heterozygosity (He), which is acknowledged as the best parameter of genetic diversity in the population, varied from 0.62 at locus McM042 to 0.86 at locus INRA005, with 0.77 average He across the populations for the analyzed 12 microsatellite loci. The observed heterozygosity (Ho) fluctuated from 0.60 at locus McM042 to 0.86 at locus INRA005, with a population mean of 0.76 (RT) and 0.73 (MRS), indicating that the two breeds are characterized by considerable genetic variability.
The polymorphic information content (PIC) varied from 0.44 for the marker McM042 to 0.88 for the INRA005 locus. The average PIC for the 12 microsatellite markers was 0.73, and there were no markers with PIC of less than 0.5 (except locus McM042); hence, all loci were found to be highly polymorphic.
The polymorphism information content (PIC) of microsatellite markers is of major importance in selecting markers for genetic diversity studies in breeds and populations [44,45]. In this research, the average PIC value (0.73) as well as the high average number of alleles per locus (Na) have shown that the selected panel of 12 STR markers is suitable for investigation of the genetic diversity in Bulgarian sheep. Thus, the CSRD247 locus (14 alleles), INRA023, and MAF214 (12 alleles) can be regarded as the most informative markers of our set (Table 2). The Shannon’s information (diversity) index (I), which is an indicator of the genetic diversity of a population, ranged from 1.35 at locus McM042 to 2.32 at the INRA005 marker (Table 2). The average value of I for both populations was 1.79, which means that entropies increasingly emphasize the most abundant alleles.
The average FIS value was 0.033 (p = 0.002) (Table 2). Only one marker, MAF214, revealed FIS values higher than 0.1 (FIS = 0.11). The FIT fixation index, used for measuring the heterozygosity loss of the individuals with respect to the overall population, was 0.05 (p = 0.004), showing a 5% general deficit of heterozygous individuals in the sheep population. The mean FST index, used for measuring the degree of genetic differentiation between the two breeds, was 0.01. This value showed that all of the genetic variation was related due to differences among individuals (99%) and only 1% was a result of differences between the breeds. These results indicate that the genetic differentiation between the studied breeds is extremely low.
The calculated mean DST value, which describes the diversity between the populations, was 0.06. The general mean of the GST value determining the gene differentiation coefficient was 0.01. Nei’s gene diversity (HT) was in a range between 0.63 and 0.89 (Table 2).
The parameters FST and FIT over the loci and samples showed considerably low values (Table 2). The low FST value is indicative of a lack of prominent differentiation between the local breeds, which could be a result of the common history and breeding practices. Furthermore, the admixture could be due to the high flow of genes between the two studied breeds, most likely due to the involvement of indigenous animals from the MRS in the creation of the RT breed. In contrast to the studied breeds, other Bulgarian sheep breeds have shown much higher values of FST [16,44,45,46]. The FIS value for the overall population (0.033) is lower than the values found in other indigenous Bulgarian sheep breeds [16,47], Tunisian sheep breeds [48], and Moroccan sheep breeds [49], but higher than those observed in Turkish sheep breeds [50] and the Cuban Pelibuey sheep breed [51]. The FIS values from our study have not indicated the heterozygous deficiency observed in most other similar studies, which may be explained by the Wahlund effect (due to subdivision among flocks) and the cross-breeding resulting from a lack of control by the breeders regarding the distribution area of each breed [52,53].

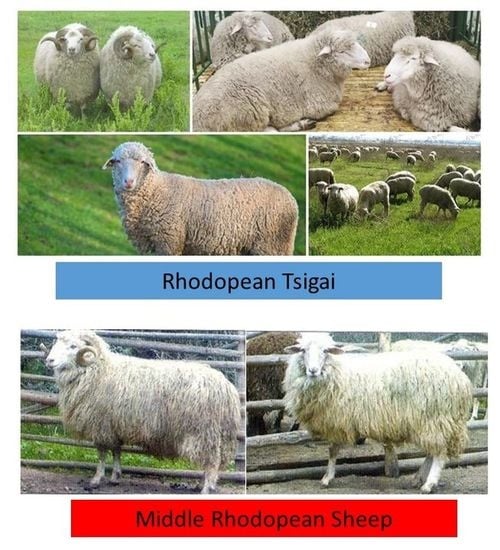
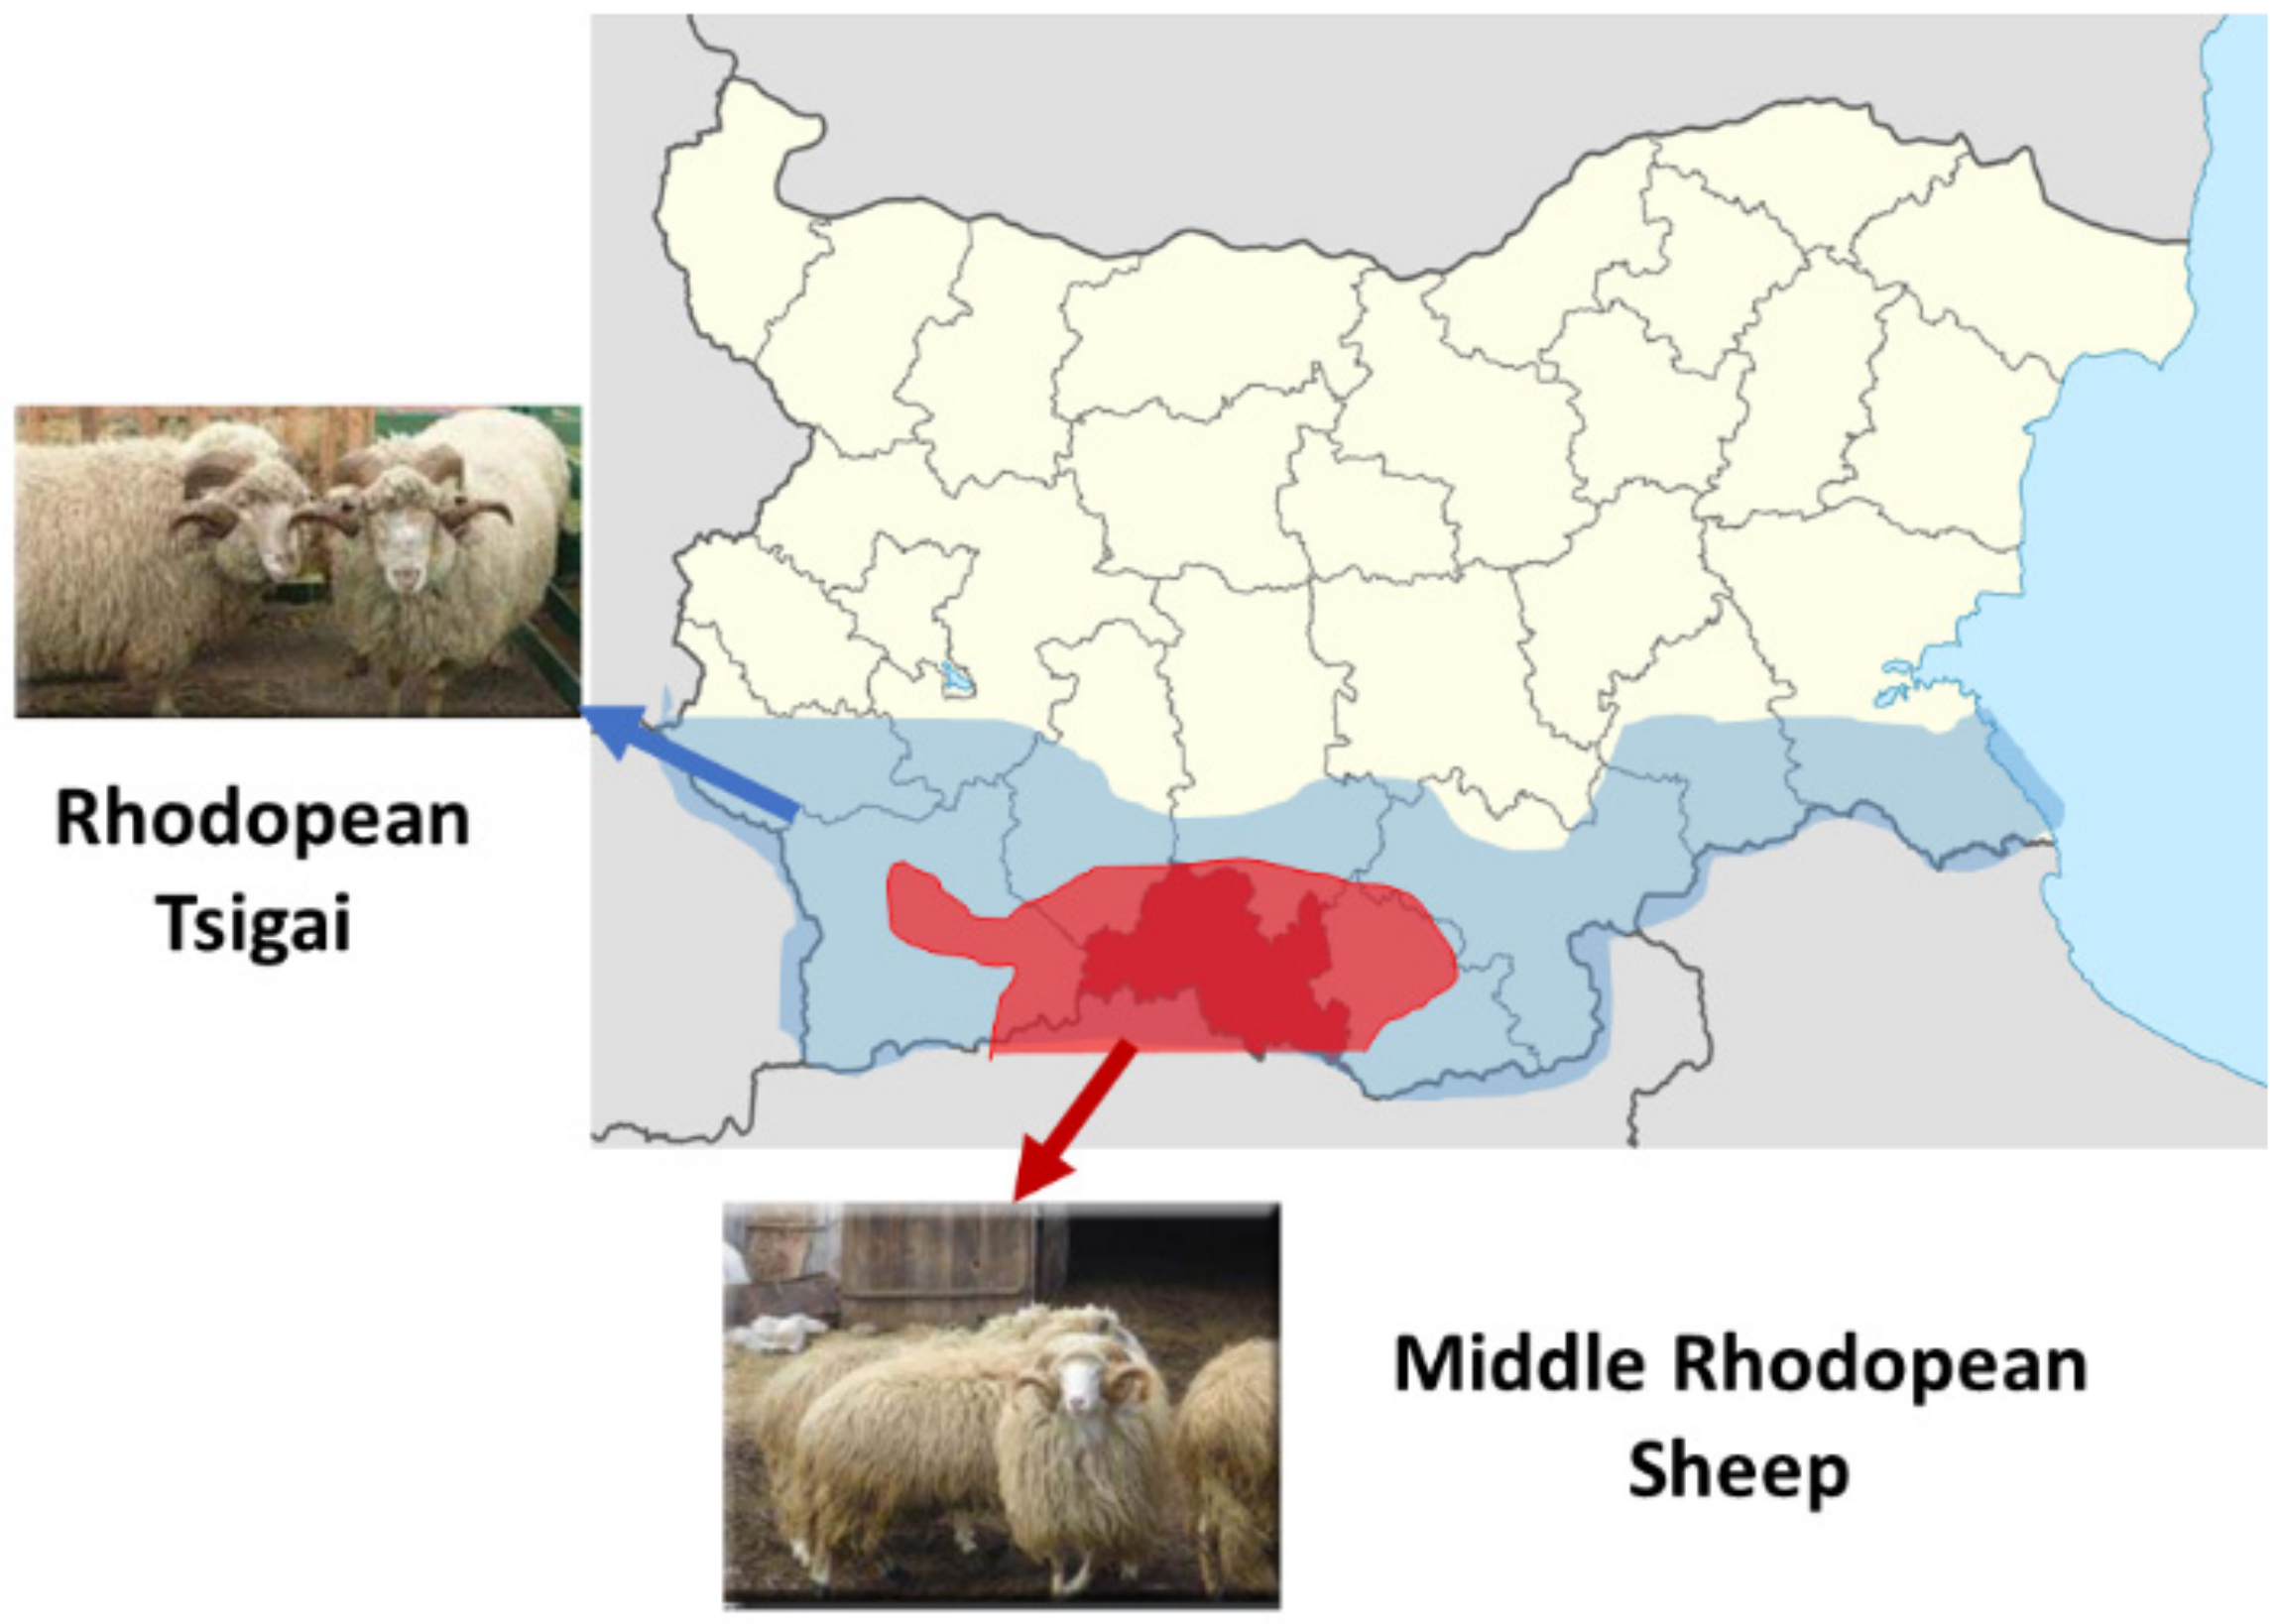
3.2. Genetic Diversity between the Rhodopean Tsigai and the Middle Rhodopean Sheep

Both studied breeds exhibited a high mean number of alleles (Table 3). The MRS had a higher Na (10.58), which in turn is higher than the reported values for the Breznishka (10 alleles/locus), the Copper-Red Shumenska (10.5 alleles/locus), the Karakachanska (9.5 alleles/locus), the Local Karnobatska (9.17 alleles/locus), the Blackhead Plevenska (10.33 alleles/locus), the Starozagorska (9.5 alleles/locus), the Patch Faced Maritza (7.8 alleles/locus), the White Maritza (8.6 alleles/locus), and the Staroplaninski Tsigai (7.2 alleles/locus) sheep breeds in Bulgaria [16,47]. The RT revealed a mean number of alleles/locus of 9.58. In the Kivircik sheep breed (originated from the Romanian Tsigai) this value was much higher—11.89 [54]—while in the Hungarian Tsigai the mean number of alleles/locus was 7.7 [55], in the New Serbian Tsigai 7.5 [56], in the Slovak Tsigai 6.0 [57], and in the Romanian Tsigai 7.5 [58], i.e., the last four showed lower values than RT.
The average Ne in our study was 4.96. This value was higher when compared with the Teteven and Kotlen sheep breeds’ Ne (4.33) [46]. In contrast, the average Ne value in this study was lower than the estimated values for some other breeds, such as Breznishka, the Sofiiska, the Copper-Red Shumenska, the Karakachanska, the Local Karnobatska, the Blackhead Plevenska, and the Starozagorska sheep breeds (Ne 10.07) [16].
Of all 12 studied loci, 8 revealed specific alleles for each population (Table 4). For example, allele 176 at locus McM527 is specific for the MRS sheep, although at a relatively low frequency (8.7%), while alleles 193 (3.7%), 220 (3.7%), and 137 (3.7%) at INRA063, INRA023, and MAF065 markers, respectively, are specific for the RT breed.
The RT breed showed higher values for Ho and He (0.76 and 0.77, respectively) when compared with the MRS (0.73 and 0.77, respectively). The difference between Ho and He values is almost equal, which is indicative of the high genetic diversity in both breeds.
The data from the present study have shown that Ho was higher than He in 6 out of 12 microsatellite loci, thus indicating an absence of heterozygote deficit. On the whole, the observed heterozygosity was higher than that in other Bulgarian sheep populations [46,47], which could be explained by the different choice of a microsatellite panel used for genotyping, as well as the different breeds studied (Table S1 in Supplementary Materials). The Ho in the Rhodopean Tsigai (0.76) was compared with other Tsigai populations in neighboring countries due to the fact that the Russian Tsigai has provided the basis for the creation of the Tsigai type sheep breeds. The obtained results varied in different countries. For example, the New Serbian Tsigai types showed values of 0.70 [56]. Investigation of Hungarian Tsigai populations—indigenous Tsigai, Cokanski and Pivnicki (both breeds imported from Serbia), Rusty (imported from Jucu, Romania) and Transitional (Körös-Maros National Park)—showed mean values in the range of 0.500–0.629 [55]. The Rusty Tsigai population in Romania revealed Ho of 0.70 [58], the Slovak Tsigai 0.54 [57], and the Kivircik sheep breed (originating from the Romanian Tsigai) 0.69 [54]. The observed different values of Ho are most likely due to the different local breeds involved in the creation of modern Tsigai populations. This is also confirmed by the study of [56], where the established clear genetic divergence between the Serbian Tsigai and the Russian Tsigai indicated that the latter may have been affected by cross-breeding with local sheep breeds.
The inbreeding parameter (FIS) is close to zero in the two sheep breeds, hence indicating a low level of heterozygote deficit. The parameter FIS is slightly higher in the MRS (0.06) than in the RT breed (0.01) (p = 0.073).
In both breeds, deviations from HW tests were observed (Table 5). Two loci of the RT sheep (ETH152 and INRA063, p < 0.001) and two microsatellite markers of the MRS (ETH152, p < 0.05; MAF214, p < 0.01) showed a significant deviation from HWE. Similar results have been obtained for other local Bulgarian breeds, such as the Breznishka, the Blackhead Plevenska, the Kotel, and the Teteven sheep breeds [16,46]. The low values of FIS found in the RT breed (FIS = 0.01) and MRS sheep (FIS = 0.02) indicate a very low deficit of heterozygous individuals (Table 3). These results are in agreement with those published by Mihailova [46] considering two autochthonous Bulgarian breeds; however, they are in contrast with the findings of Hristova et al. [16] for seven indigenous sheep breeds in Bulgaria and those of Kusza et al. [47], who used 16 STR markers to study the genetic relationship among five Bulgarian sheep breeds.

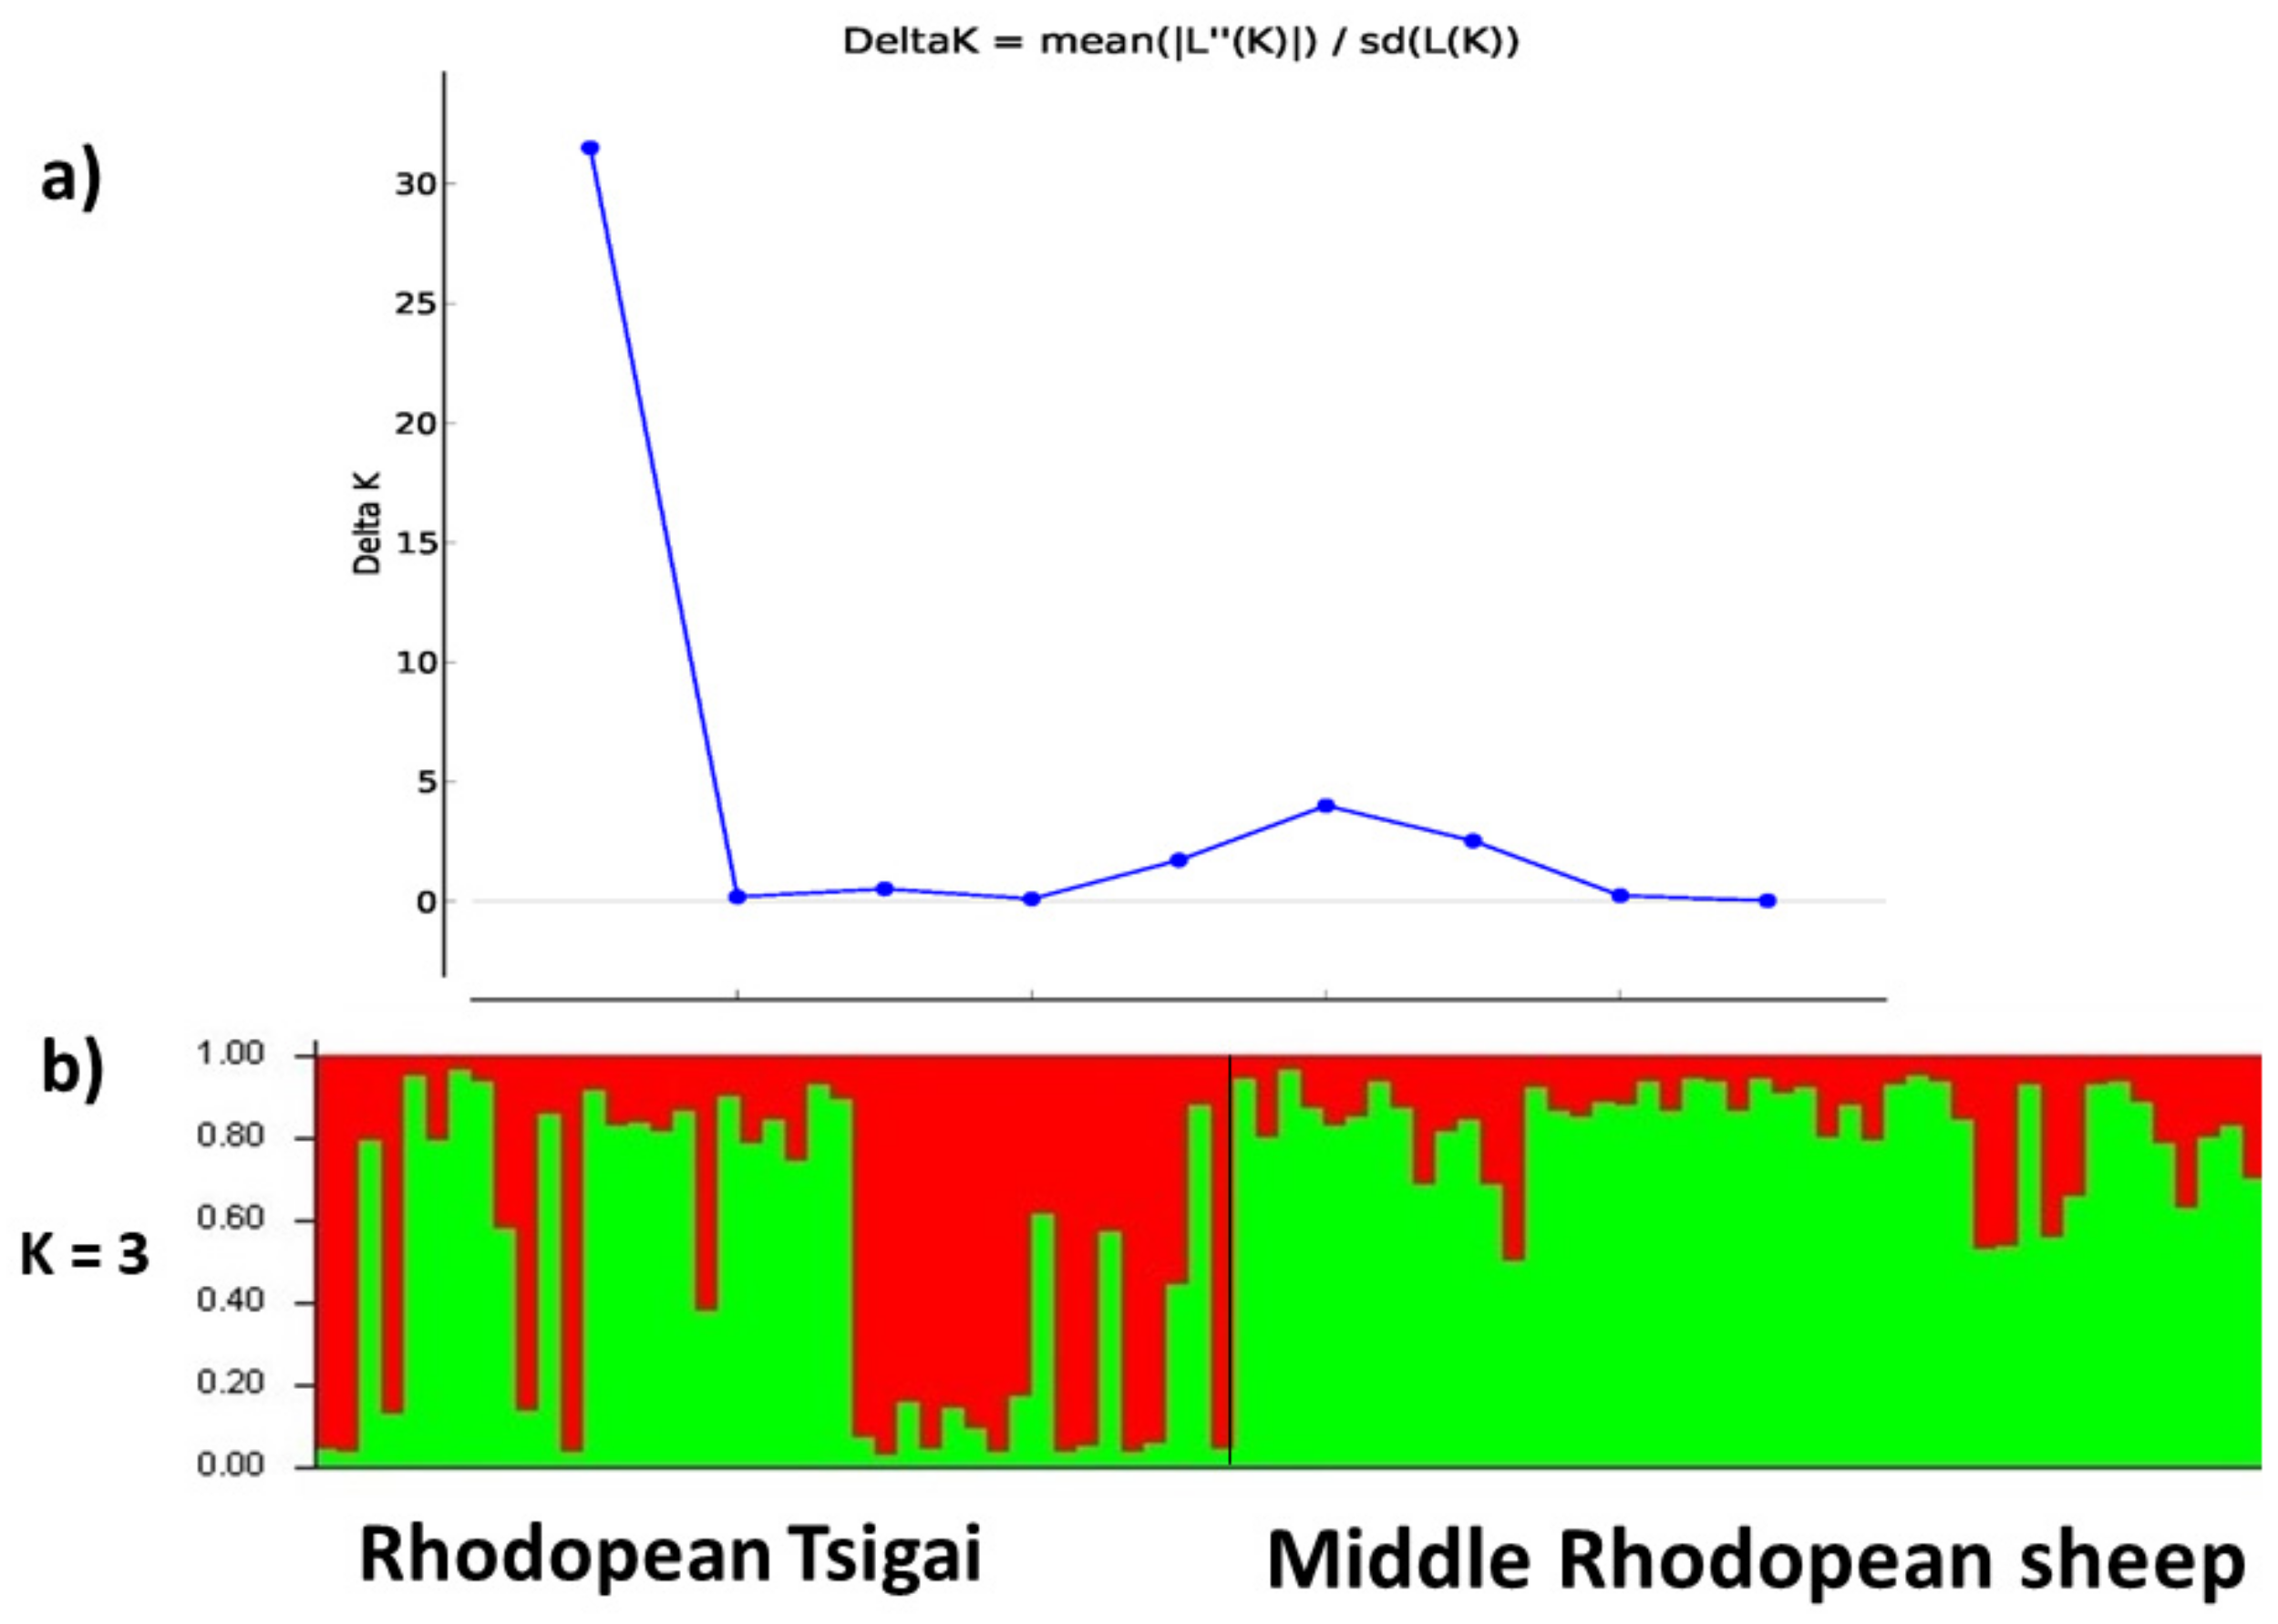
3.3. Genetic Population Structure

The results of the STRUCTURE analysis estimated by Evanno’s ΔKs statistics [39] showed admixture at the individual level in each sheep breed, although the analysis demonstrated a specific grouping of MRS and RT representatives in two clusters where they all had different proportions of membership (Figure 2). The first cluster corresponds to the flocks of the MRS breed, which showed much higher homogeneity compared to the RT breed. These results were consistent with the observed low genetic differentiation between MRS flocks. The results also showed at the individual level that RT sheep had a mixed ancestry as a result of sharing a fraction of their genome inherited from the MRS breed as a local ancestor breed. The mixed genetic profile of the RT breed can easily be explained given its creation, i.e., crossing of local semi- and mountain Bulgarian sheep breeds with rams of the Tsigai breed. Cross-breeding between low and high productive breeds aims to improve breeds more quickly than is possible using selection schemes, but such practices do not always achieve the desired results [59]. This approach is one of the major threats leading to the disappearance of local genetic diversity, inducing genetic erosion by dilution or eradication of the local genetic pool [60]. Hence, we can assume that cross-breeding has spread to such a degree in Bulgaria that the MRS breed reveals a very close genetic similarity to the RT breed. Another possible explanation for the observed genetic structure in both breeds is related to the geographical features of the region from which the breeds were sampled. This result is probably due, first of all, to their shared ancestry and, second, to the gene flow between populations breeding in close geographical areas. Further studies including breeds with overlapping habitats will be needed to assign more precisely the animals of these flocks to any of the breeds in the Rhodope Mountains region.

4. Conclusions

In conclusion, the present study has investigated the genetic diversity within and among two Bulgarian sheep breeds. The resulting genetic structure of the two breeds shows limited overall genetic diversity, most likely due to their common ancestry. In addition, the first and second gene pools could have arisen from past and recent gene flow between individuals. The results also show that microsatellite markers are an appropriate tool for assigning animals/flocks to specific breeds and determining the admixture processes in breeding practices where there is no strong control regarding the proper management of local sheep breeds.

Supplementary Materials

The following supporting information can be downloaded at: https://www.mdpi.com/article/10.3390/d14030210/s1, Table S1: Comparison of different studies on local Bulgarian sheep breeds based on microsatellite markers.

Author Contributions

Conceptualization, T.O. and P.T.; methodology and laboratory procedures, P.T., G.R. and P.H.; formal analysis, T.O.; data curation, T.O. and P.T.; writing—original draft preparation, P.H. and G.R.; writing—review and editing, T.O., P.T., G.R. and P.H.; visualization, P.H.; supervision, T.O. All authors have read and agreed to the published version of the manuscript.

Funding

This research was funded by the Bulgarian National Science Fund of the Ministry of Education and Science, grant number KΠ-06- -H51/16 19 November 2021.

Informed Consent Statement

Not applicable.

Data Availability Statement

Not applicable.

Acknowledgments

The authors wish to thank Maya Marinova (IBPhBME-BAS, Bulgaria) for the English editing.

Conflicts of Interest

The authors declare no conflict of interest.

References

  1. Gaidarska, V.M.; Ignatova, M.M.; Lytskanov, P.I. Genetic resources of farm animals in bulgaria–conservation and management. Anim. Breed. Genet. 2017, 53, 35–43. [Google Scholar] [CrossRef]
  2. Tanchev, S. Conservation of genetic resources of autochthonous domestic livestock breeds in Bulgaria. A review. Bulg. J. Agric. Sci. 2015, 21, 1262–1271. [Google Scholar]
  3. Thornton, P.K.; Thornton, P.K. Livestock production: Recent trends, future prospects. Phil. Trans. R. Soc. B 2010, 365, 2853–2867. [Google Scholar] [CrossRef] [PubMed] [Green Version]
  4. Collard, R.-C. Putting animals back together, taking commodities apart. Ann. Am. Assoc. Geogr. 2014, 104, 151–165. [Google Scholar] [CrossRef]
  5. Dumroese, R.K.; Williams, M.I.; Stanturf, J.A.; Clair, J. Considerations for restoring temperate forests of tomorrow: Forest restoration, assisted migration, and bioengineering. New For. 2015, 46, 947–964. [Google Scholar] [CrossRef]
  6. Zhao, Y.X.; Yang, J.; Lv, F.H.; Hu, X.J.; Xie, X.L.; Zhang, M.; Li, W.R.; Liu, M.J.; Wang, Y.T.; Li, J.Q.; et al. Genomic Reconstruction of the History of Native Sheep Reveals the Peopling Patterns of Nomads and the Expansion of Early Pastoralism in East Asia. Mol. Biol. Evol. 2017, 34, 2380–2395. [Google Scholar] [CrossRef]
  7. Acatrinei, A.; Rusu, I.; Mircea, C.; Zagrean-Tuza, C.; Gál, E.; Păceșilă, D.; Gâza, O.; Urduzia, C.; Pinter, Z.K.; Dobrinescu, C.; et al. Shedding light on the dark ages: Sketching potential trade relationships in early Medieval Romania through mitochondrial DNA analysis of sheep remains. Diversity 2021, 13, 208. [Google Scholar] [CrossRef]
  8. Ilişiu, E.; Dărăban, S.; Radu, R.; Pădeanu, I.; Ilişiu, V.C.; Pascal, C.; Rahmann, G. The Romanian Tsigai sheep breed, their potential and the challenges for research. Appl. Agric. For. Res. 2013, 2, 161–170. [Google Scholar]
  9. Dimov, D. The autochthonous sheep breeds of Bulgaria. In Possible Way of Conservation the Multipurpose Tsigai and Other Indigenous Sheep Breeds in Central, Earstern European and Balkan countries; Kukovics, S., Kume, K., Eds.; Budapest Printing House: Budapest, Hungary, 2006; pp. 137–164. [Google Scholar]
  10. Nikolov, V. Livestock Breeds in the Republic of Bulgaria. Catalog, 3rd ed.; Animal Genetic Resources/Resources Génétiques animales/Recursos Genéticos Animales: Sofia, Bulgaria, 2012; Volume 51, p. 150. [Google Scholar]
  11. Nikolov, V. Review of the specific measures for support of the autochthonous breeds in Bulgaria. J. Cent. Eur. Agric. 2015, 16, 38–46. [Google Scholar] [CrossRef]
  12. Genkovski, D. Comparative Characterization of Sheep of Different Breeds, Cultivated in the Conditions of Central Stara Planina, Dissertation; Bulgarian Academy of Sciences: Sofia, Bulgaria, 2002. [Google Scholar]
  13. Hlebarov, G. Study on Bulgarian Local Sheep and Possibilities for Their Improvement; Bulgarian Academy of Sciences: Sofia, Bulgaria, 1940; p. 187. [Google Scholar]
  14. Vasilev, D.; Dimov, G.; Odjacova, T.S. Dynamics of productive ability of srednorhoropska native sheep. Maced. Agric. Rev. 2000, 47, 65–69. [Google Scholar]
  15. Dimov, D.; Vuchkov, A. Sheep genetic resources in Bulgaria with focus on breeds with coloured wool. Genet. Resour. 2021, 2, 11–24. [Google Scholar] [CrossRef]
  16. Hristova, D.; Todorovska, E.; Vassilev, D.; Metodiev, S.; Popov, I.; Yablanski, T.; Zhelyazkov, E. Microsatellites based genetic diversity and population structure of seven Bulgarian indigenous sheep breeds. Int. J. Curr. Microbiol. Appl. Sci. 2014, 3, 569–581. [Google Scholar]
  17. Hristova, D.; Metodiev, S.; Nikolov, V.; Vassilev, D.; Todorovska, E. Genetic variation of Bulgarian autochthonous sheep breeds using microsatellite markers. Genetika 2017, 49, 247–258. [Google Scholar] [CrossRef]
  18. Kusza, S.; Nagy, I.; Sasvári, Z.; Stágel, A.; Németh, T.; Molnár, A.; Kume, K.; Bosze, Z.; Jávor, A.; Kukovics, S. Genetic diversity and population structure of Tsigai and Zackel type of sheep breeds in the Central-, Eastern-and Southern-European regions. Small Rumin. Res. 2008, 78, 13–23. [Google Scholar] [CrossRef]
  19. Schandl, J. Juhteny´Eszt´Es (Sheep Breeding); Mez˝ogazdas´agi Kiad´o: Budapest, Hungary, 1960. [Google Scholar]
  20. Niżnikowski, R.; Strzelec, E.; Popielarczyk, D. Economics and profitability of sheep and goat production under new support regimes and market conditions in Central and Eastern Europe. Small Rumin. Res. 2006, 62, 159–165. [Google Scholar] [CrossRef]
  21. Staikova, G.; Stancheva, N. Effect of some factors on the wool yield and staple length at different ages in sheep from the Northeast Bulgarian Fine Fleece Breed-Shumen type. Bulg. J. Agric. Sci. 2009, 15, 463–470. [Google Scholar]
  22. Kukovics, S.; Kume, K. Cooperation in the preservation of sheep breeds. In Possible Way of Conservation the Multipurpose Tsigai and other Indigenous Sheep Breeds in Central, Earstern European and Balkan Countries; Kukovics, S., Kume, K., Eds.; Budapest Printing House: Budapest, Hungary, 2006; pp. 117–122. [Google Scholar]
  23. The Ministry of Agriculture, Food and Forestry of Bulgaria. 2017. Available online: https://www.mzh.government.bg/bg/statistika-i-analizi/izsledvane-zhivotnovdstvo/normativna-uredba (accessed on 16 March 2021).
  24. Fischer, M.C.; Rellstab, C.; Leuzinger, M.; Roumet, M.; Gugerli, F.; Shimizu, K.K.; Holderegger, R.; Widmer, A. Estimating Genomic Diversity and Population Differentiation—An Empirical comparison of microsatellite and SNP variation in Arabidopsis halleri. BMC Genom. 2017, 18, 69. [Google Scholar] [CrossRef] [Green Version]
  25. Xia, Q.; Wang, X.; Pan, Z.; Zhang, R.; Wei, C.; Chu, M.; Di, R. Genetic diversity and phylogenetic relationship of nine sheep populations based on microsatellite markers. Arch. Anim. Breed. 2021, 64, 7–16. [Google Scholar] [CrossRef]
  26. Olschewsky, A.; Hinrichs, D. An overview of the use of genotyping techniques for assessing genetic diversity in local farm animal breeds. Animals 2021, 11, 2016. [Google Scholar] [CrossRef]
  27. Abebe, A.S.; Mikko, S.; Johansson, A.M. Genetic diversity of five local Swedish chicken breeds detected by microsatellite markers. PLoS ONE 2015, 10, e0120580. [Google Scholar] [CrossRef] [Green Version]
  28. Abdelkader, A.A.; Ata, N.; Benyoucef, M.T.; Djaout, A.; Azzi, N.; Yilmaz, O.; Cemal, İ.; Gaouar, S.B.S. New genetic identification and characterisation of 12 Algerian sheep breeds by microsatellite markers. Ital. J. Anim. Sci. 2018, 17, 38–48. [Google Scholar] [CrossRef]
  29. Srivastava, S.; Avvaru, A.K.; Sowpati, D.T.; Mishra, R.K. Patterns of microsatellite distribution across eukaryotic genomes. BMC Genom. 2019, 20, 153. [Google Scholar] [CrossRef] [Green Version]
  30. Vieira, M.L.C.; Santini, L.; Diniz, A.L.; de Freitas Munhoz, C. Microsatellite markers: What they mean and why they are so useful. Genet. Mol. Biol. 2016, 39, 312–328. [Google Scholar] [CrossRef] [PubMed]
  31. Grover, A.; Sharma, P.C. Development and use of molecular markers: Past and present. Crit. Rev. Biotechnol. 2016, 36, 290–302. [Google Scholar] [CrossRef] [PubMed]
  32. FAO. Molecular Genetic Characterization of Animal Genetic Resource. Available online: http://www.fao.org/docrep/ (accessed on 12 September 2021).
  33. ISAG. Applied Genetics in sheep and goats workshop. In Proceedings of the 32nd International Conference on Animal Genetics, Edinburgh, UK, 23 November 2021. [Google Scholar]
  34. Peakall, R.; Smouse, P.E. GenAlEx 6.5: Genetic analysis in Excel. Population genetic software for teaching and research—An update. Bioinformatics 2012, 28, 2537–2539. [Google Scholar] [CrossRef] [Green Version]
  35. Weir, B.S.; Cockerham, C.C. Estimating F-statistics for the analysis of population structure. Evolution 1984, 38, 1358. [Google Scholar] [PubMed]
  36. Yeh, F.C.; Yang, R.C.; Boyle, T.B.; Ye, Z.H.; Mao, J.X. PopGene, the User-Friendly Shareware for Population Genetic Analysis, Molecular Biology and Biotechnology Center; University of Alberta: Edmonton, AB, Canada, 1997. [Google Scholar]
  37. Goudet, J. FSTAT (Version 1.2): A computer program to calculate F-statistics. J. Hered. 1995, 86, 485–486. [Google Scholar] [CrossRef]
  38. Pritchard, J.K.; Stephens, M.; Donnelly, P. Inference of population structure using multilocus genotype data. Genetics 2000, 155, 945–959. [Google Scholar] [CrossRef]
  39. Evanno, G.; Regnaut, S.; Goudet, J. Detecting the number of clusters of individuals using the software Structure: A simulation study. Mol. Ecol. 2005, 14, 2611–2620. [Google Scholar] [CrossRef] [Green Version]
  40. Earl, D.A.; von Holdt, B.M. STRUCTURE HARVESTER: A website and program for visualizing STRUCTURE output and implementing the Evanno method. Conserv. Genet. Resour. 2012, 4, 359–361. [Google Scholar] [CrossRef]
  41. Kopelman, N.M.; Mayzel, J.; Jakobsson, M.; Rosenberg, N.A.; Mayrose, I. Clumpak: A program for identifying clustering modes and packaging population structure inferences across K. Mol. Ecol. Resour. 2015, 15, 1179–1191. [Google Scholar] [CrossRef] [Green Version]
  42. Rosenberg, N.A. DISTRUCT: A program for the graphical display of population structure. Mol. Ecol. Notes 2004, 4, 137–138. [Google Scholar] [CrossRef]
  43. Belkhir, K. GENETIX 4.04, Logiciel Sous Windows TM Pour la Genetique des Populations; Laboratories Genome, Populations, Interactions, Universite de Montpellier II, CNRS UMR 5000: Montpellier, France, 2004. [Google Scholar]
  44. Agung, P.P.; Saputra, F.; Zein, M.; Wulandari, A.S.; Putra, W.; Said, S.; Jakaria, J. Genetic diversity of Indonesian cattle breeds based on microsatellite markers. Asian-Australas. J. Anim. Sci. 2019, 32, 467–476. [Google Scholar] [CrossRef]
  45. Ren, A.; Du, K.; Jia, X.; Yang, R.; Wang, J.; Chen, S.-Y.; Lai, S.-J. Genetic diversity and population structure of four Chinese rabbit breeds. PLoS ONE 2019, 14, e0222503. [Google Scholar] [CrossRef]
  46. Mihailova, Y. Genetic diversity and structure of 2 indigenous sheep breeds (Kotel and Teteven) in Bulgaria using microsatellite markers. Biotechnol. Biotechnol. Equip. 2021, 35, 576–585. [Google Scholar] [CrossRef]
  47. Kusza, S.; Dimov, D.; Nagy, I.; Bõsze, Z.; Jávor, A.; Kukovics, S. Microsatellite analysis to estimate genetic relationships among five bulgarian sheep breeds. Genet. Mol. Biol. 2010, 33, 51–56. [Google Scholar] [CrossRef] [Green Version]
  48. Kdidi, S.; Calvo, J.H.; González-Calvo, L.; Ben Sassi, M.; Khorchani, T.; Yahyaoui, M.H. Genetic relationship and admixture in four Tunisian sheep breeds revealed by microsatellite markers. Small Rumin. Res. 2015, 131, 64–69. [Google Scholar] [CrossRef]
  49. Gaouar, S.B.S.; Kdidi, S.; Ouragh, L. Estimating population structure and genetic diversity of five Moroccan sheep breeds by microsatellite markers. Small Rumin. Res. 2016, 144, 23–27. [Google Scholar] [CrossRef]
  50. Yilmaz, O.; Cemal, I.; Karaca, O.; Ata, N. Molecular genetic characterization of Kivircik sheep breed raised in Western Anatolia. Livest. Res. Rural Dev. 2016, 28, 40. [Google Scholar]
  51. Álvarez, I.; Capote, J.; Traoré, A.; Fonseca, N.; Pérez, K.; Cuervo, M.; Fernández, I.; Goyache, F. Genetic relationships of the Cuban hair sheep inferred from microsatellite polymorphism. Small Rumin. Res. 2012, 104, 89–93. [Google Scholar] [CrossRef] [Green Version]
  52. De Meeûs, T. Revisiting FIS, FST, Wahlund Effects, and Null Alleles. J. Hered. 2018, 109, 446–456. [Google Scholar] [CrossRef] [PubMed] [Green Version]
  53. Manangwa, O.; De Meeûs, T.; Grébaut, P.; Ségard, A.; Byamungu, M.; Ravel, S. Detecting Wahlund effects together with amplification problems: Cryptic species, null alleles and short allele dominance in Glossina pallidipes populations from Tanzania. Mol. Ecol. Resour. 2019, 19, 757–772. [Google Scholar] [CrossRef] [PubMed]
  54. Oner, Y.; Ustüner, H.; Orman, A.; Yilmaz, O.; Yılmaz, A. Genetic Diversity of Kıvırcık Sheep Breed Reared in Different Regions and its Relationship with Other Sheep Breeds in Turkey. Ital. J. Anim. Sci. 2014, 13, 3. [Google Scholar] [CrossRef]
  55. Kusza, S.; Nagy, I.; Németh, T.; Molnár, A.; Jávor, A.; Kukovics, S. The genetic variability of Hungarian Tsigai sheep. Arch. Anim. Breed. 2010, 53, 309–317. [Google Scholar] [CrossRef] [Green Version]
  56. Ćinkulov, M.; Tapio, M.; Ozerov, M.; Kiselyova, T.; Marzanov, N.; Pihler, I.; Olsaker, I.; Vegara, M.; Kantane, J. Genetic differentiation between the Old and New types of Serbian Tsigai sheep. Genet. Sel. Evol. 2008, 40, 321–331. [Google Scholar] [CrossRef]
  57. Kusza, S.; Gyarmathy, E.; Dubravska, J.; Nagy, I.; Jávor, A.; Kukovics, S. Study of genetic differences among Slovak Tsigai populations using microsatellite markers. Czech J. Anim. Sci. 2009, 54, 468–474. [Google Scholar] [CrossRef] [Green Version]
  58. Zãhan, M.; Miclea, V.; Raica, P.; Miclea, I.; Ilisiu, E. Analysis of Genetic Variation within Tsigai Population from Romania Using Microsatellite Markers. Anim. Sci. Biotechnol. 2011, 68, 396–400. [Google Scholar]
  59. Herold, P.; Roessler, R.; Willam, A.; Momm, H.; Zárate, A.V. Breeding and supply chain systems incorporating local pig breeds for small–scale pig producers in Northwest Vietnam. Livest. Prod. Sci. 2012, 129, 63–72. [Google Scholar] [CrossRef]
  60. Rege, J.E.O.; Gibson, J.P. Animal genetic resources and economic development: Issues in relation to economic evaluation. Ecol. Econ. 2003, 45, 319–330. [Google Scholar] [CrossRef]
Figure 1. Geographic distribution of the studied sheep breeds in Bulgaria.
Diversity 14 00210 g001
Figure 2. Genetic structure of two Bulgarian sheep breeds based on STR marker data under an assumption of K = 2–12 using the STRUCTURE 2.3.4 program. (a) Estimation of the most probable K, following the delta K method of Evanno et al. [39]. (b) Each individual is represented by a vertical bar displaying membership coefficients for each genetic cluster. Populations are separated by black lines. Graphics were obtained with STRUCTURE HARVESTER and the DISTRUCT application.
Diversity 14 00210 g002
Table 1. Details of the used ovine microsatellite (STR) markers.
Microsatellite MarkerChr. No.MotifPrimer Sequence
5′–3′
Product Size (bp)AnnealingT (°C)
McM0429(AC)nF: GTTCGTACTTCTGGGTACTGGTCTC
R: GTCCATGGATTTGCAGAGTCAG
81–10760
McM5275(TG)nF: GTCCATTGCCTCAAATCAATTC
R: AAACCACTTGACTACTCCCCAA
158–18256
INRA00512(GT)nF: TCAGGCATACCCTACACCACATG
R: AATATTAGCCAACTGAAAACTGGG
125–14754
INRA0061(CA)nF: AGGAATATCTGTATCAACCGCAGTC
R: CTGAGCTGGGGTGGGAGCTATAAATA
110–13258
INRA0233(AC)nF: GAGTAGAGCTACAAGATAAACTTC
R: TAACTACAGGGTGTTAGATGAACTC
194–21658
INRA06314(AC)nF: GACCACAAAGGGATTTGCACAAGC
R: AAACCACAGAAATGCTTGGAAG
169–20156
INRA17222(TG)nF: CCAGGGCAGTAAAATGCATAACTG
R: GGCCTTGCTAGCCTCTGCAAAC
126–16058
ETH1525(AC)nF: TACTCGTAGGGCAGGCTGCCTG
R: GAGACCTCAGGGTTGGTGATCAG
186–20060
CSRD24714(CA)nF: GGACTTGCCAGAACTCTGCAAT
R: CACTGTGGTTTGTATTAGTCAGG
209–25558
OarFSB202(TG)nF: GGAAAACCCCCATATATACCTATAC
R: AAATGTGTTTAAGATTCCATACATGTG
87–11358
MAF06515(CA)nF: AAAGGCCAGAGTATGCAATTAGGAG
R: CCACTCCTCCTGAGAATATAACATG
125–13756
MAF21416(GT)nF: AATGCAGGAGATCTGAGGCAGGGACG
R: GGGTGATCTTAGGGAGGTTTTGGAGG
189–26558
Table 2. Number of identified alleles per locus (Na), number of effective alleles (Ne), polymorphism information content (PIC), heterozygosities observed (Ho) and expected (He), Shannon’s information index (I), FIT (inbreeding coefficient), FIS (inbreeding coefficient of an individual relative), FST (fixation index), DST (gene diversity between populations), HT (total expected heterozygosity), and GST (genetic diversity among populations) in each locus.
LocusNaNePICHoHeIFITaFISFSTaDSTHTGST
McM04282.650.440.600.621.350.0480.0260.0230.0560.6330.017
INRA00610.53.520.670.730.721.63−0.006−0.0180.0110.0300.7240.006
McM5278.04.510.760.690.781.710.1250.1100.0180.0840.7910.011
ETH1525.53.480.660.730.711.36−0.010−0.0170.0070.0060.7170.001
CSRD24712.06.090.730.830.822.01−0.022−0.0330.0100.0430.8290.004
OarFSB2010.56.850.810.850.852.060.0150.0000.0150.1160.8650.009
INRA1728.03.840.720.740.741.610.0170.0030.0140.0460.7490.008
INRA06312.55.920.800.770.832.070.0900.0710.0200.1470.8470.014
INRA00514.57.830.880.860.872.320.0350.0170.0190.2020.8890.013
INRA02310.56.820.850.820.852.080.0540.0410.0140.0990.8650.008
MAF0659.04.060.700.690.751.640.0960.0850.0130.0420.7630.006
MAF21412.04.000.730.670.751.760.1140.1090.005−0.0110.753−0.002
Mean10.084.960.730.750.771.790.0460.0330.0140.0590.7860.008
a Wright’s statistics according to Weir and Cockerham [35].
Table 3. Number of different alleles (Na), number of effective alleles (Ne), observed (Ho) and expected (He) heterozygosities, coefficient of inbreeding (FIS), and number of alleles unique to a single population (NPA) in Rhodopean Tsigai (RT) and Middle Rhodopean Sheep (MRS).
BreedNaNeHoHeFISNPANo. Different Alleles (Freq ≥ 5%)
RT9.584.840.760.770.011.584.92
MRS10.585.090.730.770.062.585.17
Mean10.085.020.740.770.0352.085.04
Abbreviations: RT—Rhodopean Tsigai; MRS—Middle Rhodopean Sheep.
Table 4. Identified population-specific alleles.
LocusAlleleFrequency (%)Breed
McM5271768.7Middle Rhodopean Sheep
CSRD2472554.4Middle Rhodopean Sheep
OarFSB20103
109
4.4
5.4
Middle Rhodopean Sheep
INRA172156
162
4.4
11.0
Middle Rhodopean Sheep
INRA0631933.7Rhodopean Tsigai
INRA0232203.7Rhodopean Tsigai
MAF0651373.7Rhodopean Tsigai
MAF2142612.4Rhodopean Tsigai
Table 5. Hardy–Weinberg (HW) equilibrium test in all studied microsatellite loci by breed.
BreedLocus
McM042INRA006McM527ETH152CSRD247OarFSB20INRA172INRA063INRA005INRA023MAF065MAF214
RT0.2710.9250.8690.000 ***0.9660.4630.8020.000 ***0.1760.4970.0510.111
MRS0.0590.9780.2150.043 *0.1790.2260.3410.3680.6760.8550.0860.003 **
Abbreviations: RT—Rhodopean Tsigai; MRS—Middle Rhodopean Sheep. Significant p values: * p < 0.05, ** p < 0.01, *** p < 0.001.
Publisher’s Note: MDPI stays neutral with regard to jurisdictional claims in published maps and institutional affiliations.

