1. Introduction
Urbanization is driving land-use change across the globe at an unprecedented rate [
1]. The conversion of historically natural habitats to developed areas alters the composition of wildlife communities within ecosystems as species sensitive to urbanization are replaced by those able to exploit this new environment [
2]. These changes disrupt predator-prey dynamics, a critical part of ecosystem function [
3]. Investigations of how urbanization impacts predator-prey dynamics have yielded two contradictory outcomes [
4]. The first is predator proliferation, a frequently observed phenomenon in which predator densities are greater within urban areas than surrounding natural ones. The second is a reduction in predation rates in urban areas when compared to natural ones, known as predation relaxation [
5]. The contradiction of predator proliferation and predation relaxation within urban areas is known as the urban predation paradox, which stands in opposition to the positively correlated relationship between predator abundance and predation rates in natural ecosystems [
6].
Several hypotheses have been proposed to explain this disassociation between the abundance of predators and rates of predation in urban areas, including changes in predator species and prey compositions [
4,
7]; prey hyperabundance as a result of increased anthropogenic resource subsidies [
4,
8]; prey switching by predators [
3,
9,
10,
11]; and specialization of prey to urban areas [
3,
10,
11]. These hypotheses are not necessarily mutually exclusive and can be observed in combination with one another. For example, prey switching by generalist predators, such as the Cooper’s hawk (
Accipiter cooperii), has been observed in densely populated cities in which they switch from historic prey to a few native and non-native species, such as rock pigeons and other dove species (
Columba spp.) that have become overabundant [
10,
11]. These alternate prey species are predictably able to thrive in the resource-rich environment provided by increased human presence [
2,
8,
10]. Prey switching has therefore been proposed as a contributing factor to the reduction in predation rates on historic prey species of Cooper’s hawks in these urban areas [
10,
11].
It remains unclear whether the decoupling of predator-prey relationships is widespread across all urbanized areas and to what extent this impacts urban ecosystems. Raptors are easily observable predators and are often used as indicators of environmental health due to their association with high levels of biodiversity [
12,
13]. Declines in some raptor populations likewise reflect a decline in biological integrity of the ecosystem they inhabit [
14]. Therefore, the goal of this study was to investigate predator-prey dynamics of raptors within an urban forest. Specifically, we determined if an urban predation paradox existed in this raptor community by assessing both predator proliferation and predation relaxation.
Because observations of natural predation events are infrequent, the use of models is an effective tool for exploring differences in predation rates between natural and urban areas. Past experiments with birds have primarily used real and artificial nests to assess nest predation [
10,
11,
15,
16]; however, research with other vertebrates, such as the green anole (
Anolis carolinensis) [
17] and Texas horned lizard (
Phrynosoma cornutum) [
18], have used models of the organisms themselves. The use of multiple types of foam prey mimics is a technique, to our knowledge, not previously used to assess predator-prey dynamics along an urban gradient. We created water snake mimics and an alternative prey source, mice, to investigate predation rates in this raptor community.
To investigate predator-prey dynamics and the predation paradox in our study, we identified four study objectives: (1) quantify the extent of urbanization within the study location; (2) characterize the composition of the raptor community and quantify raptor activity along an urbanization gradient; (3) quantify raptor predation attempts using prey mimics along the same urbanization gradient; and (4) assess the relationship between raptor activity and predation at different levels of urbanization. We predicted that areas with high levels of urbanization would have more raptors but lower levels of predation in accordance with the urban predation paradox, thereby disassociating the relationship between predator abundance and predation rates.
This study was the first to investigate the urban predation paradox using models, and was the first to investigate the urban predation paradox in a diverse raptor community. The results from this study will increase our understanding of the impact of urbanization on both raptor communities and raptor predation patterns. These results will also assist in determining the current health of a large urban forest fragment.
2. Materials and Methods
2.1. Study Area
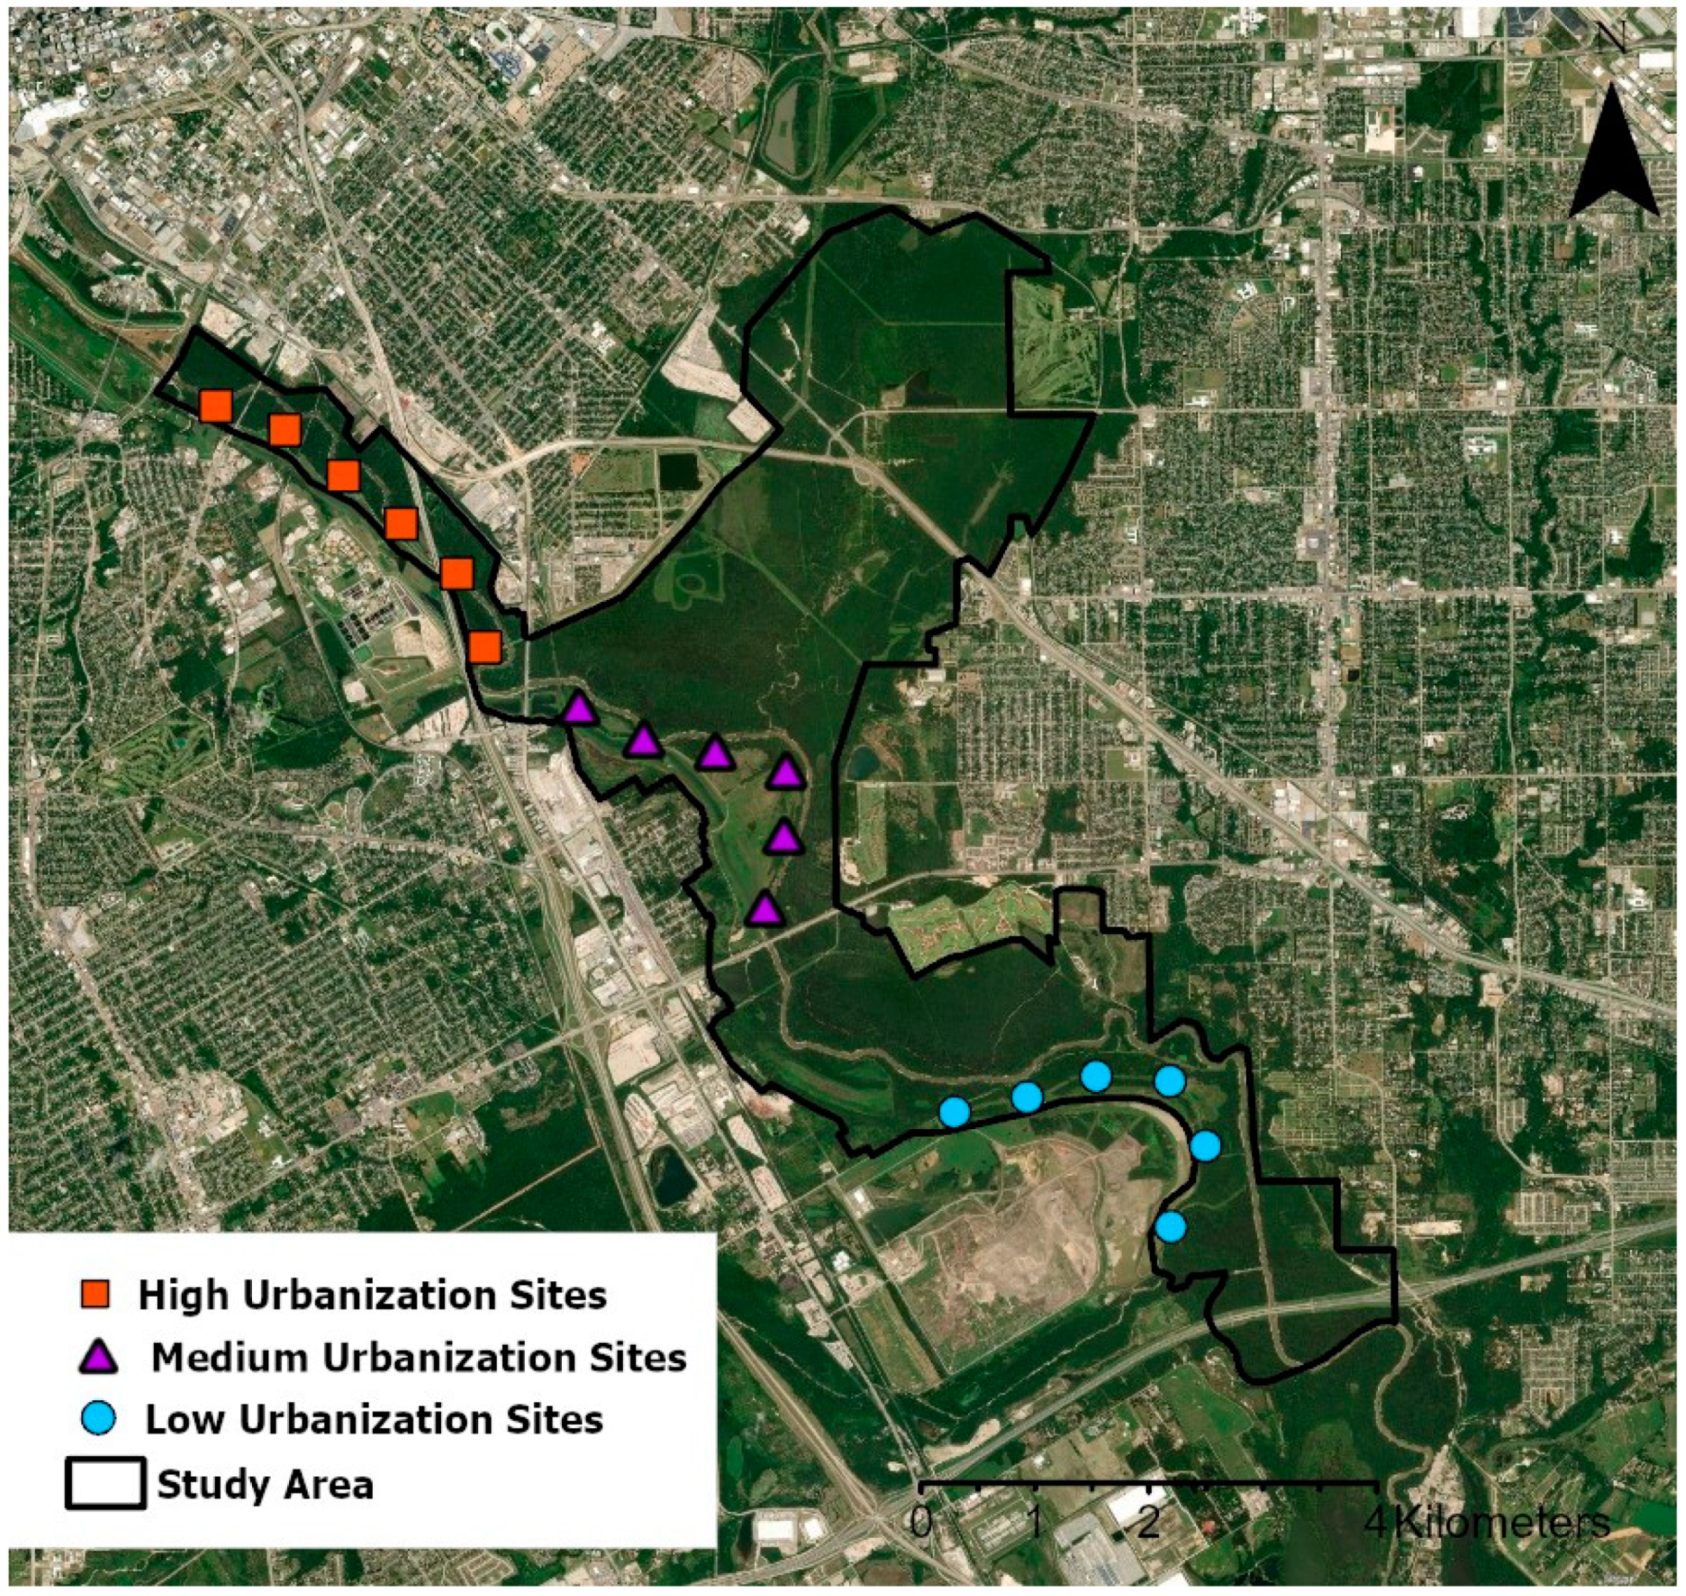
Our study site was the Great Trinity Forest, a large (>3000 ha) urban forest fragment located within the fourth largest metroplex in the United States, Dallas–Fort Worth (U.S. Census Bureau, 2020;
Figure 1). The Great Trinity Forest is a bottomland hardwood forest with an intact flooding regime centered around the Trinity River. This forest “island” consists mainly of Eastern cottonwood (
Populus deltoides), green ash (
Fraxinus pennsylvanica), cedar elm (
Ulmus crassifolia), American elm (
Ulmus americana), hackberry (
Celtis laevigata), black willow (
Salix nigra), and pecan (
Carya illinoinensis) in the overstory. The forest understory is mainly composed of mulberry (
Morus spp.), Eastern swamp privet (
Forestiera acuminate), and the invasive Chinese privet (
Ligustrum sinense). This forest “island” has a wide range of disturbance factors typically associated with highly urbanized areas: habitat degradation, invasive species, increased noise and light, and increased presence of humans. Commercial and industrial developments are primarily found along the north and west sides of the forest, intermixed with residential neighborhoods. Municipal utilities for water treatment are located both proximal to downtown Dallas and at the furthest city boundary along the Trinity River to the southeast. A large landfill, multiple golf courses, city parks, and a paved trail system are also found within and adjacent to the forest. At its farthest reaches to the southeast, agricultural land becomes increasingly dominant. State, U.S., and interstate highways intersect the forest in multiple locations. Citizen science tools indicated there is a large and diverse raptor community within the Great Trinity Forest [
19], and several of the raptors regularly feed on snakes and rodents [
20,
21].
We identified three survey locations within the Great Trinity Forest (
Figure 1). At each survey location, we established a transect with six survey stations spaced approximately 650 m apart that could be accessed on foot or by bicycle. The locations of these three transects followed the urban-to-rural gradient, extending from downtown Dallas in the northwest toward the southeast, and as such, were characterized by differing levels of urbanization.
2.2. Quantifying Urbanization
To classify land cover within the forest, we obtained a 2016 50 cm resolution, multiband remote sensing image of the forest and surrounding Dallas County from the Texas Natural Resource Information System (
tnris.org (accessed on 4 February 2022)). Using ArcGIS Pro’s (version 2.2.0) image classification wizard with supervised, object-based classification, we processed and reclassified the forest into four land cover categories: impervious surface, forest, open water, and grass/cultivated land. We defined impervious surfaces as any human-made material that were impenetrable to water (e.g., roofs, concrete, building materials, etc.).
For our purposes, we defined urbanization as the percentage of impervious surface present within the forest and the nearby matrix. Since the final classification of land cover was a raster-based map with pixels as its base unit, we determined the percent of impervious surface within a 5 km
2 buffer of each survey station by dividing pixels classified as “impervious” within each buffer by the total number of pixels and then multiplying by 100. We then repeated this process for the remaining three landcover categories for each raptor survey location. The 5 km
2 area analyzed per raptor survey station was selected because it encompassed the extent of the breeding territories of raptor species known to inhabit the forest [
22]. Using this method, we categorized our three transect sites as “low” urbanization (furthest from the city center), “medium” urbanization, and “high” urbanization (nearest to the city center). We used a Welch’s ANOVA to look for significant differences between levels of urbanization at our three transect sites, where each site’s urbanization was defined as the mean level of urbanization of all survey locations at that site.
2.3. Raptor Activity
We assessed raptor activity at six survey stations within each transect (
Figure 1;
n = 18 survey stations) along the urbanization gradient using conspecific broadcast call surveys for raptors commonly found in the Great Trinity Forest, following protocols established by Fuller and Mosher [
23,
24,
25], Mosher et al. [
26], and Rullman and Marzluff [
27]. The survey stations were approximately 650 m apart to avoid overlap of species counts due to raptor mobility and the audible range of their calls. Our survey methods were consistent with published guidelines for the use of playbacks with wild birds in research [
28]. Species calls were downloaded from xeno-canto (
xeno-canto.org (accessed om 4 February 2022)) and uploaded onto a FoxPro Fusion wildlife caller. The order in which the species calls were initially played was determined by species size and then aggressiveness (i.e., from smallest to largest and least to most) to avoid incidental predation of smaller species by those that were larger or more aggressive. The resulting species broadcast order was: (1) Cooper’s hawk, (2) red-shouldered hawk (
Buteo lineatus), (3) red-tailed hawk (
Buteo jamaicensis), (4) barred owl (
Strix varia), and (5) great-horned owl (
Bubo virginianus). Great-horned owl calls were additionally broadcasted last due to the ability of these calls to elicit territorial responses from other raptor species if conspecific calls themselves were not successful [
24,
25,
27].
During surveys, we mounted the FoxPro caller to a tripod raised to 2 m above ground level. The initial broadcast duration for an individual species was 1 min followed by 2 min of silence to observe responses. We then repositioned the caller 90° and repeated the broadcast for 1 min followed by another 2 min of silence. Since the FoxPro Fusion caller was equipped with 2 speakers facing opposite directions, this approach provided 360° of broadcast coverage for a total of 6 min of survey time for each species at each station. During these surveys, we recorded all aural and visual observations of raptors including raptor species, bearing, distance, and activity, if possible.
We conducted surveys weekly between sunrise and 15:00 from late May to early August 2019. We rotated the order in which we surveyed the three sites, as well as the six stations within sites, on a weekly basis to minimize the confounding factors associated with time of day. In all subsequent analyses, we removed the observations of American kestrels (
Falco sparverius), as this species was only observed at one station, and compared to the other raptors in the Great Trinity Forest, it is the least likely to consume snakes, since its diet mainly comprises insects [
29,
30]. We estimated raptor activity at each station by calculating the average number of individuals observed at each station over the 10-week survey period. Activity within each of the three transect sites was likewise calculated as the average number of raptors observed per site over the survey period. We also calculated the Shannon equitability index (EH = H/log (k)) to estimate raptor diversity at each survey location.
2.4. Prey Mimic Models
We created models to mimic two main raptor prey types in our study area: snakes and mice. Utilizing mimics as prey items has proven to be a valuable method to detect and estimate predation rates for a range of vertebrate species [
18,
31,
32,
33]. We used urethane foam to make our models, because this material allows for accurate identification of predator species through marks left on the models (e.g., raptor talons, beaks, tooth marks from rodents, etc. [
31,
33]) and this material can withstand temperatures in excess of 38 °C, which occur in our study area during the summer months [
32]. SmoothOn Mold-Max 29
®, a silicone-based rubber mold kit, was used to create casts for prey models using realistically detailed plastic snakes and mice as prototypes. Models were then made by injecting SmoothOn Flex Foam-it! 3
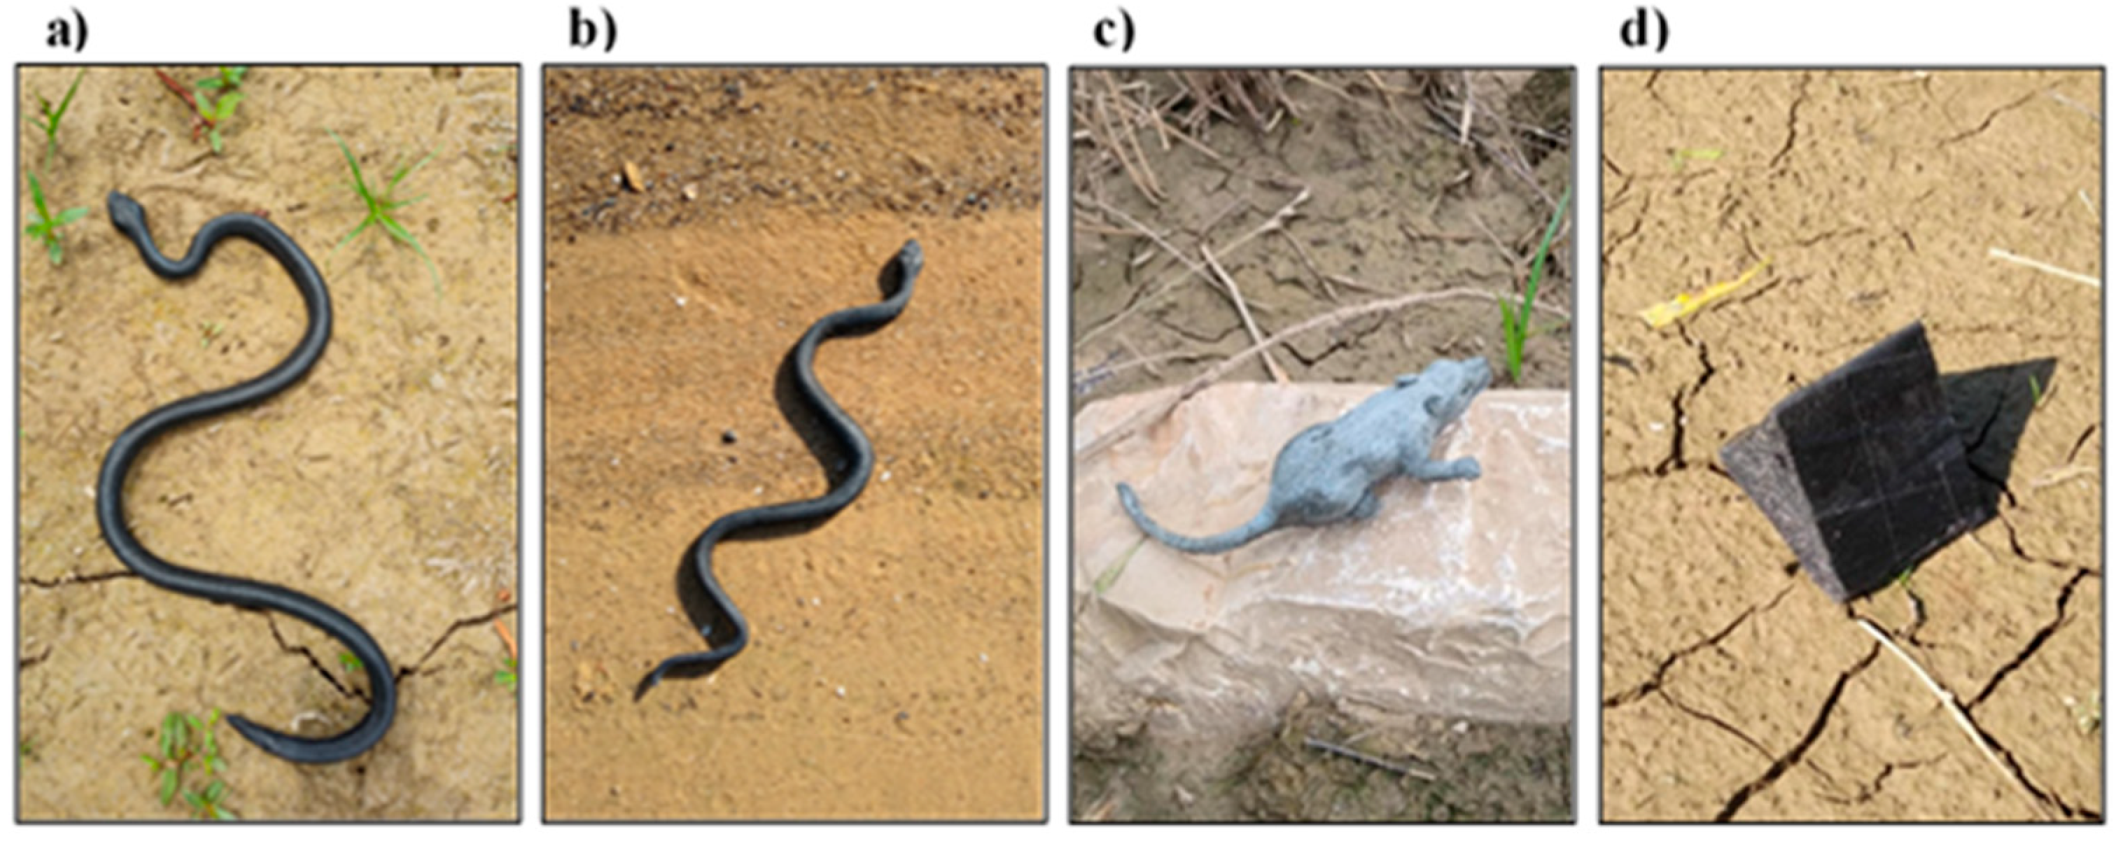
® urethane foam mixed with UV-resistant black paint into casts. We made foam snakes of 2 different sizes (small—20.32 cm length × 2.54 cm diameter, and large—45.72 cm length × 5.08 cm diameter;
Figure 2a,b), which allowed for preferences or differences in prey size among the different raptor species. We made foam mice (8.89 cm length (not including tail) × 6.35 cm diameter in the midsection) as an alternate prey item for raptors (
Figure 2c). We created control models in the shape of a triangular prism (7.62 cm height × 12.7 cm base × 10.16 cm width) to ensure that predators were not attracted to prey models because of the scent or color of the models, regardless of their shape. UV-resistant black paint was mixed with the foam solution to create black snake and grey mice models that were similar to a variety of native water snakes and mice within the forest. The control models were also black.
From mid-June to early August 2019, we placed prey models and controls within 150 m of each survey station in all three transect sites. Initially, one model of each type (small snake, large snake, mouse, and control) was placed at each station and tethered to a metal stake with 6 lb fishing line (n = 72 models). We placed models in locations that seemed to be logical places for the prey species type and that were visible to raptor species searching for prey (i.e., on bare ground or in open areas with low vegetation, open canopy, and near water sources). We checked the models every 7 days; those with marks from predators were considered to have had a predation event and were subsequently removed from the study site. Models that were damaged (e.g., discolored by sun or water, crushed by foot or vehicle traffic, covered in dirt, etc.) were also removed. Models in pristine condition were collected and redeployed to a different location at the survey station along with one new model of each type. We repeated this process weekly until the end of the study period, ensuring there was a consistent and uniform abundance of prey mimic types across the urbanization gradient. We used Fisher’s exact tests to compare the proportion of attacks on the different prey mimic types and to the control models.
We had access to 20 field cameras that we could strategically place near models to capture predation events, characterize the predator community (which also included mammals and wading birds), and aid in the identification of the predator marks to species. These cameras were also checked and rotated among models on a weekly basis. We reviewed the data files from each camera to match predator-to-prey marks if a predation event had occurred and to otherwise improve camera placement as the study progressed.
To aid in accurate verification of raptor depredations, Window to the Wild, a nonprofit organization specializing in raptor education for the public, assisted us by presenting small (n = 20) and large (n = 20) snake models to red-tailed hawks and great-horned owls at their facility and recording observations of raptor behavior when the models were being attacked. We compared the condition (i.e., number and location of breaks, pressure marks, etc.) of the models that were attacked at this facility to depredated models collected from the Great Trinity Forest. This comparison increased our confidence in categorizing the depredation events in the Great Trinity Forest as the following five predator types: raptor, wading bird, feral hog, rodent, and mesocarnivore.
2.5. Statistical Methods
To test for both predator proliferation and predation relaxation in the Great Trinity Forest raptor community, we used categorical comparison of our high- and low-urbanization sites. We did not use data from the medium-urbanization sites for these reasons: (1) comparing only high and low sites allowed us to look at the largest difference in levels of urbanization; (2) by comparing only high and low sites, we decreased the likelihood of individual raptors being present at multiple sites; (3) the medium site had high variation in raptor activity, possibly driven by station-level factors that altered raptor detectability; and (4) the medium site contained an abundance of giant ragweed (
Ambrosia trifida) that made it difficult to place models in locations where they could be seen by hunting raptors. We compared raptor activity between the high and low sites (
n = 6 survey locations each) using ANOVA. As raptor predation attempts were only observed on the snake models (see the
Section 3), we compared the proportion of predation attempts on snakes between the high and low sites using a Fisher’s exact test. The data were transformed (arcsine square root) prior to analysis.
As an additional way to examine the predation paradox, we looked for a decoupling of the predator-prey dynamics by using linear correlation to look for a relationship between the proportion of raptors observed and the proportion of raptor depredations across the Great Trinity Forest. For all analyses, α = 0.05.
3. Results
The extent of impervious surface differed significantly among the urbanization sites (Welch’s ANOVA: F
2,15 = 41.61,
p < 0.001), increasing from the low to high site, and ranging from 14.1% to 42.6%, respectively (
Table 1). Forest cover across the three sites ranged from 21.9% to 38.5%, peaking in the medium-urbanization site (mean = 37.7 ± 0.6 SD,
n = 6). As expected, we found the lowest percentage of forest cover within the high-urbanization site (21.9%, mean = 27.7 ± 4.4 SD,
n = 6).
In total, we observed 161 raptors representing eight species within the study area during the 10-week survey period. In addition to the five species represented in the call playbacks, we observed Swainson’s hawks (Buteo swainsoni), Mississippi kites (Ictinia mississippiensis), and American kestrels. We observed the most raptors within the low-urbanization site, with a total of 75 independent detections. The high and medium sites followed with 48 and 38 detections, respectively. We observed this trend throughout the study period, with the low-urbanization site having the highest weekly average raptor activity with few exceptions.
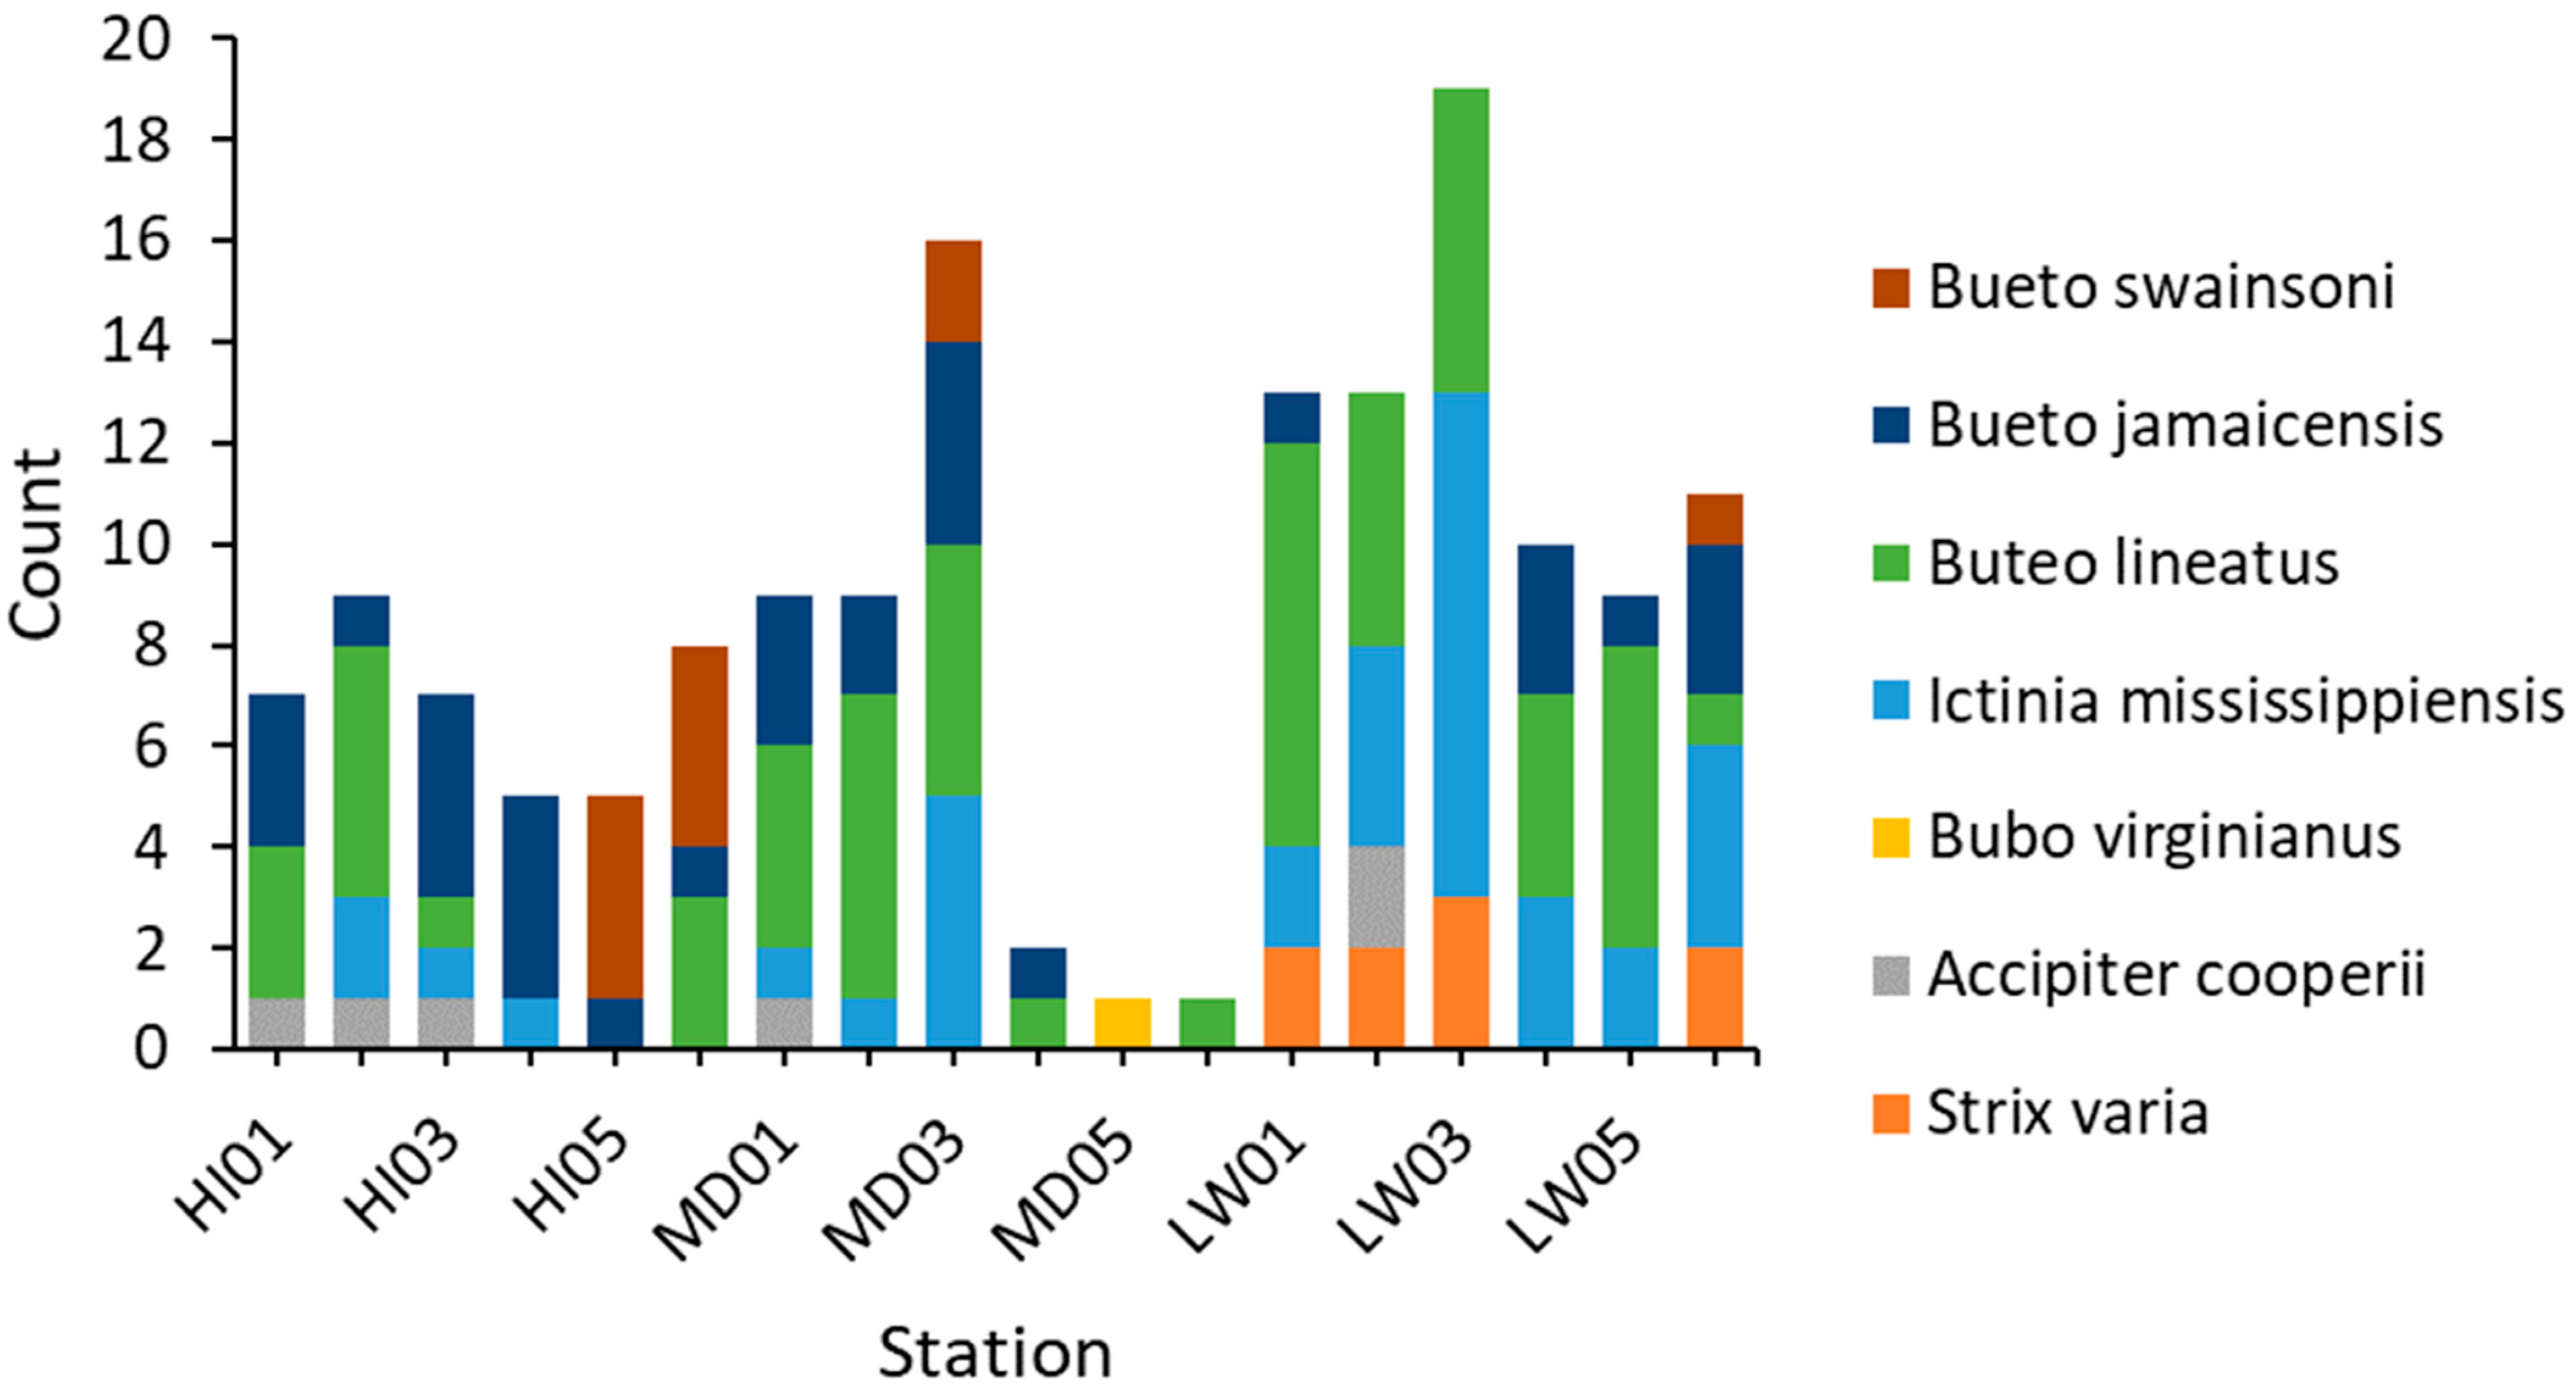
Our comparison of average raptor activity along the gradient revealed variation across the entire study area. Red-tailed hawks, red-shouldered hawks, and Mississippi kites were the most commonly observed species (
Figure 3). In general, red-shouldered hawks were the most active species across the gradient, and along with the Mississippi kites, were observed to be more active at the medium- to low-urbanization stations. Red-tailed hawks, on the other hand, were overall more active at stations with high to medium-high urbanization. A few raptor species were observed at only a small number of survey locations. We observed barred owls, for example, only within the low-urbanization area.
Raptor diversity, as measured by the Shannon equitability index, ranged from 0.86 at the highest level of urbanization to 0.91 at the lowest level of urbanization (mean = 0.76, SD = 0.29,
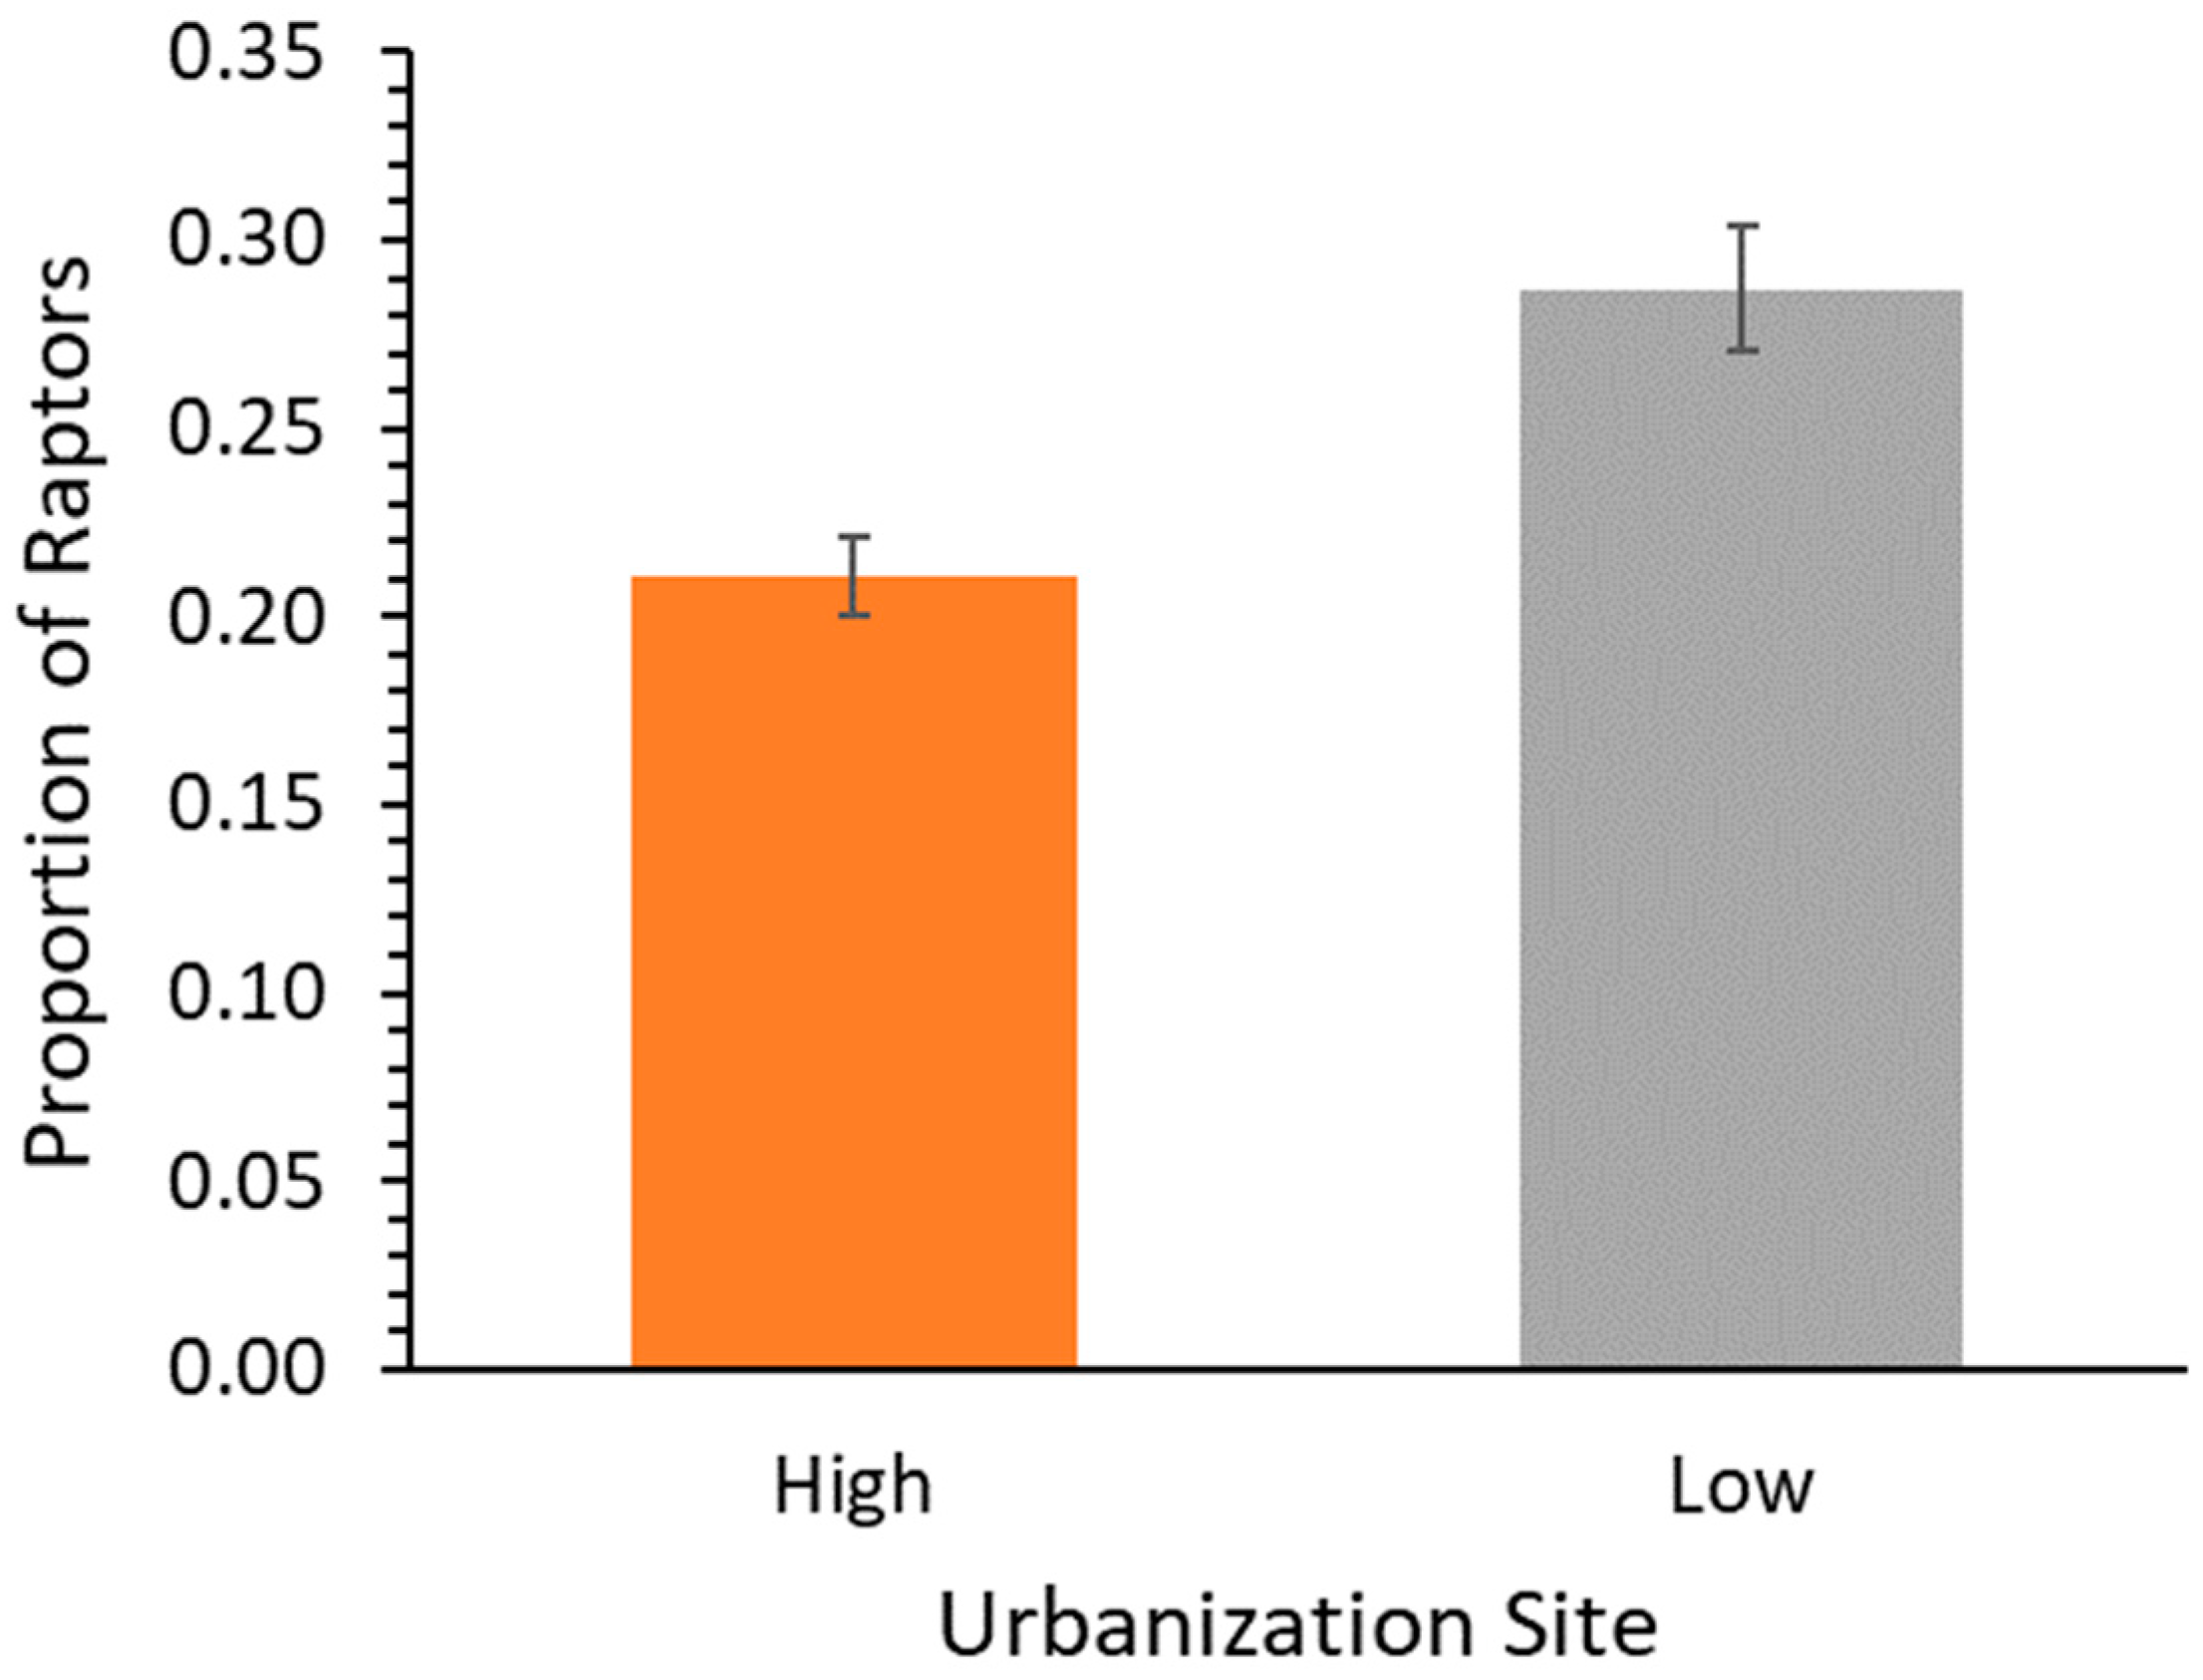
n = 18 stations). Raptor activity was significantly higher at the low-urbanization site compared to the high-urbanization site (one-way ANOVA: F
1,10 = 14.95,
p = 0.003;
Figure 4).
We deployed a total of 732 urethane foam prey models throughout the study period (
Table 2). A total of 61 models were confirmed depredated, and 23 models were missing when checked and never recovered. It is feasible to assume that these missing models were depredated; however, as this cannot be verified, we have omitted the missing models from further analysis and discussion. The proportion of predation attempts was significantly higher for small and large snake models compared to controls (Fisher’s exact test: medium snake vs. control,
p = 0.004; small snake vs. control,
p = 0.026). In contrast, the proportion of predation attempts on mouse models did not differ from the controls (Fisher’s exact test:
p = 0.223).
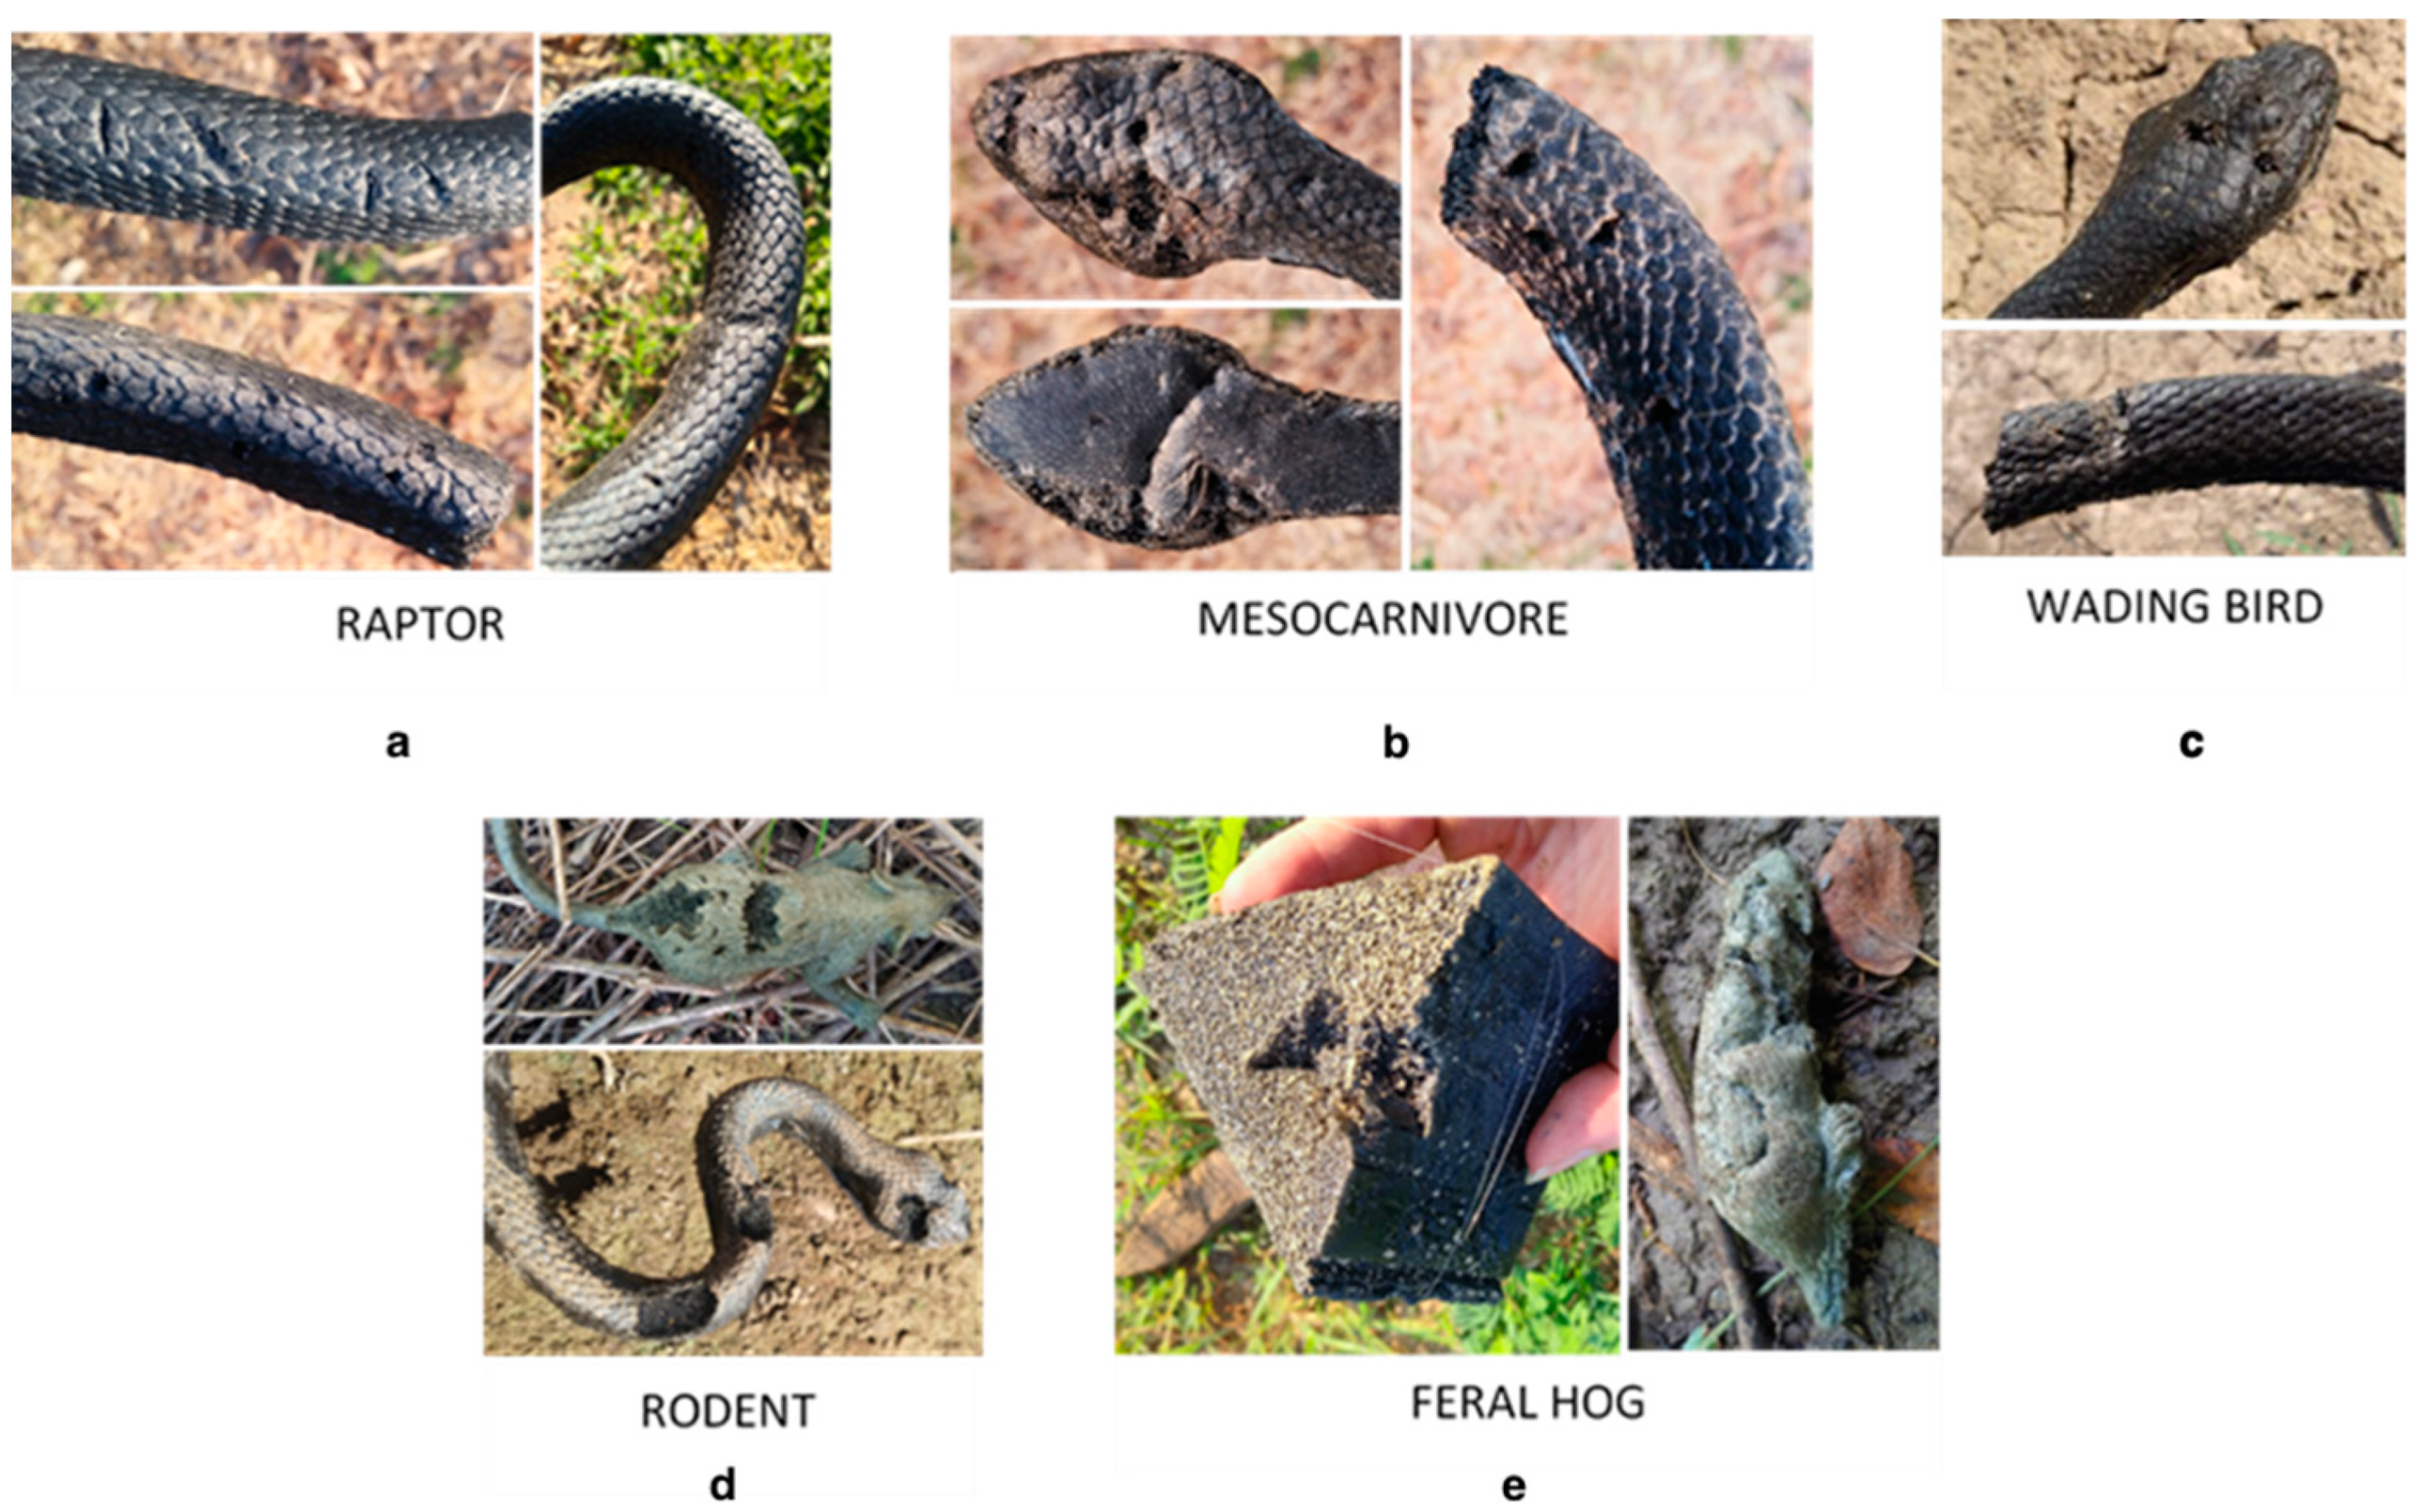
Using a combination of markings and breaks made in the models, camera footage, and observations by Window to the Wild, we assigned a predator type (raptor, wading bird, feral hog, rodent, or mesocarnivore) to each of the 61 depredated models. Raptors attacked 4.5% of all deployed models and were responsible for 52.5% of all depredation events, greater than any other predator type we identified. Raptors exclusively depredated snake models and were overall the primary predator of this model type. Due to the force with which raptors attacked snake models, depredations were primarily characterized by broken models, typically into three or more pieces (
Figure 5a). Pressure marks left by talons were usually absent, but occasionally observed. Beak marks left on the dorsal side were common, ranging from deep indentations to shallow scrapes, generally midline or close to the head. The heads of models were occasionally missing.
Although mesocarnivore and wading bird depredation events also often resulted in broken snake models, these predator types also left diagnostic marks (
Figure 5b). For example, mesocarnivore attacks were characterized by the presence of small, triangular tooth marks at and around breaks or full and partial bite marks without breaks, accounting for approximately 2% of all models deployed and 23% of all depredation events. In contrast, wading bird attacks were primarily characterized by stab marks to the head, but also exhibited talon marks on the ventral side, close to breaks (
Figure 5c). Wading birds only attacked large snake models. Rodent and feral hog depredation events were likewise primarily characterized by tooth marks on prey models (
Figure 5d,e). Rodent depredation events were characterized by small, chewed areas on distal ends of models. A few large snake models exhibited multiple rows of chew marks with even spacing.
Because raptors appeared to target the snake mimics with no evidence of predation attempts on mice, we restricted our analysis of raptor–prey dynamics to snake models only, with both small and large models combined together for a single analysis. We found no significant difference in raptor predation on snake mimics between the high- and low-urbanization sites (Fisher’s exact test: p = 0.440). Likewise, we found no significant correlation between the proportion of snakes depredated by raptors and the proportion of raptors observed along the urban-to-rural gradient (r = −0.255, p = 0.307, n = 18 survey stations).
4. Discussion
We found no evidence of predator proliferation in the raptor community in the Great Trinity Forest, as our results showed significantly more raptor activity at sites with lower levels of urbanization. Although the predator proliferation hypothesis predicts that predators should be more numerous in urban areas [
6], responses to urbanization vary by taxon, with some species avoiding developed areas, while others reach their peak density in cities [
34,
35]. Apex predators are often less common in urban areas than in surrounding wildlands due to their large home range requirements and adequate numbers of large prey [
35,
36]. Although certain species within our raptor community have shown evidence for predator proliferation by exploitation of hyperabundant urban prey (e.g.,
Accipiter cooperii [
10,
11]), many of the raptor species within our community may represent apex predators or species that are less tolerant of human development.
We found no evidence for predation relaxation among the Great Trinity Forest raptor community in the way we hypothesized, as our results showed no difference in predation rates between the high- and low-urbanization sites. We did not find evidence for an urban predation paradox in the Great Trinity Forest, in which we would expect to see predation rates decrease in urban areas despite an increase in the number of predators. Although our results showed that raptors were more common at low-urbanization sites, we did not see a proportional increase in predation rates on the prey mimics as expected. This result suggested that traditional predator-prey dynamics have been decoupled in the Great Trinity Forest.
Traditionally, the urban predation paradox is defined as a decoupling of predator-prey dynamics in urban areas driven by an increase in predator numbers as urbanization increases with no corresponding increase in predation rates [
4]. Our study showed a decoupling of predator-prey dynamics, but this appeared to be driven by an increase in predator numbers in less-urbanized areas with no corresponding increase in predation rates. There are several possible explanations for these results. For raptors with large home ranges, the entire Great Trinity Forest may represent one urbanized habitat in which the variation in urbanization levels was insufficient to impact predation behavior in our target species. To determine if this is the case, a comparative study could be conducted to measure differences in predator-prey dynamics between the Great Trinity Forest, or another large urban forest fragment, and similar forest fragments with no surrounding urbanization (e.g., a forest fragment in a rural or agricultural landscape).
The lack of positive relationship between predation rates and raptor activity in low-urbanization areas could also be explained by which species were driving the increase in raptor activity in areas of low urbanization. Barred owls and Mississippi kites were both far more common in the low-urbanization site, and although they are believed to include snakes in their diet, they generally prey on snakes less often than other species in our study site (e.g.,
Buteo spp. [
21,
37,
38,
39]). Finally, the overall low predatory response by raptors on snake models may have obscured possible patterns in predation across a gradient of urbanization. We acknowledge that the limitations of our study, with respect to both time (i.e., a single season) and geographic extent, may have impacted our ability to identify the presence of an urban predation paradox in the Great Trinity Forest. Nonetheless, and despite these limitations, the identification of a decoupling in the predator-prey dynamics in this urban forest provided new insights, as did the novel use of prey mimics to study the impact of urbanization on predator-prey dynamics.
The overall depredation rate of snake models (11.2% excluding missing models) and depredation rate of raptors (6.0%) were similar to or lower than other studies involving prey mimics, aside from nonstationary models used in Paluh et al. [
32,
40,
41,
42]. Many studies used a similar number of deployed models, but most measured discrete variables such as responses from predators based on differences in color, pattern, head shape, or movement from models [
31,
32,
33,
40,
41,
42]. This result suggested that future predation studies using stationary prey mimics will likely require more deployed models, through increasing either the intensity or temporal scale of model deployment. Raptors are visual hunters [
32], and may be less able to detect or even recognize immobile models as prey items [
40]. Predators are, in general, more likely to attack moving rather than stationary prey [
40,
43]. Intermittent movement incorporated into prey models has been shown to create more realistic prey, significantly increasing depredation rates [
33,
40].
The snake models we deployed were painted black to mimic a wide variety of water snake species found in the Great Trinity Forest. However, it is possible that raptors interpreted these models as costly prey items because venomous water moccasins (
Agkistrodon piscivorous) in this forest are also black. Most predators make a post-detection decision on whether to attack prey based on developed search images of dangerous versus safe prey [
33]. Due to instinctive avoidance of dangerous prey, it is plausible that the mimics would not be depredated by raptors if other prey were available [
31]. This could have contributed to the low rate of raptor depredation we observed.
It is also important to point out that factors of urbanization affecting raptors and their prey do not exist in isolation, and results can change based on perspective. For example, prey hyperabundance generated from increased anthropogenic subsidies may occur simultaneously with an increase in the immigration of generalist raptors able to thrive in the same urban environment [
43,
44]. If these raptors depredate these types of prey, the events may cancel each other out, suggesting no detrimental effects of urbanization for either predator or prey species, and therefore masking any disassociation in predator-prey relationships in the ecosystem.


