
Conservation of Genetic Diversity of Scots Pine (Pinus sylvestris L.) in a Central European National Park Based on cpDNA Studies


Abstract
:1. Introduction
2. Materials and Methods
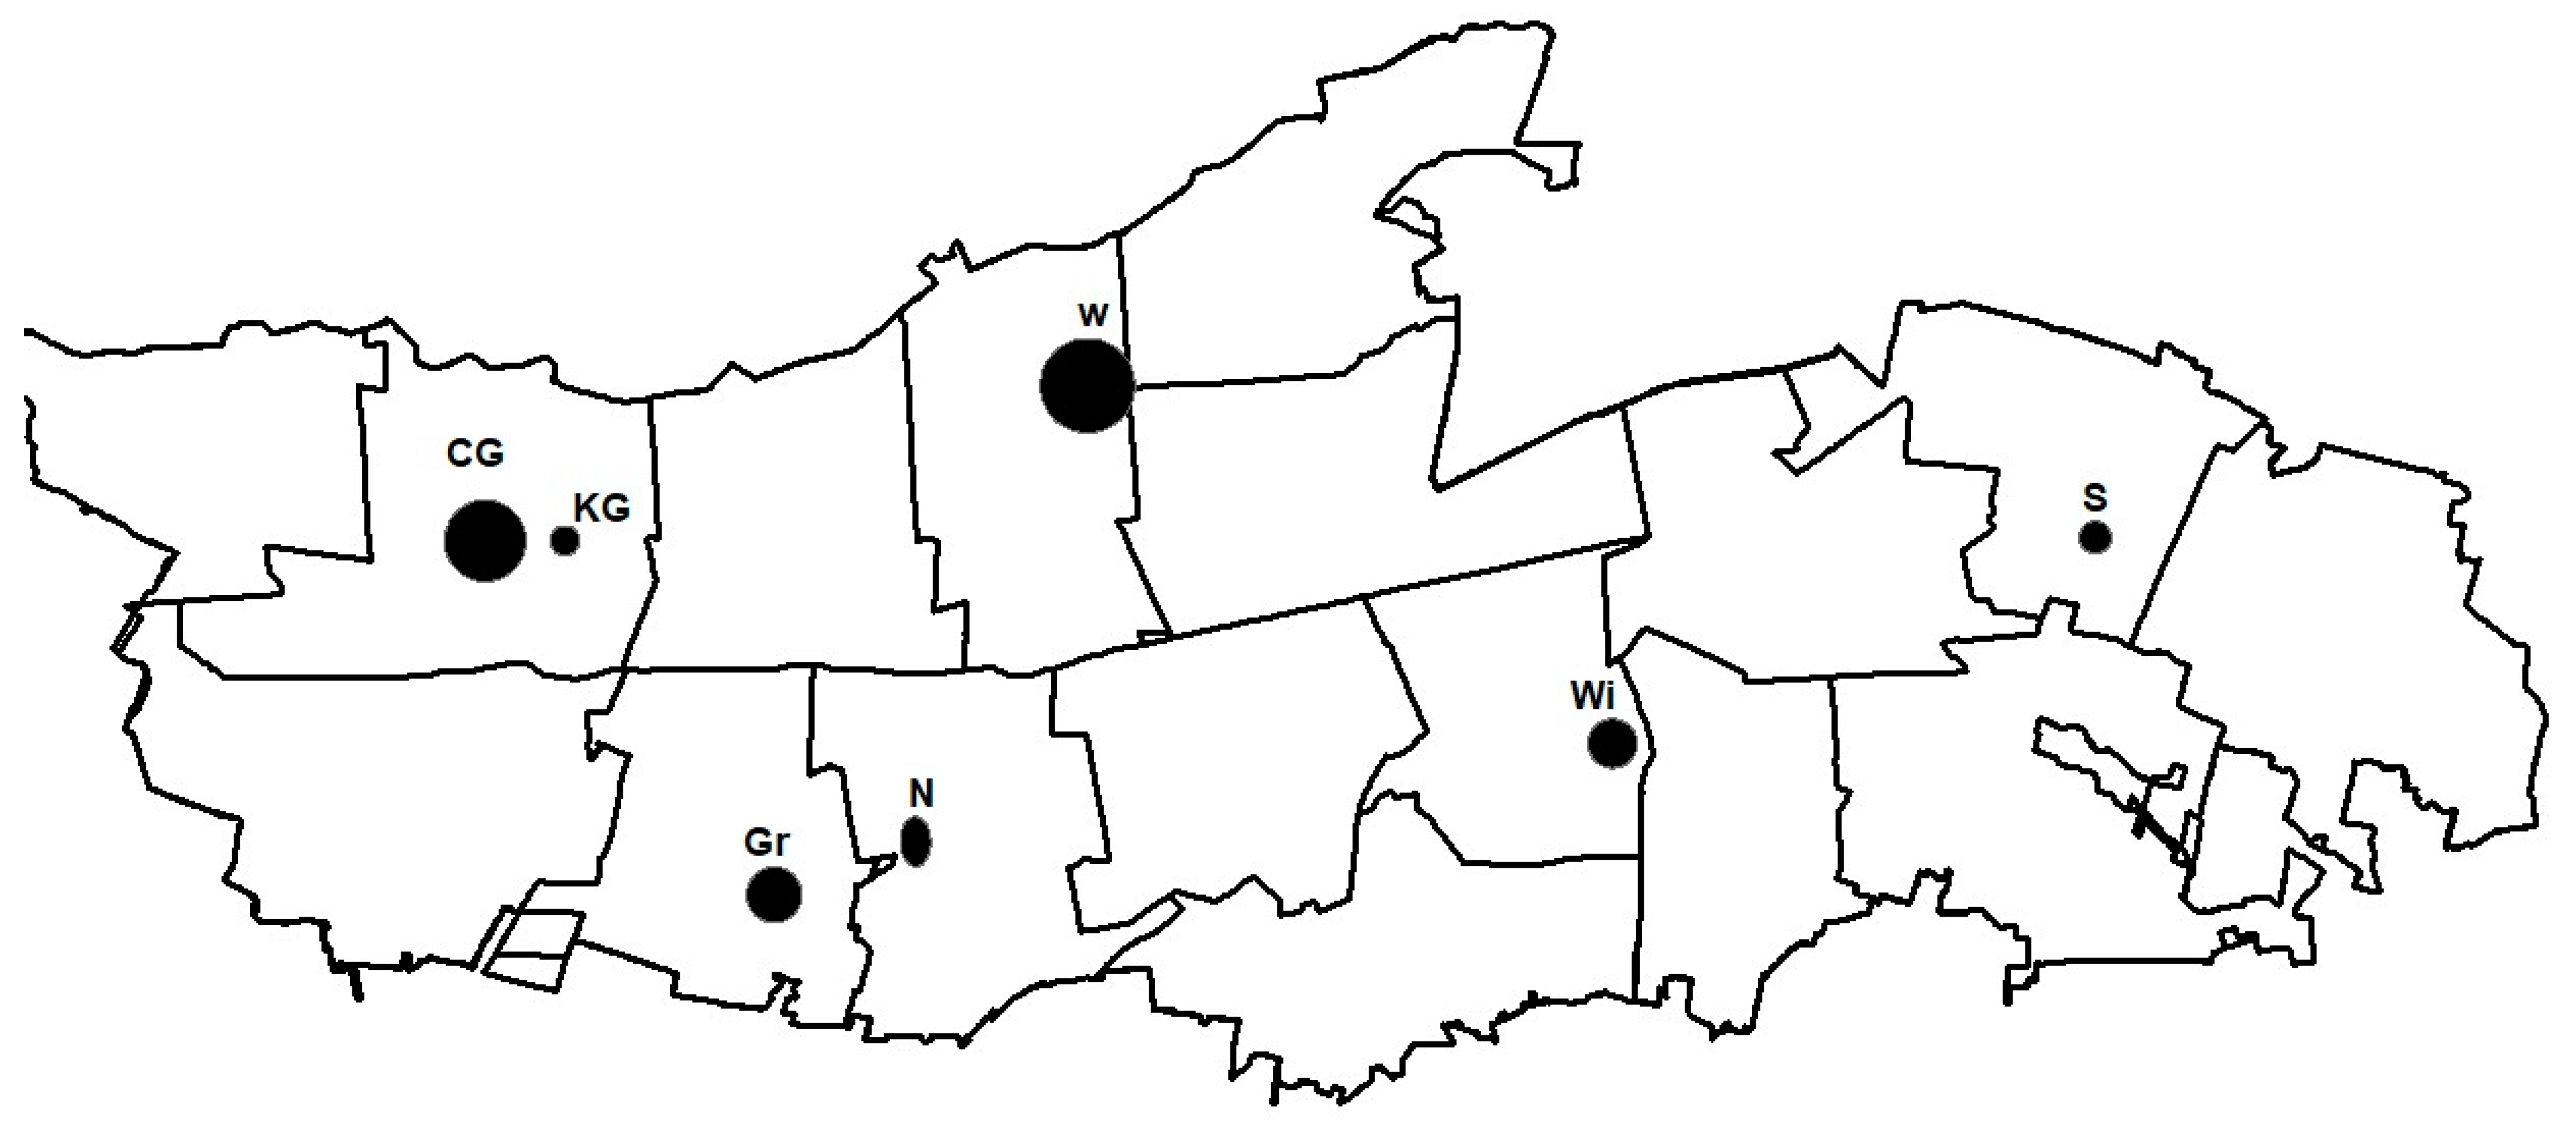
2.1. Research Area
2.2. Sample Collection
2.3. DNA Extraction and Microsatellites Genotyping
2.4. Data Analysis
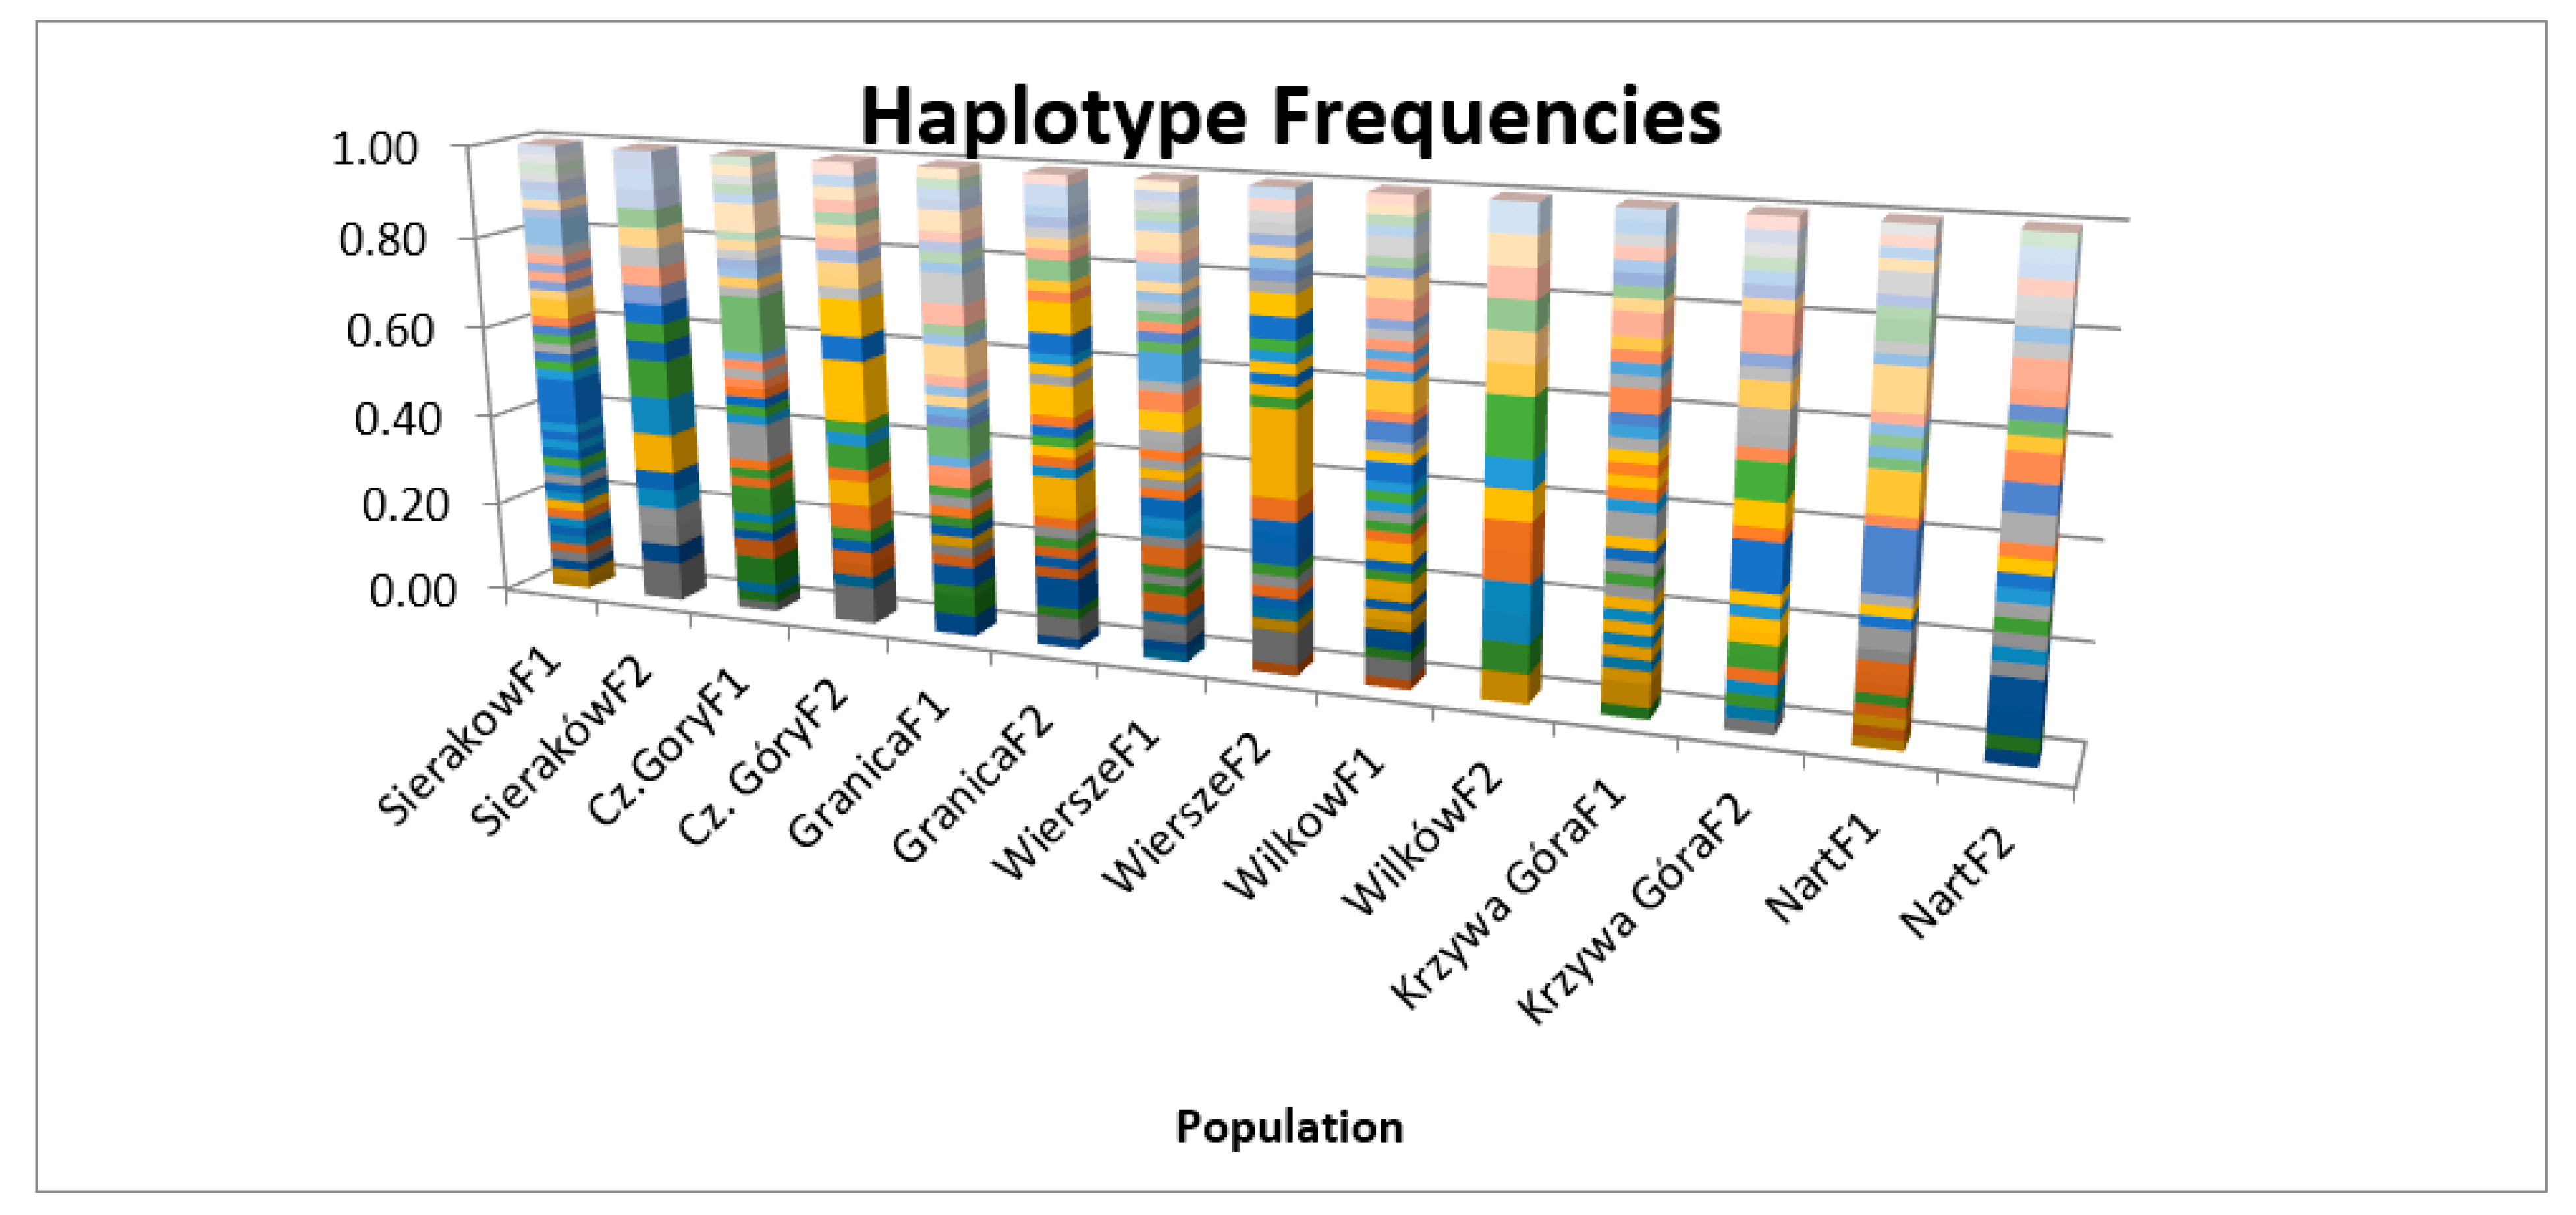
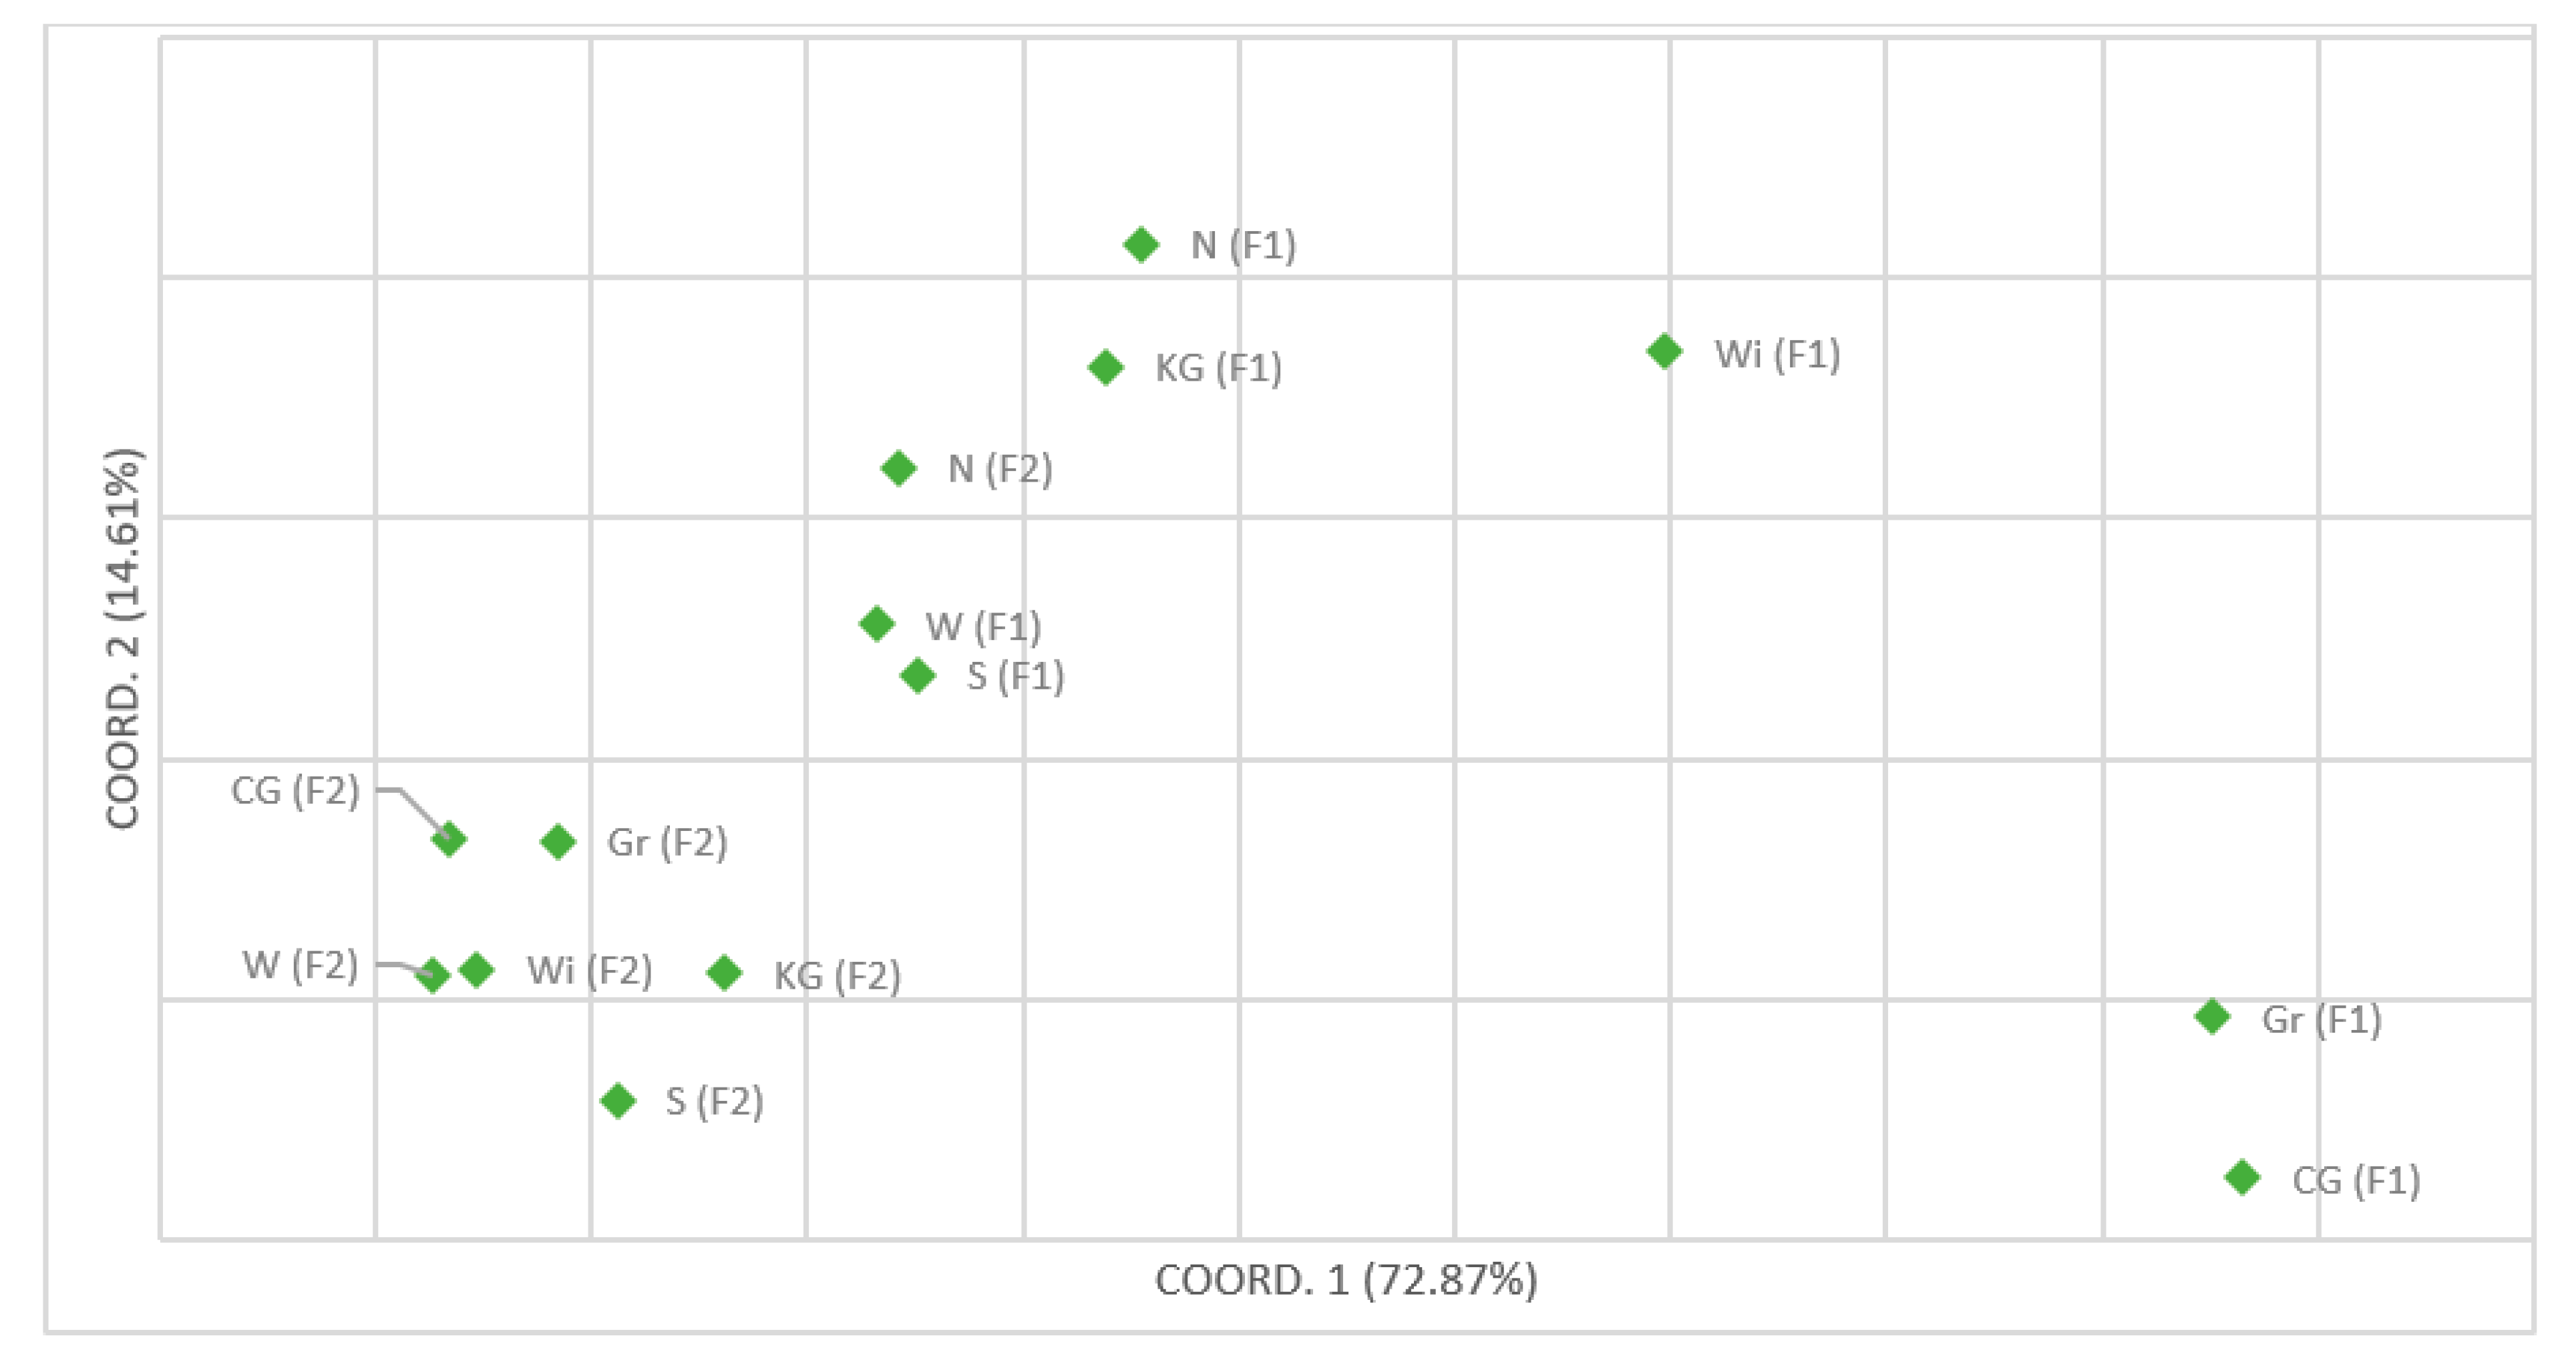
3. Results
4. Discussion
5. Conclusions
Supplementary Materials
Author Contributions
Funding
Institutional Review Board Statement
Informed Consent Statement
Data Availability Statement
Conflicts of Interest
References
- Floran, V.; Sestras, R.E.; Garcia-Gil, M.R. Organelle Genetic Diversity and Phylogeography of Scots Pine (Pinus sylvestris L.). Not. Bot. Horti Agrobot. Cluj-Napoca 2011, 39, 317–322. [Google Scholar] [CrossRef] [Green Version]
- Brzeziecki, B.; Zajączkowski, J.; Olszewski, A.; Bolibok, L.; Andrzejczyk, T.; Bielak, K.; Buraczyk, W.; Drozdowski, S.; Gawron, L.; Jastrzębowski, S.; et al. Struktura i dynamika wielogeneracyjnych starodrzewów sosnowych występujących w obszarach ochrony ścisłej Kaliszki i Sieraków w Kampinoskim Parku Narodowym. Część 1. Zróżnicowanie gatunkowe, zagęszczenie i pierśnicowe pole przekroju. Sylwan 2020, 164, 443–453. [Google Scholar] [CrossRef]
- Schuster, W.S.F.; Mitton, J.B. Paternity and gene dispersal in limber pine (Pinus flexilis James). Heredity 2000, 84, 348–361. [Google Scholar] [CrossRef] [PubMed]
- Ivetić, V.; Devetaković, J.; Nonić, M.; Stanković, D.; Šijačić-Nikolić, M. Genetic diversity and forest reproductive material—From seed source selection to planting. iForest 2016, 9, 801–812. [Google Scholar] [CrossRef] [Green Version]
- Tyburski, Ł. Kampinos Forest between 1914–1938. Parki nar. Rez. Przyr. 2021, 40, 85–98. [Google Scholar]
- Przybylski, P.; Mohytych, V.; Rutkowski, P.; Tereba, A.; Tyburski, Ł.; Fyalkowska, K. Relationships between Some Biodiversity Indicators and Crown Damage of Pinus sylvestris L. in Natural Old Growth Pine Forests. Sustainability 2021, 13, 1239. [Google Scholar] [CrossRef]
- Krzanowska, H.; Łomnicki, A.; Rafiński, J. Wprowadzenie Do Genetyki Populacji; Wydawnictwo Naukowe PWN: Warszawa, Poland, 1982. [Google Scholar]
- Noss, R.F. Beyond Kyoto: Forest management in a time of rapid climate change. Conserv. Biol. 2001, 15, 578–590. [Google Scholar] [CrossRef]
- Frankham, R. How closely does genetic diversity in finite populations conform to predictions of neutral theory? Large deficits in regions of low recombination. Heredity 2012, 108, 167–178. [Google Scholar] [CrossRef] [Green Version]
- Spielman, D.; Brook, B.W.; Frankham, R. Most species are not driven to extinction before genetic factors impact them. Proc. Natl. Acad. Sci. USA 2004, 101, 15261–15264. [Google Scholar] [CrossRef] [Green Version]
- O’Grady, J.J.; Brook, B.W.; Reed, D.H.; Ballou, J.D.; Tonkyn, D.W.; Frankham, R. Realistic levels of inbreeding depression strongly affect extinction risk in wild populations. Biol. Conserv. 2006, 133, 42–51. [Google Scholar] [CrossRef]
- Hoelzel, A.R.; Bruford, M.W.; Fleischer, R.C. Conservation of adaptive potential and functional diversity. Conserv. Genet. 2019, 20, 1–5. [Google Scholar] [CrossRef] [Green Version]
- Razgour, O.; Forester, B.; Taggart, J.B.; Bekaert, M.; Juste, J.; Carlos Ibáñez, C.; Puechmaille, S.J.; Roberto Novella-Fernandez, R.; et al. Considering adaptive genetic variation in climate change vulnerability assessment reduces species range loss projections. Proc. Natl. Acad. Sci. USA 2019, 116, 10418–10423. [Google Scholar] [CrossRef] [PubMed] [Green Version]
- Laikre, L. Genetic diversity is overlooked in international conservation policy implementation. Conserv. Genet. 2010, 11, 349–354. [Google Scholar] [CrossRef]
- Elsik, C.G.; Minihan, V.T.; Hall, S.E.; Scarpa, A.M.; Williams, C.G. Low-copy microsatellite for Pinus taeda L. Genome 2000, 43, 550–555. [Google Scholar] [CrossRef]
- Wang, B.; Chang, R.Z.; Tao, L.; Guan, R.; Yan, L.; Zhang, M. Identification of SSR primer numbers for analyzing genetic diversity of Chinese soybean cultivated soybean. Mol. Plant Breed. 2003, 1, 82–88. [Google Scholar]
- Fady, B.; Lefèvre, F.; Reynaud, M. Gene flow among different taxonomic units: Evidence from nuclear and cytoplasmic markers in Cedrus plantation forests. Theor. Appl. Genet. 2003, 107, 1132–1138. [Google Scholar] [CrossRef]
- Gómez, A.; González-Martínez, S.C.; Collada, C.; Gil, L.; Climent, J. Complex population genetic structure in an endemic Canary Island pine using chloroplast microsatellite markers. Theor. Appl. Genet. 2003, 107, 1123–1131. [Google Scholar] [CrossRef]
- Wachowiak, W.; Lewandowski, A.; Prus-Głowacki, W. Reciprocal controlled crosses between Pinus sylvestris and P. mugo verified by a species-specific cpDNA marker. J. Appl. Genet. 2005, 46, 41–43. [Google Scholar]
- Celiński, K.; Kijak, H.; Barylski, J.; Grabsztunowicz, M.; Wojnicka-Półtorak, A.; Chudzińska, E. Characterization of the complete chloroplast genome of Pinus uliginosa (Neumann) from the Pinus mugo complex. Conserv. Genet. Resour. 2017, 9, 209–212. [Google Scholar] [CrossRef] [Green Version]
- Semerikov, V.L.; Semerikova, S.A.; Dymshakova, O.S.; Zatsepina, K.G.; Tarakanov, V.V.; Tikhonova, I.V.; Ekart, A.K.; Vidyakin, A.I.; Jamiyansuren, S.; Rogovtsev, R.V.; et al. Microsatellite loci polymorphism ofchloroplast DNA of the pine tree (Pinus sylvestris L.) in Asia and Eastern Europe. Genetika 2014, 50, 660–669. [Google Scholar]
- Pazouki, L.; Shanjani, P.S.; Fields, P.D.; Martins, K.; Suhhorutsenko, M.; Viinalass, H.; Niinemets, U. Large within-population genetic diversity of the widespread conifer Pinus sylvestrisat its soil fertilitylimit characterized by nuclear and chloroplast microsatellite markers. Eur. J. For. Res. 2016, 135, 161–177. [Google Scholar] [CrossRef]
- Wojnicka-Półtorak, A.; Celiński, K.; Chudzińska, E. Genetic Diversity among Age Classes of a Pinus sylvestris (L.) Population from the Białowieża Primeval Forest, Poland. Forests 2017, 8, 227. [Google Scholar] [CrossRef] [Green Version]
- Vendramin, G.G.; Lelli, L.; Rossi, P.; Morgante, M. A set of primers for the amplificationof chloroplast microsatellites in Pinaceae. Mol. Ecol. 1996, 5, 595–598. [Google Scholar] [CrossRef] [PubMed]
- Provan, J.; Soranzo, N.; Wilson, N.J.; McNicol, J.W.; Forrest, G.I.; Cottrell, J.; Powell, W. Gene-poolvariation in Caledonian and European Scots pine (Pinus sylvestris L.) revealed by chloroplastsimple-sequence repeats. Proc. R. Soc. Lond. Ser. B Biol. Sci. 1998, 265, 1697–1705. [Google Scholar] [CrossRef] [PubMed]
- Nowakowska, J.A.; Oszako, T.; Tereba, A.; Konecka, A. Forest tree species traced with a DNA-based proof for illegal logging case in Poland. In Evolutionary Biology: Biodiversification from Genotype to Phenotype, 1st ed.; Springer: Berlin/Heidelberg, Germany, 2015. [Google Scholar]
- Eliades, N.-G.; Eliades, D.G. Haplotype Analysis: Software for Analysis of Haplotypes Data. Distributed by the Authors; Forest Genetics and Forest Tree Breeding; Georg-Augst University: Goettingen, Germany, 2009. [Google Scholar]
- Excoffier, L.; Lischer, H.E.L. Arlequin suite ver. 3.5: A new series of programs to perform population genetics analyses under Linux and Windows. Mol. Ecol. Resour. 2010, 10, 564–567. [Google Scholar] [CrossRef]
- Peakall, R.; Smouse, P. Genealex 6.5: Genetic Analysis in Excel. Population genetic software for teaching and research. Mol. Ecol. Notes 2006, 6, 288–295. [Google Scholar] [CrossRef]
- Mantel, N. The detection of disease clustering and a generalized regression approach. Cancer Res. 1967, 27, 209–220. [Google Scholar]
- Nei, M. Estimation of average heterozygosity and genetic distance from a small number of individuals. Genetics 1978, 89, 583–590. [Google Scholar] [CrossRef]
- Rousset, F. Genepop′007: A complete re-implementation of the genepop software for Windows and Linux. Mol. Ecol. Resour. 2008, 8, 103–106. [Google Scholar] [CrossRef]
- Kosińska, J.; Lewandowski, A.; Chalupka, W. Genetic Variability of Scots Pine Maternal Populations and Their Progenies. Silva Fenn. 2007, 41, 5. [Google Scholar] [CrossRef] [Green Version]
- Hu, X.S.; Li, B. Linking evolutionary quantative genetics to the conservation of genetic resources in natural forest populations. Silvae Genet. 2001, 51, 177–183. [Google Scholar]
- Lindgren, D.; Paule, L.; Shen, X.H.; Yazdani, R.; Segerström, U.; Wallin, J.E.; Lejdebro, M.L. Can viable pollen carry Scots pine genes over long distances? Grana 1995, 34, 64–69. [Google Scholar] [CrossRef]
- Harju, A.; Nikkanen, T. Reproductive success of orchard and non-orchard pollens during different stages of pollen shedding in a Scots pine seed orchard. Scand. J. For. Res. 1996, 26, 1096–1102. [Google Scholar]
- Adams, T.; Burczyk, J. Magnitude and implications of gene flow in gene conservation reserves. In Forest Conservation Genetics: Principles and Practice; Young, A., Boshier, D., Boyle, T., Eds.; CSIRO Publishing & CABI Publishing: Collingwood, Australia, 2000; pp. 215–224. ISBN 0 643 06260 2. [Google Scholar]
- Burczyk, J.; Lewandowski, A.; Chałupka, W. Local pollen dispersal and distant gene flow in Norwey spruce. For. Ecol. Manag. 2004, 197, 39–48. [Google Scholar] [CrossRef]
- Müller-Starck, G. Protection of genetic variability in forest trees. For. Genet. 1995, 2, 121–124. [Google Scholar]
- Klisz, M.; Ukalski, K.; Ukalska, J.; Jastrzębowski, S.; Puchałka, R.; Przybylski, P.; Mionskowski, M.; Matras, M. What can we learn an erly test on the adaptation of silver fir populations to marginal envirments. Forest 2018, 9, 441. [Google Scholar] [CrossRef] [Green Version]


| Location | Czerwińskie Góry | Wilków | Granica | Sieraków | Wiersze | Nart | Krzywa Góra |
|---|---|---|---|---|---|---|---|
| Abbreviation | CG | W | Gr | S | Wi | N | KG |
| Coordinates | 20°23′36.67″ E 52°20′27.693″ N | 20°32′34.005″ E 52°21′45.607″ N | 20°27′50.019″ E 52°17′21.605″ N | 20°46′34.957″ E 52°20′12.144″ N | 20°39′45.706″ E 52°18′34.157″ N | 20°30′2.718″ E 52°17′49.844″ N | 20°25′14.603″ E 52°20′27.744″ N |
| Age * of the dominant P. sylvestris | 200–210 (avg.: 205) | 180–200 (avg.: 190) | 160–170 (avg.: 165) | 190–200 (avg.: 195) | app. 160 | 210–230 (avg.: 220) | app. 108 |
| Plant community | Querco roboris-Pinetum | Querco roboris-Pinetum | SNFPC/Querco Carpinetum | Querco roboris-Pinetum | Querco roboris-Pinetum | Tilio-Carpinetum | Querco roboris-Pinetum |
| Population | N | A | Ph | Rh | He | D2sh |
|---|---|---|---|---|---|---|
| F1 generation | ||||||
| Sieraków | 50 | 44 | 28 | 35.586 | 0.992 | 4.297 |
| Cz. Góry | 50 | 36 | 19 | 29.532 | 0.976 | 3.625 |
| Granica | 46 | 35 | 19 | 31.015 | 0.986 | 3.218 |
| Wiersze | 49 | 41 | 23 | 34.303 | 0.992 | 5.523 |
| Wilków | 49 | 40 | 18 | 33.606 | 0.991 | 2.754 |
| Krzywa Góra | 41 | 37 | 17 | 36.000 | 0.995 | 3.594 |
| Nart | 46 | 32 | 13 | 28.145 | 0.971 | 2.584 |
| Mean | 47.286 | 37.857 | 19.571 | 32.598 | 0.986 | 3.657 |
| F2 generation | ||||||
| Sieraków | 24 | 20 | 11 | 13.261 | 0.986 | 2.557 |
| Cz. Góry | 38 | 27 | 14 | 12.642 | 0.977 | 2.893 |
| Granica | 46 | 34 | 13 | 13.292 | 0.985 | 2.783 |
| Wiersze | 43 | 30 | 13 | 12.123 | 0.961 | 2.508 |
| Wilków | 16 | 15 | 8 | 14.000 | 0.992 | 3.950 |
| Krzywa Góra | 39 | 30 | 13 | 13.078 | 0.981 | 3.620 |
| Nart | 35 | 29 | 16 | 13.790 | 0.990 | 3.369 |
| Mean | 34.429 | 26.429 | 12.571 | 13.170 | 0.982 | 3.097 |
| Source of Variation | d.f. | Sum of Squares | Variance Components | Percentage of Variation |
|---|---|---|---|---|
| F1 generation | ||||
| Among populations | 6 | 147.358 | 0.22803 | 13.17 *** |
| Among individuals within populations | 324 | 974.007 | 1.50310 | 86.83 *** |
| Within individuals | 0 | 0.000 | 0.00000 | 0.00 |
| Total | 661 | 1121.366 | 1.73112 | |
| IBD Mantel | R | p-value | ||
| 0.0064 | 0.978 | |||
| F2 generation | ||||
| Among populations | 6 | 34.026 | 0.04251 | 2.96 ** |
| Among individuals within populations | 234 | 651.633 | 1.39238 | 97.04 *** |
| Within individuals | 241 | 0.000 | 0.00000 | 0.00 |
| Total | 481 | 685.660 | 1.43489 | |
| IBD Mantel | R | p-value | ||
| −0.0897 | 0.6991 | |||
| SierakowF1 | SierakówF2 | Cz. GoryF1 | Cz. GóryF2 | GranicaF1 | GranicaF2 | WierszeF1 | WierszeF2 | WilkowF1 | WilkówF2 | Krzywa GóraF1 | Krzywa GóraF2 | NartF1 | NartF2 | |
|---|---|---|---|---|---|---|---|---|---|---|---|---|---|---|
| SierakówF1 | 0.00098 | 0.00000 | 0.01367 | 0.00000 | 0.04102 | 0.00000 | 0.07227 | 0.55176 | 0.01953 | 0.07910 | 0.00000 | 0.00098 | 0.71289 | |
| SierakówF2 | 0.07608 | 0.00000 | 0.00684 | 0.00000 | 0.00293 | 0.00000 | 0.00000 | 0.00000 | 0.00586 | 0.00000 | 0.14746 | 0.00000 | 0.00000 | |
| Cz. GóryF1 | 0.23506 | 0.32715 | 0.00000 | 0.25586 | 0.00000 | 0.00000 | 0.00000 | 0.00000 | 0.00000 | 0.00000 | 0.00000 | 0.00000 | 0.00000 | |
| Cz. GóryF2 | 0.03988 | 0.06253 | 0.33028 | 0.00000 | 0.85645 | 0.00000 | 0.22168 | 0.00879 | 0.69531 | 0.00000 | 0.65137 | 0.00000 | 0.00098 | |
| GranicaF1 | 0.22296 | 0.32722 | 0.01388 | 0.33303 | 0.00000 | 0.00000 | 0.00000 | 0.00000 | 0.00000 | 0.00000 | 0.00000 | 0.00000 | 0.00000 | |
| GranicaF2 | 0.02662 | 0.06792 | 0.32038 | 0.00180 | 0.31591 | 0.00000 | 0.29883 | 0.00781 | 0.41797 | 0.00000 | 0.18848 | 0.00000 | 0.00879 | |
| WierszeF1 | 0.10276 | 0.23585 | 0.14030 | 0.22757 | 0.12369 | 0.21324 | 0.00000 | 0.00000 | 0.00000 | 0.00195 | 0.00000 | 0.00000 | 0.00000 | |
| WierszeF2 | 0.02614 | 0.09994 | 0.28641 | 0.02056 | 0.28288 | 0.01585 | 0.19672 | 0.00781 | 0.19238 | 0.00000 | 0.00195 | 0.00000 | 0.00195 | |
| WilkówF1 | 0.00786 | 0.07290 | 0.25287 | 0.04376 | 0.24788 | 0.04082 | 0.11451 | 0.03907 | 0.01562 | 0.03125 | 0.00000 | 0.00488 | 0.25977 | |
| WilkówF2 | 0.06101 | 0.09049 | 0.35240 | 0.01116 | 0.35023 | 0.02159 | 0.25149 | 0.03414 | 0.06114 | 0.00000 | 0.28613 | 0.00000 | 0.00488 | |
| Krzywa GóraF1 | 0.02506 | 0.13552 | 0.22874 | 0.10931 | 0.21859 | 0.09545 | 0.06186 | 0.09813 | 0.03079 | 0.11282 | 0.00000 | 0.00488 | 0.09473 | |
| Krzywa GóraF2 | 0.05783 | 0.03013 | 0.34615 | 0.00709 | 0.35239 | 0.01795 | 0.25523 | 0.04897 | 0.05840 | 0.03121 | 0.13168 | 0.00000 | 0.00000 | |
| NartF1 | 0.05378 | 0.17311 | 0.25852 | 0.15318 | 0.23628 | 0.13939 | 0.09328 | 0.14344 | 0.04390 | 0.16928 | 0.04168 | 0.16777 | 0.07812 | |
| NartF2 | 0.00611 | 0.11074 | 0.26168 | 0.06494 | 0.24697 | 0.04748 | 0.11945 | 0.05946 | 0.01751 | 0.08519 | 0.02894 | 0.08120 | 0.02831 |
Publisher’s Note: MDPI stays neutral with regard to jurisdictional claims in published maps and institutional affiliations. |
© 2022 by the authors. Licensee MDPI, Basel, Switzerland. This article is an open access article distributed under the terms and conditions of the Creative Commons Attribution (CC BY) license (https://creativecommons.org/licenses/by/4.0/).
Share and Cite
Przybylski, P.; Tereba, A.; Meger, J.; Szyp-Borowska, I.; Tyburski, Ł. Conservation of Genetic Diversity of Scots Pine (Pinus sylvestris L.) in a Central European National Park Based on cpDNA Studies. Diversity 2022, 14, 93. https://doi.org/10.3390/d14020093
Przybylski P, Tereba A, Meger J, Szyp-Borowska I, Tyburski Ł. Conservation of Genetic Diversity of Scots Pine (Pinus sylvestris L.) in a Central European National Park Based on cpDNA Studies. Diversity. 2022; 14(2):93. https://doi.org/10.3390/d14020093
Chicago/Turabian StylePrzybylski, Paweł, Anna Tereba, Joanna Meger, Iwona Szyp-Borowska, and Łukasz Tyburski. 2022. "Conservation of Genetic Diversity of Scots Pine (Pinus sylvestris L.) in a Central European National Park Based on cpDNA Studies" Diversity 14, no. 2: 93. https://doi.org/10.3390/d14020093