Article

Structure and Characteristics of Plant-Frugivore Network in an Urban Park: A Case Study in Nanjing Botanical Garden Mem. Sun Yat-Sen

College of Biology and the Environment, Nanjing Forestry University, Nanjing 210037, China
*
Author to whom correspondence should be addressed.
Diversity 2022, 14(2), 71; https://doi.org/10.3390/d14020071
Submission received: 26 December 2021 / Revised: 12 January 2022 / Accepted: 19 January 2022 / Published: 21 January 2022
(This article belongs to the Topic Urban Biodiversity and Design)

Abstract

:
Interaction between animals and plants is an important way to maintain terrestrial biodiversity and ecosystem function, but little is known about the structure of reciprocal networks between fruit plants and frugivore birds in urban habitats. To explore the characteristics of the plant–frugivore network and network roles of species, we observed the fruit ripening phenology of 21 species of fruit plants and the interactions between these plants and 39 species of frugivore birds during the whole year in a large urban park. Then, we assessed the characteristics of the total plant–frugivore and seasonal networks, and analyzed the network roles of species and the relationship between their network roles and ecological traits. Fruit ripened mainly in autumn and winter, and interaction connections in the two seasons contributed 39.68% and 44.83% to the total network, respectively. The specialization (H2′), connectance (C), nestedness, and interaction evenness ( e H 2 ) of the network were lower in autumn and winter, while the interaction diversity was higher. Compared with the networks (N = 1000) generated by the null model, the observed network exhibited higher nestedness and interaction diversity (E2) and lower specialization (H2′), connectance (C), and interaction evenness ( e H 2 ). A correlation analysis combining ecological traits and network roles showed that plants with black fruit had higher effective partners and partner diversity, while other traits of plants and birds were not significantly correlated with their network parameters. The important plants (N = 6) and birds (N = 3) contributed to 71.78% and 67.55% of the total network connection, they were mainly evergreen plants with black and red drupes and omnivorous generalist birds with medium and large sizes. Our research highlighted the seasonal differences in urban plant–frugivore network and the value of important species in maintaining network structures and providing ecosystem services.

1. Introduction

Interactions between fruit plants and frugivores are important ecological processes that generate and maintain biodiversity [1,2]. Many fruit plants rely on animals for seed dispersal. This mechanism increases their chance of offspring regeneration by escaping from the seed predators and seedling competition [3] and extends their distribution area. Additionally, frugivores can gain fruit for food as a reward from plants, which is a complex reciprocal ecological process at the community level [4]. Some classical studies on seed dispersal have already achieved a community-wide understanding [5], but with the advent of ecological network analysis, communities have been regarded as interaction networks [6,7], and it has become possible to unravel the structure and characteristics of complex networks and identify keystone species [8].
The process of urbanization is accompanied by the loss and fragmentation of habitat and urban bird richness, the decrease in diversity, and the homogenization and domination of urban bird communities by generalist species [9,10,11,12]. The connectivity between patches decreases, and the filtering effect of the landscape scale leads to a change in the bird community [13]. A recent study detected that urban plant–frugivore bird networks were composed mainly of birds well adapted to urban dwellings, as urbanization leads to the loss of bird richness and habitat specialist species [14]. However, green space, such as patched remaining native vegetation and artificially managed parks in cities, have become refuges for animals [15,16], and more and more urban landscape planning aims to create eco-friendly areas. Thus, a large number of garden plants flow into urban areas under the demand of increasing biodiversity by urban residents [17,18,19], which provides cultural and ecological services [20,21]. For instance, ZHU et al. [22] recorded 1771 plant species in 18 cities among the 5163 growing in the wild in different climatic zones and socioeconomic conditions in China, including multiple fruit plants.
In the face of declines in the richness and diversity of urban birds and the increase in the influx of fruit plants into the urban green space, we wondered what the character urban plant–frugivore networks would exhibit. Macroscopically, plant–frugivore networks are not only affected by different scales of time, space, and climate [23,24,25], but are also very sensitive to the loss of habitats resulting from urban production activities and the consequent decline of native plants and animals [26,27]. From the micro plant–frugivore interaction process, the ecological traits of species are important factors affecting plant–frugivore networks: the fruit (seed) size, color, and crop of plants affect the foraging choice of frugivore birds [28,29,30], while the body size, mouth peak length, and tail length of frugivore birds are used as the characteristics of feeding amount, mode, and flight ability to limit the foraging niche [31,32]. Not only that, there is a matching of phenological and ecological traits between fruit plants and frugivore birds [33,34,35,36].
Here we present a study on the structure of the plant–frugivore network and the relationships between the network roles and functional traits of two trophic species in a large city in central China. For 1 year, we recorded the fruit ripening phenology of 21 species of fruit plants and the foraging interactions between these plants and 39 species of frugivore birds throughout the whole year in a large urban park. Based on the climatic characteristics of the study area, we expected (i) the network is seasonal, and is more complex in autumn and winter because of the sufficient fruit resources. According to the filtering effect of fragmented landscapes [19,27], we expected that (ii) the structure of the observed network is simple by the loss of interactions, and dominated by generalist species. Based on the trait-matching theory [33,35,36], we predict that (iii) there is trait matching between interacting plants and frugivore birds.

2. Materials and Methods

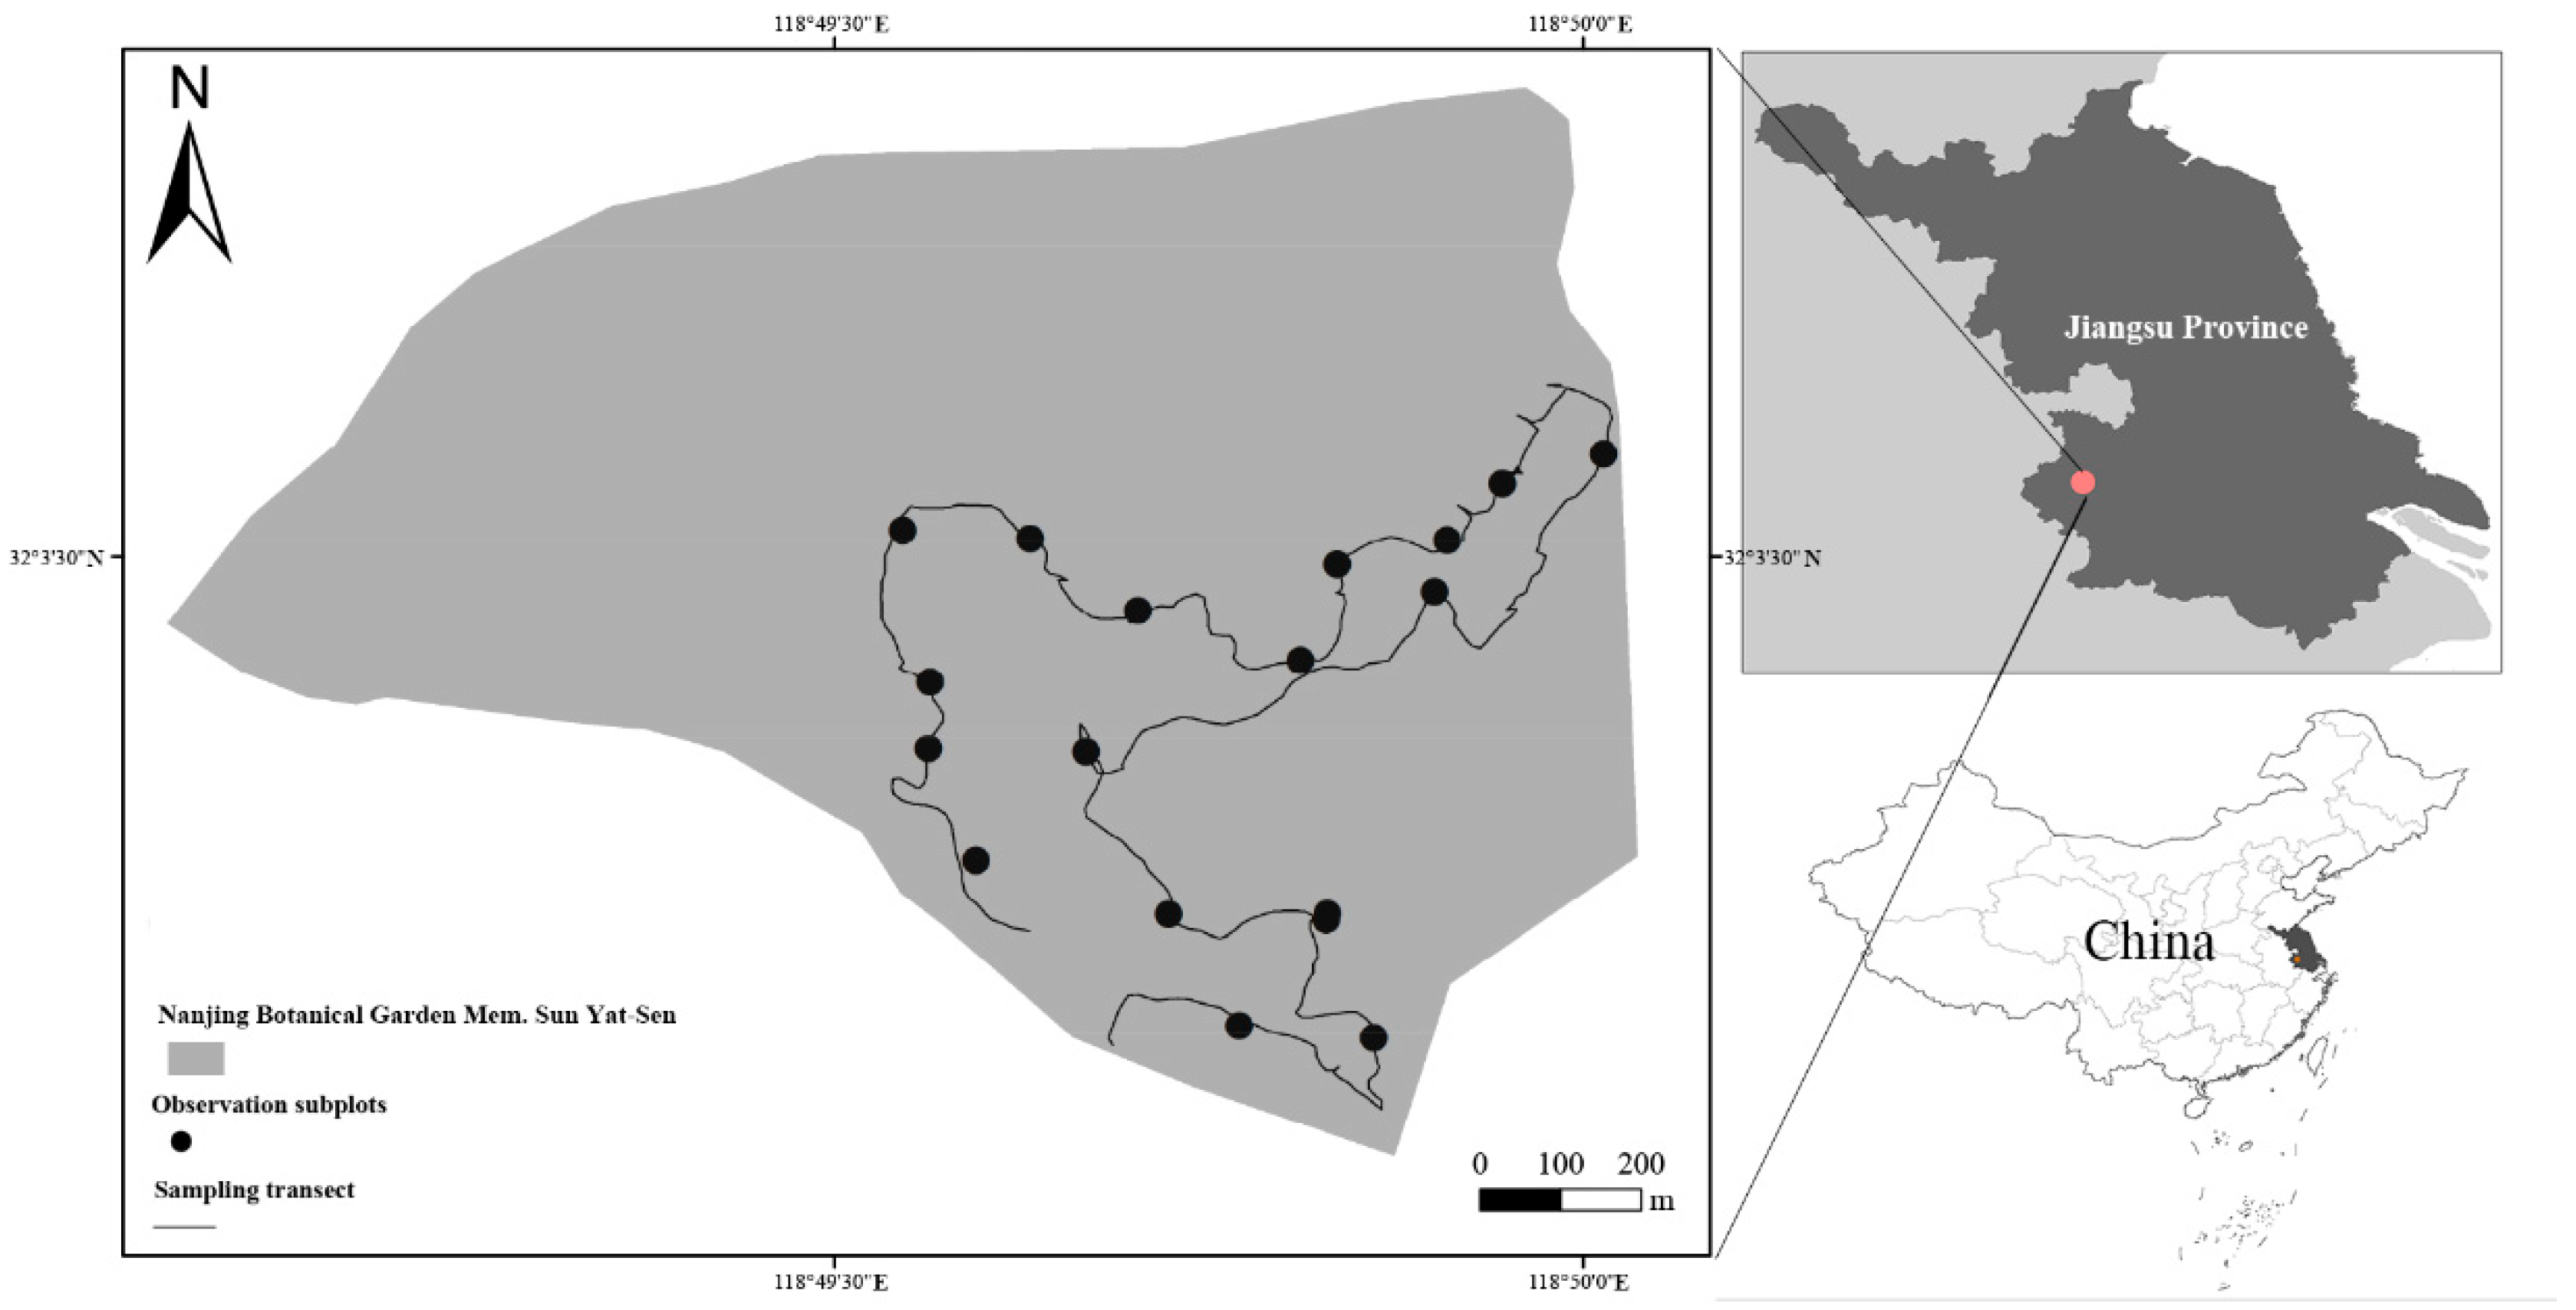
2.1. Study Site and Species

Our study was conducted in the Zhongshan botanical garden Mem. Sun Yat-Sen (122 ha, North Garden), a large park founded in 1956 and located in Nanjing, Jiangsu province, China (31°14′~32°37′ N, 118°22′~119°14′ E; 30~50 m a.s.l., Figure 1). The study area is located to the east of the Purple Mountain and has a northern subtropical monsoon climate with an average annual temperature of 14.7 °C and average annual precipitation of 1000.4 mm [37]. The zonal vegetation is evergreen deciduous broad-leaved mixed forest, among the main constructive species and associated species, evergreen broad-leaved trees include Cyclobalanopsis glauca, Photinia serratifolia, and Ilex chinensis, etc., and deciduous trees include Quercus acutissima, Pistacia chinensis, and Q. variabilis, etc. [38]. The Zhongshan botanical garden is a comprehensive public welfare organization integrating plant science research, plant resource collection, and protection and popular science education. Moreover, the Zhongshan botanical garden is also responsible for research on the introduction and domestication, cultivation, and application of some new plant varieties, especially landscape plants, ornamental plants, and ecological restoration plants (http://www.cnbg.net/, accessed on 28 August 2021).
In the early inquiry data and pre-investigation of several urban parks in Nanjing, we screened plants according to two criteria: (1) plants with fleshy fruit, including trees, shrubs, and herbs; (2) plants exist in many parks and are common fruit plants. We believe that these plants can reflect the state of fruit plants in urban parks to a certain extent. We did not include some fruit plants in the Rosaceae family (e.g., Rubus hirsutus, R. corchorifolius, or R. parvifolius) growing under shrubs in the study; although there are studies on seed dispersal of these plants by birds in that same study area [39], they only exist at the foot of purple mountains and are not common in other urban parks. Although most urban birds are omnivorous, they depend mainly on plants with ripening fruit during the autumn and winter and are considered seasonal frugivore birds in the northern subtropical zone [23,40], so we regarded all birds that forage on fruit observed in the study as frugivore birds.

2.2. Experimental Design

Our study was carried out for one year from July 2018 to June 2019. Based on the pre-experimental observations of the 4 km transect across the study area, we identified the target plant species and established seventeen 10 × 10 m2 observation subplots in the location with target plant distribution and labeled them for subsequent visits (Figure 1). These subplots were distributed in the range of 10–20 m on both sides of the 4 km transect, with an average distance of 134 m between subplots, and each subplot contained 1–4 species of fruit plants.

2.3. Field Methods

2.3.1. Phenological Observation of Fruit Ripening

Fruit ripening phenology was visually evaluated on selected plants during the experimental period [41]. We divided the whole fruit ripening stage into three stages: the early stage of ripening, in which the fruit begins to change color until 25% of the fruit is ripe; the ripening stage, in which 25~75% of the fruit is ripe; and the final stage of ripening, in which the last 25% of the fruit ripens until the fruit falls [42,43]. The observation frequency was determined according to the fruit ripening status of plants in different months: from July to October, few plants ripened, and the observation frequency was concentrated on individual species once a week; from October to January, more plants were ripe, and the observation frequency increased to twice a week; and from February to June, the frequency of observation was also once a week. We recorded three individuals per species to reduce phenological differences due to different microhabitats. All observations and records of fruit ripening were conducted in 17 subplots from 7:00 to 9:00 a.m. on each observation day.

2.3.2. Plant–Frugivore Bird Network

During plant fruit ripening, we surveyed the birds foraging on the subplots via the focal observation method [44]. Specifically, we took the target fruit plants at the observation centers and conducted 30 min observations at fixed locations. Bird foraging sampling was performed by two experienced ornithologists using binoculars (8 × 42 mm) and monocular (60 × 70 mm) in two foraging periods of 9:00–12:00 a.m. and 14:00–17:00. The observation frequency was once a week, we ensured that all plants in the ripening stage had 30 min bird foraging records in one observation period, and the cumulative observation effort of each species of plant was 3 h during the whole experimental period [45]. The two experienced ornithologists did not change during the whole experimental period to control systematic errors, and all the field surveys were carried out on windless days with no rain. During the observations, the specific recording process is when a frugivore bird flies to the crown of a fruit plant and eats at least one fruit until it flies away from the tree, which is counted as an interaction; the second time the bird flies in for fruit is counted as a second interaction, and so on [8]. We used foraging frequency rather than the amount of fruit eaten to express the interactions [46] because birds peck at the large fruit rather than swallow the whole fruit, and the amount of fruit eaten by birds cannot be assessed.

2.4. Ecological Traits

We standardized the plant species list using the website “the plant list” (www.theplantlist.org/; accessed on 28 August 2021) and standardized the bird species list referring to the A Checklist on the Classification and Distribution of the Birds of China (Third Edition) [47]. Then, we collected the ecological traits of all plants and birds observed in the interaction networks. There were ten ecological traits for plants. We identified the plant origins (native and exotic) based on the research of ZHU et al. [22] on the taxonomic diversity of urban plants in China and “iPlant” (http://www.iplant.cn/; accessed on 28 August 2021). Among them, native plants included native-cultivated and/or native-spontaneous plants and exotic plants included exotic-cultivated and/or exotic-spontaneous plants. All plants not distributed in Jiangsu Province were considered exotic species; therefore, exotic plants included those from other provinces of China and other countries. Then, we determined growth form (evergreen and deciduous), fruit type (drupe, berry, and pome), fruit color (red, black, and yellow), and fructescence (long, medium, and short) by referring to the website “iPlant” (http://www.iplant.cn/; accessed on 28 August 2021). In addition, fruit size, length, diameter, and mass were measured by a Vernier analytical balance on 100 ripe fruit per fruit plant collected from three individuals. We calculated the ratio of flesh to fruit per species of fruit plant, and we also converted fruit size, namely, fruit length (l) and fruit diameter (d), into fruit volume using the ellipsoid volume calculation formula: V = 4/3 × (π × l/2 × d/2 × d/2). The transverse section of fruit is nearly round, so the two half axes in the ellipsoid are half the diameter of the fruit.
For birds, there are six ecological traits, including resident type (resident and winter resident), diet (omnivore, insectivore, and frugivore), habitat affinity (forest specialist, forest generalist, open-country bird, and shrubland bird), mass (g), body length (cm), and bill length (cm). These trait data all refer to the A field guide to the birds of China [48] and the A handbook of the birds of China [49]. These traits are important functional traits related to birds foraging [36,50,51,52]. Among them, the habitat affinity of birds was classified by referring to the study of NEUSCHULZ et al. [44]. Birds of forest specialists prefer the interiors of forests and woodlands; birds of forest generalists prefer the forest interior margins and sparsely wooded land areas; shrubland species prefer bushes, shrubs, and dry woodlands; and open-country species prefer grasslands, cultivation, and marshes.

2.5. Data Analysis

All statistical analyses were performed in R v.4.1.1 (R core team and contributors worldwide, 2021). To determine the characteristics of plant–frugivore network in different seasons, we divided the whole year into four seasons: spring includes March, April, and May; summer includes June, July, and August; autumn includes September, October, and November; and winter includes December, January, and February.

2.5.1. Network Structure

We plotted the fruit ripening phenology of plants and birds foraging in different months based on field observations, then summarized the connection for each season, calculated the proportion of the total seasonal connection to the total network, and computed the network parameters using the function “networklevel” in the “bipartite” package version 2.16. We characterized the structure of weighted interaction network using the following five statistics: (1) Connectance (C), which is the realized proportion of possible links [53] and represents the global density of interactions or the connectivity within the network; (2) Nestedness (nestedness), which describes the degree to which the interactions of less connected species are a subset of those of more connected species, we calculated nestedness for binary network [54]; (3) Specialization (H2′), which describes the complementarity of interaction, that is, when species are specialized on different association partners, H2′ of the entire network increases [55]; (4) Interaction diversity ( e H 2 ), a Shannon Index based measure of diversity estimated from interaction frequencies, which reflect whether the links are strong (high interaction frequencies) or weak (low interaction frequencies) [56]; (5) Interaction evenness (E2), which depicts a high (with low interaction evenness) or low (with high interaction evenness) variation in interaction frequencies between different species pairs [56], it represents how similar the weights of the different paired interactions are [8]. The function “treemap” in the package “treemap” version 2.4-3 was used to plot the proportions of the four seasonal connections to the total network, and the function “radarchart” in the package “fmsb” version 0.7.1 was used to plot network characteristics in the different seasons.
We used the function “nullmodel” to randomize plant–frugivore bird interactions. Randomizations were performed by randomly distributing the observed total number of interactions among species of plants and frugivore birds, with the only restriction that each species had at least one interaction, the randomization routine conserved the total number of observed interactions and nodes. We compared the observed network structure with the expected network structure under random conditions, calculated over 1000 iterations. Randomizations can answer which nodes (species) interact with one another and how strong the interactions are under a simple null hypothesis that the interaction frequencies between consumers and resources are a consequence of the relative abundances of the potential resources [57], and they reduce the influence of sampling effects on network interpretation by hold characteristics of the observed data constant (e.g., sample size) [58].

2.5.2. Network Roles of Fruit Plants and Frugivore Birds

We characterized the network roles of plants and birds by calculating the following five statistics using the function “specieslevel” in the “bipartite” package version 2.16 (Carsten et al., 2021), including (1) Degree, a total number of connected species; (2) Species strength, which represents the sum of the dependencies of each species’ relevance across all partners, reflecting abundance rather than anything else [59]; (3) Partner diversity, which is the Shannon diversity of the interactions of each species; (4) Effective partners, “logbase (e or 2)” to the power of Partner diversity, which interpret as the effective number of partners [60]; (5) Specialization (d′), which expresses how specialized a given species is in relation to what partners are on offer, specialization of each species based on its discrimination from random selection of partners [61].
To measure the contribution of species to the plant–frugivore network, we conducted a principal component analysis of the network using the function “rda” in the “calibrate” package version 1.7.7 to obtain the PC1 scores of each species of fruit plant and frugivore bird [62]. The first principal component (PC1) was used to represent a synthetic estimator of each bird–plant interaction contribution to the interaction network and its structural role [63]. In addition, we also calculated the proportion of connections constructed by each species to the total connection of the network (ratio of connections (%)).

2.5.3. Relationships between Ecological Traits and the Network Roles of Species

To explore the relationship between ecological traits and the network roles of plants and birds, we conducted a correlation analysis. Ecological traits of species include two types: qualitative and quantitative. For fruit plants, the qualitative traits included origin, life form, fruit type, and fruit color, while the quantitative traits included fruit mass, fruit length, fruit diameter, and fruit volume. For birds, the qualitative traits of birds include residential type, diet, and habitat affinity, while the quantitative attributes include mass, body length, and bill length. Their network parameters include degree, species strength, partner diversity, effective partners, and specialization. Kolmogorov–Smirnov, and Shapiro–Wilk tests were used to explore the quantitative data normality. Then, the data were logarithm-transformed to detect potential nonlinear relationships. Pearson (data for normal distribution) or Spearman (data for abnormal distribution) correlations were used to identifying significant correlations between qualitative traits of plants and birds.

2.5.4. Important Species of Fruit Plants and Frugivore Birds

Before comparing the inter-group differences in network roles of important species and other species, we conducted a cluster analysis of plants and birds based on their network contribution, that is, species strength, PC1 score, and effective partners, by using function “hclust”. We divided the species into two groups. The first group is an important species with high species strength, PC1 score, and more effective partners, and the second group is others. Then we used the T-test to test the data that conformed to a normal distribution (or after transformation conformed to normal distribution), and the Mann–Whitney-U test to test the data that conformed to abnormal distribution. The analysis between them was performed in the “stats” package version 4.1.2 (R Core Team and contributors worldwide, 2021), the function “cor” was used to test the correlation between network parameters and quantitative traits of species, the function “aov” was used to test the differences among species network parameters under different qualitative attributes, and the function “t.test” and “wilcox.test” was used to test the inter-group difference. The function “boxplot” in the “graphics” package version 4.1.1 (R Core Team and contributors worldwide, 2021) was used to determine the relationships between qualitative traits and network roles of species when there were significant differences between species network roles with different qualitative traits.

3. Results

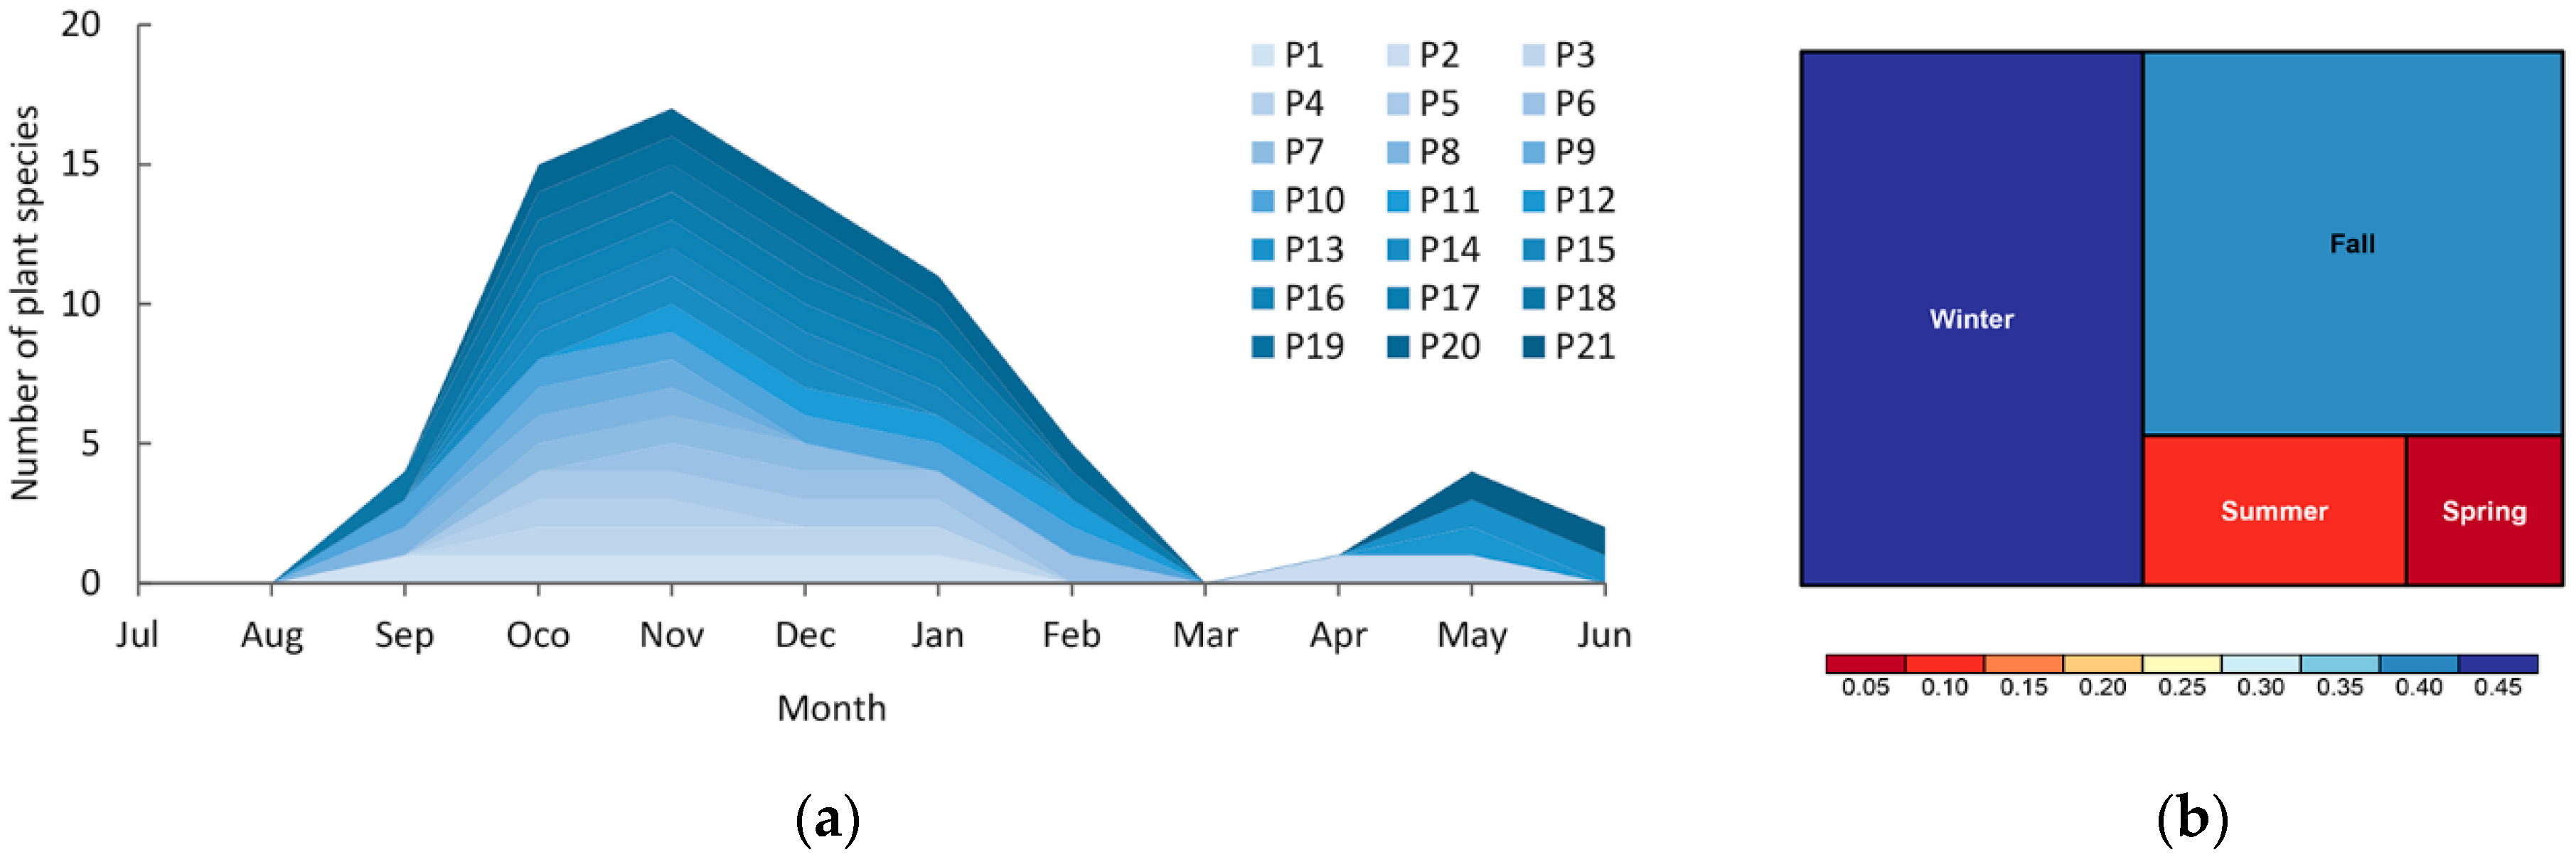
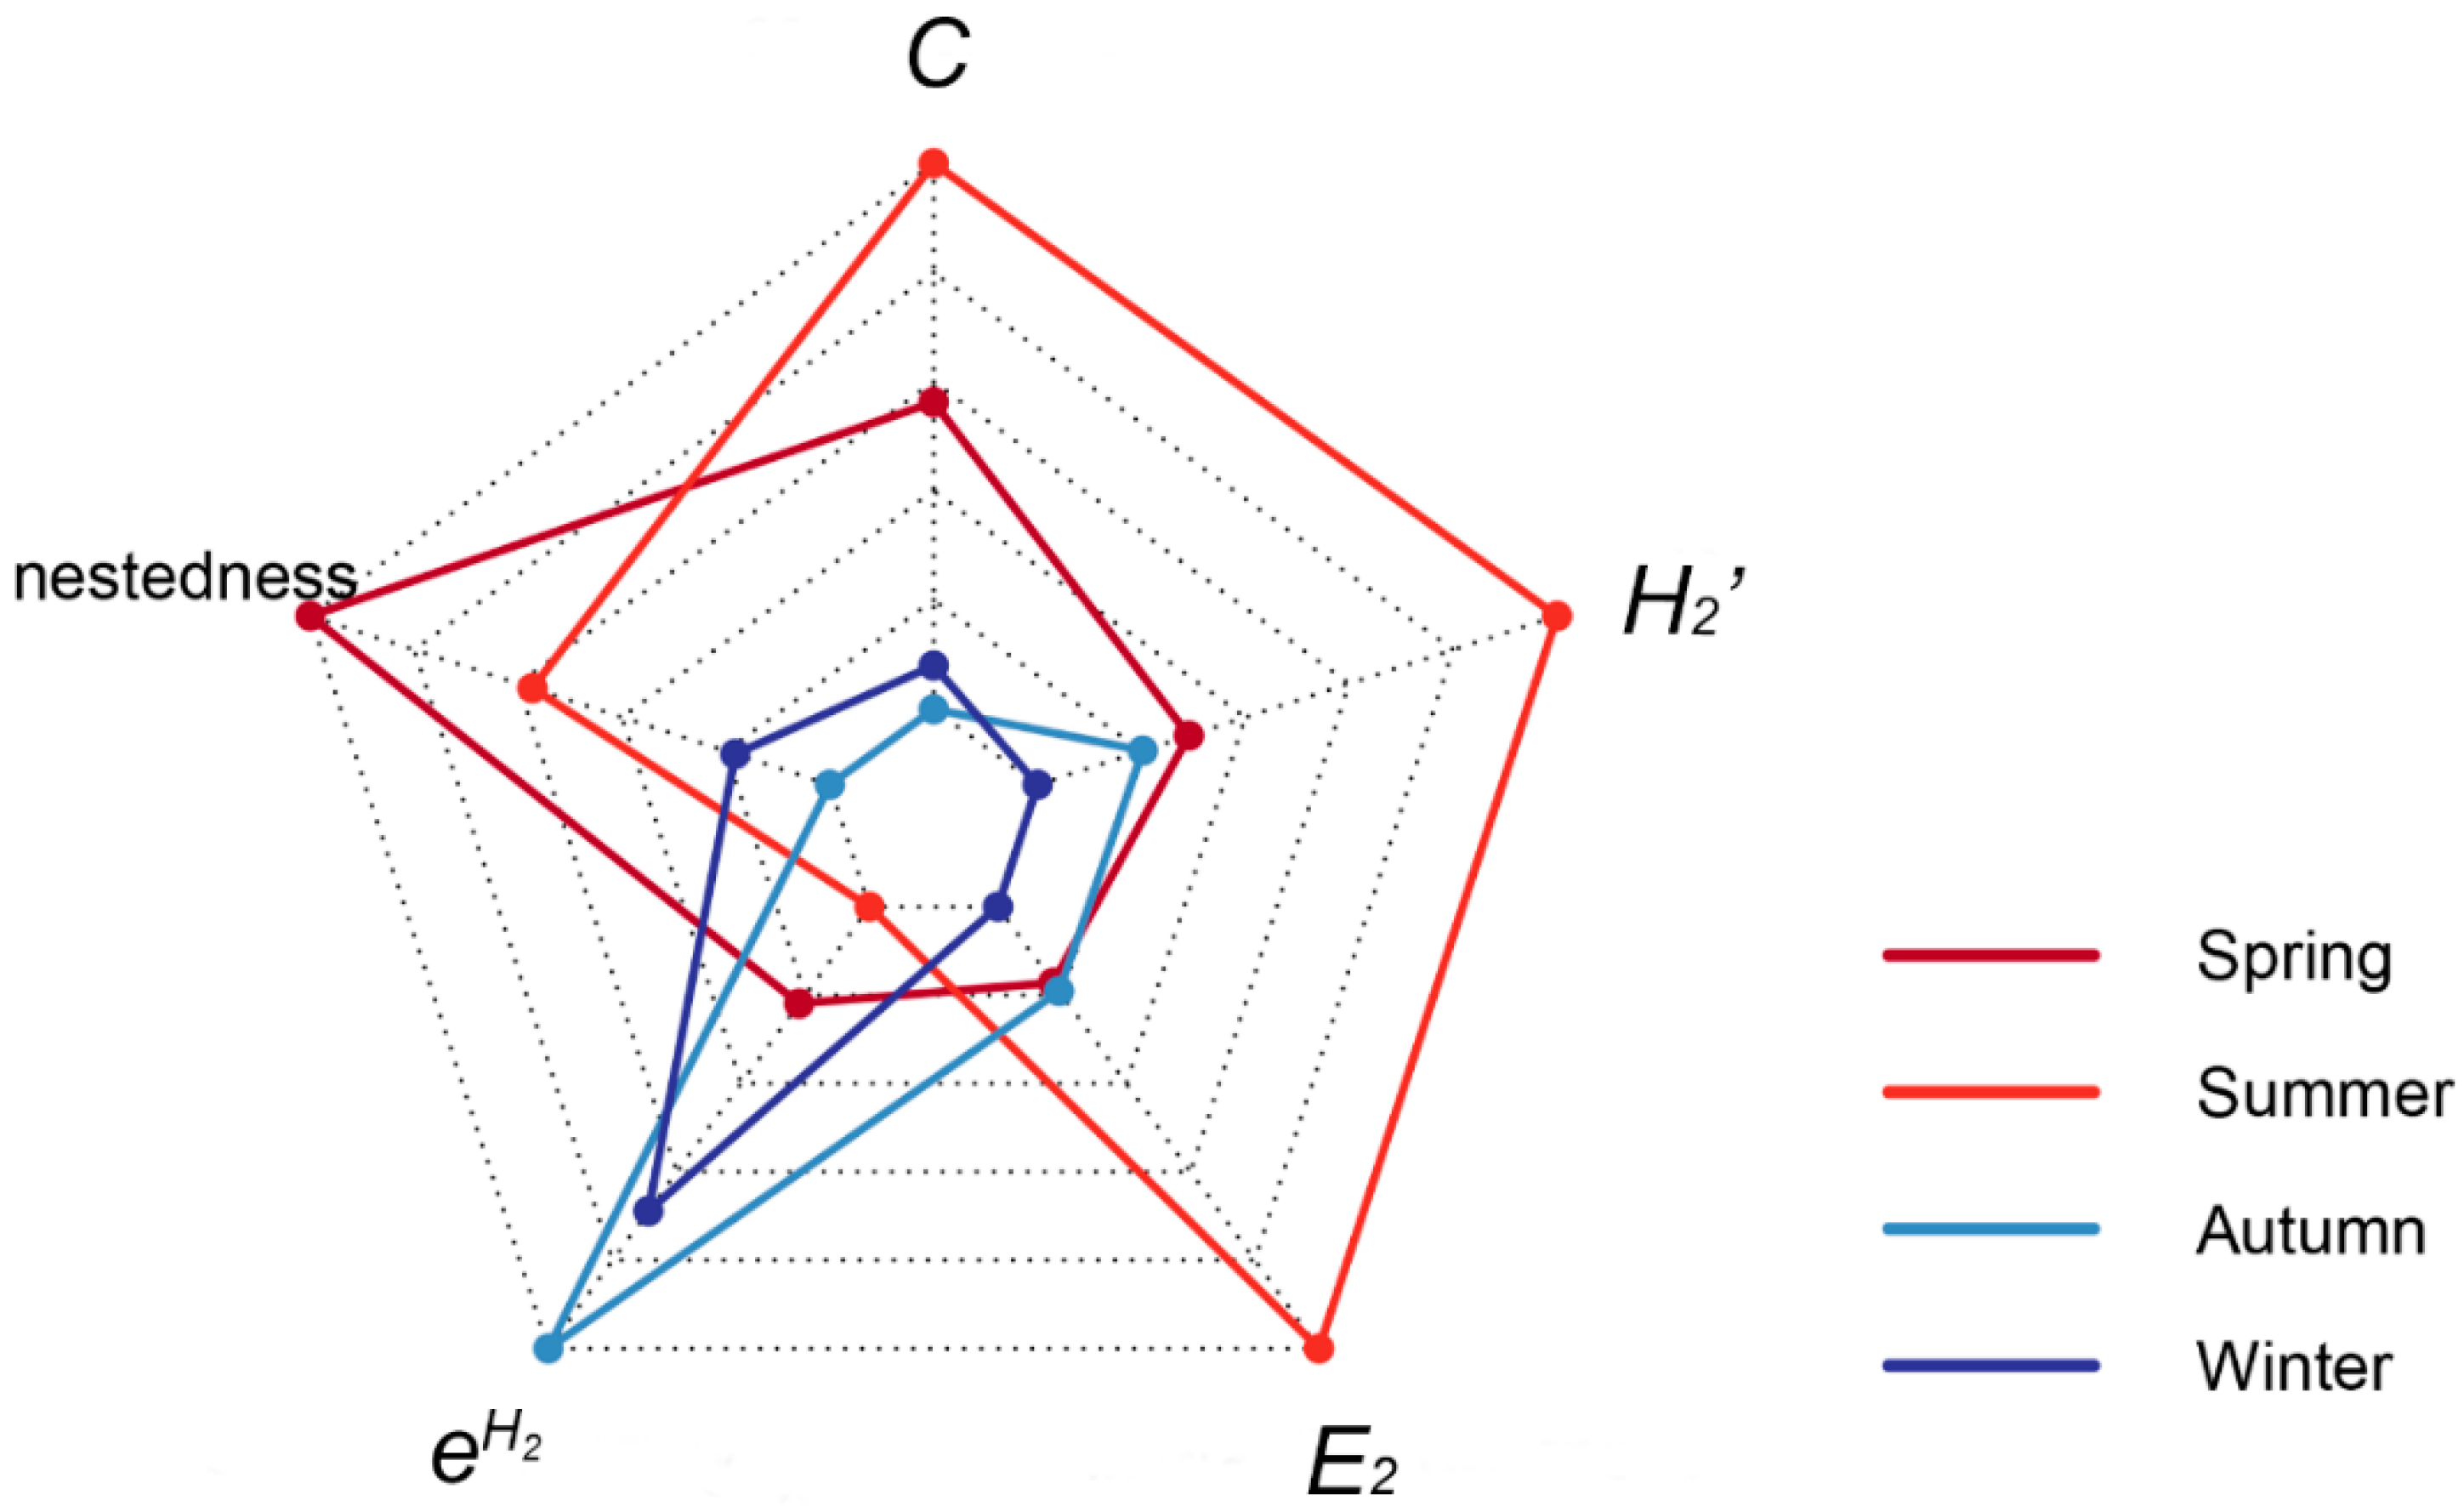
3.1. Fruit Ripening Phenology and Seasonal Plant–Frugivore Network

Fruit ripening starts from the end of summer in August and ends in March of the following year, while the fruits of some plants ripen starting at the end of spring in April and ending in the early summer in June (Figure 2a). For the fruits that ripen mainly in autumn and winter, the species reached their peak in November (17 species); for the fruits that ripen in the spring and summer, the species reached their peak in May (4 species).
The contributions of interaction connections in different seasons to the total connection of the network were different (Figure 2b). Interaction connections contributed 5.77% and 9.72% of that to the annual network in spring and summer, and 39.68% and 44.83% of that to the annual network in autumn and winter, respectively.
The results of network analysis showed that the characteristics of the plant–frugivore network were different in the four seasons (Figure 3 and Figure S1). The nestedness, specialization (H2′), and connectance (C) of the network in the spring and summer were higher than those in autumn and winter because fewer fruit plants ripened in spring and summer and birds were more dependent on a few plants with ripe fruit. With the increase in the number of plant species with ripe fruit in autumn and winter, the nestedness, specialization (H2′), and connectance (C) decreased, while the interaction diversity ( e H 2 ) increased, which was mainly due to the few species of mature fruit plants in spring and summer, and the few connections contributed by mature fruit plants and frugivore birds in autumn and winter. The number of species of frugivore birds and fruit plants was positively correlated with the contributions of the interaction connections between birds and fruit plants in different seasons (Rb2 = 0.90, p = 0.086; Rp2 = 0.84, p = 0.049) (Figure S2).

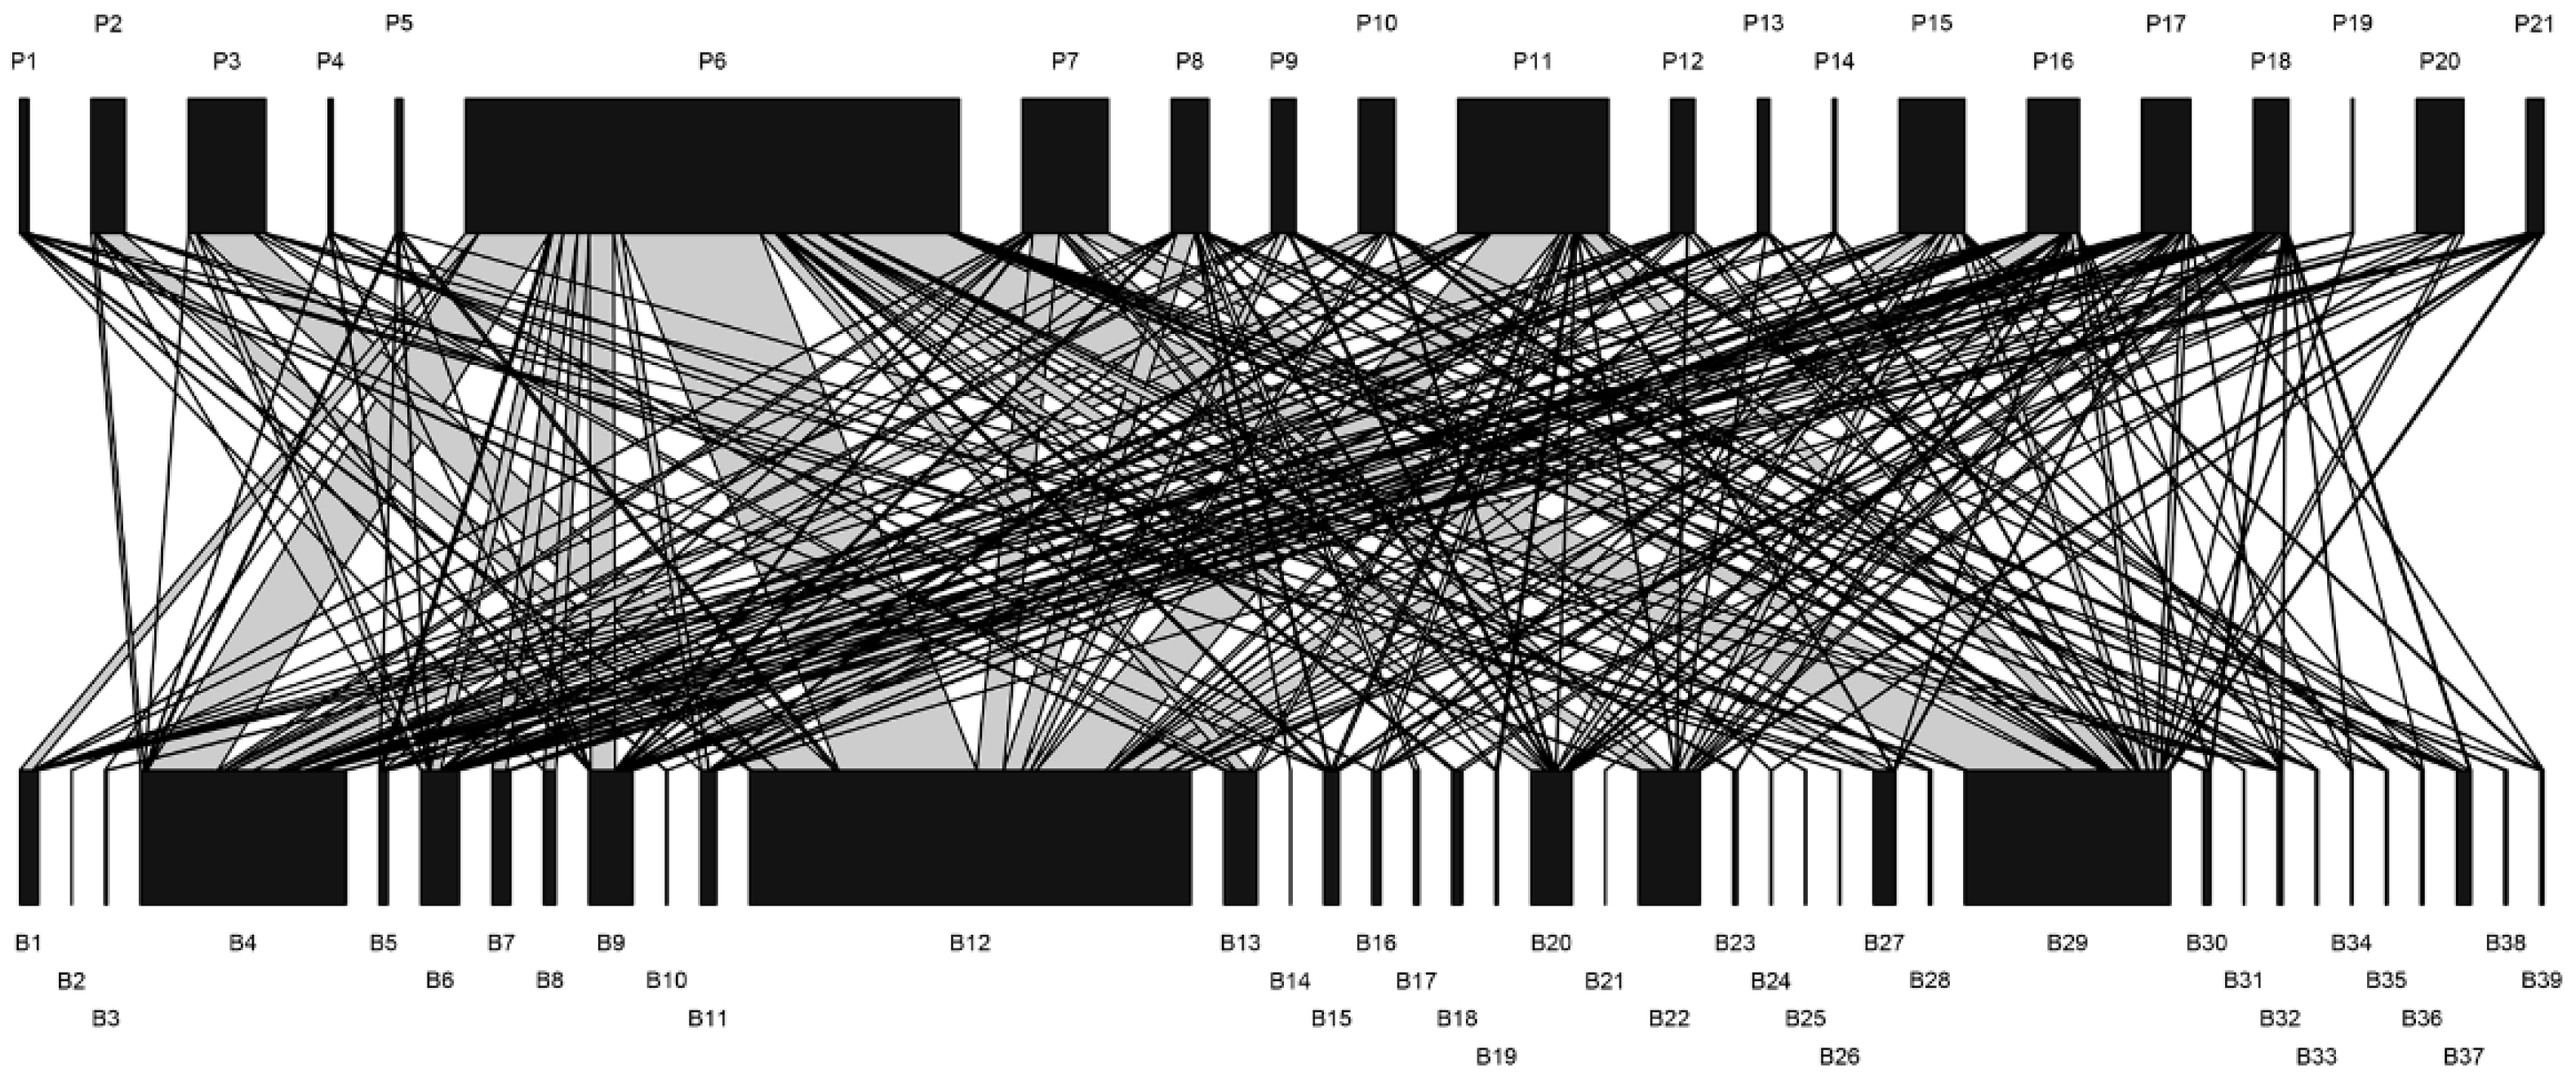
3.2. Year-Round Plant–Frugivore Network

Through observations throughout the year, we recorded the interactions between the 21 species of fruit plants and 39 species of frugivore birds and ultimately established 220 unique interactions for a total of 6027 interaction connections (Figure 4). Compared to the predicted networks generated by the randomizations (N = 1000), the observed plant–frugivore network exhibited relatively lower connectance (C = 0.27), higher nestedness (nestedness = 19.86), lower specialization (H2′ = 0.18), higher interaction diversity ( e H 2 = 4.17), and lower interaction evenness (E2 = 0.62) (Figure S3). These results indicated that the observed network has fewer realized connections and a more stable subset of interactions than the predicted network, species exhibiting lower feeding dependence, and higher interaction frequencies.

3.3. Relationship between Species’ Network Roles and Their Ecological Traits

The analysis results between the network parameters and ecological traits of plants showed that fruit color had significant effects on partner diversity and the number of effective partners (Figure 5). Specifically, the partner diversity and the number of effective partners of plants with black fruit were significantly greater than those with red fruit, and the difference between plants with yellow fruit and other plants was not significant. The correlation between network parameters and other quantitative ecological traits (seed mass, ratio of flesh to fruit, seed length, seed diameter, and seed volume) of plants was not significant (Figure S4), and there was no significant difference between the network parameters of plants in different classification traits (origin, life form, fruit type, fruit color, and fructescence) (Table S2). The relationships between the network roles and ecological traits were not significant (Figure S5), and there was no significant difference between network parameters of birds with different qualitative ecological traits (resident, diet, and habitat affinity) (Table S3).
Thus, only fruit color can explain partner diversity and effective partners of fruit plants, that is, plants with black fruit had more partner diversity and effective partners. We found that the contribution of some species was far greater than that of other species in the network, and classifying species using ecological traits averaged the contribution of different species.

3.4. Important Fruit Plants and Frugivore Birds in the Plant–Frugivore Network

We selected six important species of fruit plants and three important species of frugivore birds using cluster analysis based on species strength, PC1 score, and number of effective partners (Table 1; Figure S6). The six important fruit plants were Cinnamomum camphora (P6), Photinia davidsoniae (P11), Taxus chinensis (P3), Phoebe chekiangensis (P7), Melia azedarach (P20), and Fatsia japonica (P16) (Table 1), contributed 39.12%, 11.91%, 6.12%, 6.80%, 3.75%, and 4.07% of the connections to the interactive network respectively (Table 2), and these important species collectively contributed 71.78% of the connections. All except P20 are evergreen plants with black or red fruit (seed). The three important species of frugivore birds were Pycnonotus sinensis (B12), Cyanopica cyanus (B4), and Turdus mandarinus (B29), which were the most important frugivore birds in the network, they contributed 34.98%, 16.29%, and 16.28% of the connections to the interactive network, respectively (Table 2), and these important species collectively contributed 67.55% of the connections. Three birds are omnivorous generalist birds with medium and large sizes.
For plants, the PC1 score and number of effective partners of the six important species (Group 1) were much larger than those of the other species (Group 2), while the species strength and their partner diversity were larger than that of the remaining species. In addition, the specialization (d′) of the six important species was smaller than that of other species, but the difference is not significant (Table 2). The results indicated that the top six plant species that contribute more to the network provide food for more frugivore birds.
For frugivore birds, the PC1 score, species strength, partner diversity, and effective partner of the top three frugivore birds are significantly larger than those of other birds, while specialization (d′) of the top three frugivore birds was significantly lower than that of the remaining birds, which indicates that the three important birds, making more contributions to the network, obtain their food from a variety of fruit plants and have low dietary specificity.

4. Discussion

The characteristics of network in the study area vary in the course of the season, and the specialization (H2′), the connectance (C), the nestedness, and the interaction evenness ( e H 2 ) of the network were lower in autumn and winter, while the interaction diversity was higher, and the total network exhibited high nestedness and interaction diversity and lower specialization (H2′), connectance (C), and interaction evenness ( e H 2 ). Compared with the networks (N = 1000) generated by the null model, the observed network exhibited higher nestedness and interaction diversity (E2), and lower specialization (H2′), connectance (C), and interaction evenness ( e H 2 ). A Correlation analysis combining ecological traits and network roles showed that plants with black fruit had higher effective partners and partner diversity, while other traits of plants and birds were not significantly correlated with their network parameters. The important plants (N = 6) and frugivore birds (N = 3) contributed 71.78% and 67.55% of the total network connection. They were evergreen plants with black or red drupes and omnivorous generalist birds with medium and large sizes.
We found that most fruit plants ripen in autumn and winter, while only a few plant species ripen in spring and summer, and the plant–frugivore interactions occur more in autumn and winter than in spring and summer, corresponding to the fruit ripening time. The fluctuation in fruit resources leads to some species only transiently participating in interactions in spring and summer, while other species are active for longer periods in autumn and winter, consistent with the transience and constancy in a plant–frugivore network described by YANG et al. [64]. Seasonal changes in fruit availability and bird composition contributed to the highly seasonal interactions between fruit plants and frugivore birds [65], as in our study, the species number of ripe species and participating frugivore birds were positively correlated with the interaction connections in different seasons (Figure S1). The seasonality of the network is reflected in the increases in ripe species and frugivore birds from spring and summer to autumn and winter, as food resources are sufficient, and the connectance (C), nestedness, specialization (H2′), and interaction evenness (E2) of networks decrease, while the interaction diversity ( e H 2 ) increase (Figure 3), which is consistent with our prediction (i).
The observed network has lower connectance (C) and interaction evenness (E2) and higher nestedness, specialization (H2′), and interaction diversity ( e H 2 ) than random networks. The results indicate that the structure of the observed network was simpler than the structure expected by null models, and the contribution of key species to the network was more important than expected, which may be because the fragmentation of forest landscape has a filtering effect on frugivore birds, resulting in the loss of some reciprocal interactions [14,66], which is consistent with our prediction (ii). In our study, there was no significant correlation between ecological traits and network roles of species, which is inconsistent with most studies [51,52,67] and our prediction (iii), except plants with black fruit have more partner diversity and effective partners; that is, they can attract more frugivore birds, which is consistent with some studies [30,51]. On the one hand, it may be because individual species play important roles and their contribution to the network is much higher than the average value of species with the same traits, so the differences cannot be shown in the analysis; on the other hand, the results may also be affected by the sample, as insufficient sampling will cause some misreading [46,56]. After cluster analysis based on the network contribution of species, we found that five of the top six fruit plants were evergreen native plants with black and red drupes (Table 2), which is consistent with the results of some studies emphasizing that birds prefer black and red fruit [68]. In addition, evergreen fruit plants can provide temporary shelter when birds are disturbed in feeding in highly disturbed urban habitats and native evergreen fruit trees are widely planted in urban habitats because of their fine landscape effect [69,70,71], and the long-term interaction adaptation between these plants and frugivore birds has resulted in bird foraging preferences for these species [26]; as per the author’s observation, the evergreen fruit plants such as Cinnamomum camphora and Ilex cornuta in this study are widely planted for the greening of urban parks and roads in Nanjing city where the study was located. However, it is worth noting that some studies have shown the homogeneity of plant composition in urban landscapes is caused by landscape design, cost savings, or imitation [69,72]. The relevant practitioners (urban planning, garden management, etc.) should pay attention to this problem to avoid the simplification of the urban plant–frugivore network and the reduction in the ecosystem service functions provided by plants.
We also found that the top three frugivore birds were medium- and large-size omnivorous generalist birds (Table 2), consistent with some studies in disturbed habitats [11,14,73] and some studies on bird composition in urban ecosystems [74,75], they occupy a dominant position in both urban plant–frugivore networks and urban bird communities. They have a wider feeding niche and eat more plant fruits [11]. Moreover, their high adaptability to urban high disturbance habitats makes them dominant in the overall number [76], which may increase the cumulative connection of plant–frugivore bird networks.
Our study is only a first step to understanding the characteristics of the plant–frugivore network with the change in the bird and vegetation community in the context of urbanization. Most studies have described the interaction patterns of ecological networks in natural habitats with different disturbance gradients and the practical functional consequences of these interactions on seed dispersal [77,78,79], but rarely involve the interaction patterns and consequences in urban green space habitats. This occurs because the planting and maintenance of most plants in urban green space, especially urban parks, are artificial, and the interference is difficult to define, and the process is sometimes accompanied by irreversible landscape changes. Urban habitat seems to weaken the role of seed dispersers of birds in the reciprocal network and strengthen the role of plants in promoting bird diversity and maintaining ecosystem function, so it becomes important to determine the ecological role and functional role of plants. Therefore, in future research, a large number of field observations and quantitative and qualitative analyses are necessary, which will help us understand the interaction mechanism of animals and plants in highly disturbed habitats, as well as biodiversity protection and management.

5. Conclusions

Within the limitations of our study, we provide evidence that the plant–frugivore network in urban parks has seasonal characteristics and becomes complex with the fruit ripening of a large number of plants in autumn and winter. In general, the plant–frugivore network was dominated by a limited number of evergreen plants with black or red fruit and omnivorous generalist birds with medium and large sizes. The contribution of these important species to the plant-frugivore network far exceeds the sum of other species at the same trophic level, which is unfavorable to maintaining the diversity of the whole network. We suggest that landscape managers avoid homogeneous greening plant selection and choose diversified fruit plants to create more food resources for other birds. At the same time, we call for more research into plant–frugivore networks on the urbanization gradient and in different types of green space in the city, to better understand the crisis and challenge of maintaining urban biodiversity caused by human-induced changes from a community perspective.

Supplementary Materials

The following supporting information can be downloaded at: https://www.mdpi.com/article/10.3390/d14020071/s1, Figure S1: Parameters in different seasons; Figure S2: Regression of the number of species and connections; Figure S3: Comparison of two types of networks; Figure S4: Correlation matrix of plants; Figure S5 Correlation matrix of birds; Figure S6: Cluster analysis of plants and birds; Table S1: Code of species; Table S2: Comparison of network roles of plants with different traits of plants; Table S3: Comparison of network roles of plants with different traits of birds.

Author Contributions

M.Z. and C.L. (Caihong Lu) conceived the ideas, C.L. (Caihong Lu) and Q.H. collected the data, M.Z. conducted data analysis and writing, and C.L. (Changhu Lu) secured funding and provided suggestions for the revision of the study. All the authors contributed critically to the drafts. All authors have read and agreed to the published version of the manuscript.

Funding

This research was funded by the Priority Academic Program Development of Jiangsu Higher Education Institutions.

Institutional Review Board Statement

Not applicable.

Data Availability Statement

The data are not yet publicly available. Individual requests can be addressed to the corresponding author.

Acknowledgments

We are grateful to anonymous reviewers and editors for their constructive comments on previous versions of the manuscript, which greatly improved the quality of the article.

Conflicts of Interest

The authors declare no conflict of interest.

References

  1. Palacio, F.X. Seed dispersal effectiveness by frugivorous birds: Identifying functional equivalent species in bird assemblages. Avian Biol. Res. 2019, 12, 103–108. [Google Scholar] [CrossRef]
  2. Valdovinos, F.S. Mutualistic networks: Moving closer to a predictive theory. Ecol. Lett. 2019, 22, 1517–1534. [Google Scholar] [CrossRef] [PubMed] [Green Version]
  3. Levine, J.M.; Murrell, D.J. The community-level consequences of seed dispersal patterns. Annu. Rev. Ecol. Evol. Syst. 2003, 34, 549–574. [Google Scholar] [CrossRef] [Green Version]
  4. Bleher, B.; Bohning-Gaese, K. Consequences of frugivore diversity for seed dispersal, seedling establishment and the spatial pattern of seedlings and trees. Oecologia 2001, 129, 385–394. [Google Scholar] [CrossRef]
  5. Heleno, R.; Garcia, C.; Jordano, P.; Traveset, A.; Gómez, J.M.; Blüthgen, N.; Memmott, J.; Moora, M.; Cerdeira, J.; Rodríguez-Echeverría, S.; et al. Ecological networks: Delving into the architecture of biodiversity. Biol. Lett. 2014, 10, 20131000. [Google Scholar] [CrossRef] [Green Version]
  6. Bascompte, J.; Jordano, P. Plant-animal mutualistic networks: The architecture of biodiversity. Annu. Rev. Ecol. Evol. Syst. 2007, 38, 567–593. [Google Scholar] [CrossRef] [Green Version]
  7. Garcia, D. Birds in ecological networks: Insights from bird-plant mutualistic interactions. Ardeola 2016, 63, 151–180. [Google Scholar] [CrossRef] [Green Version]
  8. Fernández-Juricic, E. Bird community composition patterns in urban parks of Madrid: The role of age, size and isolation. Ecol. Res. 2000, 15, 373–383. [Google Scholar] [CrossRef]
  9. Mckinney, M.L. Urbanization, biodiversity, and conservation. BioScience 2002, 52, 883–890. [Google Scholar] [CrossRef]
  10. Kühn, I.; Klotz, S. Urbanization and homogenization—Comparing the floras of urban and rural areas in Germany. Biol. Conserv. 2006, 127, 292–300. [Google Scholar] [CrossRef]
  11. Rigacci, E.D.B.; Paes, N.D.; Felix, G.M.; Silva, W.R. The resilient frugivorous fauna of an urban forest fragment and its potential role in vegetation enrichment. Urban Ecosyst. 2021, 24, 943–958. [Google Scholar] [CrossRef] [PubMed]
  12. Bonier, F.; Martin, P.R.; Wingfield, J.C. Urban birds have broader environmental tolerance. Biol. Lett. 2007, 3, 670–673. [Google Scholar] [CrossRef] [PubMed]
  13. Lai, S.-M.; Liu, W.-C.; Chen, H.-W. Exploring trophic role similarity and phylogenetic relatedness between species in food webs. Community Ecol. 2021, 22, 1–14. [Google Scholar] [CrossRef]
  14. Schneiberg, I.; Boscolo, D.; Devoto, M.; Marcilio-Silva, V.; Dalmaso, C.A.; Ribeiro, J.W.; Ribeiro, M.C.; de Camargo Guaraldo, A.; Niebuhr, B.B.; Varassin, I.G. Urbanization homogenizes the interactions of plant-frugivore bird networks. Urban Ecosyst. 2020, 23, 457–470. [Google Scholar] [CrossRef]
  15. Blum, J. Urban Forests Ecosystem Services and Management; Apple Academic Press: New Jersey, NJ, USA, 2017. [Google Scholar]
  16. Mccleery, R.A.; Moorman, C.E.; Peterson, M.N. Urban Wildllife Conservation: Theory and Practice; Springer: New York, NY, USA, 2014. [Google Scholar]
  17. Beninde, J.; Veith, M.; Hochkirch, A. Biodiversity in cities needs space: A meta-analysis of factors determining intra-urban biodiversity variation. Ecol. Lett. 2015, 18, 581–592. [Google Scholar] [CrossRef]
  18. Farinha-Marques, P.; Lameiras, J.M.; Fernandes, C.; Silva, S.; Guilherme, F. Urban biodiversity: A review of current concepts and contributions to multidisciplinary approaches. Innov. Eur. J. Soc. Sci. Res. 2011, 24, 247–271. [Google Scholar] [CrossRef]
  19. Garrard, G.E.; Williams, N.S.G.; Mata, L.; Thomas, J.; Bekessy, S.A. Biodiversity Sensitive Urban Design. Conserv. Lett. 2018, 11, e12411. [Google Scholar] [CrossRef]
  20. Fuller, R.A.; Irvine, K.N.; Davies, Z.G.; Armsworth, P.R.; Gaston, K.J. Interactions between People and Birds in Urban Landscapes. In Urban Bird Ecology and Conservation; University of California Press: Berkeley, CA, USA, 2012; pp. 249–266. [Google Scholar]
  21. Niemelä, J. Ecology of urban green spaces: The way forward in answering major research questions. Landsc. Urban Plan. 2014, 125, 298–303. [Google Scholar] [CrossRef]
  22. Zhu, Z.-X.; Roeder, M.; Xie, J.; Nizamani, M.M.; Friedman, C.R.; Wang, H.-F. Plant taxonomic richness and phylogenetic diversity across different cities in China. Urban For. Urban Green. 2019, 39, 55–66. [Google Scholar] [CrossRef]
  23. Dalsgaard, B.; Schleuning, M.; Maruyama, P.K.; Dehling, D.M.; Sonne, J.; Vizentin-Bugoni, J.; Zanata, T.B.; Fjeldså, J.; Böhning-Gaese, K.; Rahbek, C. Opposed latitudinal patterns of network-derived and dietary specialization in avian plant-frugivore interaction systems. Ecography 2017, 40, 1395–1401. [Google Scholar] [CrossRef] [Green Version]
  24. Donoso, I.; Stefanescu, C.; Martínez-Abraín, A.; Traveset, A. Phenological asynchrony in plant-butterfly interactions associated with climate: A community-wide perspective. Oikos 2016, 125, 1434–1444. [Google Scholar] [CrossRef] [Green Version]
  25. Quitián, M.; Santillán, V.; Espinosa, C.I.; Homeier, J.; Böhning-Gaese, K.; Schleuning, M.; Neuschulz, E.L. Elevation-dependent effects of forest fragmentation on plant-bird interaction networks in the tropical Andes. Ecography 2018, 41, 1497–1506. [Google Scholar] [CrossRef] [Green Version]
  26. Gallinat, A.S.; Primack, R.B.; Lloyd-Evans, T.L. Can invasive species replace native species as a resource for birds under climate change? A case study on bird-fruit interactions. Biol. Conserv. 2020, 241, 108268. [Google Scholar] [CrossRef]
  27. Hagen, M.; Kissling, W.D.; Rasmussen, C.; De Aguiar, M.A.; Brown, L.E.; Carstensen, D.W.; Alves-Dos-Santos, I.; Dupont, Y.L.; Edwards, F.K.; Genini, J.; et al. Biodiversity, Species Interactions and Ecological Networks in a Fragmented World. Adv. Ecol. Res. 2012, 46, 89–210. [Google Scholar] [CrossRef] [Green Version]
  28. Lai, X.; Guo, C.; Xiao, Z.S. Trait-mediated seed predation, dispersal and survival among frugivore-dispersed plants in a fragmented subtropical forest, Southwest China. Integr. Zoöl. 2014, 9, 246–254. [Google Scholar] [CrossRef] [PubMed]
  29. Ramos-Robles, M.; Dáttilo, W.; Díaz-Castelazo, C.; Andresen, E. Fruit traits and temporal abundance shape plant-frugivore interaction networks in a seasonal tropical forest. Sci. Nat. 2018, 105, 29. [Google Scholar] [CrossRef] [PubMed]
  30. Muñoz, M.C.; Schaefer, H.M.; Böhning-Gaese, K.; Schleuning, M. Importance of animal and plant traits for fruit removal and seedling recruitment in a tropical forest. Oikos 2016, 126, 823–832. [Google Scholar] [CrossRef]
  31. Jin, C.; Jiang, B.; Ding, Y.; Yang, S.; Xu, Y.; Jiao, J.; Huang, J.; Yuan, W.; Wu, C. Functional traits change but species diversity is not influenced by edge effects in an urban forest of Eastern China. Urban For. Urban Green. 2021, 64, 127245. [Google Scholar] [CrossRef]
  32. Endrédi, A.; Patonai, K.; Podani, J.; Libralato, S.; Jordán, F. Who is where in marine food webs? A trait-based analysis of network positions. Front. Mar. Sci. 2021, 8, 8. [Google Scholar] [CrossRef]
  33. Schleuning, M.; Neuschulz, E.L.; Albrecht, J.; Bender, I.M.; Bowler, D.E.; Dehling, D.M.; Fritz, S.; Hof, C.; Mueller, T.; Nowak, L.; et al. Trait-Based Assessments of Climate-Change Impacts on Interacting Species. Trends Ecol. Evol. 2020, 35, 319–328. [Google Scholar] [CrossRef] [PubMed]
  34. González, A.M.M.; Ornelas, J.F.; Dalsgaard, B.; Luna, U.M.; Lara, C. Meta-networks for the study of biogeographical traits in ecological networks: The Mexican hummingbird-plant assemblage. Sci. Nat. 2018, 105, 54. [Google Scholar] [CrossRef] [PubMed] [Green Version]
  35. Jiang, F.; Xun, Y.; Cai, H.; Jin, G. Functional traits can improve our understanding of niche- and dispersal-based processes. Oecologia 2018, 186, 783–792. [Google Scholar] [CrossRef] [PubMed]
  36. Bender, I.M.A.; Kissling, W.D.; Blendinger, P.G.; Böhning-Gaese, K.; Hensen, I.; Kühn, I.; Muñoz, M.C.; Neuschulz, E.L.; Nowak, L.; Quitián, M.; et al. Morphological trait matching shapes plant-frugivore networks across the Andes. Ecography 2018, 41, 1910–1919. [Google Scholar] [CrossRef] [Green Version]
  37. Dong, L.; Xu, H.; Ju, F.; Liu, S.; Wan, Z. Plant diversity and its conservation strategies in Zijin Mountain National Forest Park in Nanjing. J. Jiangsu For. Sci. Technol. 2011, 38, 30–35. [Google Scholar]
  38. Dong, L.N.; Xu, H.B.; Liu, S.W.; Song, H.L.; Chen, X.; Ju, F. Investigation and analysis on seed plant flora at zijinshan national forest park in nanjing. J. Zhejiang For. Sci. Technol. 2010, 30, 41–47. [Google Scholar]
  39. Li, X.; Yin, X. Seed dispersal by birds in Nanjing Botanical Garden Mem. Sun Yat.-Sen in spering and summer. Acta Ecol. Sin. 2004, 7, 1452–1458. [Google Scholar]
  40. Zou, F.; Jones, H.; Colorado Z., G.J.; Jiang, D.; Lee, T.-M.; Martínez, A.; Sieving, K.; Zhang, M.; Zhang, Q.; Goodale, E. The conservation implications of mixed-species flocking in terrestrial birds, a globally-distributed species interaction network. Biol. Conserv. 2018, 224, 267–276. [Google Scholar] [CrossRef]
  41. Cortés-Flores, J.; Cornejo-Tenorio, G.; Urrea-Galeano, L.A.; Andresen, E.; González-Rodríguez, A.; Ibarra-Manríquez, G. Phylogeny, fruit traits, and ecological correlates of fruiting phenology in a Neotropical dry forest. Oecologia 2019, 189, 159–169. [Google Scholar] [CrossRef]
  42. Kolarova, E.; Nekovar, J.; Adamik, P. Long-term temporal changes in central European tree phenology (1946–2010) confirm the recent extension of growing seasons. Int. J. Biometeorol. 2014, 58, 1739–1748. [Google Scholar] [CrossRef]
  43. Lediuk, K.D.; Damascos, M.A.; Puntieri, J.G.; Svriz, M. Differences in phenology and fruit characteristic between invasive and native woody species favor exotic species invasiveness. Plant Ecol. 2014, 215, 1455–1467. [Google Scholar] [CrossRef]
  44. Neuschulz, E.L.; Botzat, A.; Farwig, N. Effects of forest modification on bird community composition and seed removal in a heterogeneous landscape in South Africa. Oikos 2011, 120, 1371–1379. [Google Scholar] [CrossRef]
  45. Albrecht, J.; Neuschulz, E.L.; Farwig, N. Impact of habitat structure and fruit abundance on avian seed dispersal and fruit predation. Basic Appl. Ecol. 2012, 13, 347–354. [Google Scholar] [CrossRef]
  46. Jordano, P. Sampling networks of ecological interactions. Funct. Ecol. 2016, 30, 1883–1893. [Google Scholar] [CrossRef]
  47. Zheng, G.M. A Checklist on the Classification and Distribution of the Birds of China, 3rd ed.; Science Press: Beijing, China, 2017. [Google Scholar]
  48. Mackinnon, J.; Phillipps, K. A Field Guide to the Birds of China; Hunan Education Press: Changsha, China, 2000. [Google Scholar]
  49. Zhao, Z.J. A Handbook of the Birds of China; Science and Technology Press: Jilin, China, 2001. [Google Scholar]
  50. Albrecht, J.; Calen, A.; Vollstädt, M.G.R.; Mayr, A.; Mollel, N.P.; Costa, D.S.; Dulle, H.I.; Fischer, M.; Hemp, A.; Howell, K.M.; et al. Plant and animal functional diversity drive mutualistic network assembly across an elevational gradient. Nat. Commun. 2018, 9, 1–10. [Google Scholar] [CrossRef] [PubMed]
  51. Pigot, A.L.; Bregman, T.; Sheard, C.; Daly, B.; Etienne, R.S.; Tobias, J.A. Quantifying species contributions to ecosystem processes: A global assessment of functional trait and phylogenetic metrics across avian seed-dispersal networks. Proc. R. Soc. B Biol. Sci. 2016, 283, 1844. [Google Scholar] [CrossRef] [Green Version]
  52. Saavedra, F.; Hensen, I.; Beck, S.G.; Böhning-Gaese, K.; Lippok, D.; Töpfer, T.; Schleuning, M. Functional importance of avian seed dispersers changes in response to human-induced forest edges in tropical seed-dispersal networks. Oecologia 2014, 176, 837–848. [Google Scholar] [CrossRef]
  53. Fernández, V.P.; Fontúrbel, F.E. Temporal variation of daily activity on pollinator and frugivorous birds simultaneously interacting with a specialized mistletoe. Community Ecol. 2021, 22, 217–223. [Google Scholar] [CrossRef]
  54. Almeida-Neto, M.; Ulrich, W. A straightforward computational approach for measuring nestedness using quantitative matrices. Environ. Model. Softw. 2011, 26, 173–178. [Google Scholar] [CrossRef]
  55. Blüthgen, N.; Menzel, F.; Hovestadt, T.; Fiala, B.; Blüthgen, N. Specialization, Constraints, and Conflicting Interests in Mutualistic Networks. Curr. Biol. 2007, 17, 341–346. [Google Scholar] [CrossRef] [Green Version]
  56. Blüthgen, N. Why network analysis is often disconnected from community ecology: A critique and an ecologist’s guide. Basic Appl. Ecol. 2010, 11, 185–195. [Google Scholar] [CrossRef]
  57. Vaughan, I.P.; Gotelli, N.J.; Memmott, J.; Pearson, C.E.; Woodward, G.; Symondson, W.O.C. Econullnetr: An R package using null models to analyse the structure of ecological networks and identify resource selection. Methods Ecol. Evol. 2018, 9, 728–733. [Google Scholar] [CrossRef] [Green Version]
  58. Vazquez, D.P.; Aizen, M.A. Null model analyses of specialization in plant-pollinator interactions. Ecology 2003, 84, 2493–2501. [Google Scholar] [CrossRef] [Green Version]
  59. Bascompte, J.; Jordano, P.; Olesen, J.M. Asymmetric coevolutionary networks facilitate biodiversity maintenance. Science 2006, 312, 431–433. [Google Scholar] [CrossRef] [PubMed] [Green Version]
  60. Bersier, L.F.; Banasek-Richter, C.; Cattin, M.F. Quantitative descriptors of food-web matrices. Ecology 2002, 83, 2394–2407. [Google Scholar] [CrossRef]
  61. Bluthgen, N.; Menzel, F.; Bluthgen, N. Measuring specialization in species interaction networks. BMC Ecol. 2006, 6, 1–12. [Google Scholar] [CrossRef] [Green Version]
  62. Li, H.; Tang, L.; Jia, C.; Holyoak, M.; Fründ, J.; Huang, X.; Xiao, Z. The functional roles of species in metacommunities, as revealed by metanetwork analyses of bird–plant frugivory networks. Ecol. Lett. 2020, 23, 1252–1262. [Google Scholar] [CrossRef]
  63. Vidal, M.M.; Hasui, É.; Pizo, M.A.; Tamashiro, J.Y.; Silva, W.R.; Guimaraes, P. Frugivores at higher risk of extinction are the key elements of a mutualistic network. Ecology 2014, 95, 3440–3447. [Google Scholar] [CrossRef] [Green Version]
  64. Yang, S.; Albert, R.; Carlo, T.A. Transience and constancy of interactions in a plant-frugivore network. Ecosphere 2013, 4, 1–25. [Google Scholar] [CrossRef]
  65. Plein, M.; Längsfeld, L.; Neuschulz, E.L.; Schulthei, C.; Ingmann, L.; Töpfer, T.; Böhning-Gaese, K.; Schleuning, M. Constant properties of plant–frugivore networks despite fluctuations in fruit and bird communities in space and time. Ecology 2013, 94, 1296–1306. [Google Scholar] [CrossRef] [PubMed]
  66. Marjakangas, E.; Abrego, N.; Grotan, V.; de Lima, R.A.F.; Bello, C.; Bovendorp, R.S.; Culot, L.; Hasui, É.; Lima, F.; Muylaert, R.L.; et al. Fragmented tropical forests lose mutualistic plant–animal interactions. Divers. Distrib. 2020, 26, 154–168. [Google Scholar] [CrossRef] [Green Version]
  67. Coux, C.; Rader, R.; Bartomeus, I.; Tylianakis, J.M. Linking species functional roles to their network roles. Ecol. Lett. 2016, 19, 762–770. [Google Scholar] [CrossRef] [PubMed] [Green Version]
  68. Wall, S.B.V.; Beck, M.J. A comparison of frugivory and scatter-hoarding seed-dispersal syndromes. Bot. Rev. 2012, 78, 10–31. [Google Scholar] [CrossRef]
  69. Yan, P.; Yang, J. Species diversity of urban forests in China. Urban For. Urban Green. 2017, 28, 160–166. [Google Scholar] [CrossRef]
  70. Jha, R.K.; Nölke, N.; Diwakara, B.; Tewari, V.; Kleinn, C. Differences in tree species diversity along the rural-urban gradient in Bengaluru, India. Urban For. Urban Green. 2019, 46, 126464. [Google Scholar] [CrossRef]
  71. Van Heezik, Y.M.; Freeman, C.; Porter, S.; Dickinson, K.J.M. Native and exotic woody vegetation communities in domestic gardens in relation to social and environmental factors. Ecol. Soc. 2014, 19, 17. [Google Scholar] [CrossRef] [Green Version]
  72. Aronson, M.F.J.; La Sorte, F.A.; Nilon, C.H.; Katti, M.; Goddard, M.; Lepczyk, C.A.; Warren, P.S.; Williams, N.; Cilliers, S.; Clarkson, B.; et al. A global analysis of the impacts of urbanization on bird and plant diversity reveals key anthropogenic drivers. Proc. R. Soc. B Boil. Sci. 2014, 281, 20133330. [Google Scholar] [CrossRef] [PubMed]
  73. Palacio, R.D.; Valderrama-Ardila, C.; Kattan, G.H. Generalist species have a central role in a highly diverse plant-frugivore network. Biotropica 2016, 48, 349–355. [Google Scholar] [CrossRef]
  74. Cristaldi, M.A.; Giraudo, A.R.; Arzamendia, V.; Bellini, G.P.; Claus, J. Urbanization impacts on the trophic guild composition of bird communities. J. Nat. Hist. 2017, 51, 2385–2404. [Google Scholar] [CrossRef]
  75. Shochat, E.; Warren, P.S.; Faeth, S.H.; McIntyre, N.E.; Hope, D. From patterns to emerging processes in mechanistic urban ecology. Trends Ecol. Evol. 2006, 21, 186–191. [Google Scholar] [CrossRef] [PubMed]
  76. Evans, K.L.; Newson, S.E.; Gaston, K.J. Habitat influences on urban avian assemblages. Ibis 2009, 151, 19–39. [Google Scholar] [CrossRef]
  77. Ramos-Robles, M.; Andresen, E.; Diaz-Castelazo, C. Modularity and robustness of a plant-frugivore interaction network in a disturbed tropical forest. Ecoscience 2018, 25, 209–222. [Google Scholar] [CrossRef]
  78. Albrecht, J.; Berens, D.G.; Blüthgen, N.; Jaroszewicz, B.; Selva, N.; Farwig, N. Logging and forest edges reduce redundancy in plant-frugivore networks in an old-growth European forest. J. Ecol. 2013, 101, 990–999. [Google Scholar] [CrossRef]
  79. Buitron-Jurado, G.; Sanz, V. Specialization increases in a frugivorous bird-plant network from an isolated montane forest remnant. Community Ecol. 2020, 22, 261–274. [Google Scholar] [CrossRef]
Figure 1. Map of the field site at Zhongshan Botanical Garden in Jiangsu province, China (each circle represents one 10 × 10 m2 subplot monitored for fruit ripening phenology and subsequent bird foraging).
Diversity 14 00071 g001
Figure 2. Fruit ripening phenology: (a) fruit ripening phenology of 21 species of fruit plants; (b) the connections of different seasons contribution to the total plant–frugivore network, the color bars with the gradient of red to blue below the main figure indicate the proportion of interaction connections to the total network in different seasons.
Diversity 14 00071 g002
Figure 3. Characteristics of plant–frugivore networks in different seasons.
Diversity 14 00071 g003
Figure 4. Network diagram of plant–frugivore interaction. P1–P21 represents 21 species of fruit plant, and B1–B39 represents 39 species of frugivore birds. See Table S1 for corresponding Latin names.
Diversity 14 00071 g004
Figure 5. Partner diversity and effective partners of plants with different colors of fruit.
Diversity 14 00071 g005
Table 1. The six important species of fruit plants and three important species of frugivore birds with the highest contributions to the network.
CodeSpeciesRatio
(%)
PC1Species StrengthEffective PartnersPartner Diversity
P6Cinnamomum camphora39.1226.3313.1110.162.32
P11Photinia davidsoniae11.9110.323.836.041.80
P3Taxus chinensis6.126.710.702.450.90
P7Phoebe chekiangensis6.805.490.845.031.61
P20Melia azedarach3.753.290.233.091.13
P16Fatsia japonica4.073.161.142.350.86
B12Pycnonotus sinensis34.9824.734.796.651.90
B4Cyanopica cyanus16.2910.034.098.012.08
B29Turdus mandarinus16.2814.482.424.671.54
Table 2. Comparison of network roles of the important species (Group 1) with the other species (Group 2).
Fruit PlantsGroup 1 (N = 6)Group 2 (N = 15)Differences
PC19.22 ± 8.791.23 ± 3.51U = 4, Z = −3.192, p < 0.01
Species strength2.13 ± 2.451.75 ± 1.34U = 44, Z = −0.08, p = 0.97
Log(Effective partners)0.90 ± 0.140.63 ± 0.15F = 0.19, T = 3.68, df = 19, p = 0.02
Partner diversity2.32 ± 0.592.19 ± 0.48F = 0.23, T = 5.6, df = 19, p = 0.58
Specialization (d′)0.09 ± 0.050.14 ± 0.10F = 0.01, T = −0.08, df = 19, p = 0.94
Frugivore BirdsGroup 1 (N = 3)Group 2 (N = 36)Differences
PC110.09 ± 10.17−1.48 ± 0.95U = 0, Z = −2.85, p < 0.001
Log(Species strength)0.56 ± 0.15−1.01 ± 0.64F = 3.76, T = 4.367, df = 37, p < 0.01
Effective partners8.07 ± 1.742.57 ± 1.74U = 7, Z = −2.49, p < 0.01
Partner diversity2.07 ± 0.230.75 ± 0.62U = 7, Z = −2.49, p < 0.01
Specialization (d′)0.12 ± 0.030.28 ± 0.15U = 98, Z = 2.32, p = 0.015
Mean ± SD.
Publisher’s Note: MDPI stays neutral with regard to jurisdictional claims in published maps and institutional affiliations.

