Article

Mitochondrial Genetic Diversity and Structure of the Langur Population in a Complex Landscape of the Nepal Himalaya

1
Central Department of Zoology, Institute of Science and Technology, Tribhuvan University, Kathmandu 44618, Nepal
2
State Key Laboratory of Genetic Resources and Evolution, Kunming Institute of Zoology, Chinese Academy of Sciences, Kunming 650201, China
3
Nepal Biodiversity Research Society (NEBORS), Lalitpur 23513, Nepal
4
Departments of Psychology, Global Health and Anthropology, Center for Global Field Study, Washington National Primate Research Center, University of Washington, Seattle, WA 98195, USA
*
Authors to whom correspondence should be addressed.
Diversity 2022, 14(2), 69; https://doi.org/10.3390/d14020069
Submission received: 22 December 2021 / Revised: 19 January 2022 / Accepted: 19 January 2022 / Published: 21 January 2022
(This article belongs to the Section Animal Diversity)

Abstract

:
Heterogenous landscape features of the Himalayan region shape the genetic structure of animal populations by delimiting spatial patterns of dispersal and reproduction. Integrating population genetic analysis with landscape features could yield results that shed light on the evolutionary diversity of the taxa therein. This study assessed the population genetic structure of the Nepal Himalayan langurs (Semnopithecus spp.) across almost their entire distribution range in the complex landscape of the Nepal Himalaya using the mitochondrial cytochrome b (CYTB, 1140 bp), cytochrome c oxidase I (COI, 676 bp), and control region (1088 bp) sequences. Sequences were successfully retrieved from 52 samples belonging to 17 troops of wild Himalayan langurs in Nepal. The concatenated alignment of the three loci (2904 bp) defined 35 unique haplotypes with haplotype and nucleotide diversities of 0.961 ± 0.017 and 0.0204 ± 0.004, respectively. The results of a median joining haplotype network and of inter-haplotypic phylogenetic analyses revealed five major clades across the country: one from the eastern, two from the central, and two from the western region of Nepal. No haplotypes were shared among the regions. The Mantel test results indicated that the landscape heterogeneity of the Himalaya has shaped the population genetic structure of the Himalayan langurs due to the combined effects of isolation by resistance and isolation by distance phenomena. The strong population genetic structure and deep mtDNA divergence warrants a detailed taxonomic assessment of the Himalayan langurs across their entire range.

Graphical Abstract

1. Introduction

The Himalayan region harbors unique landscapes, ecosystems and biota that are the result of its climatic, topographic, geological and altitudinal variations [1]. This geologically young and climatically unstable area is the most glaciated mountain region outside of the polar realms during the quaternary climatic oscillations [2]. The periodic orogenic and paleoclimatic events modified landscapes and offered new habitats that favored diversification in life forms [3]. Additionally, the development of the south-Asian summer monsoon likely created geobiological dynamics for further evolution of the Himalayan ecosystems [4]. The heterogenous landscape characteristics of the Himalayan region such as rivers, mountains, and habitat fragmentation have likely shaped the genetic structure of populations by delimiting spatial patterns of dispersal and reproduction across generations [5,6]. Population genetic analyses coupled with topographic features of species habitat identify genetic differences among individuals of isolated populations and then relate those discontinuities with landscape attributes [7]. It can resolve population substructure across different geographical scales at fine taxonomic levels [8] and is instrumental to understand the extent and distribution of genetic diversity for small, fragmented populations.
Diversity at the genetic level is important, but for many of the animals in the Himalayan region, it is unknown. Among the Himalayan mammals, the Himalayan langurs (Semnopithecus spp.), colobine primates, have a wide range of distribution, including in India, Nepal, and Bhutan. They have spatially structured populations linked by dispersal and gene flow, which could have influenced evolutionary processes of the species [6,9]. The evolutionary history of the Himalayan langurs is still not well documented, as most of the related studies have focused on behavior and distribution [9,10,11,12,13,14,15]. The Himalayan langur population has suffered a considerable decline in the recent past as their habitats become depleted and fragmented, and they are still hunted in many parts of the Himalaya [16,17]. The species has been suggested to have experienced climate-induced range shift and population decrease during the last interglacial and the last glacial maximum [6], and it could be under stress from current climate change [18].
Despite the wide range of distribution, smaller-sized populations might have a reduced level of genetic diversity. The presence of river barriers, industrialization, urbanization and agricultural expansion have hindered the dispersal of individuals and have effectively isolated the population of Himalayan langurs in the Nepal Himalaya [6]. Additionally, female philopatry exhibited by the langurs [10] results in sex-biased dispersal that can have marked implications for the sub-structuring of their mitochondrial genes within and between populations [19]. The Nepal Himalayan langurs have a wide range of elevational distribution, from less than 100 m above sea level (asl) to almost 4000 m asl [6,16]. Individuals of the species also display a range of altitude-associated morphological variations. The populations in the lowland Tarai have a yellowish chest and are regarded as S. entellus hector, those in the mid-hills have a yellowish-grey chest and are referred to as S. e. ajax, and those from higher elevations have whitish chest pelage and a thick whorl of long white hairs on the head and are labeled S. e. schistaceus (Figure 1) [10,20]. The IUCN has recognized these taxa as full species [21,22,23]; however, their distribution ranges are not well delineated. The potential effects of distribution in altitudinal gradients and wide spatial extent, population fragmentation, morphological variations, etc. on the genetic structure of the Himalayan langur have not yet been assessed.
The phylogeny of colobine monkeys corresponds to a complex evolutionary history, evolving multiple discrete radiations and inhabiting a wide range of habitats in tropical Africa and in southern and south-eastern Asia [24]. The Himalayan langurs inhabiting the temperate forests of India and Nepal have been described to be distinct both morphologically and behaviorally from conspecifics in other ecological niches [10,25]. A recent phylogenetic study based on a single mitochondrial gene (CYTB, 775 bp) described the population of langurs across Himalaya under a single species and argued the Nepal population belonging to two distinct (eastern and western) lineages [25]. Population genetic analysis of the Nepal Himalayan langurs has revealed a strong genetic structuring by the riverine barriers [6]. However, a detailed genetic analysis unveiling the association of landscape features with the genetic make-up of the species is still lacking.
In 2018, using mitochondrial cytochrome b (CYTB) and control region (CR) sequences, we reported that the highly structured genetic makeup of Nepal Himalayan langurs was markedly influenced by the river barriers [6]; however, boundaries of genetic subpopulations were not clearly delineated. A detailed genetic understanding is essential prior to a phylogenetic analysis in order to integrate intra-species population processes into a phylogenetic framework. Analysis of multiple driving factors is essential for a better understanding of the processes shaping the distribution of genetic variation throughout Himalayan langur ranges. Analyses such as isolation by distance and isolation by resistance addressing different environmental resistances such as habitat suitability, elevation, river barriers, etc. could shed light on the fine-scale genetic structuring of the species. Therefore, this study investigated the association of genetic structure of the Himalayan langur population with the landscape complexity of the Nepal Himalaya by employing multiple genetic approaches on mitochondrial cytochrome c oxidase I (COI), CYTB and CR sequences of the Nepal Himalayan langurs.

2. Materials and Methods
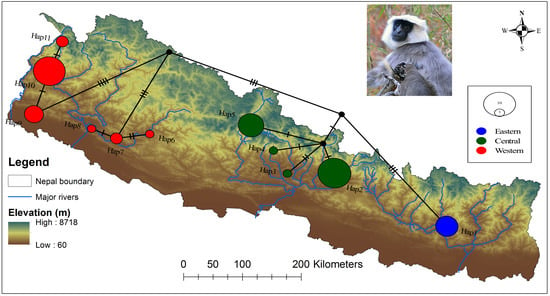
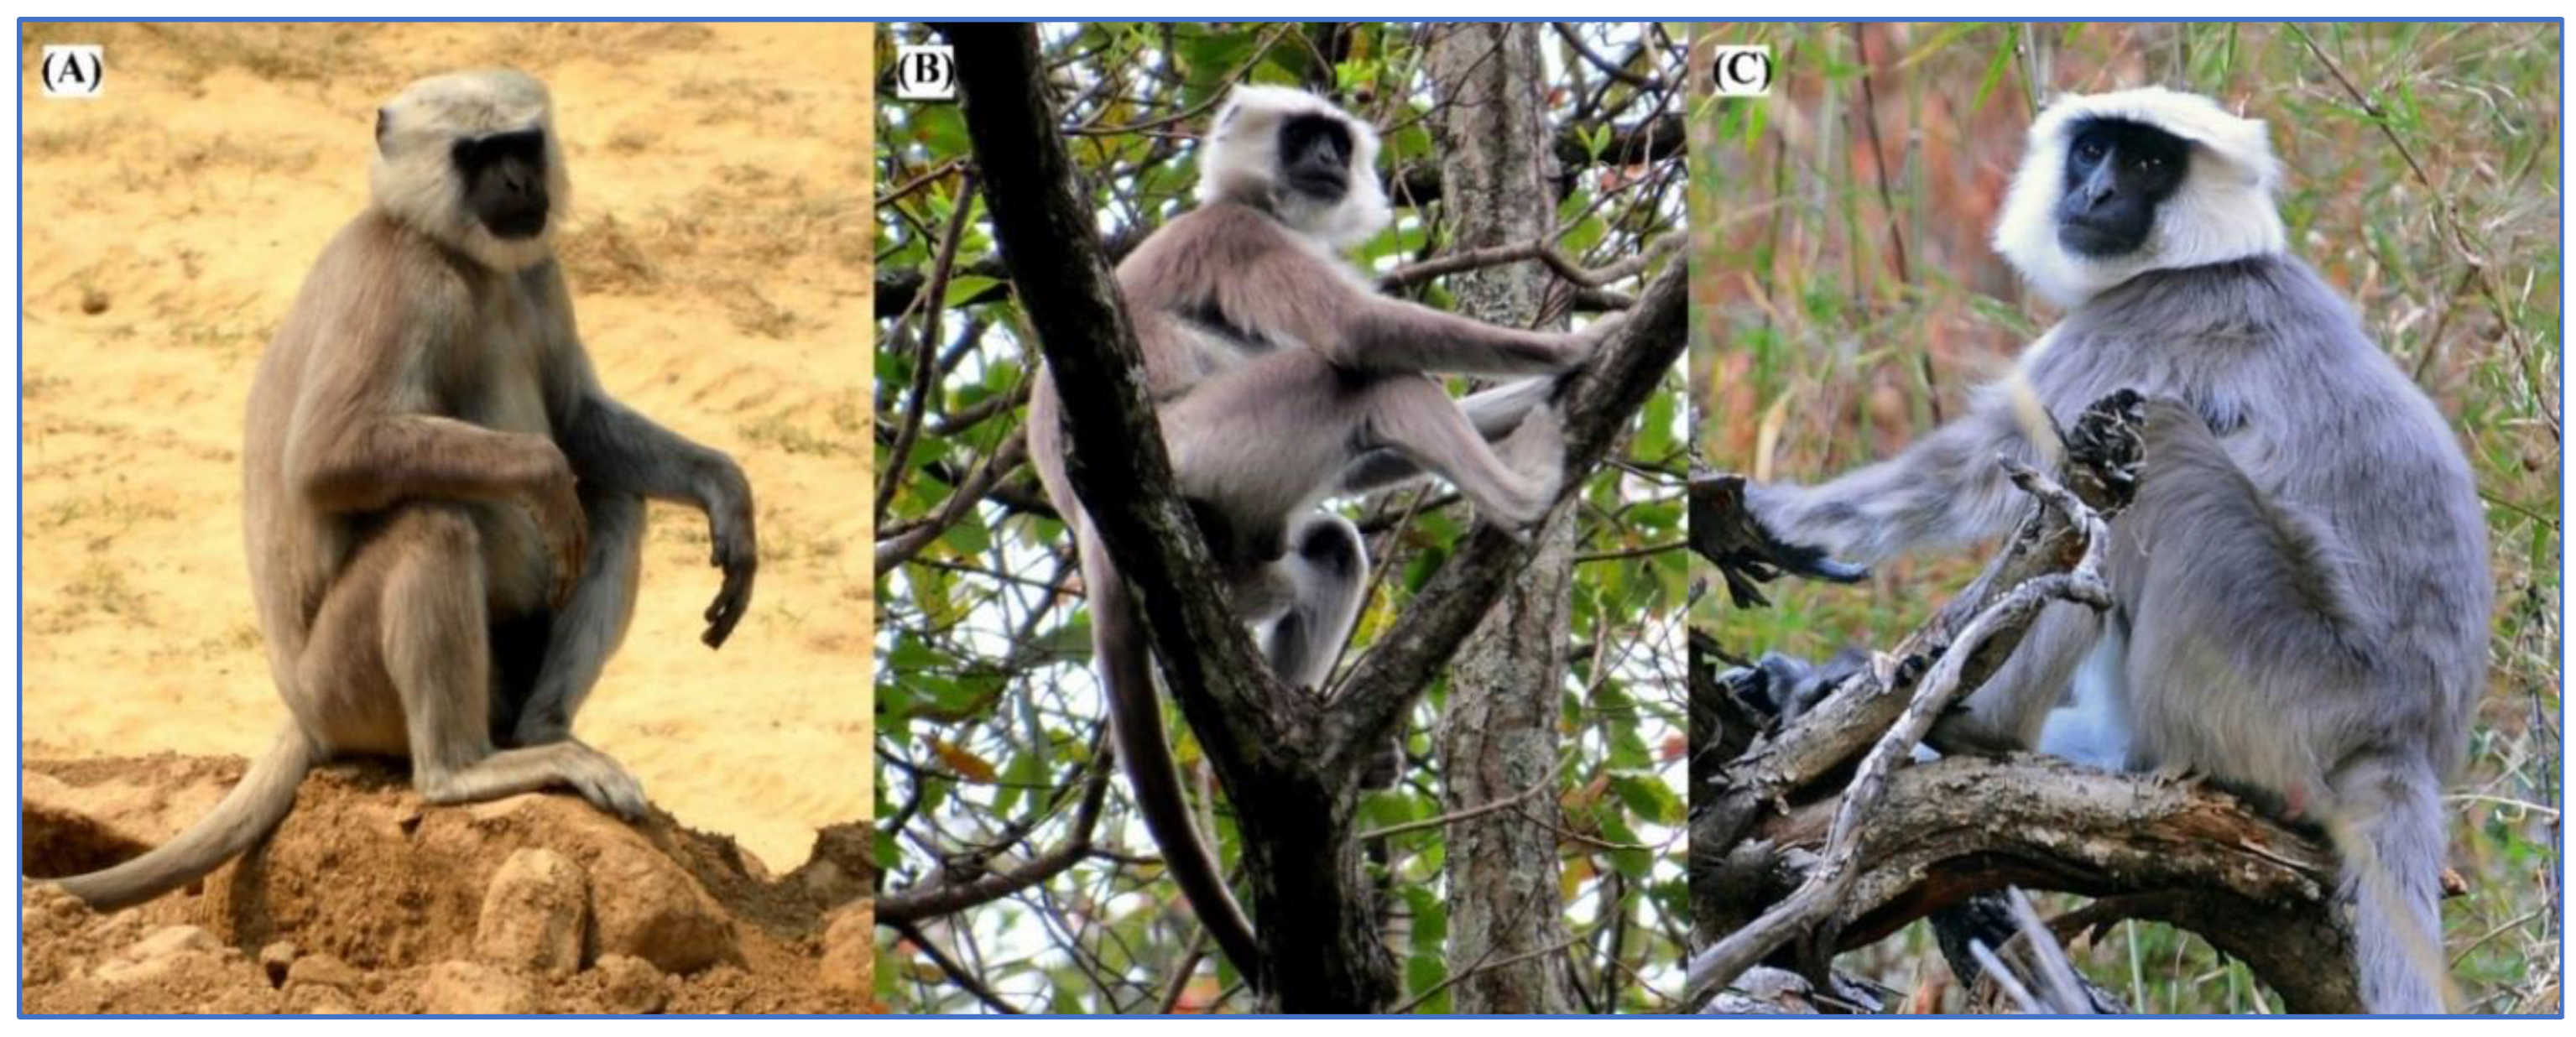
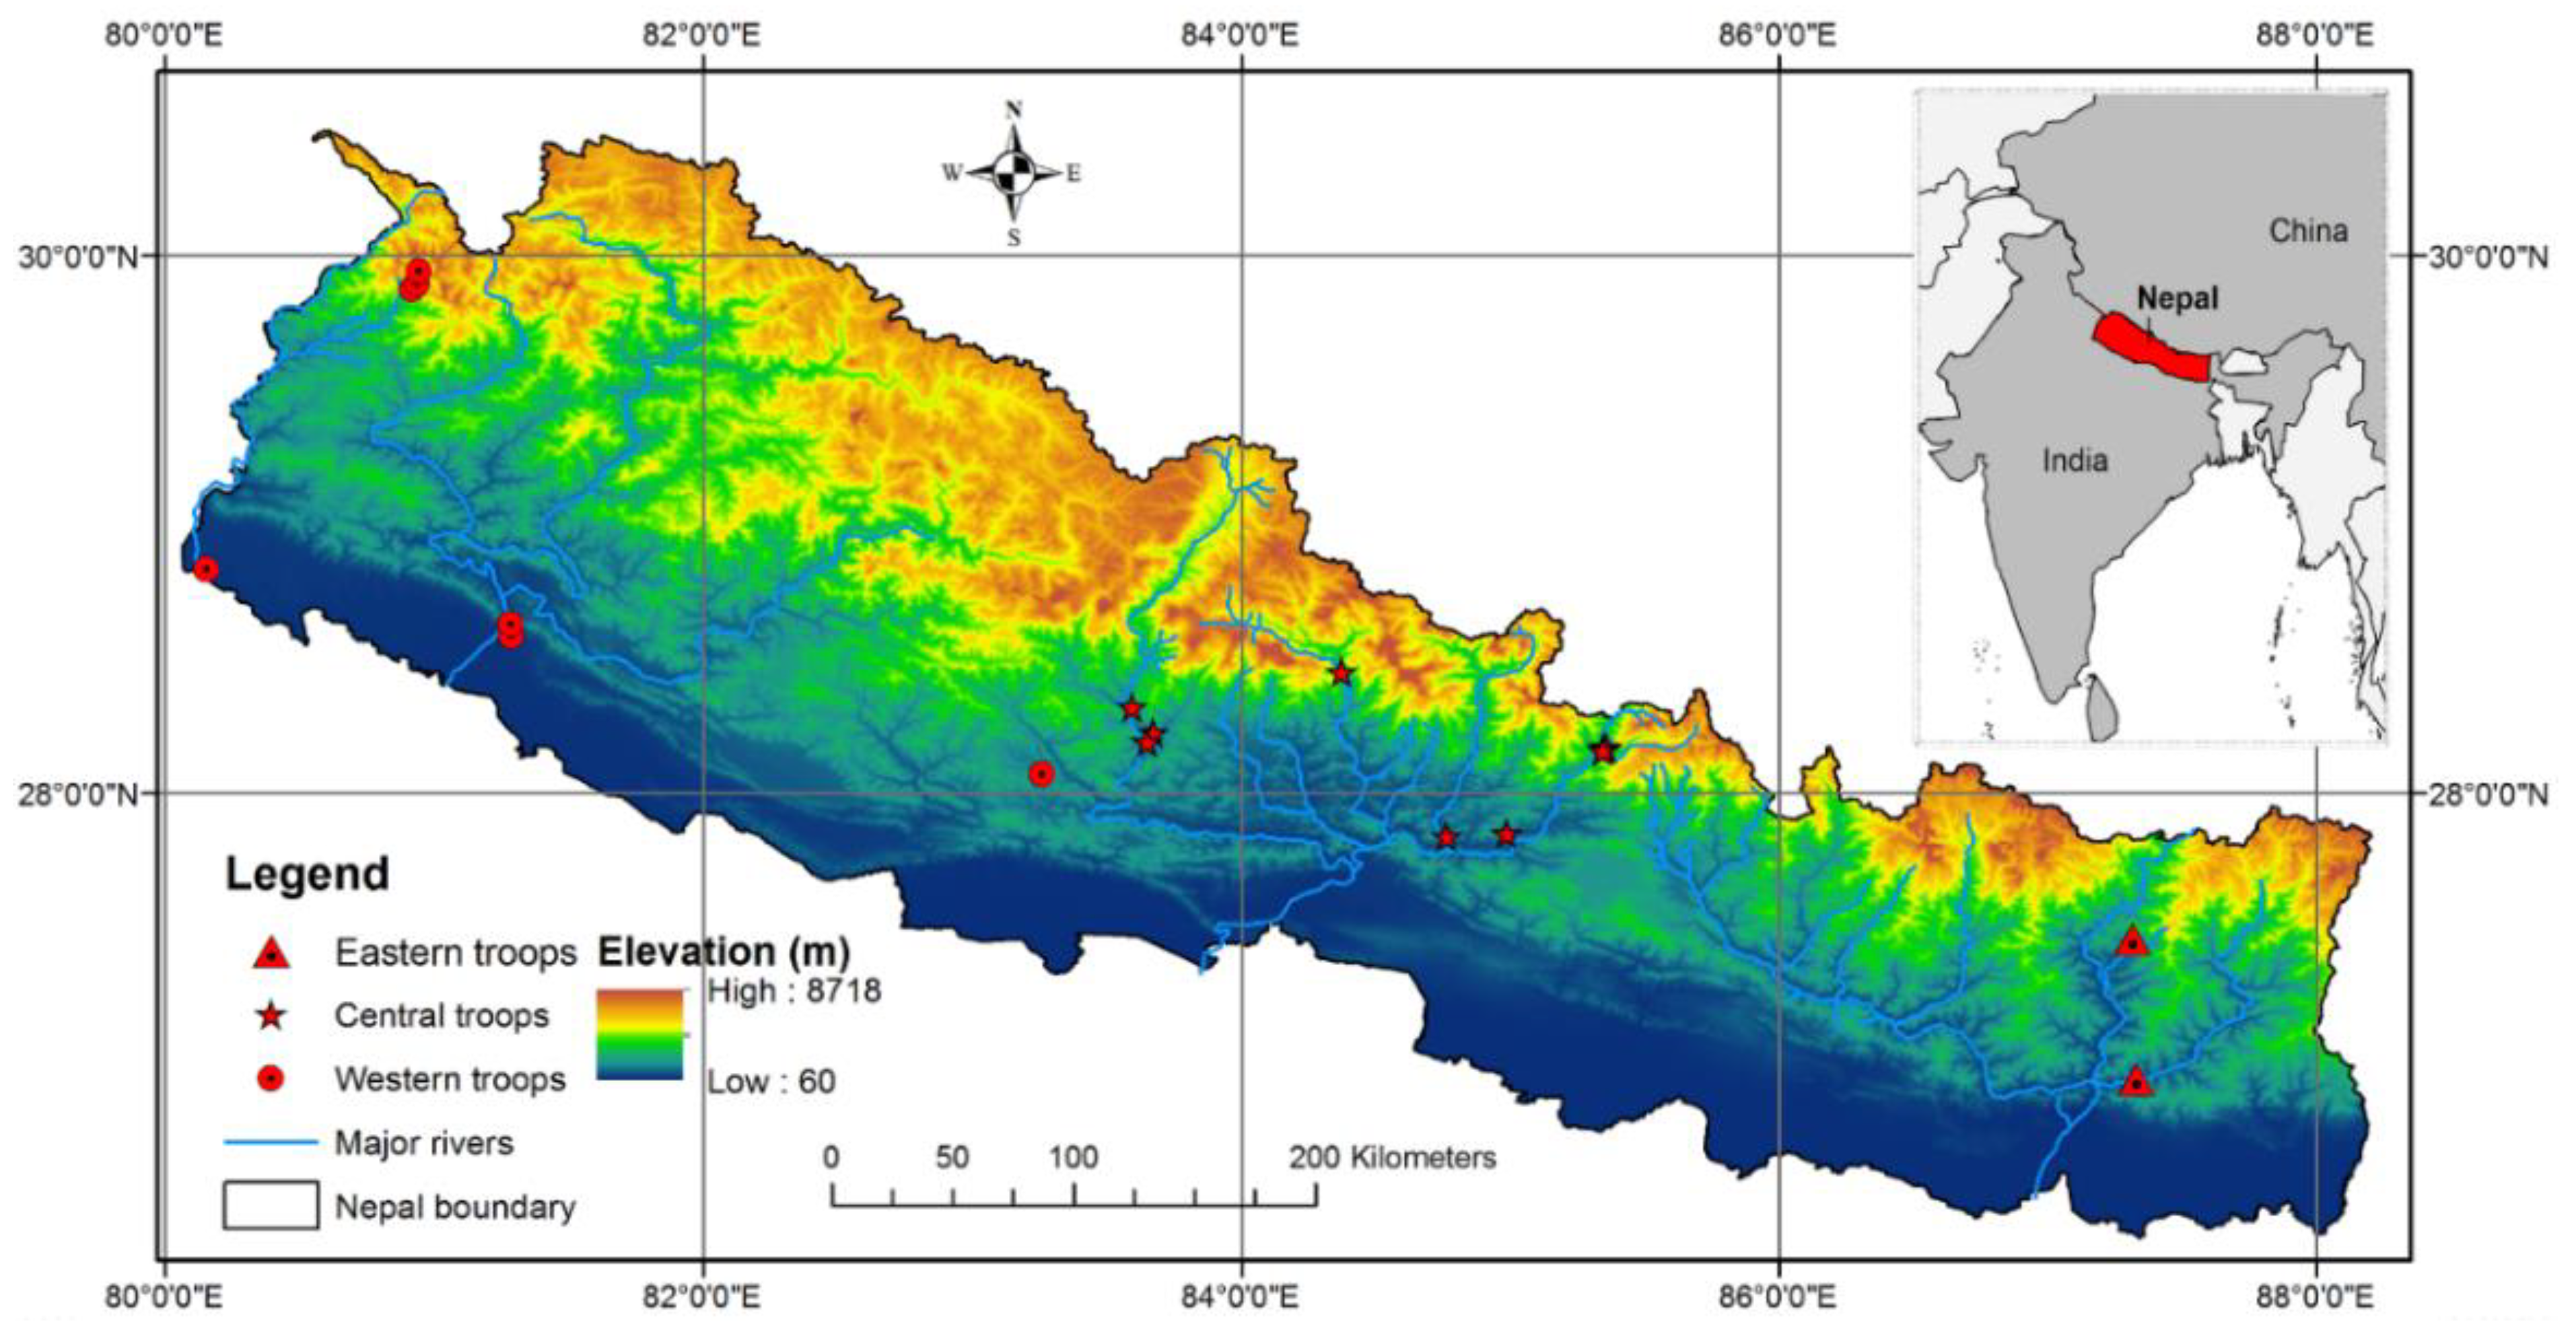
2.1. Study Area

The Nepal Himalaya, with an elevational range of 60–8848 m asl, spans the central third of the Himalayan range. On the southern slope of the Nepal Himalaya, the territory comprises a unique landscape and biological assemblage. Extending between 80° to 88° E and 26° to 30° N, Nepal (Figure 2) contains topographic, climatic and biological heterogeneity. The country has plain areas in the south, hills and valleys in the middle, and the lofty Himalaya mountains in the north [26]. Wide altitudinal variations and diverse climatic conditions have resulted in tropical to nival bioclimatic zones within Nepal [27].
The eastern region of the country, lying in the lower latitude, is under considerable influence from the South-Asian summer monsoon, while the western region receives more precipitation from the westerlies [28]. There are three major river systems in Nepal, namely the Koshi River system (KRS) in the east, the Gandaki River system (GRS) in the central region, and the Karnali–Mahakali River system (KMRS) in the west. The low land Tarai has dipterocarp forests dominated by Shorea-Acacia-Dalbergia. The mid-hills and lower mountains bear mixed deciduous and evergreen forest of Schima-Castanopsis. The higher mountains bear Elaeocarpus-Macaranga and Quercus-Pinus-Rhododendron forests.

2.2. Fecal Sampling and DNA Extraction

A total of 87 fecal samples from 18 troops of wild Nepal Himalayan langurs (Figure 2, Table 1) were collected non-invasively. Sterilized cotton swabs and a plastic vial with 2 mL of lysis buffer [29] were used for collection and storage of the sample. The sampling procedure is detailed in Khanal et al. [6]. For each troop sampled, geographic coordinates were noted using Garmin GPSMap 64 s. The collected samples were stored at ambient temperature and transferred to the lab for DNA extraction. The genomic DNA was extracted from the fecal samples using the QIAamp® DNA Stool Mini Kit (QIAGEN, Hilden, Germany). Final elution of the DNA was performed with 50 μL elution buffer and stored at −20 °C until further processing.

2.3. PCR Amplification and DNA Sequencing

This study used three mtDNA loci: cytochrome b (CYTB, 1040 bp), control region (CR, 1088 bp) and cytochrome c oxidase subunit 1 (COI, 676 bp). The corresponding CYTB and CR sequences for the samples used in this analysis were obtained as explained in Khanal et al. [6]. A fragment of the COI gene from the mitochondrial DNA was amplified using the primer pair LCOIF (5′-TTCTCCACAAATCACAAAGATATTGG-3′) and LCOIR (5′-TAGACTTCGGGGTGACCGAAGAATCA-3′). Each PCR reaction was conducted in a total volume of 25 μL that contained 12.5 μL of 2× power Taq PCR Master Mix (BioTeke, Beijing, China), 10.5 μL of ddH2O, 0.5 μL each of forward and reverse primer and 1.0 μL of template DNA. All PCRs were carried out with an initial denaturation at 94 °C for 5 min, 35 cycles each with denaturation at 94 °C for 30 s, annealing at 57 °C for 30 s, and extension at 72 °C for 60 s followed by a final extension at 72 °C for 10 min. PCR products were tested in 1.2% agarose gel, and the successful amplicons were sequenced in both directions with the same primer pair of PCR amplification using a BigDye Terminator Cycle Kit v.3.1 (Invitrogen) on an ABI 3730XL sequencer (Applied Biosystems, Waltham, MA, USA).

2.4. Data Analysis

2.4.1. DNA Polymorphism and Genetic Diversity

The mtDNA sequences of the Nepal Himalayan langurs were assembled and edited using SeqMan (DNASTAR Lasergene v.7.1). Among the 87 fecal samples collected from 18 wild troops of langurs, all three loci were successfully obtained from 52 samples belonging to 17 troops (Table 1). The sequences from each sample were concatenated in the order of CYTB, COI and CR, and the set of 52 sequences was aligned (2904 bp) using the Clustal W [30] algorithm in MEGA X [31]. A separate alignment was also prepared for the COI gene alone. Genetic diversities on alignment of the COI gene and the entire set of three genes were estimated separately for each region (i.e., eastern, central, western) and the overall population as the number of polymorphic sites (s), number of haplotypes (H), haplotype diversity (Hd) and nucleotide diversity (π) using DnaSP v.6.12 [32]. The number of DNA sequences differed among the sampling regions; therefore, we assessed the influences of variation in sample size on s, H, Hd, and π based on concatenated sequences using the F-test for linear regression analysis, with significance determined at a threshold of 0.05.

2.4.2. Inter-Haplotypic Relationships

The geographical distribution and mutational relationship of the Nepal Himalayan langur haplotypes were inferred by a median joining haplotype network using PopART v.1.7 [33]. Additionally, a phylogenetic tree depicting the relationship among the haplotypes was constructed using the maximum likelihood (ML) algorithm in RAxML v.8.2.10 [34] with 1000 bootstrap replications. For the ML analysis, the best partitioning scheme for the concatenated alignment (CYTB + COI + CR = 2904 bp) with the GTR + G evolutionary model and Bayesian Information Criterion (BIC) was determined (P1 = 1–1140\3, 2–1140\3; P2 = 3–1140\3; P3 = 1141–1816\3, 1142–1816\3, 1143–1816\3; 1817–2904) using Partition Finder v.2.1.1 [35]. The bipartition ML tree from the RAxML analysis was processed and visualized using FigTree v.1.4.3 [36].

2.4.3. Isolation by Distance

Pairwise genetic distances (FST) among the troops were calculated from pairwise nucleotide differences between the sequences, and their statistical significance was checked using 10,000 permutations as implemented in Arlequin v.3.5.1.2 [37]. Isolation by distance (IBD) was tested by the Mantel test [38] with Pearson’s correlation coefficient ® between pairwise geographic and genetic distances among the sampled troops. Euclidian distance between the pair of sampled troops was determined by using their respective GPS points in Geographic Distance Matrix Generator v.1.2.3 [39], and pairwise genetic distance (FST) was determined in Arlequin v.3.5.1.2 [37]. The correlation coefficient between the two sets of distances was calculated in GraphPad Prism v.5.01 [40].

2.4.4. Isolation by Resistance

The effects of the heterogeneous landscapes of the Nepal Himalaya on shaping genetic structure of langurs (Isolation by resistance, IBR) were tested using pairwise genetic distances and three types of resistance distances among the 18 sampled troops. It was hypothesized that suitable habitats generate high conductance for dispersal, whereas unsuitable areas impose higher resistance. The current species distribution model was based on environmental-niche-represented habitat conductance grids. The digital elevation models (DEM) represented the elevational resistance grids, and rivers represented the river barrier grids.
For the species distribution model, 19 bioclimatic variables [41] were retrieved from the WorldClim database (http://worldclim.org/, accessed on 4 September 2021) and clipped to the boundary of Nepal. After removing highly correlated (r ≥ |0.8|) variables based on Pearson’s correlation test (p < 0.05), seven bioclimatic variables (Bio: 1, 3, 5, 11, 12, 15, 18) were selected for the model development. The occurrence points of the sampled troops and selected bioclimatic variables were used in MaxEnt v.3.4.1 [42] to develop the species distribution model (SDM). Model evaluation was performed by randomly dividing the species presence data into 80% as the training dataset and 20% as the validation dataset. Finally, 25 replicated models were generated based on the cross-validation method. The model accuracy was validated by using area under the curve (AUC) of the receiving operating curve (ROC).
For elevation, the 30-arc-second resolution DEM data retrieved from Global Multiresolution Terrain Elevation Data 2010 (https://lta.cr.usgs.gov/GMTED2010, accessed on 4 September 2021) were used. Following the methods of Adams et al. [43], low resistance values were given to low elevation ranges where langurs are more abundant, whereas higher resistance values were given to higher elevations where they are sparse. Five different ranges were assigned resistance values (<800 m = 1, 801–1600 m = 5, 1601–2400 m = 10, 2401–3200 m = 100, >3201 m = 1000) based on elevations from where langurs were sampled.
For rivers, major rivers from each of the KRS, GRS and KMRS were used as the potential barriers for dispersal [6]. Areas within Nepal’s territory without rivers were assigned a low resistance value (1), and each of the major rivers was assigned a higher resistance value (100).
Based on the circuit theory [44], cumulative ‘current maps’ for resistance and pairwise resistance distances were calculated for the 18 sampling sites by three approaches: one with output from the SDM (as conductance), second with the classified DEM layers (as resistance) and the third with the major rivers (as resistance) in CIRCUITSCAPE v.4.0 [45]. Pearson’s correlation coefficient (r) between pairwise genetic distance (FST) and resistance distances from all the three approaches were calculated.

3. Results

3.1. Genetic Diversity

A total of 52 successful sequences of the COI gene (676 bp, G + C: 0.420) were retrieved from the 17 troops of Himalayan langurs sampled in Nepal. There were 22 polymorphic sites of which 19 were the parsimony informative. Eleven unique haplotypes were identified (Hap1–Hap11; GenBank Accession Numbers MW600237–MW600247): one from the eastern region of Nepal (Hap1), four from the central region (Hap2–Hap5), and six (Hap6–Hap11) from the western region (Table 2). The haplotype diversity and nucleotide diversity on COI gene sequences were 0.841 ± 0.023 and 0.0092 ± 0.0024, respectively.
The concatenated alignment (2904 bp) of the 52 sequences for CYTB, COI and CR had 209 polymorphic sites that defined 35 unique haplotypes (six from eastern, 20 from central and nine from western Nepal). The haplotype diversity was 0.961 ± 0.017, and nucleotide diversity was 0.0204 ± 0.004. Among the three sampling regions, the central population of the Nepal Himalayan langur had the highest haplotype diversity (0.982 ± 0.018), while the western population had the highest nucleotide diversity (0.009 ± 0.003) (Table 2). The number of sequences also differed among the three sampling regions. However, sample size showed no significant influence on the number of polymorphic sites, number of haplotypes, haplotype diversity, or nucleotide diversity (number of polymorphic sites: R2 = 0.9725, F (1, 1) = 35.59; number of haplotypes: R2 = 0.608, F (1, 1) = 1.553; haplotype diversity: R2 = 0.047, F (1, 1) = 0.049; nucleotide diversity π: R2 = 0.952, F (1, 1) = 19.84; p > 0.05).

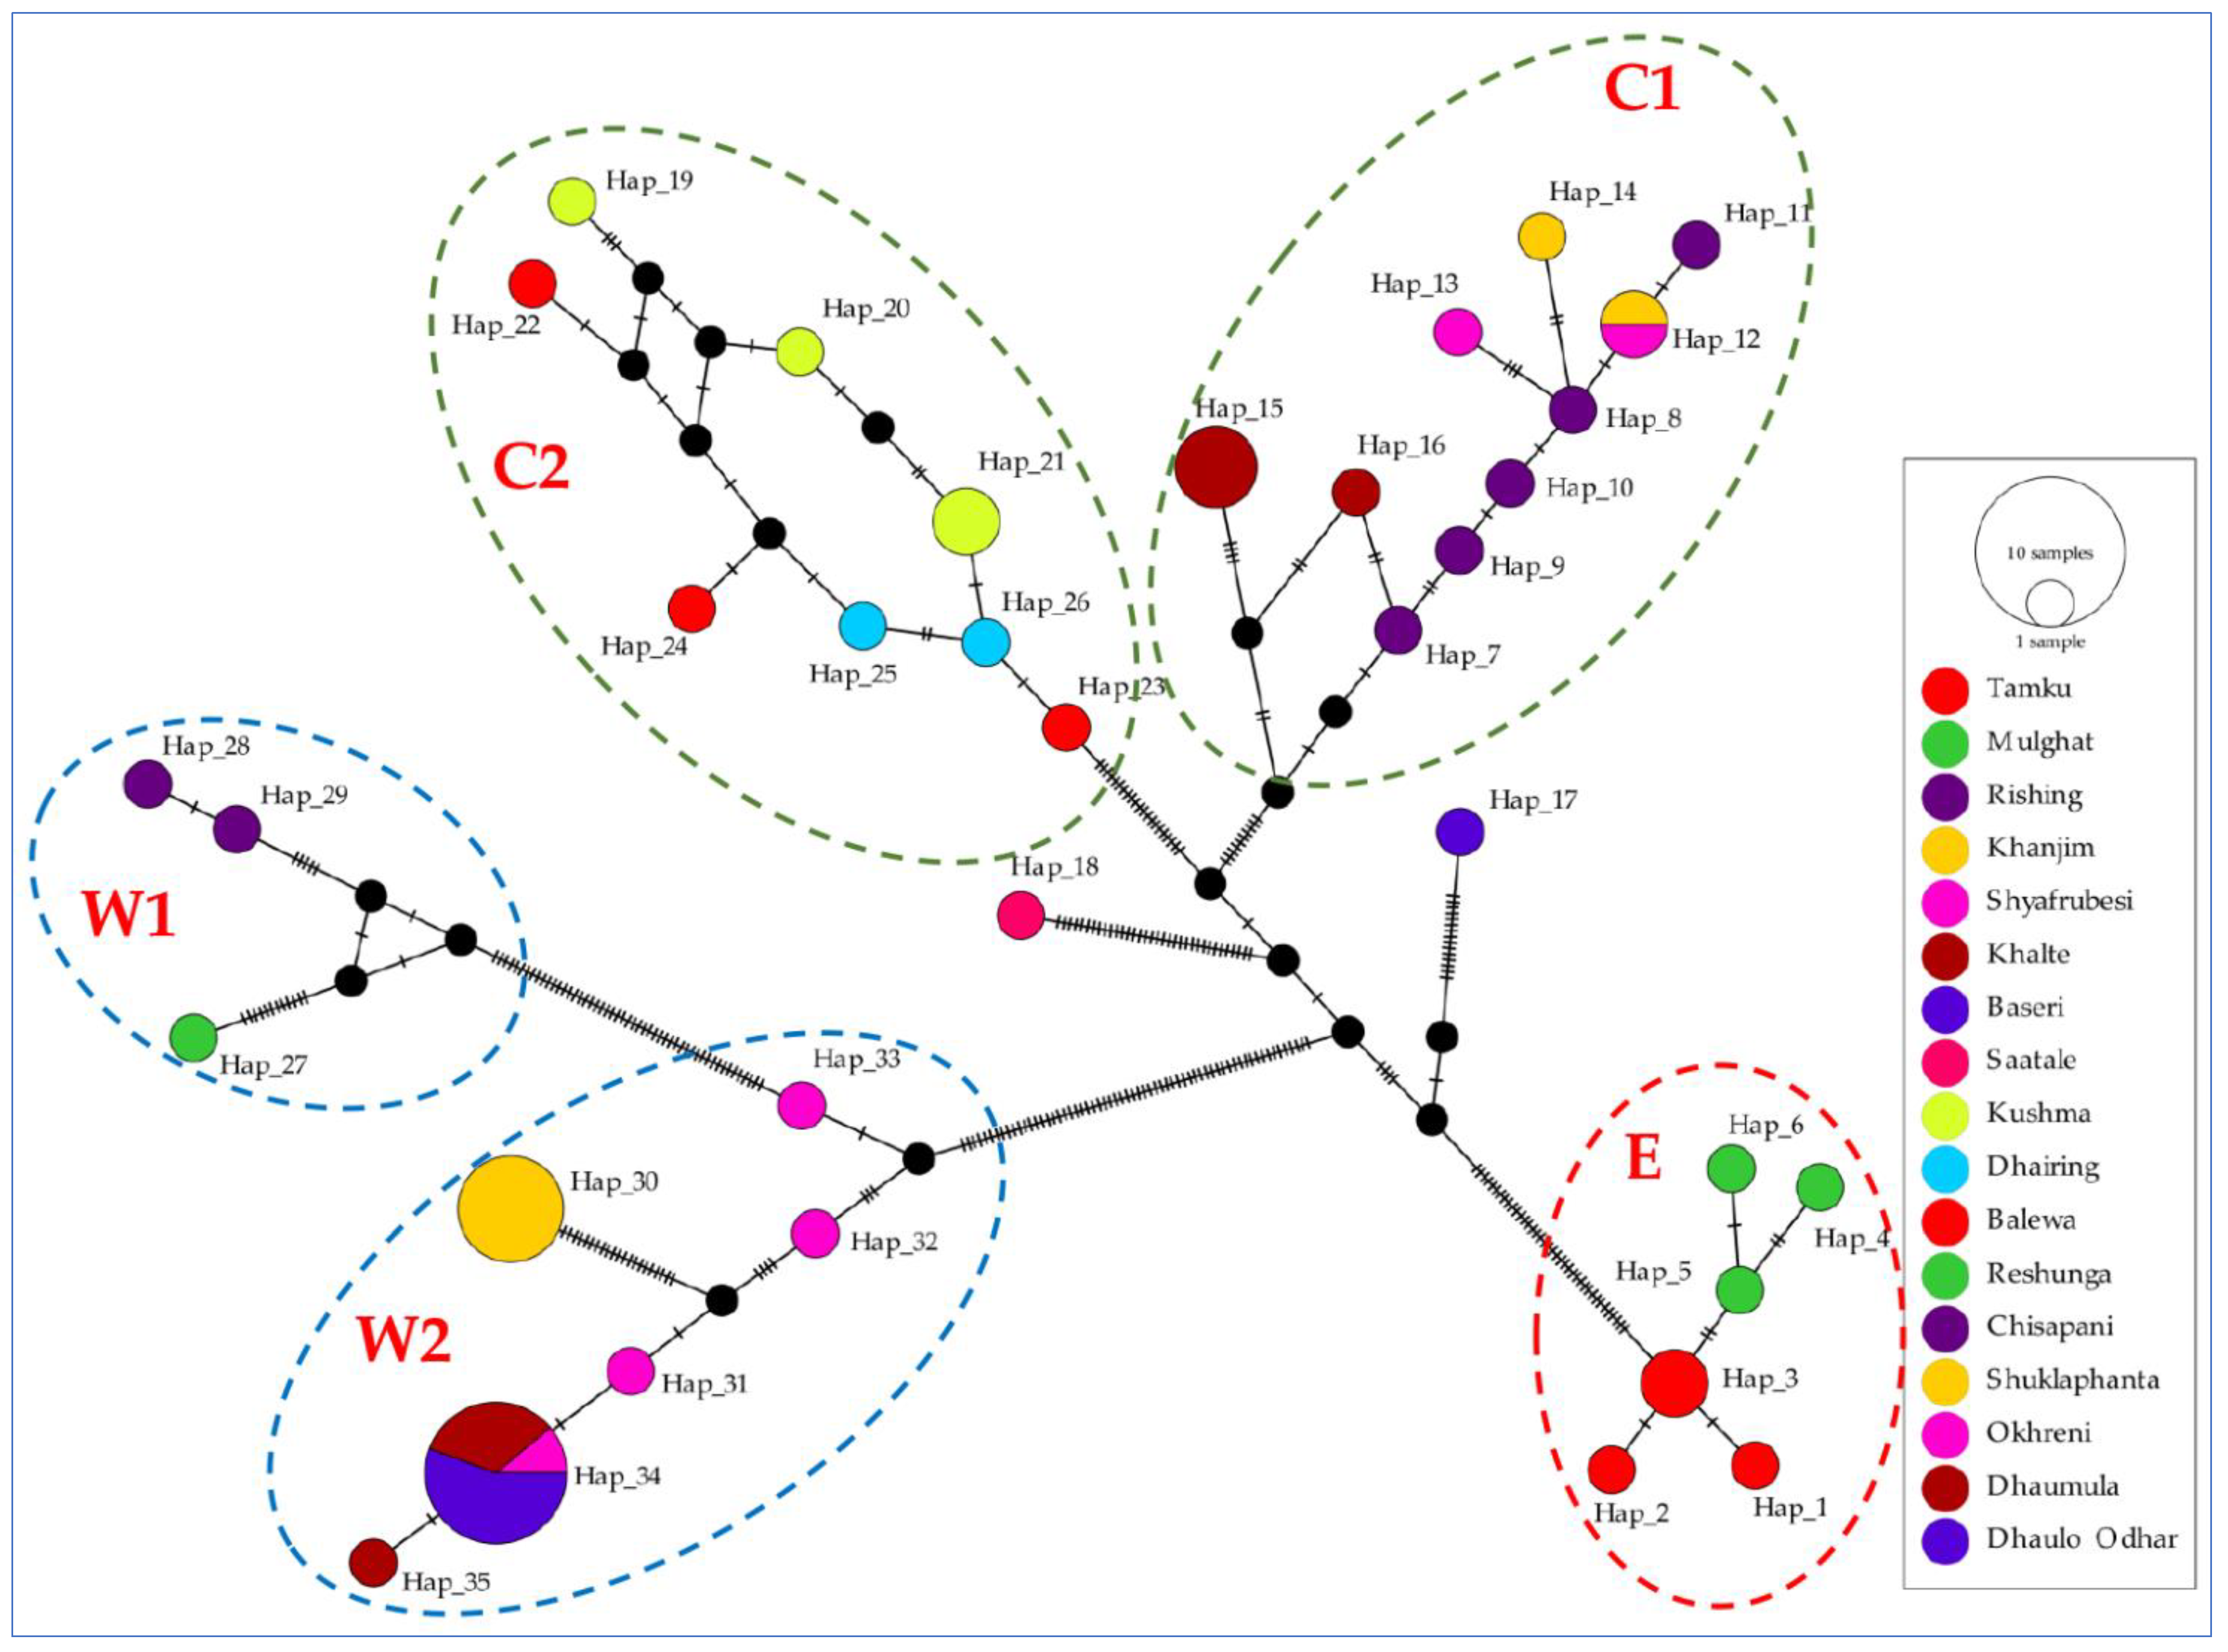
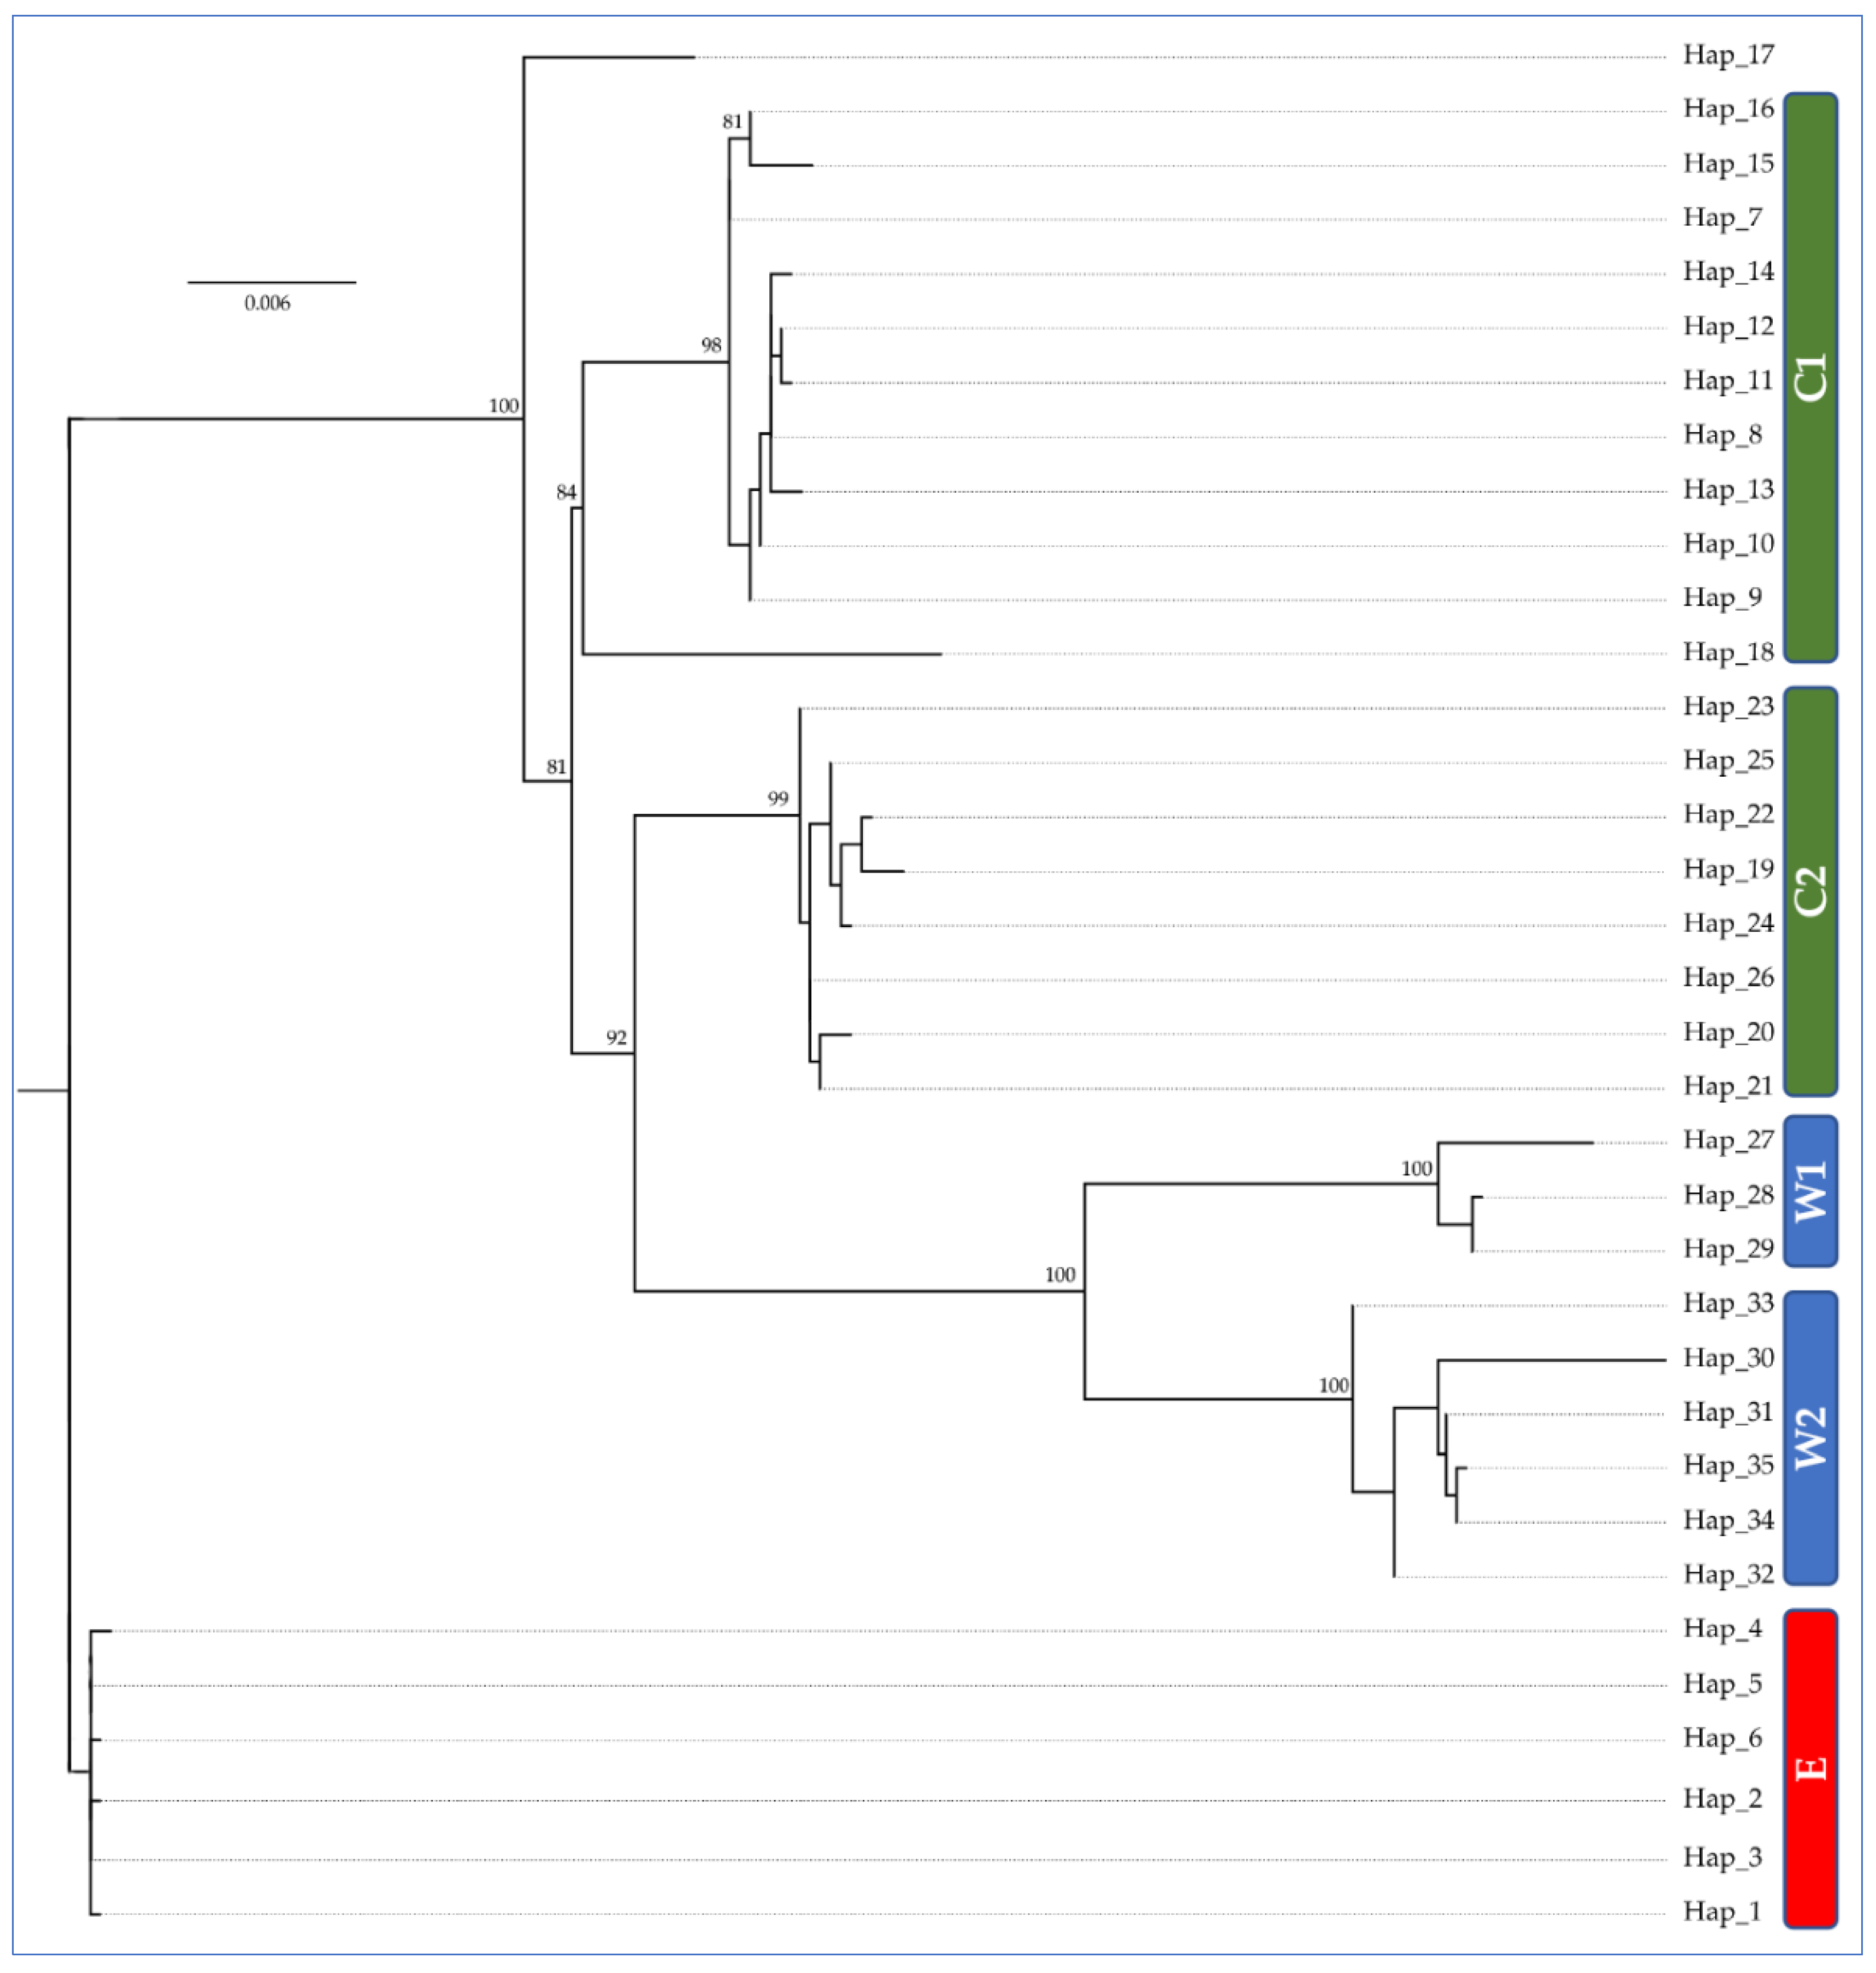
3.2. Population Genetic Structure

The median joining (MJ) haplotype network based on the concatenated alignment revealed five distinct clades (Named as: E, C1, C2, W1 and W2) of the Nepal Himalayan langur (Figure 3). Haplotypes of troops from eastern Nepal (E) formed one clade. Twenty haplotypes from central Nepal formed two clades (C1 and C2); however, Hap_17 and Hap_18 were separate from those clades. Haplotypes from western Nepal formed two clades (W1 and W2). The ML phylogenetic tree for the 35 haplotypes of Nepal Himalayan langurs was consistent with the MJ haplotype network to define five major clades (namely-E, C1, C2, W1 and W2) with strong bootstrap support (Figure 4).

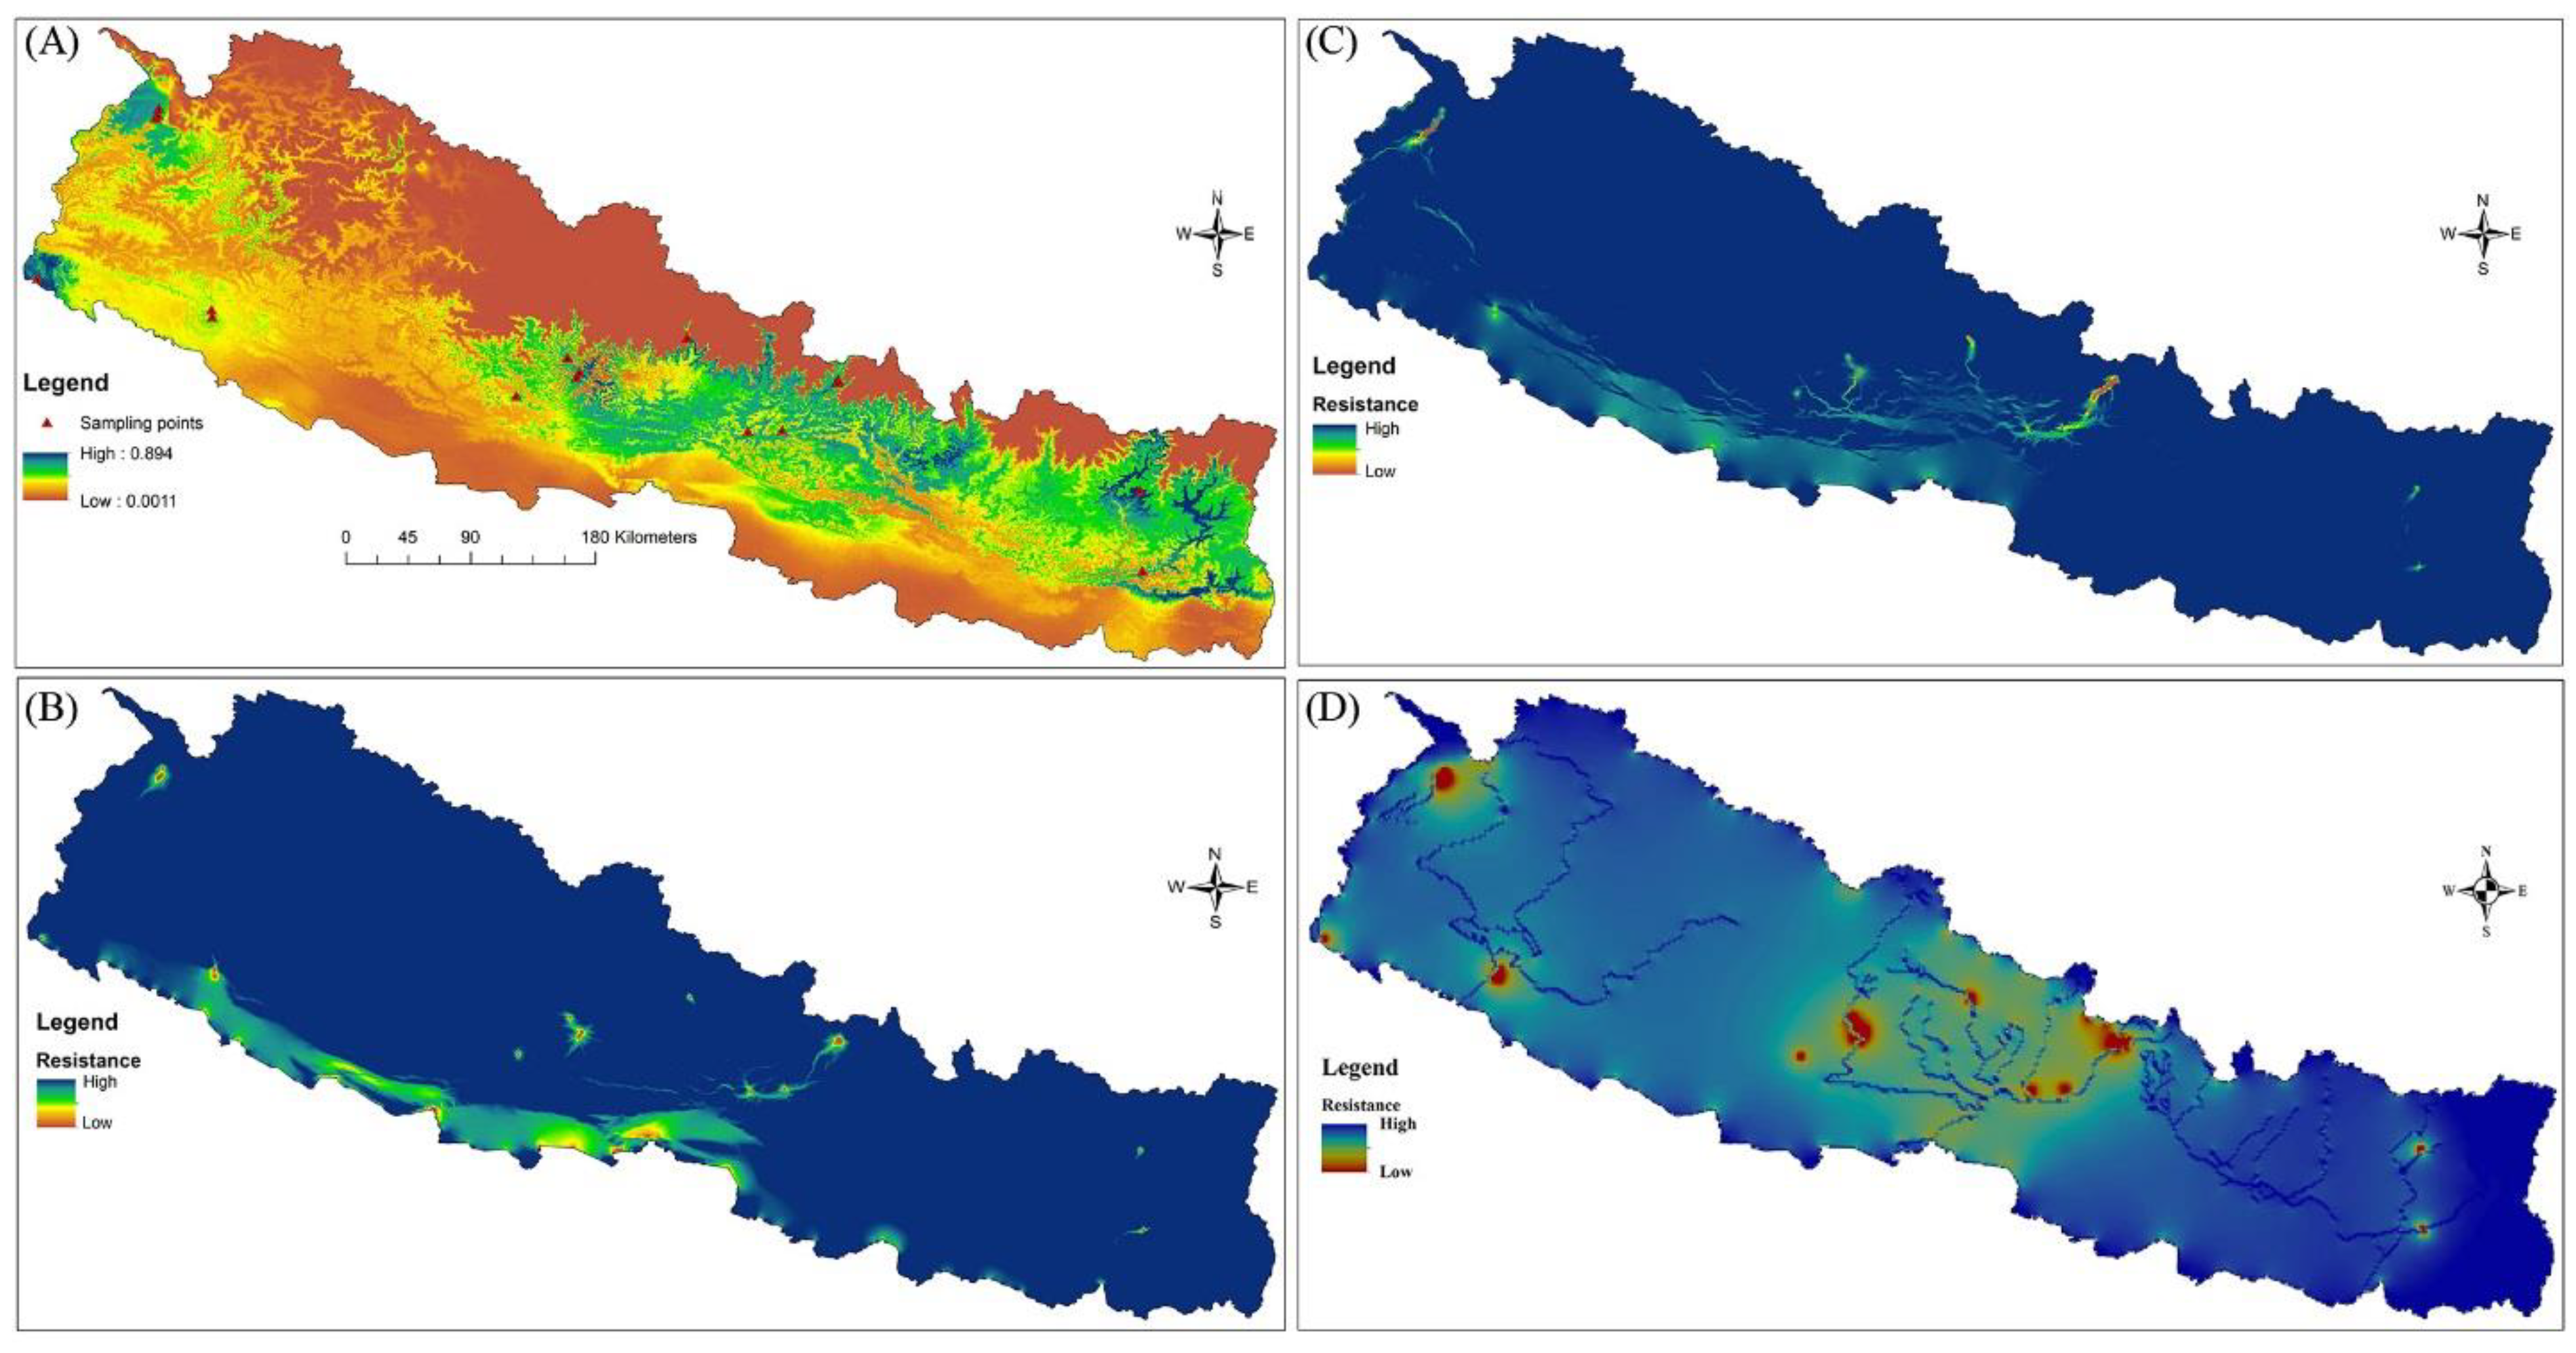
3.3. Isolation by Distance and Isolation by Resistance

The Mantel test identified a statistically significant positive correlation (Pearson’s ‘r’ = 0.562; p < 0.001) between the geographical distance and genetic distance, supporting the effect of geographical separation on genetic variation (i.e., the isolation by distance). The SDM resulted in a robust model (AUC = 0.93) and predicted suitable habitats for langurs in lower and middle elevations of Nepal (Figure 5A). Resistance distances based on current distribution of suitable langur habitats (r = 0.553, p < 0.001; Figure 5B) and rivers (r = 0.617, p < 0.001; Figure 5D) better explained the genetic structure than the elevation (r = 0.332, p < 0.001; Figure 5C).

4. Discussion

Given the wide range of distribution in the highly structured landscapes of the Nepal Himalaya, the Nepal Himalayan langur serves as a good model to test the effects of geographical heterogeneity on genetic diversity and population genetic structure. Further, being one of the least studied nonhuman primate species under extreme anthropogenic pressure, it is important for species population management and conservation to know its genetic diversity and structure. Therefore, we used mitochondrial cytochrome b (CYTB), control region (CR) and cytochrome c oxidase I (COI) sequences retrieved from non-invasively collected fecal samples of wild Himalayan langurs of Nepal and analyzed their genetic diversity and population genetic structure.
The results of this study indicate that the Himalayan langur population from the Nepal Himalaya bears low genetic diversity (Hd = 0.840 ± 0.024 and π = 0.0092 ± 0.0004) on COI gene sequences in comparison to the non-coding gene sequences, namely the hypervariable region 1 (HVR1) of the control region (Hd = 0.955 ± 0.015 and π = 0.0528 ± 0.0015) [6]. Similarly, the nucleotide diversity of the Nepal Himalayan langurs is much lower than that of control region sequences in other colobines [46,47,48]. Protein coding mitochondrial genes such as CYTB, COI, etc. have lower mutation rates, and differential mutation rate is a determinant of variation in mtDNA diversity [49,50]. Among the Nepal Himalayan langurs sampled, higher haplotype and nucleotide diversities were observed in the western region of Nepal, which might be explained by the wider geographical (Figure 1) and altitudinal (180–3798 m asl) distribution of the sampled troops. Out of the seven troops from the western region (Table 1), four troops from lower elevations belonged to the clade-W1 and the remaining three troops from above 2513 m asl fell within clade-W2. This illustrates the effects of altitudinal distribution in the genetic makeup of the Nepal Himalayan langurs, which was prominent in western Nepal but not in the central and eastern regions. In eastern Nepal, all of the seven sequences from the two different troops of the Arun River and Tamor River catchments were monomorphic, suggesting that they are recent descendants of a common ancestral troop.
Our results from the median-joining haplotype network as well as the inter-haplotypic phylogenetic analysis revealed five distinct clades (or subpopulations) of Nepal Himalayan langurs (E, C1, C2, W1 and W2). These clades correspond with the geographical distribution of the troops, and there is no haplotype sharing between any two sampling regions indicating that gene flow between the clades is not common. The Himalayan region has high variability in topography and climatic conditions that, when combined with large geographic distances, may explain the genetic differentiation of this population. Our results revealed that both the IBD and IBR have significant effects on genetic structure of the langurs. Such highly structured population genetics are common in many large mammals under the influence of various internal and external pressures. Among the internal causes, female philopatry in the Himalayan langurs [20] could have a strong impact in the genetic structuring because sex-biased dispersal influences gene flow and, consequently, the genetic configuration of populations [51]. A matrilocal society is known to result in significant genetic differentiation in maternally inherited genetic markers, and the strong genetic structure observed in our study population could be due to the use of matrilineally inherited mtDNA COI locus.
The results of inter-haplotypic analyses offer some insights concerning the influence of riverine barriers on gene flow among the Nepal Himalayan langur troops, as the boundaries of the four major clades coincided with the major rivers. The eastern clade (E) is demarcated from the clade-C1 by the Sunkoshi River. The Marshayngdi River, one of the major tributaries of the Gandaki River system, demarcates between the C1 and C2. The central clade-C2 and the western clade-W1 are separated by the Kaligandaki River. The western clades (W1 and W2) are separated from each other by the Karnali River. Such riverine barrier effects on genetic structure have been reported earlier for the Nepal Himalayan langurs using different markers [6], as well as for other primates [52,53,54]. The Mantel test results, assessing the isolation by resistance phenomenon and considering the rivers as resistance in dispersal of langurs, resulted in a strong and statistically significant positive association (r = 0.617, p < 0.001) between the pairwise riverine resistance and genetic distance among the troops. This illustrates the effects of Himalayan rivers in the genetic structuring of the langur populations. The rivers originating in the Himalaya have low temperatures due to snow/glacial melt, elevated headwaters, and strong currents due to their extreme elevational gradients [6]. As such, these rivers present formidable geographic barriers and may play a significant role in delineating the taxonomic boundaries among the species/subspecies of langurs. Therefore, taxonomic studies on the species should consider such barrier effects in the future.
The pairwise genetic distance (FST) values between sampling sites correlated with corresponding geographical distance supporting the IBD phenomenon. Additionally, the IBR analysis in CIRCUITSCAPE suggested that the genetic differentiation was due to lower conductance of the habitats for dispersal of langurs across the rivers, as the higher conductance grids were typically observed along the rivers. In concordance to the riverine barrier effect reported earlier [6], the conductance grids at the higher elevations were oriented in a north–south direction along the river axes (Figure 4). Conductance grids based on the suitable habitats were observed mostly on the lower elevations and were also oriented north–south along the river axes. Results revealed strong effects of spatial heterogeneity on genetic structuring of the Nepal population of Himalayan langurs. Similar spatial structuring of the population genetic assemblage has been observed in other colobines [48,55,56]. The heterogenous landscape and isolation of subpopulations by the Himalayan rivers might have contributed to the strong genetic structuring of langurs in the Nepal Himalaya.
The taxonomy of langurs in the Himalaya has remained inconclusive despite a recent phylogenetic study, based on a single mitochondrial gene sequence, that has classified all Himalayan populations into a single species [25]. The IUCN currently recognizes two species under the genus Semnopithecus in Nepal, viz. the Tarai Gray langur (S. hector) distributed throughout the juxta-Himalayan stretch [21] and the Nepal Gray Langur (S. schistaceus) found in the high Himalayan elevations [22]. Brandon-jones et al. [57] concluded the presence of the third species, S. ajax (formerly known as S. entellus ajax), in north-eastern Nepal, which was later described as S. schistaceus. DNA sequences have the potential to eliminate taxonomic challenges by analyzing polymorphism within taxonomically difficult populations and by identifying genetic subpopulations. Phylogeographical analysis of langurs in the Nepal Himalaya using mitochondrial control region and CYTB loci has revealed discrete genetic structures among populations isolated by the major rivers [6]. The present study, based on additional gene sequences, confirms the riverine barrier effects and further indicates that, except for the western population, the remaining langurs in Nepal do not seem to have a strong altitudinal pattern in their genetic structure. Two prominent phenomena, riverine barriers increasing resistance for dispersal and isolation by distance, are acting together in shaping the genetic structure of the Nepal Himalayan langurs. However, demarcating the taxonomic boundaries remains a challenge unless fine-scale sampling and multiple loci are incorporated in the analysis.
It should be acknowledged that these analyses were based solely on the mtDNA sequences of the Himalayan langur samples collected from Nepal. Owing to the higher mutation rates, use of appropriate microsatellite markers may have better elucidated the contemporary genetic sub-structuring in the population than by the mtDNA sequences. Additionally, it was not possible to sample the entire distribution range of the Nepal Himalayan langur with equal effort. Nevertheless, this analysis provides evidence for five possible forms/subpopulations of Nepal Himalayan langurs on the southern flank of central Himalaya. Additional sampling covering the Himalayan langurs’ entire distribution range along with the use of multiple mtDNA and nuclear loci are warranted to further clarify the genetic assemblage of this complex taxon.

5. Conclusions

The Himalayan langur population in the Nepal Himalaya has a moderate genetic diversity on mitochondrial gene segments. The species has highly structured population genetics corresponding to fragmented spatial distribution. The effects of topographic variations on genetic structure is governed by the isolation by distance (IBD) phenomena as well as that of the isolation by the resistance (IBR). The incorporation of landscape features in the genetic analysis has significantly improved our understanding of the phylogeography and landscape genetic structure of langurs in the Nepal Himalaya. The strong population genetic structure and deep mtDNA divergence warrants a detailed taxonomic assessment of the Himalayan langurs across their entire range.

Author Contributions

Conceptualization, L.K. and X.-L.J.; methodology, L.K. and M.K.C.; software, L.K. and R.C.K.; formal analysis, L.K.; resources, X.-L.J.; writing—original draft preparation, L.K.; writing—review and editing, X.-L.J. and R.C.K.; supervision, M.K.C. and X.-L.J.; funding acquisition, X.-L.J. and R.C.K. All authors have read and agreed to the published version of the manuscript.

Funding

This research was funded by the Second Tibetan Plateau Scientific Expedition and Research Program (STEP, no. 2019QZKK0501), China. The first author (LK) was supported by the Chinese Academy of Sciences–The World Academy of Sciences (CAS-TWAS) President’s PhD Fellowship program. RCK’s effort was supported in part by the Office of Research Infrastructure Programs (ORIP) of the National Institutes of Health through grant number P51OD010425 to the Washington National Primate Research Center, USA.

Institutional Review Board Statement

Not applicable.

Data Availability Statement

The DNA sequences generated during this study have been deposited in the NCBI GenBank, and respective accession numbers have been provided in the paper.

Acknowledgments

We thank the Department of National Parks and wildlife Conservation (072/73ECO20-483), the Department of Forest and Soil Conservation (2072/073-943), and the government of Nepal for research permission, and Shivish Bhandari, Dhirendra B. Chand, Sunil Khatiwada and Naresh Pandey for their support with the fieldwork.

Conflicts of Interest

The authors declare no conflict of interest. The funders had no role in the design of the study; in the collection, analyses, or interpretation of data; in the writing of the manuscript; or in the decision to publish the results.

References

  1. Shrestha, U.B.; Gautam, S.; Bawa, K.S. Widespread climate change in the Himalayas and associated changes in local ecosystems. PLoS ONE 2012, 7, e36741. [Google Scholar] [CrossRef] [Green Version]
  2. Owen, L.A.; Caffee, M.W.; Finkel, R.C.; Seong, Y.B. Quaternary glaciation of the Himalayan-Tibetan orogen. J. Quat. Sci. 2008, 23, 513–531. [Google Scholar] [CrossRef] [Green Version]
  3. Pisano, J.; Condamine, F.L.; Lebedev, V.; Bannikova, A.; Quéré, J.-P.; Shenbrot, G.I.; Pagès, M.; Michaux, J.R.; Riddle, B. Out of Himalaya: The impact of past Asian environmental changes on the evolutionary and biogeographical history of Dipodoidea (Rodentia). J. Biogeogr. 2015, 42, 856–870. [Google Scholar] [CrossRef]
  4. Pandit, M.K.; Manish, K.; Koh, L.P. Dancing on the Roof of the World: Ecological Transformation of the Himalayan Landscape. Bioscience 2014, 64, 980–992. [Google Scholar] [CrossRef] [Green Version]
  5. Jackson, N.D.; Fahrig, L. Habitat amount, not habitat configuration, best predicts population genetic structure in fragmented landscapes. Landsc. Ecol. 2015, 31, 951–968. [Google Scholar] [CrossRef]
  6. Khanal, L.; Chalise, M.K.; Wan, T.; Jiang, X.L. Riverine barrier effects on population genetic structure of the Hanuman langur (Semnopithecus entellus) in the Nepal Himalaya. BMC Evol. Biol. 2018, 18, 159. [Google Scholar] [CrossRef] [PubMed]
  7. Manel, S.; Schwarts, M.K.; Luikart, G.; Taberlet, P. Landscape genetics: Combining landscape ecology and population genetics. Trends Ecol. Evol. 2003, 18, 189–197. [Google Scholar] [CrossRef]
  8. Smouse, P.E.; Peakall, R. Spatial autocorrelation analysis of individual multiallele and multilocus genetic structure. Heredity 1999, 82, 561–573. [Google Scholar] [CrossRef] [PubMed] [Green Version]
  9. Khanal, L.; Chalise, M.K.; Jiang, X. Ecological niche modelling of Himalayan Langur (Semnopithecus entellus) in southern flank of the Himalaya. J. Inst. Sci. Technol. 2018, 23, 1–9. [Google Scholar] [CrossRef]
  10. Bishop, N.H. Himalayan langurs: Temperate colobines. J. Hum. Evol. 1979, 8, 251–281. [Google Scholar] [CrossRef]
  11. Curtin, R.A. Range use of gray langurs in highland Nepal. Folia Primatol. 1982, 38, 1–18. [Google Scholar] [CrossRef] [PubMed]
  12. Borries, C.; Sommer, V.; Srivastava, A. Dominance, age, and reproductive success in free-ranging female Hanuman langurs (Presbytis entellus). Int. J. Primatol. 1991, 12, 231–257. [Google Scholar] [CrossRef]
  13. Ostner, J.; Chalise, M.K.; Koenig, A.; Launhardt, K.; Nikolei, J.; Podzuweit, D.; Borries, C. What Hanuman langur males know about female reproductive status. Am. J. Primatol. 2006, 68, 701–712. [Google Scholar] [CrossRef] [PubMed]
  14. Borries, C.; Perlman, R.F.; Koenig, A. Characteristics of alpha males in Nepal gray langurs. Am. J. Primatol. 2017, 79, e22437. [Google Scholar] [CrossRef]
  15. Perlman, R.F.; Borries, C.; Koenig, A. Dominance relationships in male Nepal gray langurs (Semnopithecus schistaceus). Am. J. Phys. Anthropol. 2016, 160, 208–219. [Google Scholar] [CrossRef] [PubMed]
  16. Chalise, M.K. Fragmented primate population of Nepal. In Primates in Fragments: Complexity and Resilience; Marsh, L.K., Chapman, C.A., Eds.; Springer Science+Business Media: New York, NY, USA, 2013; pp. 329–356. [Google Scholar] [CrossRef]
  17. Ale, P.B.; Kandel, K.; Ghimire, T.R.; Huettmann, F.; Regmi, G.R. Persistent evidence for a dramatic decline in langurs (Semnopithecus spp.) in Nepal and elsewhere: Science data and personal experiences converge on a landscape-scale. In Hindu Kush-Himalaya Watersheds Downhill: Landscape Ecology and Conservation Perspectives; Regmi, G.R., Huettmann, F., Eds.; Springer Nature: Cham, Switzerland, 2020; pp. 663–676. [Google Scholar]
  18. Bagaria, P.; Sharma, L.K.; Joshi, B.D.; Kumar, H.; Mukherjee, T.; Thakur, M.; Chandra, K. West to east shift in range predicted for Himalayan Langur in climate change scenario. Glob. Ecol. Conserv. 2020, 22, e00926. [Google Scholar] [CrossRef]
  19. Di Fiore, A. Molecular genetic approaches to the study of primate behavior, social organization, and reproduction. Am. J. Phys. Anthropol. 2003, 122, 62–99. [Google Scholar] [CrossRef]
  20. Chalise, M.K.; Karki, J.B.; Ghimire, M.K. Status in Nepal: Non-human primates. In Special Issue on the Occasion of 10th Wildlife Week, 2062; Department of National Parks & Wildlife Conservation: Kathmandu, Nepal, 2005; pp. 19–26. [Google Scholar]
  21. Singh, M.; Kumar, A.; Kumara, H.N.; Ahuja, V. Semnopithecus hector. The IUCN Red List of Threatened Species 2020: E.T39837A17942651. Available online: https://www.iucnredlist.org/species/39837/17942651 (accessed on 18 August 2021).
  22. Singh, M.; Kumara, H.N.; Long, Y.; Chetry, D.; Kumar, A. Semnopithecus schistaceus. The IUCN Red List of Threatened Species 2020: E.T39840A17942792. Available online: https://www.iucnredlist.org/species/39840/17942792 (accessed on 18 August 2021).
  23. Kumar, A.; Singh, M.; Anandam, M.; Ahuja, V.; Kumara, H.N.; Molur, S. Semnopithecus ajax. The IUCN Red List of Threatened Species 2020: E.T39833A17943210. Available online: https://www.iucnredlist.org/species/39833/17943210 (accessed on 3 October 2021).
  24. Wang, X.P.; Yu, L.; Roos, C.; Ting, N.; Chen, C.P.; Wang, J.; Zhang, Y.P. Phylogenetic Relationships among the Colobine Monkeys Revisited: New Insights from Analyses of Complete mt Genomes and 44 Nuclear Non-Coding Markers. PLoS ONE 2012, 7, e36274. [Google Scholar] [CrossRef] [Green Version]
  25. Arekar, K.; Sathyakumar, S.; Karanth, K.P. Integrative taxonomy confirms the species status of the Himalayan langurs, Semnopithecus schistaceus Hodgson, 1840. J. Zool. Syst. Evol. Res. 2020, 59, 543–556. [Google Scholar] [CrossRef]
  26. Sharma, C.K. Physiography. In Nepal- Nature’s Paradise; Majupuria, T.C., Majupiria, R.K., Eds.; Hari Devi: Gwalior, India, 1999; pp. 4–8. [Google Scholar]
  27. Carson, B.; Shah, P.B.; Maharjan, P.B. Land Systems Report—The Soil Landscapes of Nepal; Kenting Earth Sciences Limited: Kathmandu, Nepal, 1986; p. 140. [Google Scholar]
  28. Asahi, K. Equilibrium-line altitudes of the present and Last Glacial Maximum in the eastern Nepal Himalayas and their implications for SW monsoon climate. Quat. Int. 2010, 212, 26–34. [Google Scholar] [CrossRef]
  29. White, P.S.; Densmore, L.D., III. Mitochondrial DNA Isolation; Oxford University Press: Oxford, UK, 1992; pp. 29–58. [Google Scholar]
  30. Thompson, J.D.; Higgins, D.G.; Gibson, T.J. CLUSTAL W: Improving the sensitivity of progressive multiple sequence alignment through sequence weighting, position-specific gap penalties and weight matrix choice. Nucleic Acids Res. 1994, 22, 4673–4680. [Google Scholar] [CrossRef] [PubMed] [Green Version]
  31. Kumar, S.; Stecher, G.; Li, M.; Knyaz, C.; Tamura, K. MEGA X: Molecular Evolutionary Genetics Analysis across computing platforms. Mol. Biol. Evol. 2018, 35, 1547–1549. [Google Scholar] [CrossRef] [PubMed]
  32. Rozas, J.; Ferrer-Mata, A.; Sanchez-DelBarrio, J.C.; Guirao-Rico, S.; Librado, P.; Ramos-Onsins, S.E.; Sanchez-Gracia, A. DnaSP 6: DNA Sequence Polymorphism Analysis of Large Data Sets. Mol. Biol. Evol. 2017, 34, 3299–3302. [Google Scholar] [CrossRef] [PubMed]
  33. Leigh, J.W.; Bryant, D.; Nakagawa, S. Popart: Full-feature software for haplotype network construction. Methods Ecol. Evol. 2015, 6, 1110–1116. [Google Scholar] [CrossRef]
  34. Stamatakis, A. RAxML version 8: A tool for phylogenetic analysis and post-analysis of large phylogenies. Bioinformatics 2014, 30, 1312–1313. [Google Scholar] [CrossRef]
  35. Lanfear, R.; Calcott, B.; Ho, S.Y.; Guindon, S. Partitionfinder: Combined selection of partitioning schemes and substitution models for phylogenetic analyses. Mol. Biol. Evol. 2012, 29, 1695–1701. [Google Scholar] [CrossRef] [Green Version]
  36. Rambaut, A. FigTree v1.4.3. Available online: http://tree.bio.ed.ac.uk/software/figtree/ (accessed on 15 April 2019).
  37. Excoffier, L.; Lischer, H.E. Arlequin suite version 3.5: A New series of programs to perform population genetics analyses under Linux and Windows. Mol. Ecol. Resour. 2010, 10, 564–567. [Google Scholar] [CrossRef]
  38. Mantel, N. The detection of disease clustering and a generalized regression approach. Cancer Res. 1967, 27, 209–220. [Google Scholar]
  39. Ersts, P.J.; Geographic Distance Matrix Generator (v.1.2.3). American Museum of Natural History, Center for Biodiversity and Conservation. Available online: http://biodiversityinformatics.amnh.org/open_source/gdmg (accessed on 15 June 2020).
  40. Motulsky, H.J. Analyzing Data with GraphPad Prism; GraphPad Software Inc.: San Diego, CA, USA, 1999. [Google Scholar]
  41. Hijmans, R.J.; Cameron, S.E.; Parra, J.L.; Jones, P.G.; Jarvis, A. Very high resolution interpolated climate surfaces for global land areas. Int. J. Climatol. 2005, 25, 1965–1978. [Google Scholar] [CrossRef]
  42. Phillips, S.J.; Dudık, M. Modeling of species distributions with Maxent: New extensions and a comprehensive evaluation. Ecography 2008, 31, 161–175. [Google Scholar] [CrossRef]
  43. Adams, R.V.; Lazerte, S.E.; Otter, K.A.; Burg, T.M. Influence of landscape features on the microgeographic genetic structure of a resident songbird. Heredity 2016, 117, 63–72. [Google Scholar] [CrossRef] [PubMed] [Green Version]
  44. McRae, B.H.; Beier, P. Circuit theory predicts gene flow in plant and animal populations. Proc. Natl. Acad. Sci. USA 2007, 104, 19885–19890. [Google Scholar] [CrossRef] [Green Version]
  45. McRae, B.; Shah, V.; Mohapatra, T.T. Circuitscape 4 User Guide. 2011. Available online: http://www.circuitscape.org (accessed on 8 September 2021).
  46. Ram, M.S.; Kittur, S.M.; Biswas, J.; Nag, S.; Shil, J.; Umapathy, G. Genetic diversity and structure among isolated populations of the endangered Gees Golden Langur in Assam, India. PLoS ONE 2016, 11, e0161866. [Google Scholar] [CrossRef]
  47. Wang, W.; Qiao, Y.; Pan, W.; Yao, M. Low genetic diversity and strong geographical structure of the critically endangered White-Headed Langur (Trachypithecus leucocephalus) inferred from mitochondrial DNA control region sequences. PLoS ONE 2015, 10, e0129782. [Google Scholar] [CrossRef] [Green Version]
  48. Yang, M.; Yang, Y.; Cui, D.; Fickenscher, G.; Zinner, D.; Roos, C.; Brameier, M. Population genetic structure of Guizhou snub-nosed monkeys (Rhinopithecus brelichi) as inferred from mitochondrial control region sequences, and comparison with R. roxellana and R. bieti. Am. J. Phys. Anthropol. 2012, 147, 1–10. [Google Scholar] [CrossRef] [PubMed]
  49. Nabholz, B.; Glemin, S.; Galtier, N. The erratic mitochondrial clock: Variations of mutation rate, not population size, affect mtDNA diversity across birds and mammals. BMC Evol. Biol. 2009, 9, 54. [Google Scholar] [CrossRef] [Green Version]
  50. Pesole, G.; Gissi, C.; Chirico, A.D.; Saccone, C. Nucleotide substitution rate of Mammalian mitochondrial genomes. J. Mol. Evol. 1999, 48, 427–434. [Google Scholar] [CrossRef] [PubMed]
  51. Guschanski, K.; Caillaud, D.; Robbins, M.M.; Vigilant, L. Females shape the genetic structure of a gorilla population. Curr. Biol. 2008, 18, 1809–1814. [Google Scholar] [CrossRef] [Green Version]
  52. Kawamoto, Y.; Takemoto, H.; Higuchi, S.; Sakamaki, T.; Hart, J.A.; Hart, T.B.; Tokuyama, N.; Reinartz, G.E.; Guislain, P.; Dupain, J.; et al. Genetic structure of wild bonobo populations: Diversity of mitochondrial DNA and geographical distribution. PLoS ONE 2013, 8, e59660. [Google Scholar] [CrossRef] [PubMed] [Green Version]
  53. Boubli, J.P.; Ribas, C.; Lynch Alfaro, J.W.; Alfaro, M.E.; da Silva, M.N.; Pinho, G.M.; Farias, I.P. Spatial and temporal patterns of diversification on the Amazon: A test of the riverine hypothesis for all diurnal primates of Rio Negro and Rio Branco in Brazil. Mol. Phylogen. Evol. 2015, 82, 400–412. [Google Scholar] [CrossRef]
  54. Merces, M.P.; Lynch Alfaro, J.W.; Ferreira, W.A.; Harada, M.L.; Silva Junior, J.S. Morphology and mitochondrial phylogenetics reveal that the Amazon River separates two eastern squirrel monkey species: Saimiri sciureus and S. collinsi. Mol. Phylogen. Evol. 2015, 82, 426–435. [Google Scholar] [CrossRef] [PubMed]
  55. Liu, Z.; Ren, B.; Wu, R.; Zhao, L.; Hao, Y.; Wang, B.; Wei, F.; Long, Y.; Li, M. The effect of landscape features on population genetic structure in Yunnan snub-nosed monkeys (Rhinopithecus bieti) implies an anthropogenic genetic discontinuity. Mol. Ecol. 2009, 18, 3831–3846. [Google Scholar] [CrossRef] [PubMed]
  56. Wang, W.; Yao, M. Fine-scale genetic structure analyses reveal dispersal patterns in a critically endangered primate, Trachypithecus leucocephalus. Am. J. Primatol. 2017, 79, e22635. [Google Scholar] [CrossRef] [PubMed]
  57. Brandon-Jones, D. A taxonmic revision of the langurs and leaf monkeys (Primates: Colobinae) of South Asia. Zoos’ Print J. 2004, 19, 1552–1594. [Google Scholar] [CrossRef]
Figure 1. Himalayan langurs from different elevations in Nepal. (A) Adult female from the lowland Terai (283 m asl) (photo by Laxman Khanal). (B) Adult male from the mid-hill zone (865 m asl) (photo by Mukesh K. Chalise). (C) Adult male from the mountain region (3200 m asl) (photo by Randall C. Kyes).
Diversity 14 00069 g001
Figure 2. Map showing major rivers, elevational gradients and sampling sites of the Nepal Himalayan langurs.
Diversity 14 00069 g002
Figure 3. The median joining haplotype network showing mutational relationships among the Nepal Himalayan langur haplotypes. Areas of the circles are proportional to the observed frequency of each haplotype; the black-filled circles are the inferred intermediate haplotypes not sampled in this study; each vertical dash on the lines connecting two haplotypes represents one mutational step.
Diversity 14 00069 g003
Figure 4. ML tree depicting phylogenetic relationship among 35 haplotypes defined by CYTB + COI + CR (2904 bp) sequences of the Nepal Himalayan langurs.
Diversity 14 00069 g004
Figure 5. Test of isolation by resistance (IBR) for Himalayan langurs in Nepal. (A) Species distribution model showing a suitable habitat for Himalayan langurs. (B) Resistance grid output for the resistance surface of a suitable habitat. (C) Resistance grid output for the resistance surface of elevation. (D) Resistance grid output for the resistance surface of rivers.
Diversity 14 00069 g005
Table 1. Sampling sites of the Nepal Himalayan langurs, troop size and number of fecal samples collected.
RegionAreaLatitude (N) Longitude (E)ASL (m)Troop Size# Samples# Sequences
EasternMulghat26°56′07.21″87°19′56.14″2802463
Tamku27°27′34.64″ 87°18′58.79″ 5562354
CentralRishing28°10′21.28″85°21′01.94″ 19503965
Khanjim28°10′05.63″ 85°21′40.75″ 25082442
Syafrubeshi28°09′35.82″ 85°20′53.77″ 1477932
Khalte27°51′03.80″ 84°59′29.30″ 6892464
Baseri27°50′28.15″84°45′59.61″3821931
Saattale28°27′05.73″84°22′33.25″15333241
Kushma28°13′37.42″83°40′26.34″8771454
Dhairing28°13′19.53″83°35′43.53″1080732
Balewa28°11′30.56″83°39′07.74″6852183
WesternReshunga28°04′24.54″83°15′42.14″17481331
Banke *28°35′09.47″81°17′06.51″2251220 *
Chisapani28°37′59.05″81°16′57.72″2122532
Suklaphanta NP28°50′09.90″80°09′02.28″1801155
Okhreni29°52′43.80″80°54′58.60″25132494
Dhaumula29°53′48.90″80°56′11.12″33281244
Dhaulo Odhar29°56′41.06″80°56′27.78″37982185
Total3548752
* Could not obtain all three gene sequences from either of the samples belonging to the troop.
Table 2. Genetic diversity on COI (676 bp) and CYTB + COI + CR (2904 bp) sequences of the Nepal Himalayan langur population.
LociRegionEasternCentralWestern
Number of Sequences (Troops)7 (2)24 (9)21 (6)
COIPS (PI sites)0 (0)5 (2)10 (8)
#H146
HD ± SD0.0000.587 ± 0.0640.600 ± 0.101
π ± SD0.0000.0019 ± 0.00100.0030 ± 0.0018
COI + CR + CYTBPS (PI sites)6 (3)92 (49)92 (80)
H6 (Hap1–Hap6)20 (Hap7–Hap26)9 (Hap27–Hap35)
HD ± SD0.952 ± 0.0960.982 ± 0.0180.781 ± 0.07
π ± SD0.00085 ± 0.000010.0085 ± 0.00280.0090 ± 0.0030
Note: PS: polymorphic sites; PI Sites: parsimony informative sites; #Hap: number of haplotypes; Hd: haplotype diversity; π: nucleotide diversity.
Publisher’s Note: MDPI stays neutral with regard to jurisdictional claims in published maps and institutional affiliations.

