
Is It Function or Fashion? An Integrative Analysis of Morphology, Performance, and Metabolism in a Colour Polymorphic Lizard

 ,
,
Abstract
:1. Introduction
2. Materials and Methods
2.1. Sampling
2.2. Morphological Variables
2.3. Performance Traits
2.4. Potential Metabolic Activity (PMA) and Catalase Activity (CAT)
2.5. Statistical Analyses
3. Results
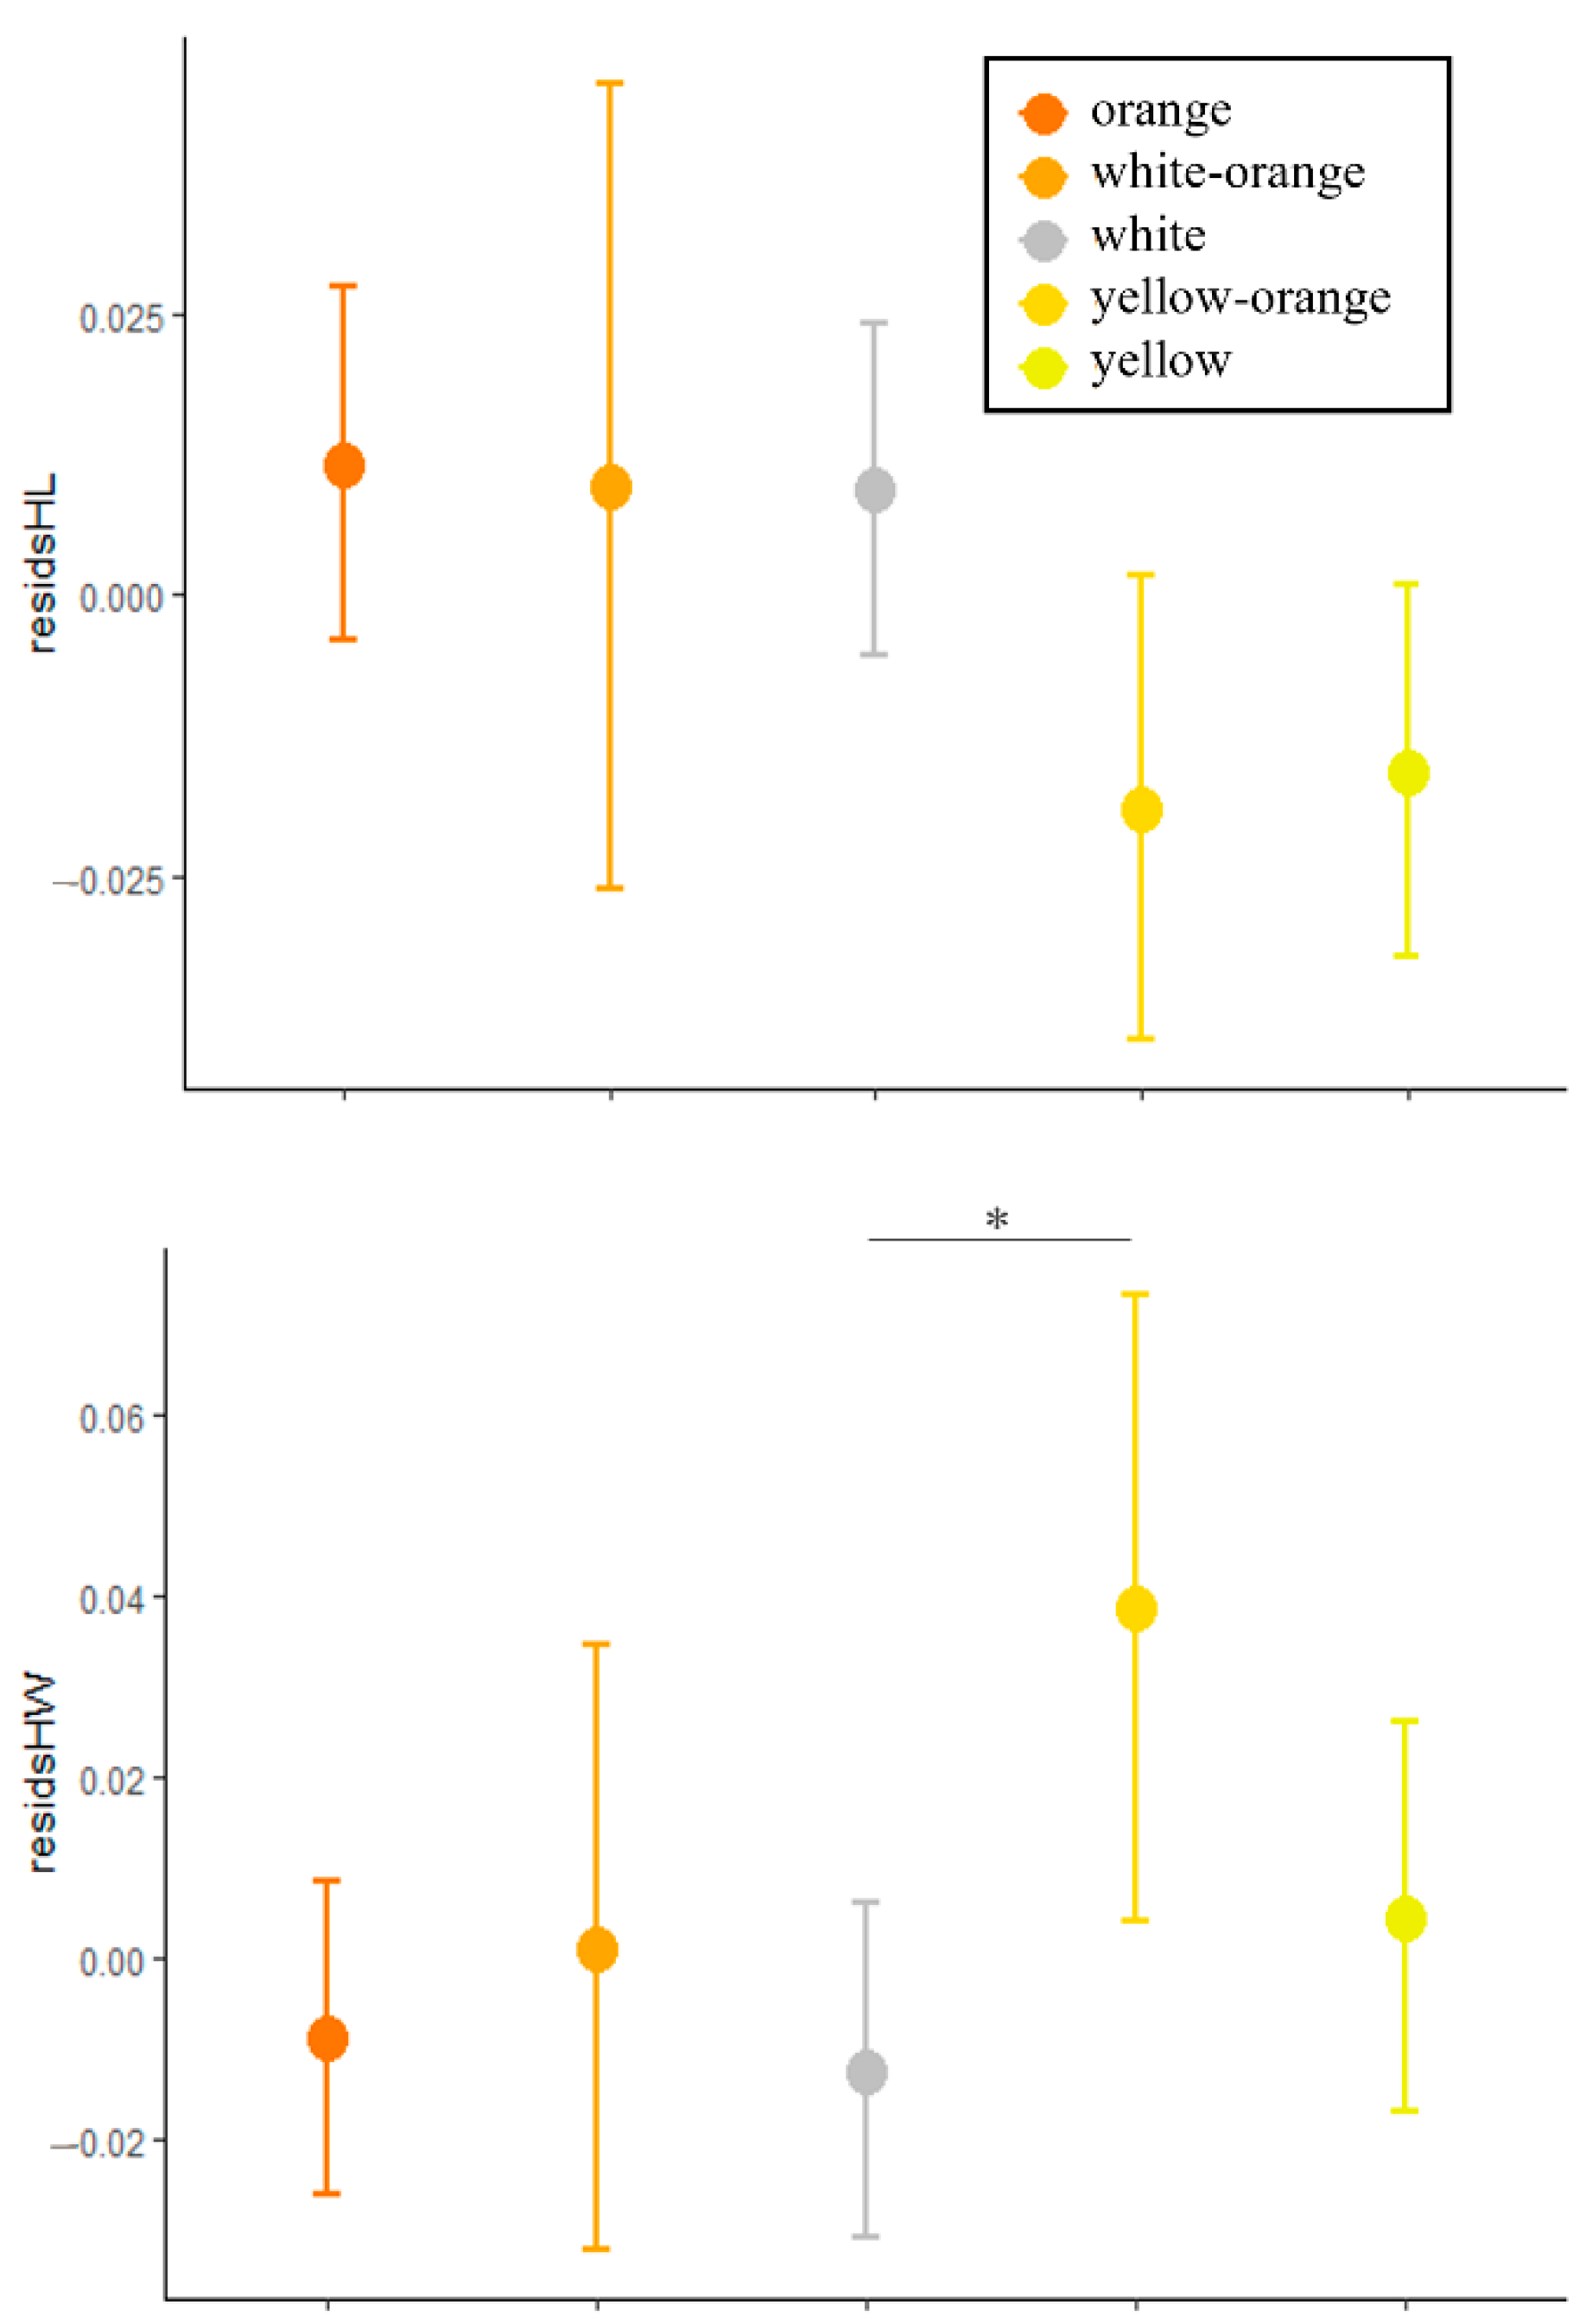
3.1. Morphology
3.2. Performance Traits
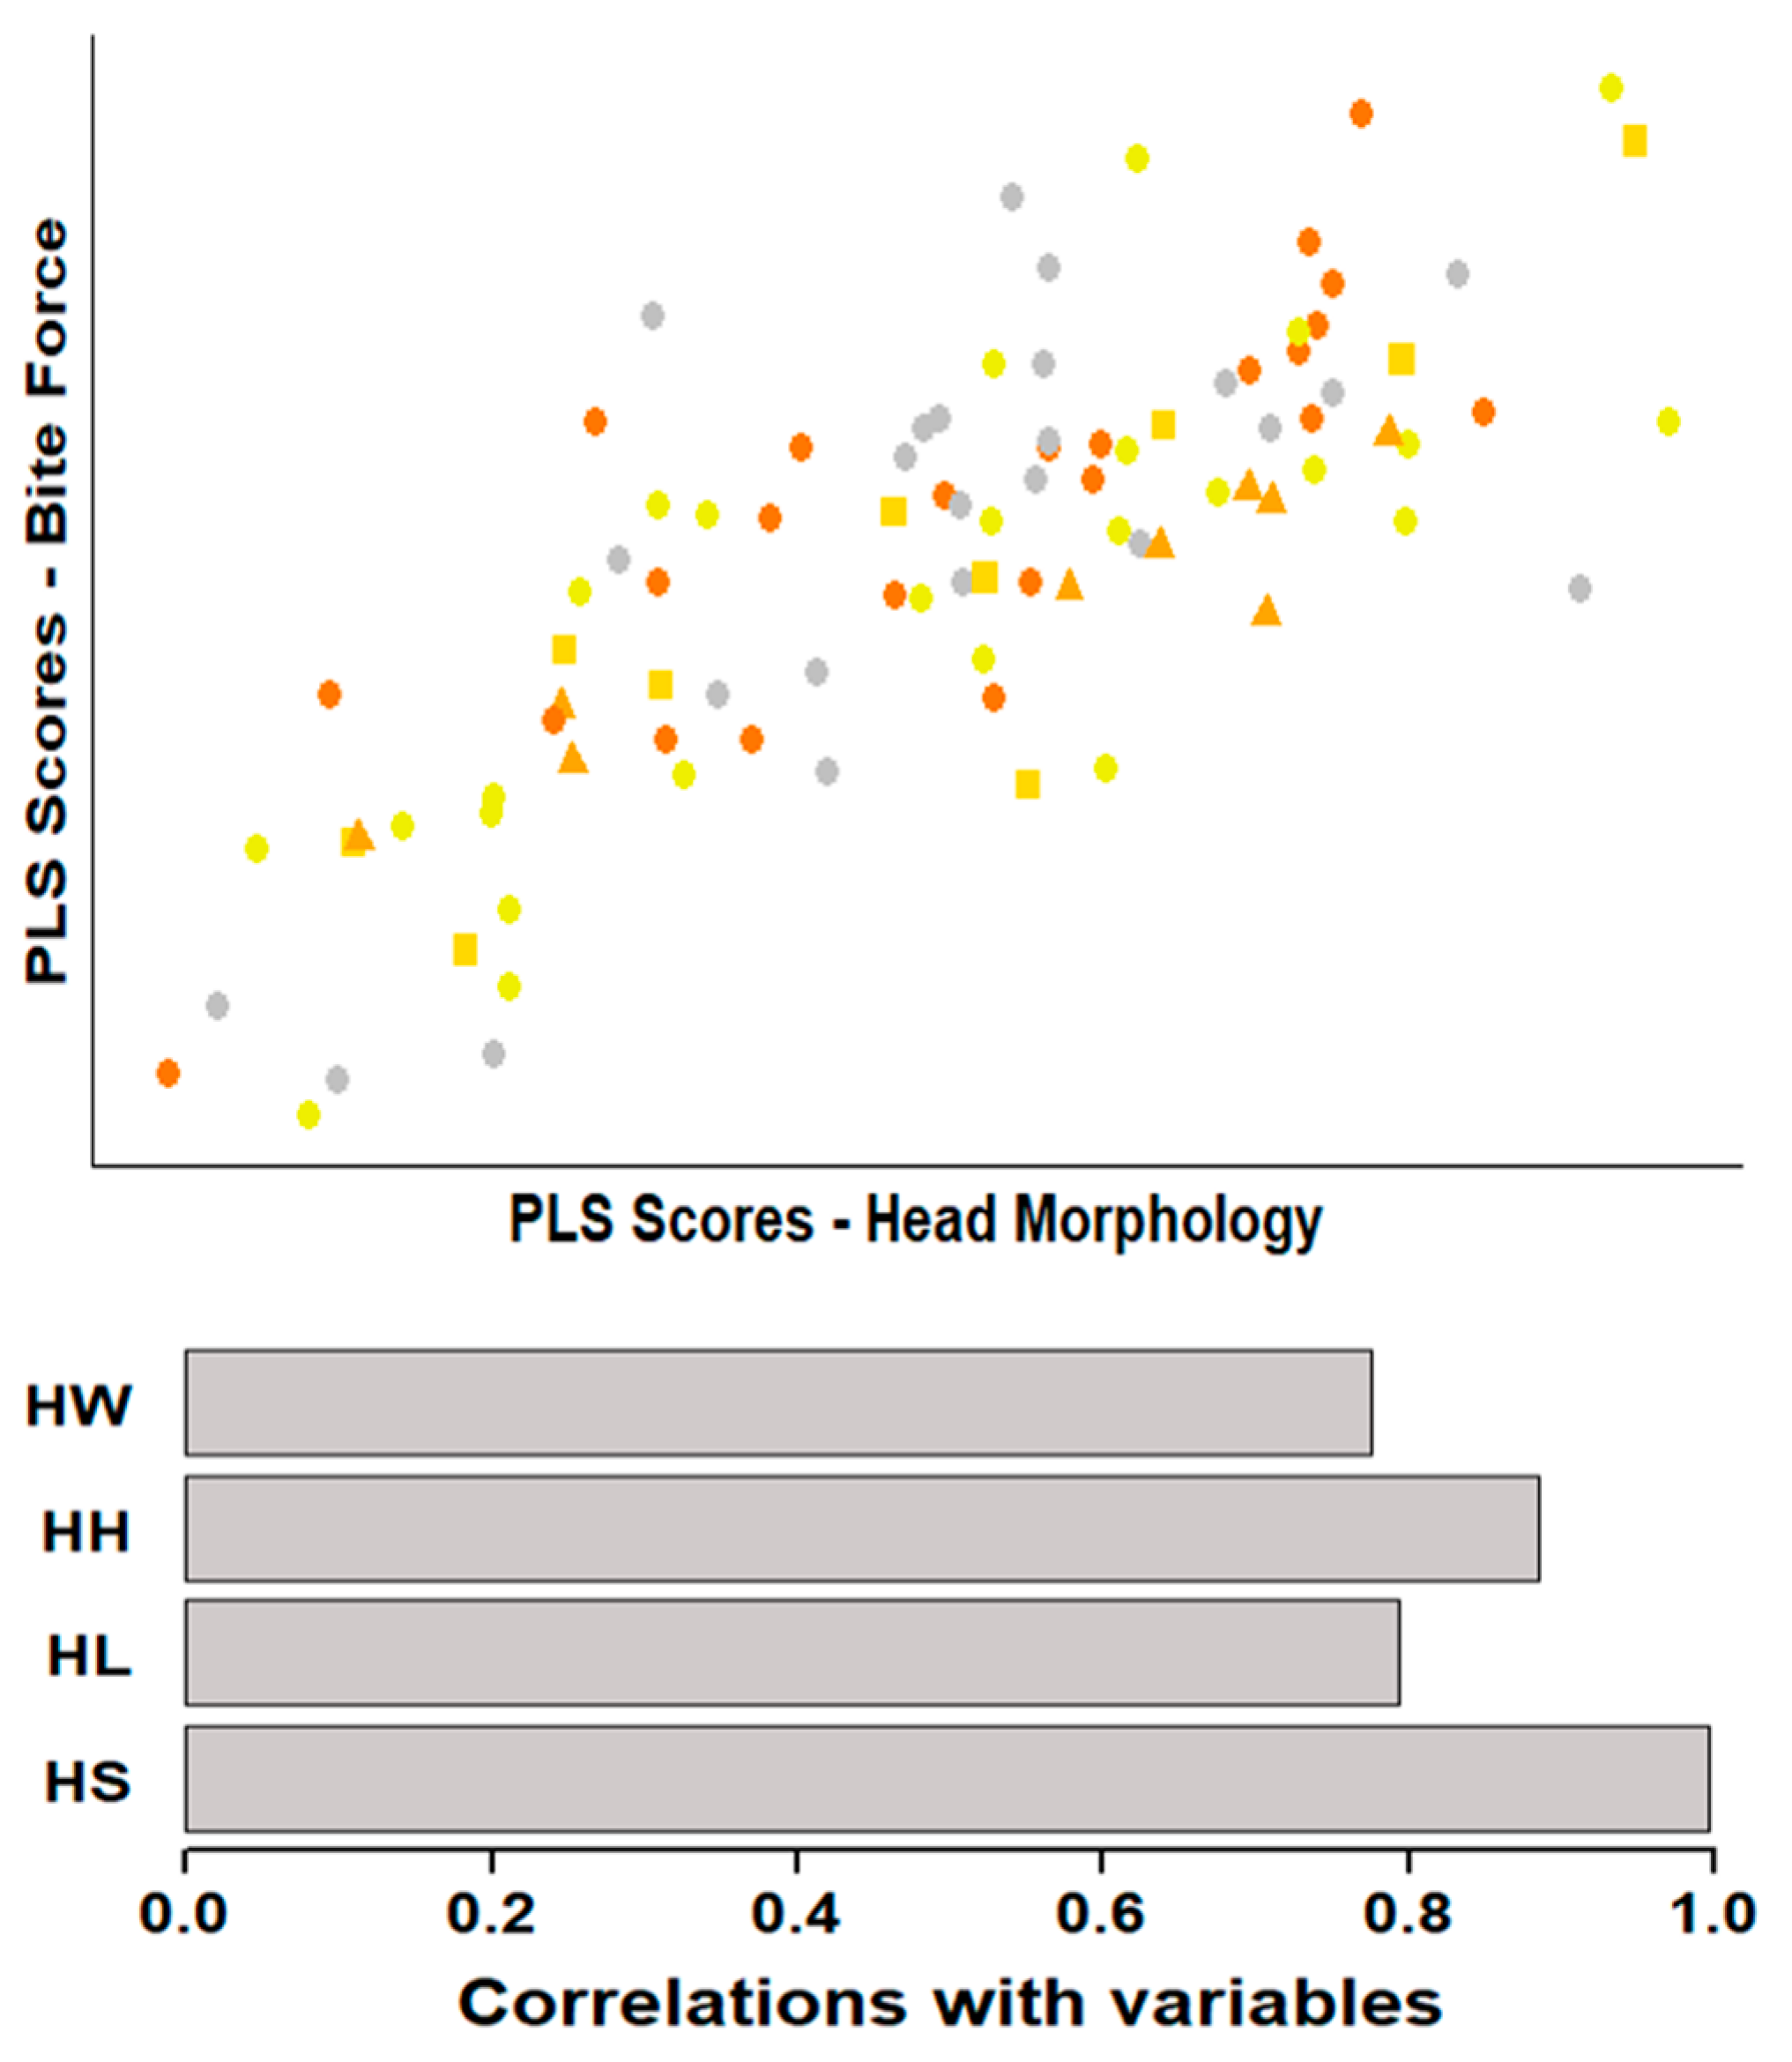
3.3. Associations between Morphology and Performance
3.4. Metabolism and Antioxidant Capacity
3.5. Associations between Physiology and Morphology or Performance
4. Discussion
Author Contributions
Funding
Institutional Review Board Statement
Data Availability Statement
Acknowledgments
Conflicts of Interest
Appendix A

Appendix B

| 1st Block | 2nd Block | |
|---|---|---|
| BITE:morphology | BITE | HW, HH, HL, HS |
| SPRINT morphology | SPRINT | FLL, HLL, TRL, SVL |
| CLIMB:morphology | CLIMB | FLL, HLL, TRL, SVL |
| MANO:morphology | MANO | FLL, HLL, TRL, SVL |
| PMA26:morphology | PMA26 | TRL, SVL, HS |
| PMA31:morphology | PMA31 | TRL, SVL, HS |
| PMA36:morphology | PMA36 | TRL, SVL, HS |
| CAT:morphology | CAT | TRL, SVL, HS |
| PMA26:performance | PMA26 | BITE, SPRINT, CLIMB, MANO |
| PMA31:performance | PMA31 | BITE, SPRINT, CLIMB, MANO |
| PMA36:performance | PMA36 | BITE, SPRINT, CLIMB, MANO |
| CAT:performance | CAT | BITE, SPRINT, CLIMB, MANO |
Appendix C
| 1st Block | 2nd Block | |||||||||||||
|---|---|---|---|---|---|---|---|---|---|---|---|---|---|---|
| HW | HH | HL | HS | SVL | TRL | FLL | HLL | BITE | SPR | CLI | MAN | r(PLS) | p | |
| BITE | 0.775 | 0.885 | 0.793 | 0.997 | 0.772 | 0.001 | ||||||||
| SPRINT | 0.837 | 0.691 | 0.832 | 0.784 | 0.228 | 0.129 | ||||||||
| CLIMB | 0.795 | 0.544 | 0.894 | 0.813 | 0.266 | 0.043 | ||||||||
| MANO | 0.808 | 0.784 | 0.542 | 0.866 | 0.135 | 0.602 | ||||||||
| PMA26 | 0.353 | 0.85 | 0.607 | 0.152 | 0.362 | |||||||||
| PMA31 | 0.692 | 0.924 | 0.876 | 0.52 | 0.944 | |||||||||
| PMA36 | 0.821 | 0.931 | 0.867 | 0.046 | 0.952 | |||||||||
| CAT | 0.886 | 0.899 | 0.855 | 0.141 | 0.432 | |||||||||
| PMA26 | 0.657 | 0.589 | 0.681 | 0.683 | 0.205 | 0.434 | ||||||||
| PMA31 | 0.758 | 0.598 | 0.709 | 0.458 | 0.174 | 0.57 | ||||||||
| PMA36 | 0.541 | 0.781 | 0.75 | 0.59 | 0.194 | 0.471 | ||||||||
| CAT | −0.775 | −0.486 | 0.137 | 0.178 | 0.186 | 0.497 | ||||||||
| 1st Block | 2nd Block | |||||||||||||
|---|---|---|---|---|---|---|---|---|---|---|---|---|---|---|
| HW | HH | HL | HS | SVL | TRL | FLL | HLL | BITE | SPR | CLI | MAN | r(PLS) | p | |
| BITE | 0.83 | 0.660 | 0.767 | 0.996 | 0.81 | 0.001 | ||||||||
| SPRINT | 0.414 | 0.108 | 0.955 | 0.839 | 0.41 | 0.200 | ||||||||
| CLIMB | 0.923 | 0.900 | 0.351 | 0.681 | 0.32 | 0.448 | ||||||||
| MANO | 0.458 | 0.196 | 0.995 | 0.754 | 0.34 | 0.430 | ||||||||
| PMA26 | 0.924 | 0.941 | 0.910 | 0.28 | 0.346 | |||||||||
| PMA31 | 0.728 | 0.925 | 0.945 | 0.13 | 0.875 | |||||||||
| PMA36 | 0.898 | 0.950 | 0.922 | 0.16 | 0.765 | |||||||||
| CAT | 0.919 | 0.950 | 0.906 | 0.20 | 0.648 | |||||||||
| PMA26 | 0.704 | 0.225 | 0.487 | 0.736 | 0.45 | 0.276 | ||||||||
| PMA31 | 0.362 | 0.183 | 0.792 | 0.748 | 0.46 | 0.259 | ||||||||
| PMA36 | 0.613 | 0.380 | 0.575 | 0.796 | 0.47 | 0.222 | ||||||||
| CAT | −0.545 | −0.353 | 0.720 | 0.163 | 0.43 | 0.371 | ||||||||
| 1st Block | 2nd Block | |||||||||||||
|---|---|---|---|---|---|---|---|---|---|---|---|---|---|---|
| HW | HH | HL | HS | SVL | TRL | FLL | HLL | BITE | SPR | CLI | MAN | r(PLS) | p | |
| BITE | 0.864 | 0.889 | 0.771 | 0.996 | 0.75 | 0.001 | ||||||||
| SPRINT | 0.921 | 0.802 | 0.731 | 0.653 | 0.64 | 0.006 | ||||||||
| CLIMB | 0.841 | 0.565 | 0.878 | 0.808 | 0.55 | 0.030 | ||||||||
| MANO | −0.369 | −0.023 | −0.780 | −0.951 | 0.36 | 0.392 | ||||||||
| PMA26 | 0.768 | 0.955 | 0.499 | 0.21 | 0.647 | |||||||||
| PMA31 | 0.845 | 0.981 | 0.608 | 0.12 | 0.933 | |||||||||
| PMA36 | 0.672 | 0.661 | 0.984 | 0.16 | 0.812 | |||||||||
| CAT | 0.885 | 0.881 | 0.921 | 0.16 | 0.794 | |||||||||
| PMA26 | −0.868 | 0.017 | 0.258 | 0.209 | 0.36 | 0.606 | ||||||||
| PMA31 | 0.851 | 0.342 | −0.154 | −0.295 | 0.24 | 0.884 | ||||||||
| PMA36 | 0.709 | 0.549 | −0.185 | 0.489 | 0.27 | 0.811 | ||||||||
| CAT | 0.016 | 0.305 | −0.268 | 0.864 | 0.25 | 0.844 | ||||||||
| 1st Block | 2nd Block | |||||||||||||
|---|---|---|---|---|---|---|---|---|---|---|---|---|---|---|
| HW | HH | HL | HS | SVL | TRL | FLL | HLL | BITE | SPR | CLI | MAN | r(PLS) | p | |
| BITE | 0.662 | 0.917 | 0.842 | 0.997 | 0.81 | 0.001 | ||||||||
| SPRINT | 0.516 | 0.894 | 0.249 | 0.656 | 0.27 | 0.702 | ||||||||
| CLIMB | 0.791 | 0.621 | 0.717 | 0.835 | 0.24 | 0.798 | ||||||||
| MANO | 0.467 | 0.374 | 0.839 | 0.928 | 0.28 | 0.686 | ||||||||
| PMA26 | 0.783 | 0.997 | 0.400 | 0.27 | 0.469 | |||||||||
| PMA31 | −0.200 | −0.659 | 0.369 | 0.34 | 0.301 | |||||||||
| PMA36 | 0.657 | 0.346 | 0.841 | 0.23 | 0.668 | |||||||||
| CAT | 0.011 | 0.052 | 0.944 | 0.19 | 0.768 | |||||||||
| PMA26 | −0.578 | 0.498 | 0.240 | −0.058 | 0.12 | 0.981 | ||||||||
| PMA31 | −0.289 | 0.419 | 0.794 | 0.808 | 0.37 | 0.430 | ||||||||
| PMA36 | 0.931 | 0.646 | 0.313 | −0.011 | 0.29 | 0.647 | ||||||||
| CAT | 0.097 | −0.332 | −0.809 | −0.919 | 0.34 | 0.522 | ||||||||
| 1st Block | 2nd Block | |||||||||||||
|---|---|---|---|---|---|---|---|---|---|---|---|---|---|---|
| HW | HH | HL | HS | SVL | TRL | FLL | HLL | BITE | SPR | CLI | MAN | r(PLS) | p | |
| BITE | 0.772 | 0.904 | 0.397 | 0.989 | 0.95 | 0.002 | ||||||||
| SPRINT | −0.443 | −0.052 | −0.932 | −0.620 | 0.75 | 0.077 | ||||||||
| CLIMB | 0.966 | 0.759 | 0.550 | 0.572 | 0.50 | 0.539 | ||||||||
| MANO | 0.354 | 0.806 | −0.318 | 0.324 | 0.76 | 0.075 | ||||||||
| PMA26 | 0.959 | 0.751 | 0.336 | 0.16 | 0.965 | |||||||||
| PMA31 | 0.895 | 0.863 | 0.681 | 0.19 | 0.949 | |||||||||
| PMA36 | 0.836 | 0.936 | 0.702 | 0.05 | 0.999 | |||||||||
| CAT | 0.826 | 0.933 | 0.735 | 0.26 | 0.898 | |||||||||
| PMA26 | −0.258 | 0.951 | 0.042 | −0.645 | 0.59 | 0.676 | ||||||||
| PMA31 | 0.017 | 0.962 | 0.450 | −0.666 | 0.52 | 0.791 | ||||||||
| PMA36 | −0.177 | 0.976 | 0.459 | −0.647 | 0.59 | 0.676 | ||||||||
| CAT | 0.232 | 0.862 | 0.680 | −0.540 | 0.57 | 0.704 | ||||||||
| 1st Block | 2nd Block | |||||||||||||
|---|---|---|---|---|---|---|---|---|---|---|---|---|---|---|
| HW | HH | HL | HS | SVL | TRL | FLL | HLL | BITE | SPR | CLI | MAN | r(PLS) | p | |
| BITE | 0.721 | 0.850 | 0.853 | 0.996 | 0.83 | 0.008 | ||||||||
| SPRINT | 0.449 | 0.658 | 0.649 | 0.987 | 0.45 | 0.450 | ||||||||
| CLIMB | 0.025 | 0.356 | 0.453 | 0.815 | 0.56 | 0.201 | ||||||||
| MANO | 0.954 | 0.879 | 0.888 | 0.567 | 0.56 | 0.227 | ||||||||
| PMA26 | 0.916 | 0.937 | 0.949 | 0.42 | 0.354 | |||||||||
| PMA31 | 0.913 | 0.935 | 0.951 | 0.26 | 0.704 | |||||||||
| PMA36 | 0.955 | 0.969 | 0.906 | 0.48 | 0.217 | |||||||||
| CAT | 0.964 | 0.965 | 0.898 | 0.15 | 0.913 | |||||||||
| PMA26 | 0.379 | 0.972 | 0.915 | 0.914 | 0.51 | 0.380 | ||||||||
| PMA31 | 0.451 | 0.955 | 0.912 | 0.925 | 0.41 | 0.603 | ||||||||
| PMA36 | 0.009 | 0.969 | 0.788 | 0.825 | 0.37 | 0.714 | ||||||||
| CAT | 0.556 | 0.863 | 0.764 | 0.973 | 0.35 | 0.747 | ||||||||
References
- Grether, G.F.; Kolluru, G.R.; Nersissian, K. Individual colour patches as multicomponent signals. Biol. Rev. 1999, 79, 583–610. [Google Scholar] [CrossRef] [PubMed]
- Cooper, W.; Greenberg, N. Reptilian coloration and behavior. Biol. Reptil. 1992, 18, 298–422. [Google Scholar]
- Olsson, M.; Stuart-Fox, D.; Ballen, C. Genetics and evolution of colour patterns in reptiles. Semin. Cell Dev. Biol. 2013, 24, 529–541. [Google Scholar] [CrossRef]
- Kemp, D.; Herberstein, M.; Fleishman, L.J.; Endler, J.; Bennett, A.T.; Dyer, A.G.; Hart, N.; Marshall, J.; Whiting, M.J. An Integrative Framework for the Appraisal of Coloration in Nature. Am. Nat. 2015, 185, 705–724. [Google Scholar] [CrossRef] [PubMed] [Green Version]
- Quinn, V.S.; Hews, D.K. Positive relationship between abdominal coloration and dermal melanin density in phrynosomatid lizards. Copeia 2003, 2003, 858–864. [Google Scholar] [CrossRef]
- Cox, R.M.; Zilberman, V.; John-Alder, H.B. Testosterone stimulates the expression of a social color signal in Yarrow’s Spiny Lizard, Sceloporus jarrovii. J. Exp. Zoöl. Part A Ecol. Genet. Physiol. 2008, 309, 505–514. [Google Scholar] [CrossRef]
- Pérez i de Lanuza, G.; Carretero, M.A. Partial divergence in microhabitat use suggests environmental-dependent selection on a colour polymorphic lizard. Behav. Ecol. Sociobiol. 2018, 72, 1–7. [Google Scholar] [CrossRef]
- Abalos, J.; i de Lanuza, G.P.; Carazo, P.; Font, E. The role of male coloration in the outcome of staged contests in the European common wall lizard (Podarcis muralis). Behaviour 2016, 153, 607–631. [Google Scholar] [CrossRef] [Green Version]
- Giraudeau, M.; Friesen, C.; Sudyka, J.; Rollings, N.; Whittington, C.; Wilson, M.; Olsson, M. Ageing and the cost of maintaining coloration in the Australian painted dragon. Biol. Lett. 2016, 12, 20160077. [Google Scholar] [CrossRef] [Green Version]
- Chan, R.; Stuart-Fox, D.; Jessop, T.S. Why are females ornamented? A test of the courtship stimulation and courtship rejection hypotheses. Behav. Ecol. 2009, 20, 1334–1342. [Google Scholar] [CrossRef] [Green Version]
- Olsson, M. Nuptial coloration in the sand lizard, Lacerta agilis: An intra-sexually selected cue to lighting ability. Anim. Behav. 1994, 48, 607–613. [Google Scholar] [CrossRef] [Green Version]
- I de Lanuza, G.P.; Carazo, P.; Font, E. Colours of quality: Structural (but not pigment) coloration informs about male quality in a polychromatic lizard. Anim. Behav. 2014, 90, 73–81. [Google Scholar] [CrossRef]
- Plasman, M.; Reynoso, V.H.; Nicolás, L.; Torres, R. Multiple colour traits signal performance and immune response in the Dickerson’s collared lizard Crotaphytus dickersonae. Behav. Ecol. Sociobiol. 2015, 69, 765–775. [Google Scholar] [CrossRef]
- Molnar, O.; Bajer, K.; Meszaros, B.; Torok, J.; Herczeg, G. Negative correlation between nuptial throat colour and blood parasite load in male European green lizards supports the Hamilton-Zuk hypothesis. Naturwissenschaften 2013, 100, 551–558. [Google Scholar] [CrossRef] [PubMed]
- Megía-Palma, R.; Martínez, J.; Merino, S. A structural colour ornament correlates positively with parasite load and body condition in an insular lizard species. Die Naturwiss. 2016, 103, 1–10. [Google Scholar] [CrossRef] [PubMed]
- Fitze, P.S.; Cote, J.; San-Jose, L.M.; Meylan, S.; Isaksson, C.; Andersson, S.; Rossi, J.-M.; Clobert, J. Carotenoid-Based Colours Reflect the Stress Response in the Common Lizard. PLoS ONE 2009, 4, e5111. [Google Scholar] [CrossRef] [PubMed] [Green Version]
- Arnold, S.J. Morphology, Performance and Fitness. Am. Zoöl. 1983, 23, 347–361. [Google Scholar] [CrossRef]
- Emerson, S.; Arnold, S. Intra-and interspecific relationships between morphology, performance, and fitness. Complex Org. Funct. Integr. Evol. Vertebr. 1989, 1989, 295–314. [Google Scholar]
- Irschick, D.J. Evolutionary approaches for studying functional morphology: Examples from studies of performance capacity. Integr. Comp. Biol. 2002, 42, 278–290. [Google Scholar] [CrossRef] [Green Version]
- Gomes, V.; Carretero, M.A.; Kaliontzopoulou, A. Run for your life, but bite for your rights? How interactions between natural and sexual selection shape functional morphology across habitats. Die Naturwiss. 2018, 105, 9. [Google Scholar] [CrossRef]
- Herrel, A.; Damme, R.V.; Vanhooydonck, B.; Vree, F.D. The implications of bite performance for diet in two species of lacertid lizards. Can. J. Zool. 2001, 79, 662–670. [Google Scholar] [CrossRef]
- Huyghe, K.; Vanhooydonck, B.; Herrel, A.; Tadić, Z.; Van Damme, R. Morphology, performance, behavior and ecology of three color morphs in males of the lizard Podarcis melisellensis. Integr. Comp. Biol. 2007, 47, 211–220. [Google Scholar] [CrossRef] [PubMed] [Green Version]
- Huyghe, K.; Herrel, A.; Adriaens, D.; Tadić, Z.; Van Damme, R. It is all in the head: Morphological basis for differences in bite force among colour morphs of the Dalmatian wall lizard. Biol. J. Linn. Soc. 2009, 96, 13–22. [Google Scholar] [CrossRef]
- Kaliontzopoulou, A.; Adams, D.C.; van der Meijden, A.; Perera, A.; Carretero, M.A. Relationships between head morphology, bite performance and ecology in two species of Podarcis wall lizards. Evol. Ecol. 2012, 26, 825–845. [Google Scholar] [CrossRef]
- Vanhooydonck, B.; Van Damme, R.; Aerts, P. Ecomorphological correlates of habitat partitioning in Corsican lacertid lizards. Funct. Ecol. 2000, 14, 358–368. [Google Scholar] [CrossRef]
- Žagar, A.; Carretero, M.A.; Vrezec, A.; Drašler, K.; Kaliontzopoulou, A. Towards a functional understanding of species coexistence: Ecomorphological variation in relation to whole-organism performance in two sympatric lizards. Funct. Ecol. 2017, 31, 1780–1791. [Google Scholar] [CrossRef] [Green Version]
- Zajitschek, S.R.K.; Zajitschek, F.; Miles, D.B.; Clobert, J. The effect of coloration and temperature on sprint performance in male and female wall lizards. Biol. J. Linn. Soc. 2012, 107, 573–582. [Google Scholar] [CrossRef] [Green Version]
- Bennett, A.F.; Dawson, W.R. Metabolism, in Biology of the Reptilia; Gans, C., Dawson, W.R., Eds.; Academic Press: New York, NY, USA, 1976; pp. 127–211. [Google Scholar]
- Moyes, C.D.; Hood, D.A. Origins and Consequences of Mitochondrial Variation in Vertebrate Muscle. Annu. Rev. Physiol. 2003, 65, 177–201. [Google Scholar] [CrossRef] [Green Version]
- Packard, T. The Measurement of Respiratory Electron-transport Activity in Marine Phytoplankton. J. Mar. Res. 1971, 29, 235–244. [Google Scholar]
- Båmstedt, U. ETS activity as an estimator of respiratory rate of zooplankton populations. The significance of variations in environmental factors. J. Exp. Mar. Biol. Ecol. 1980, 42, 267–283. [Google Scholar] [CrossRef]
- Žagar, A.; Simčič, T.; Carretero, M.A.; Vrezec, A. The role of metabolism in understanding the altitudinal segregation pattern of two potentially interacting lizards. Comp. Biochem. Physiol. Part A Mol. Integr. Physiol. 2015, 179, 1–6. [Google Scholar] [CrossRef]
- Žagar, A.; Holmstrup, M.; Simčič, T.; Debeljak, B.; Slotsbo, S. Comparing Enchytraeus albidus populations from contrasting climatic environments suggest a link between cold tolerance and metabolic activity. Comp. Biochem. Physiol. Part A Mol. Integr. Physiol. 2018, 224, 35–41. [Google Scholar] [CrossRef]
- Stoffels, R.J.; Richardson, A.J.; Vogel, M.T.; Coates, S.P.; Muller, W.J. What do metabolic rates tell us about thermal niches? Mechanisms driving crayfish distributions along an altitudinal gradient. Oecologia 2015, 180, 45–54. [Google Scholar] [CrossRef]
- Tumminello, R.; Fuller-Espie, S. Heat stress induces ROS production and histone phosphorylation in celomocytes of Eisenia hortensis. Invertebr. Surviv. J. 2013, 10, 50–57. [Google Scholar]
- Ju, R.-T.; Wei, H.-P.; Wang, F.; Zhou, X.-H.; Li, B. Anaerobic respiration and antioxidant responses of Corythucha ciliata (Say) adults to heat-induced oxidative stress under laboratory and field conditions. Cell Stress Chaperon 2013, 19, 255–262. [Google Scholar] [CrossRef] [PubMed] [Green Version]
- Hermes-Lima, M. Oxygen in Biology and Biochemistry: Role of Free Radicals. Funct. Metab. 2004, 1, 319–368. [Google Scholar] [CrossRef]
- Aebi, H. Catalase in vitro. In Methods in Enzymology; Elsevier: Cambridge, UK, 1984; pp. 121–126. [Google Scholar]
- Simčič, T.; Brancelj, A. Respiratory electron transport system (ETS) activity as an estimator of the thermal tolerance of two Daphnia hybrids. J. Plankton Res. 2004, 26, 525–534. [Google Scholar] [CrossRef] [Green Version]
- Seebacher, F.; Guderley, H.; Elsey, R.M.; Trosclair, P.L. Seasonal acclimatisation of muscle metabolic enzymes in a reptile (Alligator mississippiensis). J. Exp. Biol. 2003, 206, 1193–1200. [Google Scholar] [CrossRef] [Green Version]
- Simčič, T.; Lukančič, S.; Brancelj, A. Comparative study of electron transport system activity and oxygen consumption of amphipods from caves and surface habitats. Freshw. Biol. 2005, 50, 494–501. [Google Scholar] [CrossRef]
- Simčič, T.; Jesenšek, D.; Brancelj, A. Metabolic potential, respiration rate and their relationship in offspring of different sizes of marble trout (Salmo marmoratus Cuvier). Turk. J. Fish. Aquat. Sci. 2017, 15, 39–48. [Google Scholar]
- Bielen, A.; Bošnjak, I.; Sepčić, K.; Jaklič, M.; Cvitanić, M.; Lušić, J.; Lajtner, J.; Simčič, T.; Hudina, S. Differences in tolerance to anthropogenic stress between invasive and native bivalves. Sci. Total Environ. 2015, 543, 449–459. [Google Scholar] [CrossRef]
- Wellenreuther, M.; Svensson, E.; Hansson, B. Sexual selection and genetic colour polymorphisms in animals. Mol. Ecol. 2014, 23, 5398–5414. [Google Scholar] [CrossRef] [PubMed]
- De Lanuza, G.P.; Carretero, M.; Font, E. Intensity of male-male competition predicts morph diversity in a color polymorphic lizard. Evolution 2017, 71, 1832–1840. [Google Scholar] [CrossRef] [PubMed]
- De Lanuza, G.P.; Sillero, N.; Carretero, M. Ángel Climate suggests environment-dependent selection on lizard colour morphs. J. Biogeogr. 2018, 45, 2791–2802. [Google Scholar] [CrossRef]
- Sacchi, R.; Scali, S.; Pupin, F.; Gentilli, A.; Galeotti, P.; Fasola, M. Microgeographic variation of colour morph frequency and biometry of common wall lizards. J. Zoöl. 2007, 273, 389–396. [Google Scholar] [CrossRef]
- De Lanuza, G.P.; Font, E.; Carazo, P. Color-assortative mating in a color-polymorphic lacertid lizard. Behav. Ecol. 2012, 24, 273–279. [Google Scholar] [CrossRef] [Green Version]
- Pérez i de Lanuza, G.; Carretero, M.A.; Font, E. Thermal dependence of signalling: Do polymorphic wall lizards compensate for morph-specific differences in conspicuousness? Behav. Ecol. Sociobiol. 2016, 70, 1151–1159. [Google Scholar] [CrossRef]
- Andrade, P.; Pinho, C.; i de Lanuza, G.P.; Afonso, S.; Brejcha, J.; Rubin, C.-J.; Wallerman, O.; Pereira, P.; Sabatino, S.J.; Bellati, A.; et al. Regulatory changes in pterin and carotenoid genes underlie balanced color polymorphisms in the wall lizard. Proc. Natl. Acad. Sci. USA 2019, 116, 5633–5642. [Google Scholar] [CrossRef] [Green Version]
- Olson, V.r.A.; Owens, I.P. Costly sexual signals: Are carotenoids rare, risky or required? Trends Ecol. Evol. 1998, 13, 510–514. [Google Scholar] [CrossRef]
- Thony, B.; Auerbach, G.; Blau, N. Tetrahydrobiopterin biosynthesis, regeneration and functions. Biochem. J. 2000, 347, 1–16. [Google Scholar] [CrossRef]
- Sreelatha, L.B.; Boratyński, Z.; Carretero, M.A.; Pérez-Lanuza, G.; Klomp, D.A. Do colour morphs of European wall lizards express differential personalities? Biol. J. Linn. Soc. 2021, 133, 1139–1151. [Google Scholar] [CrossRef]
- De Lanuza, G.P.; Abalos, J.; Bartolomé, A.; Font, E. Through the eye of a lizard: Hue discrimination in a lizard with ventral polymorphic coloration. J. Exp. Biol. 2018, 221, jeb.169565. [Google Scholar] [CrossRef] [PubMed] [Green Version]
- García-Muñoz, E.; Sillero, N. Two new types of noose for capturing herps. Acta Herpetol. 2010, 5, 259–264. [Google Scholar] [CrossRef]
- Kaliontzopoulou, A.; Carretero, M.A.; Llorente, G.A. Multivariate and geometric morphometrics in the analysis of sexual dimorphism variation in Podarcis lizards. J. Morphol. 2007, 268, 152–165. [Google Scholar] [CrossRef]
- Osojnik, N.; Žagar, A.; Carretero, M.; García-Muñoz, E.; Vrezec, A. Ecophysiological Dissimilarities of Two Sympatric Lizards. Herpetologica 2013, 69, 445–454. [Google Scholar] [CrossRef]
- Veríssimo, C.V.; Carretero, M.A. Preferred temperatures of Podarcis vaucheri from Morocco: Intraspecific variation and interspecific comparisons. Amphib.-Reptil. 2009, 30, 17–23. [Google Scholar] [CrossRef] [Green Version]
- Van Berkum, F.; Huey, R.; Tsuji, J.; Garland, T. Repeatability of individual differences in locomotor performance and body size during early ontogeny of the lizard Sceloporus occidentalis (Baird & Girard). Funct. Ecol. 1989, 3, 97–105. [Google Scholar]
- Braña, F. Morphological correlates of burst speed and field movement patterns: The behavioural adjustment of locomotion in wall lizards (Podarcis muralis). Biol. J. Linn. Soc. 2003, 80, 135–146. [Google Scholar] [CrossRef] [Green Version]
- Van Damme, R.; Aerts, P.; Vanhooydonck, B. No trade-off between sprinting and climbing in two populations of the Lizard Podarcis hispanica (Reptilia: Lacertidae). Biol. J. Linn. Soc. 1997, 60, 493–503. [Google Scholar] [CrossRef]
- Brown, D.; Hanson, R.; Christian, W. Tracker-Video Analysis and Modeling Tool Software v 5.1.5. 2020. Available online: https://physlets.org/tracker/ (accessed on 1 September 2019).
- Gomes, V.; Carretero, M.A.; Kaliontzopoulou, A. Instantaneous Versus Interval Speed Estimates of Maximum Locomotor Capacities for Whole-Organism Performance Studies. Evol. Biol. 2017, 44, 551–560. [Google Scholar] [CrossRef]
- G.-Tóth, L. Aktivitat des Elektronentransportsystems. In Biologische Gewasseruntersuchung. Methoden der Biologischen Wasseruntersuchung 2; von Tumpling, V., Friedrich, G., Eds.; Gustav Fischer Verl.: Stuttgart, Germany, 1999; pp. 465–473. [Google Scholar]
- Berridge, M.V.; Herst, P.M.; Tan, A.S. Tetrazolium dyes as tools in cell biology: New insights into their cellular reduction. Biotechnol. Annu. Rev. 2005, 11, 127–152. [Google Scholar]
- Maldonado, F.; Packard, T.; Gómez, M. Understanding tetrazolium reduction and the importance of substrates in measuring respiratory electron transport activity. J. Exp. Mar. Biol. Ecol. 2012, 434, 110–118. [Google Scholar] [CrossRef]
- García-Muñoz, E.; Ceacero, F.; Pedrajas, L.; Kaliontzopoulou, A.; Carretero, M.Á. Tail tip removal for tissue sampling has no short-term effects on microhabitat selection by Podarcis bocagei, but induced autotomy does. Acta Herpetol. 2011, 6, 223–227. [Google Scholar] [CrossRef]
- Lampinen, J.; Raitio, M.; Perala, A.; Oranen, H.; Harinen, R.-R. Microplate Based Pathlength Correction Method for Photometric DNA Quantification Assay. Vantaa: Thermo Fisher Application Note. 2012. Available online: https://lablogic.com/data/file/b/6/Microplate%20Based%20Pathlength%20Correction%20Method%20for%20Photometric%20DNA%20Quantifi%20cation%20Assay.1427451676.pdf (accessed on 1 September 2019).
- Kenner, R.A.; Ahmed, S.I. Measurements of electron transport activities in marine phytoplankton. Mar. Biol. 1975, 33, 119–127. [Google Scholar] [CrossRef]
- Collyer, M.L.; Adams, D.C. RRPP: An r package for fitting linear models to high-dimensional data using residual randomization. Methods Ecol. Evol. 2018, 9, 1772–1779. [Google Scholar] [CrossRef] [Green Version]
- Mevik, B.r.-H.; Wehrens, R.; Liland, K.H. Pls: Partial Least Squares and Principal Component Regression. R Package Version. 2011. Available online: https://cran.r-project.org/web/packages/pls/pls.pdf (accessed on 1 December 2019).
- R Core Team. R: A Language and Environment for Statistical Computing. 2020. Available online: https://www.R-project.org/ (accessed on 1 December 2019).
- Huyghe, K.; Husak, J.F.; Herrel, A.; Tadić, Z.; Moore, I.T.; Van Damme, R.; Vanhooydonck, B. Relationships between hormones, physiological performance and immunocompetence in a color-polymorphic lizard species, Podarcis melisellensis. Horm. Behav. 2009, 55, 488–494. [Google Scholar] [CrossRef]
- Arnold, E. Structural niche, limb morphology and locomotion in lacertid lizards (Squamata, Lacertidae); a preliminary survey. Bull.-Nat. Hist. Mus. Zool. Ser. 1998, 64, 63–90. [Google Scholar]
- Van Damme, R.; Vanhooydonck, B. Speed versus manoeuvrability: Association between vertebral number and habitat structure in lacertid lizards. J. Zoöl. 2002, 258, 327–334. [Google Scholar] [CrossRef]
- Van Damme, R.; Vanhooydonck, B.; Aerts, P.; De Vree, F. Evolution of lizard locomotion: Context and constraint. In Vertebrate Biomechanics and Evolution: Symposium on Biomechanics and Evolution, 2001; University of Canterbury: Canterbury, UK, 2003. [Google Scholar]
- Calsbeek, B.; Hasselquist, D.; Clobert, J. Multivariate phenotypes and the potential for alternative phenotypic optima in wall lizard (Podarcis muralis) ventral colour morphs. J. Evol. Biol. 2010, 23, 1138–1147. [Google Scholar] [CrossRef]
- Abalos, J.; de Lanuza, G.P.; Bartolomé, A.; Liehrmann, O.; L.aakkonen, H.; Aubret, F.; Uller, T.; Carazo, P.; Font, E. No evidence for differential sociosexual behavior and space use in the color morphs of the European common wall lizard (Podarcis muralis). Ecol. Evol. 2020, 10, 10986–11005. [Google Scholar] [CrossRef]
- Abalos, J.; de Lanuza, G.P.; Bartolomé, A.; Aubret, F.; Uller, T.; Font, E. Viability, behavior, and color expression in the offspring of matings between common wall lizard Podarcis muralis color morphs. Curr. Zoöl. 2021, zoab039. [Google Scholar] [CrossRef]
- Pérez i de Lanuza, G.; Font, E. Differences in conspicuousness between alternative color morphs in a polychromatic lizard. Behav. Ecol. 2015, 26, 1432–1446. [Google Scholar] [CrossRef] [Green Version]
- Pérez i de Lanuza, G.; Font, E.; Carretero, M.A. Colour assortative pairing in a colour polymorphic lizard is independent of population morph diversity. Sci. Nat. 2016, 103, 1–7. [Google Scholar] [CrossRef] [PubMed]
- Žagar, A.; Carretero, M.A.; Marguč, D.; Simčič, T.; Vrezec, A. A metabolic syndrome in terrestrial ectotherms with different elevational and distribution patterns. Ecography 2018, 41, 1728–1739. [Google Scholar] [CrossRef] [Green Version]
- Günter, F.; Beaulieu, M.; Freiberg, K.F.; Welzel, I.; Toshkova, N.; Žagar, A.; Simčič, T.; Fischer, K. Genotype-environment interactions rule the response of a widespread butterfly to temperature variation. J. Evol. Biol. 2020, 33, 920–929. [Google Scholar] [CrossRef] [Green Version]
- Pörtner, H.O.; Knust, R. Climate Change Affects Marine Fishes through the Oxygen Limitation of Thermal Tolerance. Science 2007, 315, 95–97. [Google Scholar] [CrossRef] [Green Version]
- Yang, W.; Feiner, N.; Salvi, D.; Laakkonen, H.; Jablonski, D.; Pinho, C.; Carretero, M.A.; Sacchi, R.; Zuffi, M.A.; Scali, S. Population genomics of wall lizards reflects the dynamic history of the Mediterranean Basin. Mol. Biol. Evol. 2022, 39, msab311. [Google Scholar] [CrossRef]
- Salvi, D.; Harris, D.J.; Kaliontzopoulou, A.; Carretero, M.; Pinho, C. Persistence across Pleistocene ice ages in Mediterranean and extra-Mediterranean refugia: Phylogeographic insights from the common wall lizard. BMC Evol. Biol. 2013, 13, 147. [Google Scholar] [CrossRef] [Green Version]
- Lima-Santos, J.; Carvalho, J.E.; Brasileiro, C.A. How sexual differences affect locomotor performance and metabolism of the Sword Snake: An integrated view from energetics. J. Zoöl. 2021, 315, 149–155. [Google Scholar] [CrossRef]
- Cooper-Mullin, C.; McWilliams, S.R. The role of the antioxidant system during intense endurance exercise: Lessons from migrating birds. J. Exp. Biol. 2016, 219, 3684–3695. [Google Scholar] [CrossRef] [Green Version]
- Sacchi, R.; Mangiacotti, M.; Scali, S.; Ghitti, M.; Zuffi, M. Effects of Colour Morph and Temperature on Immunity in Males and Females of the Common Wall Lizard. Evol. Biol. 2017, 44, 496–504. [Google Scholar] [CrossRef]
- Megía-Palma, R.; Arregui, L.; Pozo, I.; Žagar, A.; Serén, N.; Carretero, M.; Merino, S. Geographic patterns of stress in insular lizards reveal anthropogenic and climatic signatures. Sci. Total Environ. 2020, 749, 141655. [Google Scholar] [CrossRef] [PubMed]
- Huyghe, K.; Van Oystaeyen, A.; Pasmans, F.; Tadić, Z.; Vanhooydonck, B.; Van Damme, R. Seasonal changes in parasite load and a cellular immune response in a colour polymorphic lizard. Oecologia 2010, 163, 867–874. [Google Scholar] [CrossRef] [PubMed]


| Orange N = 22 | White N = 22 | Yellow N = 24 | W-O N = 8 | Y-O N = 10 | ||
|---|---|---|---|---|---|---|
| SVL | Mean | 68.59 | 68.58 | 67.09 | 66.91 | 66.72 |
| (mm) | +/−SD | 3.57 | 2.86 | 3.97 | 2.96 | 3.29 |
| TRL | Mean | 32.47 | 32.66 | 31.58 | 32.65 | 32.10 |
| (mm) | +/−SD | 2.71 | 1.75 | 1.59 | 1.54 | 2.62 |
| HL | Mean | 25.86 | 25.50 | 24.59 | 25.20 | 25.00 |
| (mm) | +/−SD | 1.51 | 1.36 | 1.75 | 1.46 | 1.41 |
| PL | Mean | 16.62 | 16.44 | 16.40 | 16.08 | 16.25 |
| (mm) | +/−SD | 0.81 | 0.91 | 1.05 | 0.64 | 0.76 |
| HH | Mean | 8.97 | 8.95 | 8.89 | 8.71 | 8.79 |
| (mm) | +/−SD | 0.45 | 0.58 | 0.61 | 0.30 | 0.54 |
| HW | Mean | 6.87 | 6.78 | 6.73 | 6.69 | 7.12 |
| (mm) | +/−SD | 0.58 | 0.66 | 0.50 | 0.45 | 0.56 |
| FLL | Mean | 21.83 | 20.93 | 21.38 | 21.40 | 21.72 |
| (mm) | +/−SD | 1.22 | 1.54 | 1.29 | 1.21 | 1.02 |
| HLL | Mean | 34.77 | 34.00 | 33.41 | 33.70 | 34.38 |
| (mm) | +/−SD | 1.55 | 1.63 | 2.41 | 2.39 | 2.09 |
| SPRINT | Mean | 195.84 | 192.62 | 185.43 | 195.07 | 192.59 |
| (cm/s) | +/−SD | 27.81 | 24.67 | 22.46 | 15.30 | 29.61 |
| CLIMB | Mean | 147.05 | 137.93 | 141.86 | 142.58 | 127.52 |
| (cm/s) | +/−SD | 22.32 | 20.87 | 14.47 | 19.32 | 30.55 |
| MANO | Mean | 99.54 | 100.08 | 104.00 | 98.76 | 104.07 |
| (cm/s) | +/−SD | 11.93 | 9.09 | 17.84 | 10.20 | 15.74 |
| BITE | Mean | 5.98 | 5.95 | 5.88 | 6.01 | 5.95 |
| (N) | +/−SD | 1.10 | 1.04 | 1.35 | 1.21 | 1.32 |
| PMA26 | Mean | 27.77 | 24.99 | 27.01 | 21.89 | 26.89 |
| (µLO2/mg pr/h) | +/−SD | 11.68 | 7.37 | 9.03 | 5.71 | 10.99 |
| PMA31 | Mean | 39.86 | 34.17 | 39.08 | 29.76 | 34.56 |
| (µLO2/mg pr/h) | +/−SD | 13.85 | 11.31 | 12.94 | 10.60 | 14.95 |
| PMA36 | Mean | 44.11 | 36.27 | 43.82 | 35.49 | 34.95 |
| (µLO2/mg pr/h) | +/−SD | 17.2 | 11.03 | 14.64 | 14.79 | 17.53 |
| CAT | Mean | 5.95 | 5.09 | 5.32 | 4.40 | 5.43 |
| (U/mg pr) | +/−SD | 2.34 | 2.05 | 2.05 | 1.85 | 3.07 |
| SVL | HS | ||||||||||
| df | F | p | F | p | |||||||
| morph | 4 | 1.36 | 0.232 | 0.654 | 0.592 | ||||||
| Residuals | 88 | ||||||||||
| Total | 92 | ||||||||||
| TRL | FLL | HLL | |||||||||
| df | F | p | F | p | F | p | |||||
| log(SVL) | 1 | 83.56 | 0.001 | 28.31 | 0.001 | 43.34 | 0.001 | ||||
| morph | 4 | 0.85 | 0.506 | 2.03 | 0.095 | 1.45 | 0.233 | ||||
| log(SVL):morph | 4 | 3.81 | 0.009 | 0.88 | 0.483 | 0.60 | 0.654 | ||||
| Residuals | 83 | ||||||||||
| Total | 92 | ||||||||||
| HL | PL | HW | HH | MO | |||||||
| df | F | p | F | p | F | p | F | p | F | p | |
| HS | 1 | 145.89 | 0.001 | 170.87 | 0.001 | 200.57 | 0.001 | 242.74 | 0.001 | 76.08 | 0.001 |
| morph | 4 | 2.80 | 0.029 | 1.12 | 0.362 | 2.44 | 0.058 | 2.06 | 0.084 | 0.67 | 0.630 |
| HS:morph | 4 | 0.62 | 0.627 | 0.08 | 0.982 | 1.04 | 0.400 | 0.45 | 0.777 | 1.00 | 0.388 |
| Residuals | 83 | ||||||||||
| Total | 92 | ||||||||||
| PMA26 | PMA31 | PMA36 | CAT | ||||||||
| df | F | p | F | p | F | p | F | p | |||
| log(SVL) | 1 | 0.51 | 0.519 | 0.18 | 0.670 | 0.21 | 0.670 | 0.79 | 0.383 | ||
| morph | 4 | 0.42 | 0.788 | 1.45 | 0.239 | 1.83 | 0.141 | 0.81 | 0.515 | ||
| log(SVL):morph | 4 | 1.03 | 0.398 | 0.26 | 0.892 | 1.20 | 0.320 | 0.23 | 0.931 | ||
| Residuals | 76 | ||||||||||
| Total | 85 | ||||||||||
| BITE | SPRINT | CLIMB | MANO | ||||||||
| df | F | p | F | p | F | p | F | p | |||
| log(X) | 1 | 131.21 | 0.001 | 2.31 | 0.132 | 3.50 | 0.062 | 0.11 | 0.746 | ||
| morph | 4 | 0.84 | 0.507 | 0.73 | 0.560 | 1.39 | 0.232 | 0.51 | 0.735 | ||
| log(X):morph | 4 | 2.27 | 0.075 | 0.71 | 0.589 | 2.08 | 0.115 | 0.74 | 0.557 | ||
| Residuals | 83 | ||||||||||
| Total | 92 | ||||||||||
| All | Orange | White | Yellow | W-O | Y-O | |||||||
|---|---|---|---|---|---|---|---|---|---|---|---|---|
| r(PLS) | p | r(PLS) | p | r(PLS) | p | r(PLS) | p | r(PLS) | p | r(PLS) | p | |
| BITE:morph | 0.772 | 0.001 | 0.81 | 0.001 | 0.75 | 0.001 | 0.81 | 0.001 | 0.95 | 0.002 | 0.83 | 0.008 |
| SPRINT:morph | 0.228 | 0.129 | 0.41 | 0.200 | 0.64 | 0.006 | 0.27 | 0.702 | 0.75 | 0.077 | 0.45 | 0.450 |
| CLIMB:morph | 0.266 | 0.043 | 0.32 | 0.448 | 0.55 | 0.030 | 0.24 | 0.798 | 0.50 | 0.539 | 0.56 | 0.201 |
| MANO:morph | 0.135 | 0.602 | 0.34 | 0.430 | 0.36 | 0.392 | 0.28 | 0.686 | 0.76 | 0.075 | 0.56 | 0.227 |
| PMA26:morph | 0.152 | 0.362 | 0.28 | 0.346 | 0.21 | 0.647 | 0.27 | 0.469 | 0.16 | 0.965 | 0.42 | 0.354 |
| PMA31:morph | 0.52 | 0.944 | 0.13 | 0.875 | 0.12 | 0.933 | 0.34 | 0.301 | 0.19 | 0.949 | 0.26 | 0.704 |
| PMA36:morph | 0.046 | 0.952 | 0.16 | 0.765 | 0.16 | 0.812 | 0.23 | 0.668 | 0.05 | 0.999 | 0.48 | 0.217 |
| CAT:morph | 0.141 | 0.432 | 0.20 | 0.648 | 0.16 | 0.794 | 0.19 | 0.768 | 0.26 | 0.898 | 0.15 | 0.913 |
| PMA26:perf | 0.205 | 0.434 | 0.45 | 0.276 | 0.36 | 0.606 | 0.12 | 0.981 | 0.59 | 0.676 | 0.51 | 0.380 |
| PMA31:perf | 0.174 | 0.570 | 0.46 | 0.259 | 0.24 | 0.884 | 0.37 | 0.430 | 0.52 | 0.791 | 0.41 | 0.603 |
| PMA36:perf | 0.194 | 0.471 | 0.47 | 0.222 | 0.27 | 0.811 | 0.29 | 0.647 | 0.59 | 0.676 | 0.37 | 0.714 |
| CAT:perf | 0.186 | 0.497 | 0.43 | 0.371 | 0.25 | 0.844 | 0.34 | 0.522 | 0.57 | 0.704 | 0.35 | 0.747 |
Publisher’s Note: MDPI stays neutral with regard to jurisdictional claims in published maps and institutional affiliations. |
© 2022 by the authors. Licensee MDPI, Basel, Switzerland. This article is an open access article distributed under the terms and conditions of the Creative Commons Attribution (CC BY) license (https://creativecommons.org/licenses/by/4.0/).
Share and Cite
Gomes, V.; Žagar, A.; Lanuza, G.P.i.d.; Simčič, T.; Carretero, M.A. Is It Function or Fashion? An Integrative Analysis of Morphology, Performance, and Metabolism in a Colour Polymorphic Lizard. Diversity 2022, 14, 116. https://doi.org/10.3390/d14020116
Gomes V, Žagar A, Lanuza GPid, Simčič T, Carretero MA. Is It Function or Fashion? An Integrative Analysis of Morphology, Performance, and Metabolism in a Colour Polymorphic Lizard. Diversity. 2022; 14(2):116. https://doi.org/10.3390/d14020116
Chicago/Turabian StyleGomes, Verónica, Anamarija Žagar, Guillem Pérez i de Lanuza, Tatjana Simčič, and Miguel A. Carretero. 2022. "Is It Function or Fashion? An Integrative Analysis of Morphology, Performance, and Metabolism in a Colour Polymorphic Lizard" Diversity 14, no. 2: 116. https://doi.org/10.3390/d14020116