
Bioclimatic Preferences of the Great Bustard in a Steppe Region

1
Nyírmihálydi Petőfi Sándor Primary School, Zrínyi Str. 11–13, H-4363 Nyírmihálydi, Hungary
2
Institute of Aquatic Ecology, Centre for Ecological Research, Karolina Str. 29, H-1113 Budapest, Hungary
3
Senckenberg Deutsches Entomologisches Institut, Eberswalder Str. 90, 15374 Müncheberg, Germany
*
Author to whom correspondence should be addressed.
Diversity 2022, 14(12), 1138; https://doi.org/10.3390/d14121138
Submission received: 22 October 2022
/
Revised: 13 December 2022
/
Accepted: 14 December 2022
/
Published: 18 December 2022
(This article belongs to the Special Issue Avian Ecology and Diversity, Population Monitoring and Conservation: Recent Advances and New Challenges)
Abstract
:(1) The intercorrelated effects of climatic processes and anthropogenic land use changes have been shown to govern the population declines in several bird species, which have led to global extinctions. Ground-nesting birds are especially sensitive to modifications in spatial as well as temporal patterns of climatic change. The Great Bustard (Otis tarda) is one of the most endangered species, which has suffered considerable range contractions and population declines in extensive areas of its historical distribution. (2) Here, we aim to (i) identify the key climatic predictors governing the historical distribution of the Great Bustard within the Carpathian Basin during the past three decades, (ii) provide spatial predictions for the historical range of the study species, and (iii) identify areas where species-specific conservation planning initiatives need to focus on by predicting the distribution of the Great Bustard for future time periods. To do so, here we apply bioclimatic niche modeling implemented in the MaxEnt software package, which is fitted on historical occurrence locations as a function of potential bioclimatic predictors. (3) We show that (i) the most important bioclimatic predictors governing the distribution of the Great Bustard are the annual mean temperature, mean temperatures of the wettest and driest quarters, as well as the annual precipitation; (ii) all lowland areas of the Carpathian Basin were suitable for the Great Bustard during historical time periods; (iii) the SDM predictions show the historical suitability of the Muntenia and Dobrodgea regions and the Upper Thracian Plain; and (iv) the future projections show a substantial decrease in the core distribution area, whereas the boundary areas are expected to remain stable. In summary, our study emphasizes that the distribution modeling of endangered taxa using historical records can strongly support species-specific conservation planning initiatives.
1. Introduction
At the global scale, current climatic processes have been repeatedly shown to drive ecosystem functions and services, resulting in serious population declines as well as global and local extinctions across broad geographical and taxonomic scales [1,2,3]. Theoretical bioclimatic investigations consistently predict the acceleration of extinction events and the rapid poleward shift of the distribution ranges of a large number of species [4]. In addition, a number of investigations have documented that land use changes have accelerated during the past decades [5], affecting the survival of endangered taxa and leading to the increased fragmentation of natural habitats, especially when interacting with climatic processes [6]. Evidence is mounting that ground-nesting birds are especially sensitive to alterations in spatial as well as temporal patterns of climatic changes and were less responsive to land use changes during historical time periods [7]. These processes are especially influential for threatened species of shorebirds, larks, and bustards; these taxa are losing their natural and traditional agricultural habitats through the additive effects of severe droughts, temperature extremities, the loss of insect populations, and agricultural industrialization [8,9].
Investigations on modern avian migration systems have demonstrated that both the breeding and wintering ranges of migratory birds are predicted by bioclimatic parameters, even for species that are not in complete equilibrium with climatic conditions. Indeed, Araujo et al. found that the responses of bird species to climate change are more likely to be accurately forecasted by models correlating present day distributions with the climate, reflecting their higher dispersal capabilities as compared to less mobile taxa [10]. For birds that do not bioclimatically occupy their predicted areas because of habitat fragmentation processes and hunting pressure, bioclimatic modeling can be especially useful for informing conservation management on the potential core areas of endangered species where conservation activities should focus; bioclimatic modeling allows the estimation of climatically suitable areas where species-specific conservation planning initiatives can be implemented [11].
The Great Bustard (Otis tarda) is one of the threatened species belonging to the single family Otidides within the order Otidiformes [12]. The species, classified as vulnerable within the IUCN threat status classes, has suffered considerable range contractions, population declines, and fragmentation as well as local extinctions in the extensive steppe areas of its historical distribution, ranging from Moroc to the Amur region, which are largely attributed to land use change, climatic processes, and hunting pressure [12,13,14]). Specifically, the survival rates of the Great Bustard are affected by risks of climate change throughout several periods of its lifecycle, including the survival rates of chicks, overwintering young birds, and incubating females [8]. Therefore, it is of key conservation importance to identify the bioclimatic preferences of the Great Bustard, as the species is not at equilibrium with its current climatic environment. To control for the non-equilibrium relationship of the distribution area of the study species and its current climatic environment, we chose to use historical and non-traditional records such as data from hunting bags to aim to provide robust bioclimatic models of the bustards’ range [8,14].
The literature resources consistently show that the natural grassland habitats of Hungary have become fragmented during the past 100 years [15,16], which has led to a considerable (ca. 50%, N = 1200–1300, [17]) decline in the bustard population of the Carpathian Basin. The first documented population decline was observed after the Second World War, which has been accelerated by land use changes during the 1990s. Today, the surviving Hungarian population is divided into two metapopulations, as documented by a recent genetic investigation [18]. These metapopulations harbor 1480–1680 individuals distributed across (i) Transdanubia, as well as the (ii) Körös-Maros and Hortobágy regions [17,18], where intensive species-specific conservation programs are running, including the LIFE NATURE programs and national initiatives (www.termeszetvedelem.hu (accessed on 5 December 2022)).
Single-species conservation planning initiatives greatly benefit from analyzing historical distribution patterns, as anecdotal information and even expert opinions based on current range patterns may come from misinterpreted habitat choice strategies, which can be misleading when designing management plans [19]. However, species-specific conservation plans often lack detailed information on historical habitat selection patterns, which may fast improve the success of conservation planning initiatives for endangered animals, as is the case with the Great Bustard [20]. In contrast, targeted conservation can be largely facilitated by the formulation of future range predictions that contribute to the optimal allocation of highly limited financial and human resources [21].
In the present work, we aim to (i) identify the key climatic predictors governing the historical distribution of the Great Bustard within the Carpathian Basin during the past two centuries, (ii) provide spatial predictions for the historical range of the study species, and (iii) identify areas where species-specific conservation planning initiatives need to focus on by predicting the distribution of the Great bustard in future time periods. To do so, we apply bioclimatic niche modeling available in the MaxEnt software package, which is fitted on historical occurrence locations as a function of potential bioclimatic predictors.
2. Materials and Methods
2.1. Study Area
The Carpathian Basin is a geographic region within Central Europe surrounded by the Carpathian Mountains, the Alps, and the Dinaric mountains. Its boundaries intersect those of 11 countries (Figure 1). The climate of the study region is predominantly continental and historically the majority of the region was covered by steppes and wooded steppes, which harbored a large number of steppe species, many of which are currently classified as endangered [22].
2.2. Study Species
The Great Bustard is one of the 26 species of the family Otididae, classified currently as the only family within the order Otidiformes, which includes several threatened and even critically endangered species and subspecies, all of which occupy open terrains [23]. Out of this family, the Great Bustard has the largest and northernmost historical distribution range. Although the Great Bustard is one of the heaviest flying birds, this species can cover geographic distances of up to 2000 kilometers during migratory movements [23].
The global population of the study species is estimated at 29,000–32,500 individuals, as assessed during the 2020s [24,25]. The largest population is found in Spain, which harbors 57–70% of the global population. The second largest population occupies the Saratov region in the European part of Russia (19.4%, [13]), while 3% of the global population is harbored in Hungary [13,17]. The Hungarian population is stable or increasing and is estimated at 1480–1680 individuals, aggregated predominantly in the eastern part of the country [13,17]. The Great Bustard is considered vulnerable according to the IUCN conservation classification and has been strictly protected in Hungary since 1970, providing it the highest possible national legal protection (www.termeszetvedelem.hu (accessed on 5 December 2022 )). The Great Bustard is a lek-mating bird: male birds aggregate to perform competitive displays, the primary function of which is to attract females surveying prospective partners for copulation. Prior to human agricultural developments, the Great Bustard bred on the native steppes and has gradually occupied agricultural areas until today [26]. During historical times, the Great Bustard was a game bird in Hungary, the trophies of which were an important element of a hunter’s collections. Thus, a large number of written resources are available for locations of occurrence since 1867 within the historical boundaries of the country, covering 98% of the Carpathian Basin in geographical terms [17].
2.3. Occurrence Records
To retrieve historical occurrence data for the Great Bustard, we collected the occurrence data from various hard copy and online resources, including hunters’ reports and past ornithological or conservation-related articles (Figure 1, Appendix A). We retained only data for further data processing that provided dates, numbers of individuals, and identifiable district names. Further, as current climatic models provide bioclimatic data only for 1970–2000, we retained records dated only between 1970 and 2000 out of the original dataset spanning 186 years between 1828 and 2014. Geographic coordinates were assigned to each location by calculating the centroid of the spatial layer of each settlement district. Thus, the spatial precision of occurrence locations ranged over 1.0–15.1 km, which fell within the range of magnitude of the movements of the Great Bustard; thus, these records allow the formulation of bioclimatic models describing the climatic preferences of the study species.
2.4. Species Distribution Modeling
The occurrence locations of Great Bustards were computed using GoogleMaps (https://www.google.hu/maps (accessed on 17 November 2022)). A visual inspection of the data quality and filtering was carried out using the QGIS 3.4.1-Madeira software (https://qgis.org/en/site/forusers/download.html (accessed on 17 November 2022), version 3.4.1, QGIS Development Team, http://qgis.osgeo.org (accessed on 17 November 2022)), during which we aimed to identify records with incorrect or false coordinates (i.e., coordinates that did not conform to the textual information), which we corrected or removed if reliable correction was not possible.
As candidate bioclimatic proxies of the bustard’s historical range, we considered the 19 bioclimatic variables that have been shown to parametrize the distribution of animal and plant species at the global scale (available at worldclim.org), which describe current (near-historical) climatic conditions (1970–2000; [27]) at a spatial resolution of 2.5 arc-minutes, which are provided as downscaled rasters computed by CRU-TS-4.03 of the Climatic Research Unit, University of East Anglia, using WorldClim 2.1 for bias correction. For the climatic data projected for near-future time periods (2021–2040), we applied downscaled data provided by the CMIP6 approach, for which the downscaling and calibration (bias correction) were conducted using WorldClim v2.1 as the baseline climate. For all bioclimatic projections for the future, we considered the HadGEM3-GC31-LL global climate models (GCM) and ssp245 shared socio-economic pathways, which have been shown to provide robust bioclimatic predictions [28].
To identify the bioclimatic predictors of the historical range of the Great Bustard, we applied species distribution modeling (SDM) employing MaxEnt software, (version 3.1; http://www.cs.princeton.edu/~schapire/maxent/ (accessed on 17 November 2022)) which uses a machine learning algorithm with the maximum entropy approach [29]. This framework is generally used to predict the potential distributions of species estimating relationships among presence-only data and environmental effects, and is considered to be a commonly used statistical approach to SDM [30]. Since we were using presence-only records, SDMs were constructed using MaxEnt software, for which the resultant SDMs are affected by spatial autocorrelation only if the areas of interests are sampled unevenly [31] Although historical descriptions show that during the study period, all bustard areas have been intensively sampled by hunters to a similar degree, spatial autocorrelation can also emerge when data are evenly sampled, which is a consequence of correlations in the underlying determinants of occupancy. [32]. Thus, we estimated the degree of spatial autocorrelation in the residuals of the MaxEnt model by conducting a permutation test for Moran’s I statistic. According to the results of the permutation test, the model residuals were not spatially autocorrelated (permutation test for Moran’s I statistics, Moran’s I = −0.0246, p = 0.608) [33]. To compute the importance of bioclimatic predictors, we first set the maximum number of iterations to the default number of 500 and then used the jackknife test available in MaxEnt, which tests all models by alternatively removing each environmental predictor, thereby formulating SDM models entering each parameter in isolation and calculating variable importance levels [34]. The contribution of each proxy is computed by randomly permuting predictor metrics among presence locations and background training points, and the performance of each predictor is estimated by the jackknife test of the regularized training gain, which is a measure of the distances between a multivariate distribution of covariates at randomly selected background sites. This computation is followed by the estimation of the resulting decrease in the training area under the receiver operating characteristic (ROC) curve (AUC). Large increases in the AUC indicate that the model performance is dependent on the particular predictor [35]. Further, MaxEnt contrasts presences against background locations (N = 100,000) where presences and absences are not sampled [29].
To estimate the predictive performance of the bioclimatic models provided by MaxEnt, we computed the AUC metrics, which allowed reliable distinctions between the presence and background points. The AUC values range between 0.0 and 1.0, where 1.0 implies perfect prediction, whereas values lower than 0.5 indicate predictions that are not better than random. In SDM, AUC values ranging 0.9–1 indicate strongly supported models; AUC values scoring 0.8–0.9 are defined as good; AUC values ranging 0.7–0.8 are defined as fair; AUC values ranging 0.6–0.7 are considered as poor; AUC values between 0.5 and 0.6 indicate failed predictions [36]. Further, to calculate presences and absences on a binary scale, we followed the approach provided by [37], considering 10% training presence as the presence threshold, which was calculated based on the omission errors and allowed a 10% false presence rate for the training data. To reduce the influence of sampling bias on the results, we repeated the cross-validation sampling five times and calculated the mean variable importance level, AUC metrics, and model projections.
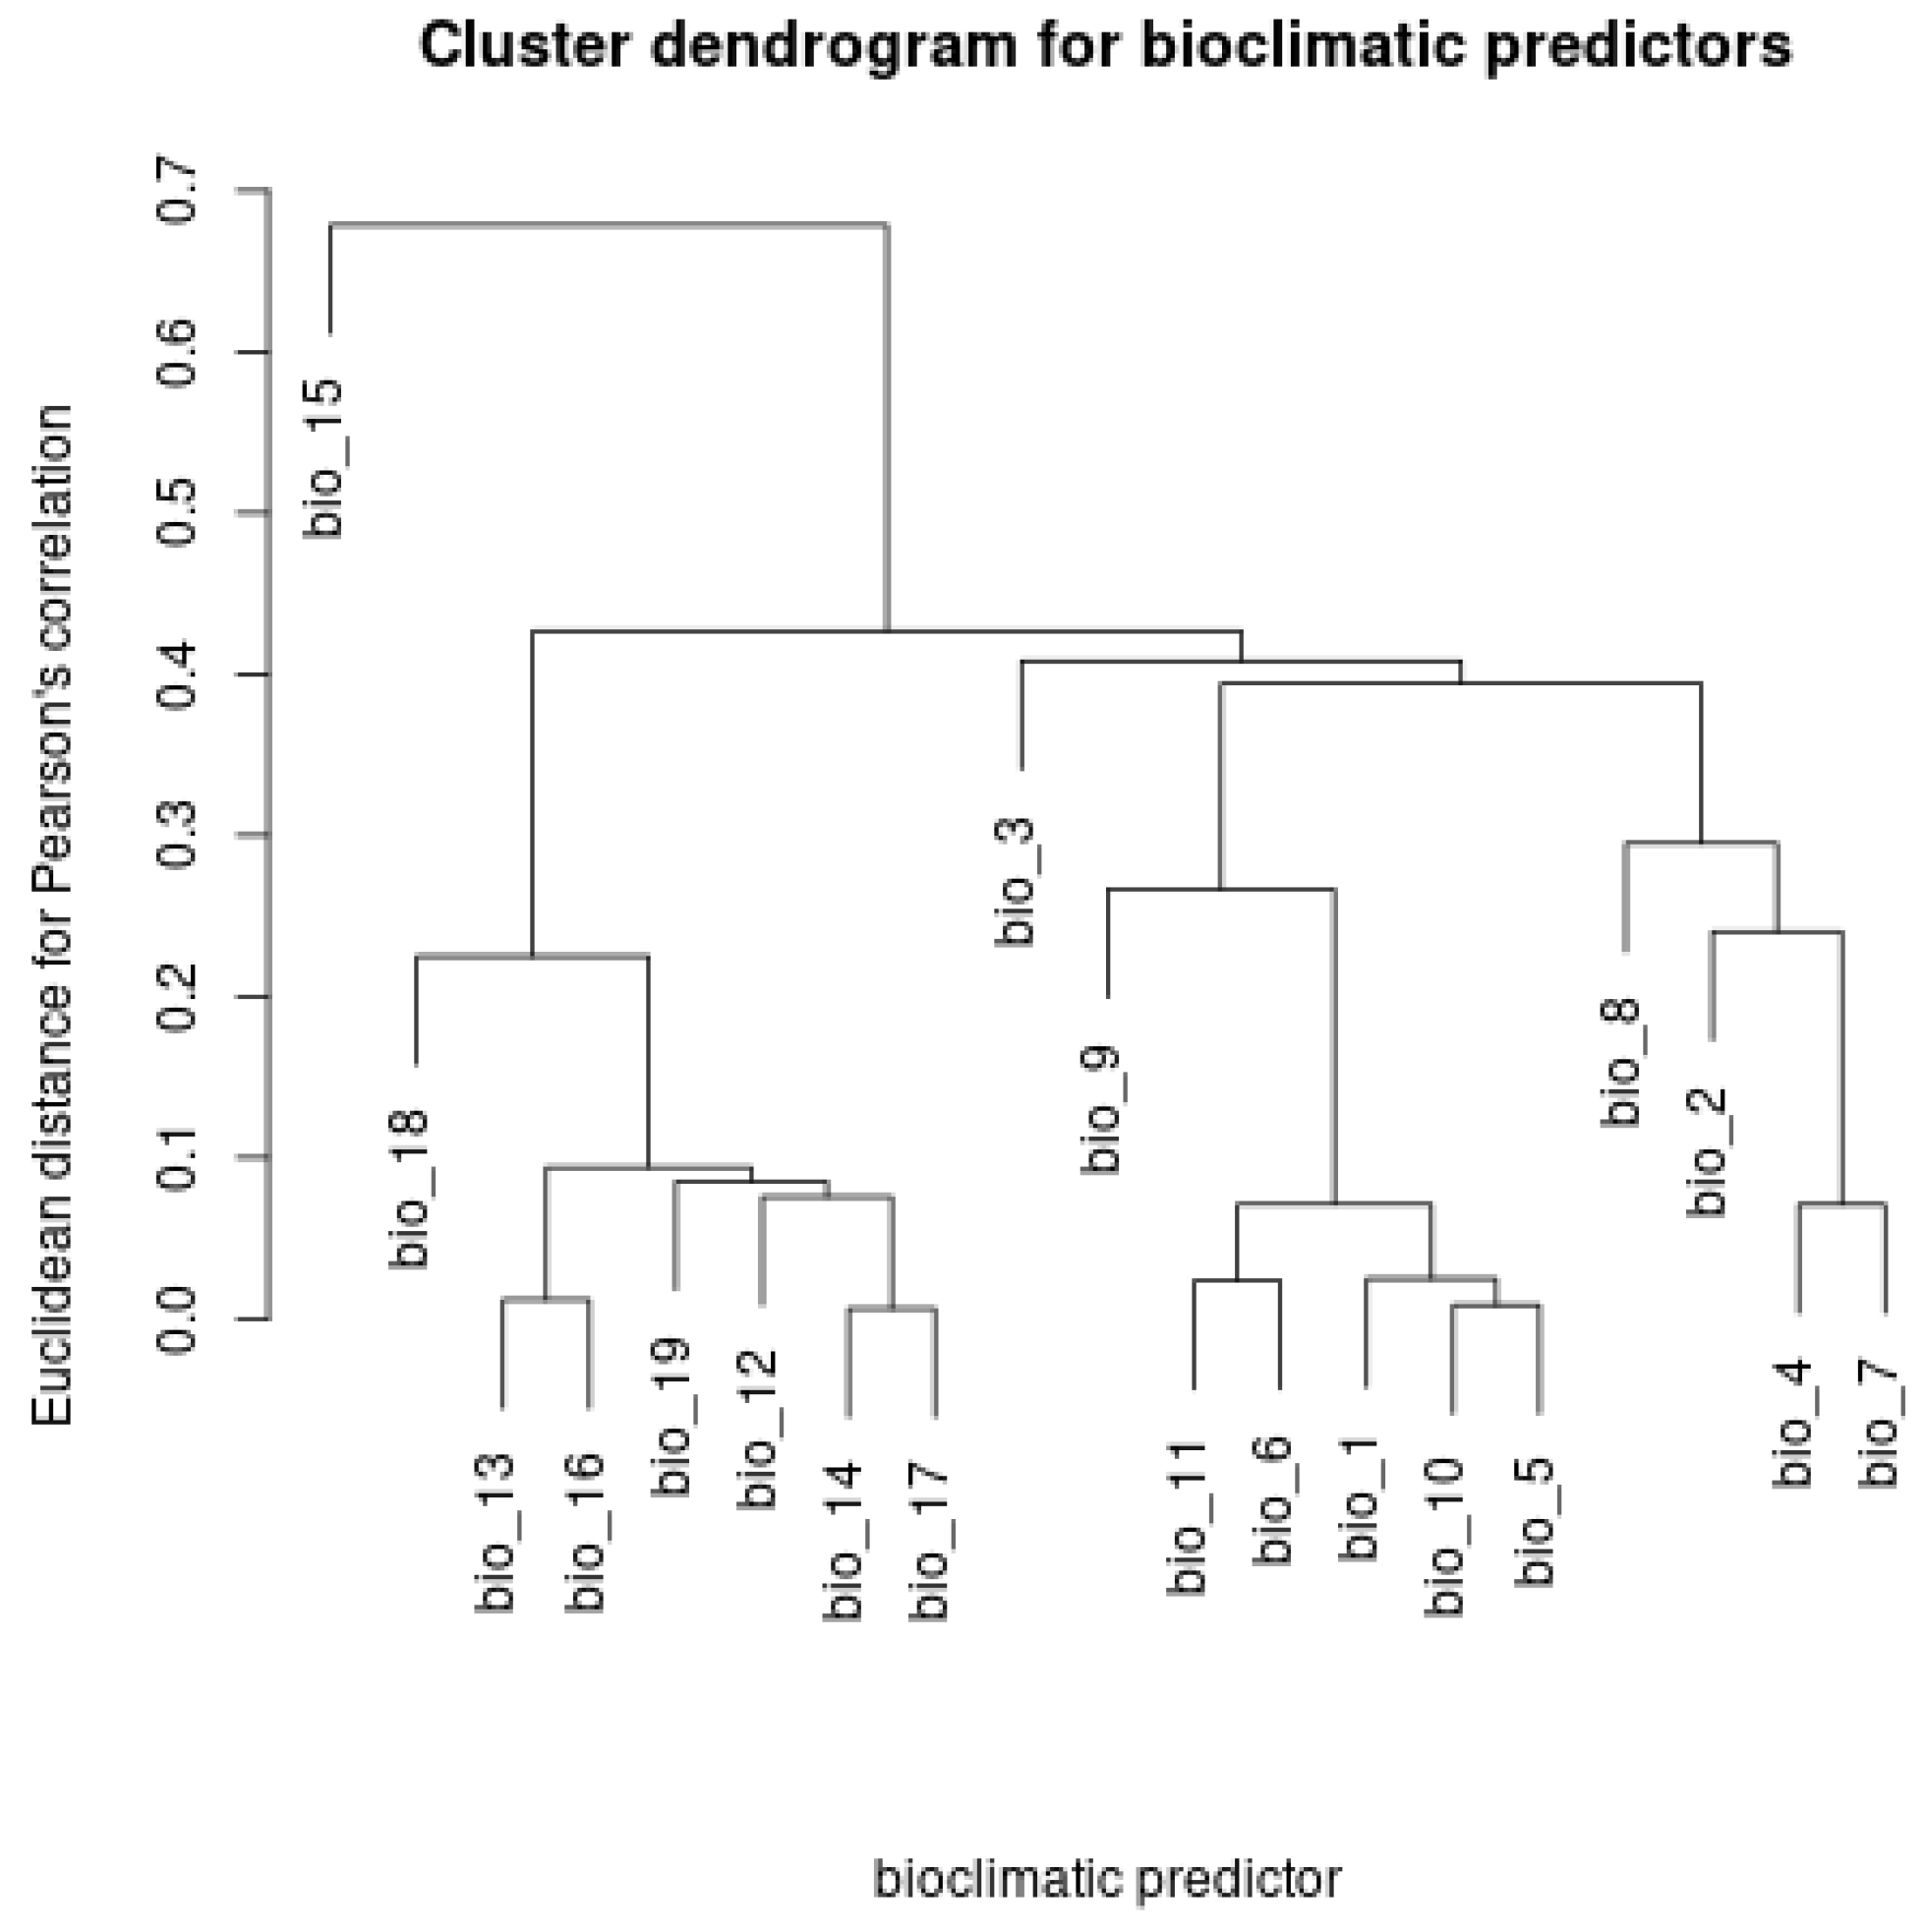
To avoid the use of correlated bioclimatic predictors, we first cropped the original 19 bioclimatic rasters available for global scales to the geographic extent of the Carpathian Basin and then computed Pearson’s correlation coefficients and weighted covariances for the cropped rasters by applying the ‘layerStat’ function. In the following step, we performed hierarchical clustering of the resulting pairwise Pearson’s correlation coefficients by employing the ‘hclust’ function. Next, we preselected uncorrelated (where Pearson’s r < 0.7) and biologically relevant bioclimatic predictors by investigating the resulting correlation matrix and by visually inspecting the related dendrogram. In the following step, we generated a matrix of geographic coordinates of the occurrences of the Great Bustard to serve as the input response coordinate dataset to be included in MaxEnt.
Next, as recommended by [38], we ran the MaxEnt model for the bustard coordinates by assigning 75% of the occurrence points as training locations and retaining 25% of these points for testing, applying N = 100,000 points for background sampling. In the following step of the procedure, we extracted the variable importance values of each bioclimatic variable out of the MaxEnt model output, as described above. In the next step of the SDM where we formulated predictions for the distribution of the Great Bustard within the Carpathian Basin at historical time periods, we repeatedly ran MaxEnt by applying the bioclimatic variables identified as having (i) variable importance and (ii) biological relevance. Thus, we ran the MaxEnt model twice: (1) for the preselected bioclimatic variables and (2) for only the bioclimatic variables showing high variable importance in the first MaxEnt model. The climate conditions projected for the historical time periods were downloaded from the WorldClim database (CCSM4), which employed the data available from CMIP5 in the downscaled and calibrated format, using WorldClim 2.1 (http://www.worldclim.org (accessed on 17 November 2022)). Finally, we projected the SDM model on near-future time periods (2021–2040) within the geographical range of the Carpathian Basin. To assess the performance of the SDM projected for future time periods, we computed the AUC metrics of the cross-validation of the MaxEnt model projected onto the bioclimatic rasters for future scales, considering the test points as presence points and using 10,000 background points.
All modeling was carried out in the R statistical programming environment [39]. Data management and specific data analyses were conducted by applying the ‘readxl’ [40] package. Spatial computations and visualizations were carried out by employing the ‘maptools’ [41], ’raster’ [27], ’rgeos’ [42], and ’rgdal’ [43] packages. The species distribution modeling was performed by applying the ’rJava’ [44] and ’dismo’ packages [45].
3. Results
3.1. Occurrence Data
During the study period spanning 30 years (1970–2000), Great Bustards were documented from 748 unique locations with identifiable settlement names and known numbers of individuals, totaling 36,955 individuals (Appendix B). We found 442 unique locations in the Southern Great Plain, which provided 55% of all records, which was the most important region in the complete dataset. Strongly aggregated data were collected during 1970–1979, which spanned 9 years and 312 records in total, comprising 71% of the complete subset of the records from the Southern Great Plain. This temporal aggregation showed a strong spatial pattern; the majority of this subset was collected in the southern part of this region (Table 1, Figure 1).
3.2. Species Distribution Model
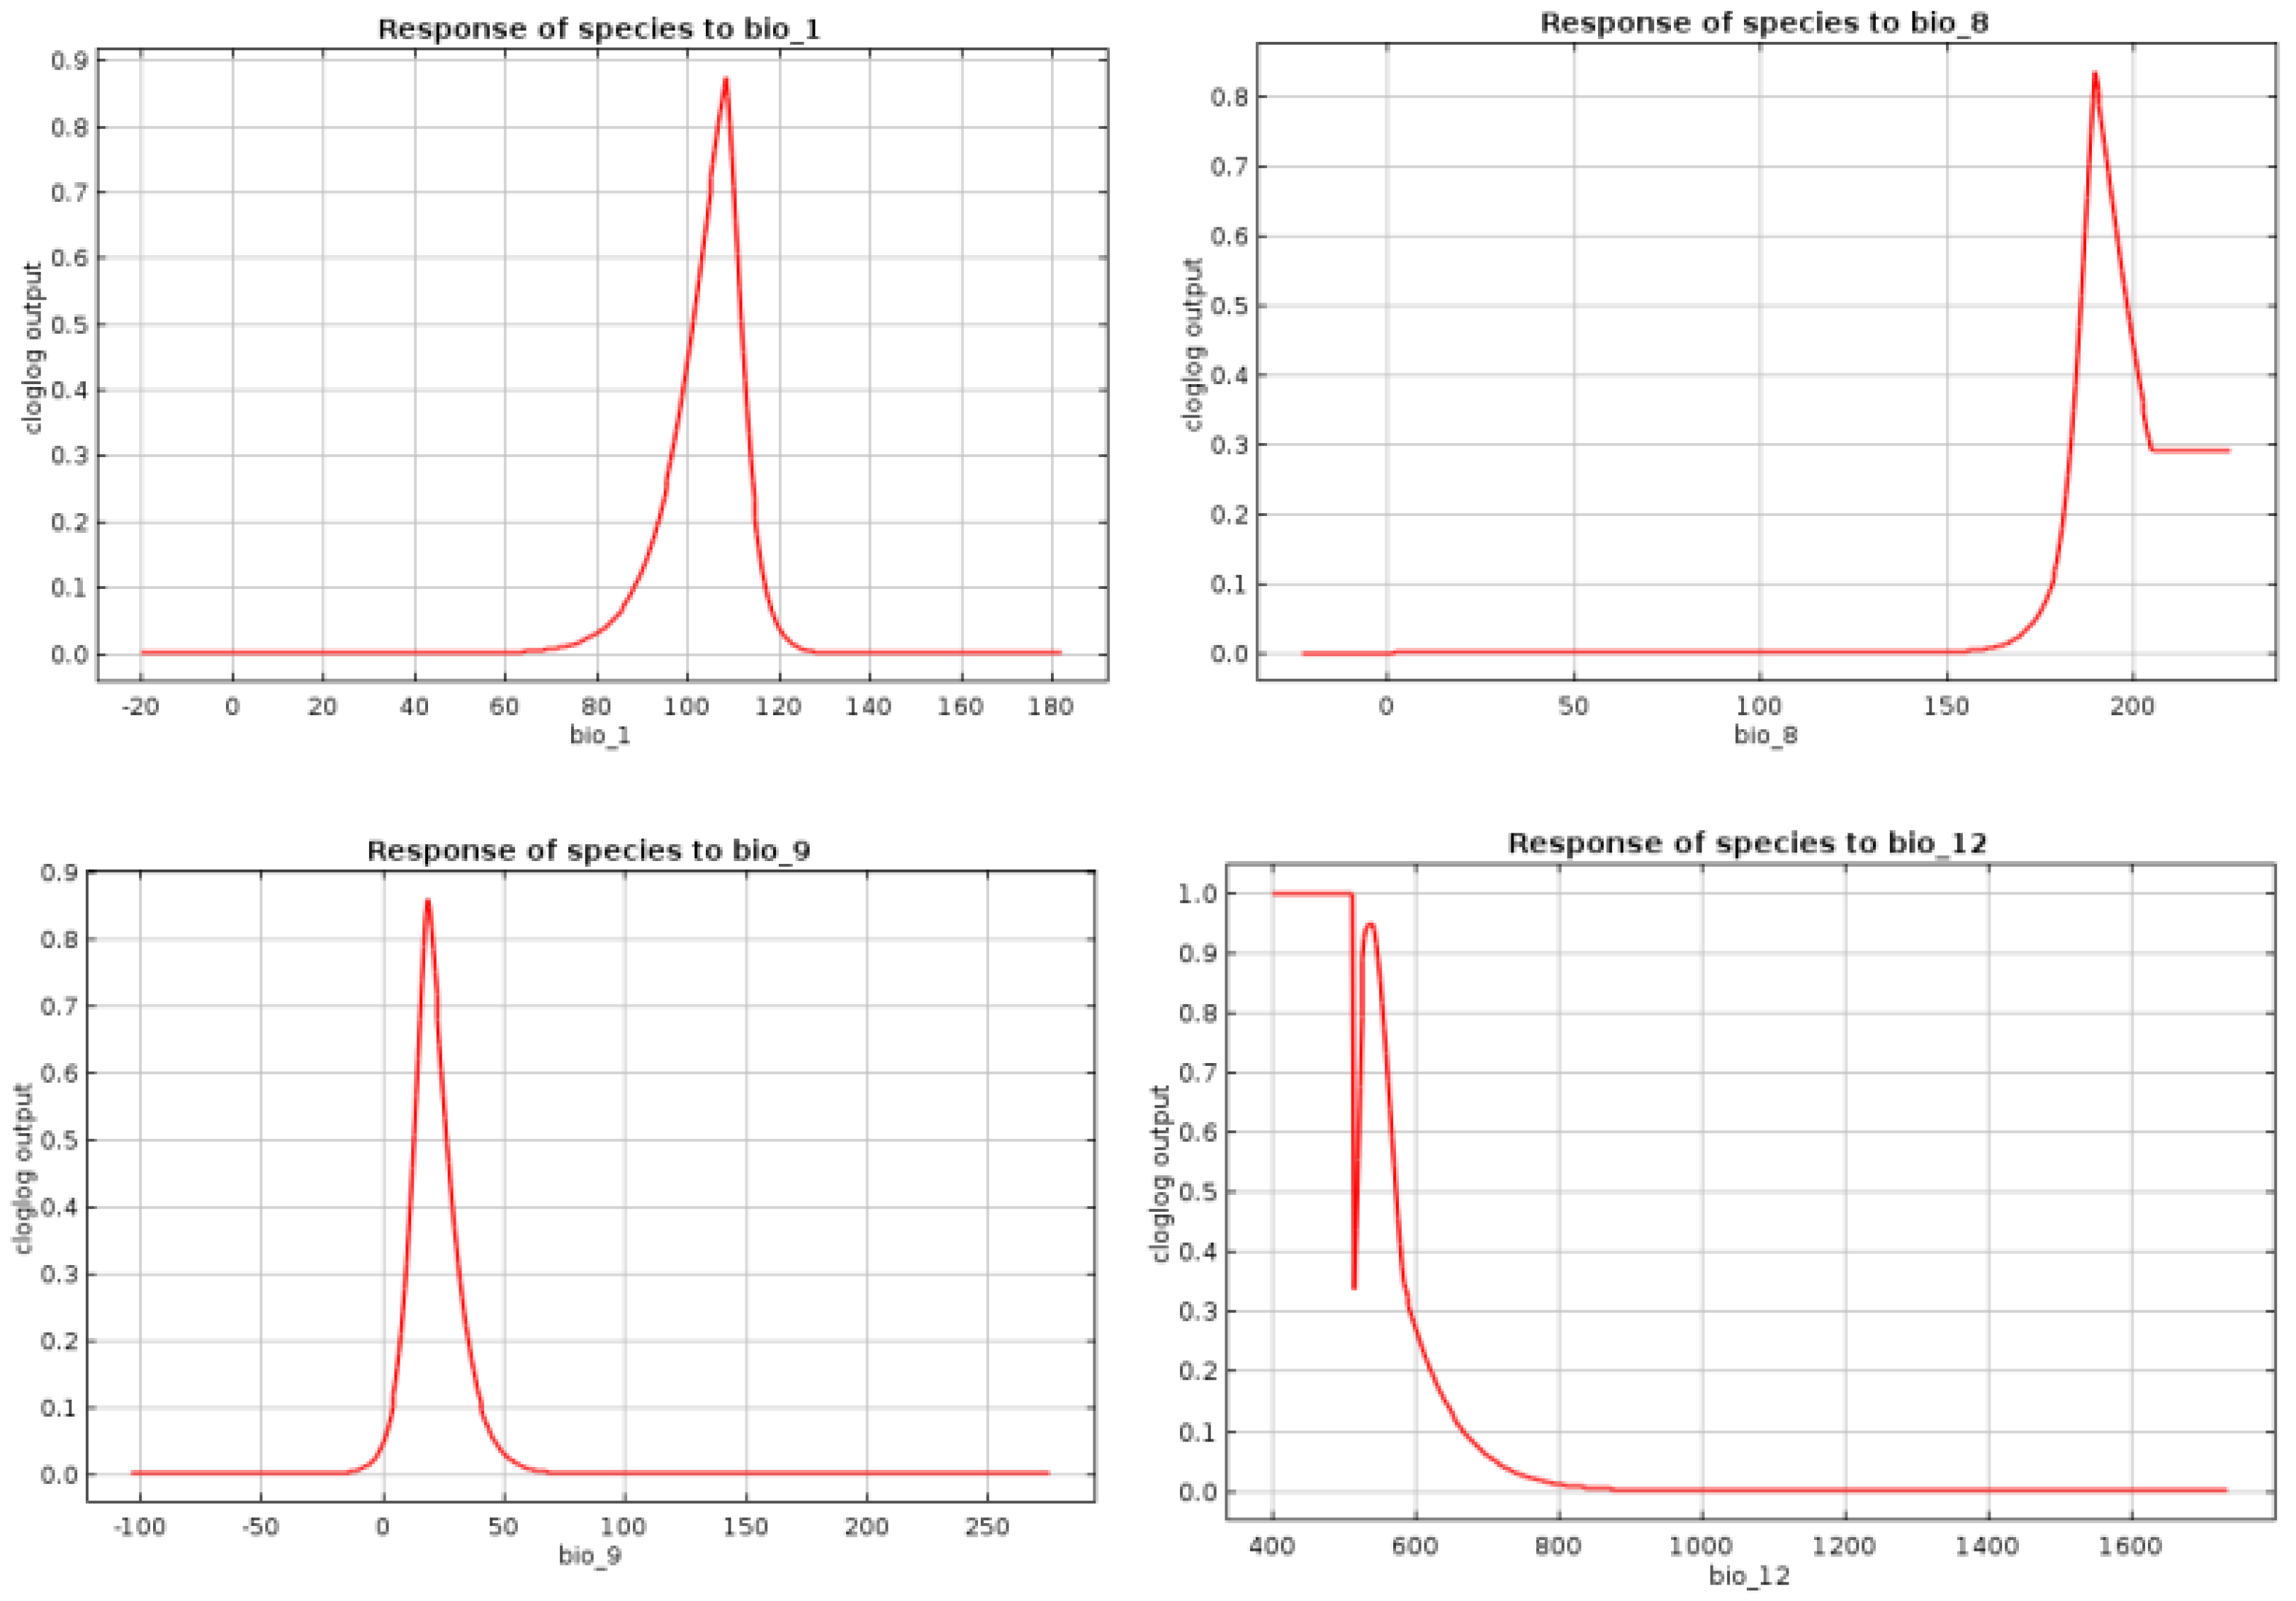
The pairwise Pearson’s correlation coefficients among the bioclimatic rasters cropped for the Carpathian Basin are shown in Appendix C, and the resulting dendrogam of the hierarchical clustering is included in Appendix D. This indicates that the following uncorrelated bioclimatic variables are potential predictors of the distribution of the Great Bustard within the Carpathian Basin, which we, thus, used for the MaxEnt modeling. The annual mean temperature (bio1), mean diurnal range (bio2), isothermality (bio3), temperature seasonality (bio4), annual precipitation (bio12) and its seasonality (bio15), and the precipitation of the warmest quarter (bio18) have been shown to be key predictors of steppe vegetation, the primary habitat of the Great Bustard [15], whereas the mean temperature of the wettest quarter (bio8) is important for the survival of the young birds and the mean temperature of the driest quarter (bio9) is indicative of the reproductive performance of the bustards [16]. The MaxEnt model applying only the above selected bioclimatic variables was highly predictive (AUC = 0.9511; Table 2). Further, the correlation coefficients among the selected bioclimatic variables were low (R2 < 0.027). The response curves for the bioclimatic variables are shown in Appendix E. Based on the variable importance levels, we chose to run MaxEnt again while applying the mean annual temperature, annual precipitation, mean temperature of the wettest quarter, and mean temperature of the driest quarter to be fitted on the test occurrence records. The resulting model proved to be highly predictive (AUC = 0.9375), which we, thus, used for further SDM projections.
3.3. Historical Distribution Range
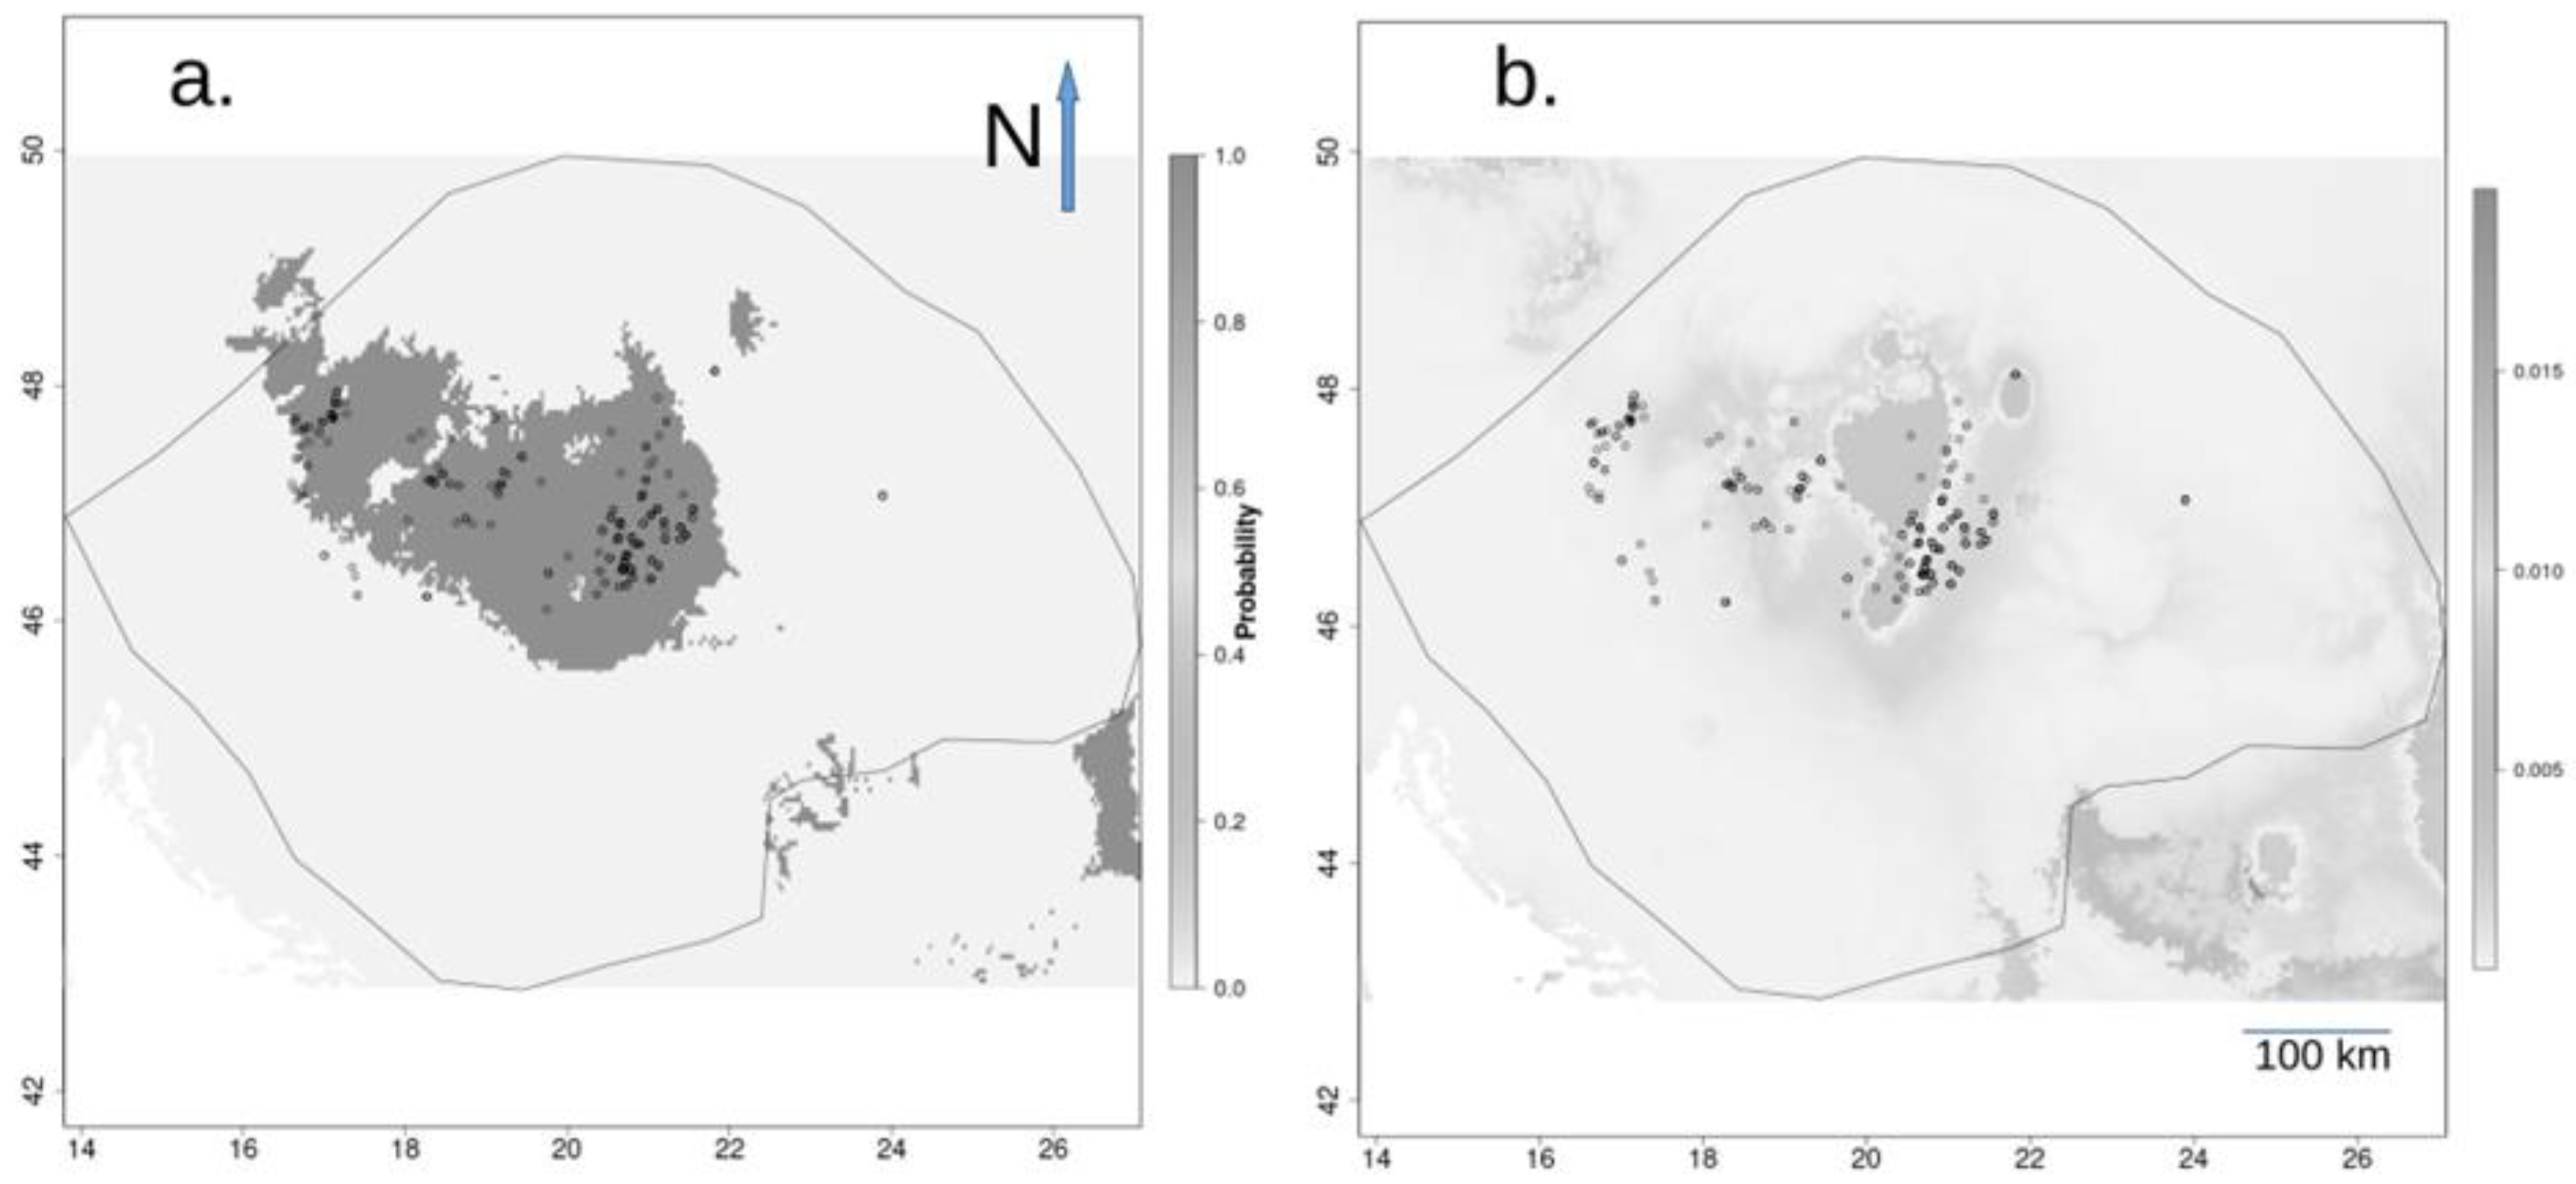
Based on the run outputs of MaxEnt exhibiting strong predictive metrics, all lowland areas of the Carpathian Basin are capable of harboring bustard populations (Figure 2a). Additionally, potential bustard habitats are predicted for Muntenia and Dobrodgea (Romania) and the Upper Thracian Plain (Bulgaria), for which no historical occurrence records are available.
3.4. Future Distribution Range
The projection of the MAXENT model onto future time periods (2021–2040) provided a highly predictive (AUC = 0.9361) raster that showed that the predicted range of the Great Bustard within the Great Plains is expected to suffer from strong contraction, whereas the other parts of the present range are predicted to be stable (Figure 2b).
4. Discussion
Our key results were as follows: (i) the most important bioclimatic predictors governing the distribution the Great Bustard are the annual mean temperature, mean temperatures of the wettest and driest quarters, as well as the annual precipitation; (ii) all lowland areas of the Carpathian Basin were suitable for the Great Bustard during the historical time periods; (iii) the SDM predictions showed the historical suitability of the Muntenia and Dobrodgea regions and the Upper Thracian Plain, so far of unknown importance for bustards, which are to be incorporated into conservation programs; (iv) the future projections predict a substantial decrease in the core distribution area, whereas the boundary areas are expected to remain stable. However, areas predicted to be climatically suitable in the past are not necessarily suitable presently, and additionally this does not infer habitat availability. Thus, species-specific conservation planning initiatives need to carefully consider overlaps between past and future climatic suitability and habitat availability.
The visualization of the occurrence locations showed that the positions of distribution areas and the related number of locations indicate the dominant historical role of the population in the southern part of the Southern Great Plain, which has lost its importance during modern times [32].
For all of the major bustard regions, the temporal dynamics of bustard occurrences show a marked peak between 1970 and 1989. This is probably explained by the introduction of bustard conservation management and the development of bustard-compatible agriculture, involving the legal protection and then the ban on hunting. This was complemented by the establishment of the Dévaványa Bustard Reserve in 1975, which catalyzed the population boost in the Southeastern Great Plain. Formerly, large populations suffered strong range contractions. For example, although nearly the whole of the Kis-Alföld region was occupied by the Great Bustard, occurrences during modern times have only been detected in the Moson Plain. The populations of the Southern Great Plain have experienced the steepest declines, as bustard occurrences have been completely lacking from the southern part of the Körös region during the past 30 year. The bustard populations completely disappeared from the Transdanubian region and northern Hungary, including the vicinity of the capital. Although spatial restructuring of the subpopulations has been documented during the past decades, the overall relationship among the population dynamics and range size was unaffected by such processes [17]. The most likely driver of this large-scale decline is the industrialization of the agricultural technologies, starting in the 1970s, and which is continuing currently at unprecedented rates. This has involved the development of heavy high-performance machinery, which has largely contributed to the strong decline in prey availability. Additionally, the establishment of power lines during modern times has further decreased the survival chances of bustards flying among habitat patches [17].
Bioclimatic Preferences
Out of the key bioclimatic drivers of the bustards’ ranges, the mean temperature of the driest quarter is expected to be important for chick survival. Indeed, the driest period includes the summer months in the study region, which includes the second half of the chick rearing period. Higher temperatures predict larger amounts of insect prey available for the young and play an important role in the thermoregulation of the young bustards [46].
Our SDM models showed that the mean temperature of the quarter with the largest amount of precipitation is an important predictor of the range of the Great Bustard within the Carpathian Basin. This period lasting from April to June in the study region overlaps with the breeding season of the Great Bustard, which implies the following mutual non-exclusive explanations. First, adequate temperatures drive prey availability, including insects and seeds from weeds and cereals. Indeed, longer cold spells during April might result in a significant decrease in the insects necessary for the protein uptake of the chicks. Second, whole bustard clutches can be annihilated by cold and rainy weather conditions, which are often supplemented by replacement clutches, which prolong and intensify breeding efforts and are expected to result in decreased fitness of the nesting females [47]. Third, the lekking behavior of the displaying males is observed during the beginning of this period, the success of which is strongly dependent on the weather, as adverse weather conditions result in decreased male fitness and breeding success. This might be shifted to later dates, thereby postponing the breeding, which can result in additional decreases in breeding success [48].
The annual mean temperature and the total amount of precipitation are important for both the feeding and reproduction of the Great Bustard and are also strong predictors of the distribution of steppe vegetation. The reproductive activities (both lekking and nesting) of the Great Bustard are connected to steppe areas interspersed with various cultivated plants, including legumes, alfalfa, rape, and cereals. While lekking is observed exclusively in pristine grasslands, the females nest mostly in neighboring agricultural lands, which provide a large variety of food resources and safety from predators during the incubation and rearing of the chick [48]. The lack of precipitation results in decreased prey availability and plant cover, indicating decreased amounts of nutrient resources and greater exposure to predators; in turn, exceedingly large amounts of precipitation contribute to decreased chick survival. Adequate levels of autumn precipitation are further needed for the development of the rape, which is extremely important for the survival chances of the overwintering birds and is strongly dependent on autumn rainfall. The field experience shows that during winters following dry autumn periods not allowing the development of rich rape fields, extremely cold spells might induce the partial migration of the Great Bustard to the Balkan Peninsula, where the mortality rates are high [13].
Our findings underline the importance of providing bioclimatic range predictions for ground-nesting birds of conservation importance, which can effectively inform conservation management, as shown by investigations on a wide range of taxa, including grouses, quails, and shorebirds [49,50,51]. These studies consistently demonstrate that species-specific conservation management initiatives require fine-tuned information for the predicted spatial distribution of threatened species. Indeed, this allows the optimization of the allocation of highly limited financial and human resources, which can consider present and future predictions of the presence or absence ranges calculated for the key management areas [21,52]. Our study indicates a significant reduction in the core area of the range of the Great Bustard projected for near-future time periods, which is of key conservation importance; this result suggests that species-specific conservation management initiatives targeting the protection of the Great Bustard should focus on the central part of the Great Plain, which affects the design of conservation area classifications and the spatial distribution of bustard-compatible agricultural planning initiatives.
Our work might be affected by a number of biases. First, we were not able to include land use changes in our species distribution model, as these are historically not available at reliably fine temporal and spatial resolutions. However, historical descriptions confirm that the Great Bustard consistently occupied natural grasslands or the same areas converted to traditional agricultural areas, which indicates the numeric stability of our SDM models at the spatial resolution we considered [32]. Second, although future predictions suffer from uncertainties to varying degrees, our projections show a highly supported SDM model as indicated by the related AUC values.
5. Conclusions
In summary, here we show that although the population of the Great Bustard has suffered considerable declines within the Carpathian Basin, both in terms of population and range size, the lowland areas of the region are still bioclimatically suitable for the survival of the species. This implies the relevance of continuing the species-specific conservation programs, which could also be extended to peripheral regions such as Muntenia, Dobrodgea, and the Upper Thracian Plain.
Author Contributions
Conceptualization, B.O. and Z.V.; methodology, Z.V.; data collection, B.O.; formal analysis, B.O. and Z.V.; writing—original draft preparation, B.O. and ZV. All authors have read and agreed to the published version of the manuscript.
Funding
This research received no external funding.
Data Availability Statement
Upon acceptance, Table S2 will be available in the Dryad repository: www.dryad.org (accessed on 17 November 2022).
Acknowledgments
We thank Project TetraClim for using the ELKH Cloud (https://science-cloud.hu/ (accessed on 17 November 2022)) for the computation of bioclimatic niches.
Conflicts of Interest
The authors declare no conflict of interest.
Appendix A. References for the Historical Occurrences of the Great Bustard within the Carpathian Region
A túzok az év madara. Magyar VADÁSZLAP, 2014/23/4, pp.215.
Túzok. Aquila, 1984/1-2, pp.61.
Alonso, J.C. and Palacín, C., 2010. The world status and population trends of the Great Bustard (Otis tarda). Chinese Birds, 1(2), pp.141-147.
Andrési, P., 2014. Az év madara 2014-ben, a túzok. Európa legnagyobb madara. Élet és tudomány, 2014/69/17, pp.518-520.
Andrési, P., 2014. Az év madara a túzok. Erdészeti lapok, 2014/149/4, pp.130.
Balsay, S., 2013. Túzok (Otis tarda) megfigyeléseim a Hanság környékén. Magyar apróvad közlemények, 2013/11, pp.107-112.
Bankovics, A., Boros, E., Németh, Á., Bíró, Cs., Bankovics, A., 2005. Reasons of the population increase of Great Bustard (Otis tarda) in the Kiskunság (Hungary). Aquila, pp.163-168.
Bankovics, A., 1996. A túzok (Otis tarda Linné, 1758) állományának növekedése a Kiskunsági Nemzeti Parkban. Állattani közlemények, 1996/81/1, pp.3-8.
Bankovics, A. and Lóránt, M., 2008. A túzok védelme Magyarországon, Összefoglaló jelentés a LIFE-Nature programról. Magyar Madártani és Természetvédelmi Egyesület (MME, BirdLife Hungary), Budapest, pp.3.
Barthos, Gy., 1928, Túzok Nagykanizsa határában. Aquila, 1928/34-35, pp.386.
Bodnár, B., 1924. A túzok táplálkozásáról. Aquila, 1924/30-31, pp.308.
S. M. Billerman, B. K. Keeney, P. G. Rodewald, and T. S. Schulenberg (Editors) (2022). Birds of the World. Cornell Laboratory of Ornithology, Ithaca, NY, USA. https://birdsoftheworld.org/bow/home accessed on 17 November 2022)
Boros, E., Széll, A., Kurpé, I., Németh, Á. 2005. Spatial differences and periodical changes in breeding biology parameters in Hungarian Great Bustard (Otis tarda) populations. Aquila, pp.203-210.
Chernel, I., 1917. A túzok (Otis tarda L.) Vasmegyében. Aquila, 1917/24, pp.268-282.
Csaba, J., 1939. Újabb túzok-adatok Vasmegyéből. Vasi szemle, 1939/6/1-2, pp.97-98.
Csath, A., 1922. Túzok fészkelése Kisperegen. Aquila, 1922/29, pp.173.
Demeter, L., 2001. Fiókaféltő magatartás megfigyelése egy túzok (Otis tarda) tyúknál. Túzok, 2001/6/2, pp.98-100.
Demeter, L., 2003. Eltérő viselkedés a túzok (Otis tarda) esetében. Aquila, 2003/109-110, pp.166-167.
Demeter, L., Fatér, I., Szép, T., 1994. A fészek-pusztulások mértéke és oka magyarországi túzok (Otis tarda) populációkban. Ornis Hungarica, 1994/4, pp.19-24.
Demeter, L., Fatér, I., Szép, T., 1995. A túzok (Otis tarda) fészkeinek térbeli csoportosulása és magányos kakasok Kelet-Magyarországon. Aquila, 1995/102, pp.53-60.
Dr. Juhász, L., 2012. A magyar puszta ékessége: A túzok. Díszmadár magazin, 2012/19/6, pp.24-29.
Dr. Keve, A., 1972. Fodor Tamás—Nagy Lajos—Sterbetz István: A túzok [könyvismertetés]. Búvár (1960-1989), 1972/17/1, pp.62-63.
Dr. Kovács, G., 1986. Túzok (Otis tarda) kakast támadó bíbicek (Vanellus vanellus) és néhány egyéb érdekes viselkedési adat. Madártani Tájékoztató, 1986/ápr-szept, pp.52-53.
Ecsedi, Z. and Kovács, G., 1999. A túzok (Otis tarda) védelme a Hortobágyon. Túzok, 1999/4/3, pp.91-93.
Éhik, Gy., 1934. Megfogyatkozott-e a túzok hazánkban? Természettudományiközlöny, 1934/66/999-1000, pp.134-137.
Faragó, S., 1973. A túzok (Otis tarda) fészkelésbiológiája Magyarországon. Állattani közlemények, 1973/70/1-4, pp.33-38.
Faragó, S., 1985. A túzok (Otis t. tarda L., 1758) fészkelésökológiai vizsgálatai a Dévaványai Tájvédelmi Körzetben. I. Összehasonlító mikroklíma-vizsgálatok. Aquila, 1985/92, pp.167-173.
Faragó, S., 1987. A túzok-félék (Otididae) előfordulása és elterjedése az Alpokalján. Praenorica folia historico-naturalia, 1987/2, pp.149-158.
Faragó, S., 1988. Magyarországi túzok (Otis tarda) állománya az 1987 évi februári felmérés alapján. Madártani tájékoztató, 1988/1-2/jan-dec, pp.8-11.
Faragó, S., 1988. Túzok (Otis tarda) elhullások 1986/87 telén Magyarországon. Madártani tájékoztató, 1988/1-2/jan-dec, pp.14-17.
Faragó, S., 1990. A kemény telek hatása Magyarország túzok (Otis tarda L.) állományára. Állattani közlemények, 1990/76/1-4, pp.51-62.
Faragó, S., 1991. Adatok a túzok (Otis tarda L.) csibék anyag- és energiaforgalmának ismeretéhez. Állattani közlemények, 1991/77/1-4, pp.43-52.
Faragó, S., 1992. A túzok (Otis tarda) fészekaljnagysága Magyarországon. Aquila, 1992/99, pp.69-84.
Faragó, S., 2005. One-hundred-year trend of the Great Bustard (Otis tarda) population in the Kisalföld region. Aquila, pp.153-162.
Faragó, S., 2008. Adalékok a túzok (Otis tarda) és a reznek (Tetrax tetrax) hansági előfordulásához és elterjedéséhez az 1930-1960-as években—Király Iván “Szemelvények a Hanság Madármegfigyelő Állomás (M. O. Sz.) munkálataiból” c. kézirata tükrében. Magyar apróvad közlemények, 2008/10, pp.13-42.
Faragó, S., 2009. A történeti madártan jelentősége a regionális kutatásban a túzok (Otis tarda) kisalföldi állományának példáján = Importance of historical ornithology in the regional investigation—After example of the Great Bustard (Otis tarda) population in Little Hung. Szélkiáltó, 2009/14/14, pp.19.
Faragó, S., Bodnár, M., Borbáth, P., Boros, E., Fáter, I., Kapocsi, I., Kurpé, I., Motkó, B., Mödlinger, P., Széll, A., Tóth, L., 2013. Program a túzok (Otis tarda) védelmére Magyarországon. Magyar apróvad közlemények, 2013/11, pp.59-106.
Faragó, S., and Giczi, F., 1997. Új lehetőségek a túzok (Otis tarda) védelmében. Egy esettanulmány: a Moson Project. Magyar apróvad közlemények, 1997/1, pp.187-195.
Faragó, S., and Kalmár, S., 2006. “A túzok védelme Magyarországon” Life-Nature Project 2005. évi monitoring jelentése. Magyar apróvad közlemények, 2006/Supplement i-v, pp.1-142.
Faragó, S., and Kalmár, S., 2007. “A túzok védelme Magyarországon” Life-Nature Project 2006. évi monitoring jelentése. Magyar apróvad közlemények, 2007/Supplement, pp.1-184.
Faragó, S., Spakovszky, P., Raab, R., 2014. Conservation of Great Bustard (Otis tarda) population of the Mosoni-Plain—A success story. Ornis Hungarica, pp.14-31.
Fatér, I., 1995. “Elmegy a fecske, marad a túzok”. Madártávlat, 1995/2/6, pp.6-7.
Fidrich, R., 1999. Veszélyben az orosz túzok-állomány. Madártávlat, 1999/5/4, pp.15.
Fodor, T., Nagy, L., Sterbetz, I., 1971. A túzok. Mezőgazdasági Kiadó Budapest.
Jaczó, I., 1940. Túzok a Balaton jegén. Természettudományi közlöny, 1940/72/1107, pp.190-191.
K.J., 1877. A túzok hasznos állat. Természettudományi közlöny, 1877/9/91, pp.118-119.
Kádár, Z., 1999. Lőhető-e a túzok? Erdészeti lapok, 1999/134/Klnsz, pp.36-B3.
Kovács, G., 1993. A túzok (Otis tarda) állományának és élőhelyének vizsgálata a Hortobágyon és környékén 1975-1992 között. Aquila, 1993/100, pp.151-159.
Kovács, G., 1995. Túzok (Otis tarda) tojó különös viselkedése a dürgőhelyen. Aquila, 1995/102, pp.216.
Kovács, G., 1997. Fiatal túzok kakasok (Otis tarda). Aquila, 1997/103-104, pp.125.
Kovács, G., 2003. Tojó túzok (Otis tarda) dürgésének megfigyelése. Aquila, 2003/109-110, pp.166.
Körmendy, B., Illés, J., Glávits, R., Vladov, Sz., 1988. An outbreak of Yersinia pseudotuberculosis infection in a bustard (Otis tarda) flock. Acta veterinaria Hungarica, pp.173-176.
Kretzoi, M., 1961. Történelem előtti túzok-lelet és a túzokfélék története. Aquila, 1961/67-68, pp.189-190.
Magyar, G. and Márta, V., 1995. Védelmi törekvések a hazai túzokállomány megmentésére. Süni, és a természet, Vác, 1995/2/5, pp.34.
Mödlinger, P., Chobot, J., Mödlinger, É., Péczely, P., 1999. A túzok (Otis tarda L., 1758) zárttéri szaporításának első eredményei a Gödöllői Agrártudományi Egyetem Sződi Túzoktelepén. Aquila, 1999/105-106, pp.77-91.
Práger, A., 2005. Population estimates, trends and synchronised census of Great Bustard (Otis tarda) in Hungary. Aquila, pp.143-150.
Raab, R., Spakovszky, P., Julius, E., 2014. Az elektromos légvezetékek hatása a nyugat-pannon túzokállományra (Otis tarda) és az ausztriai túzokvédelmi LIFE+ projekt akciói. Szélkiáltó, pp.58.
Rácz, B., 1919. Gólyáktól agyonhajszolt fiatal tuzok. Aquila, 1919/26, pp.123.
Réthy, Zs., 1975. Túzok génbank Békés megyében. Múzeumi híradó: A Békés Megyei Múzeumi Szervezet tájékoztatója, 1975/1, pp.17-21.
Schmidt, E., 1972. Fodor Tamás—Nagy Lajos -Sterbetz István: A túzok. (Mezőgazdasági Könyvkiadó V., Budapest, pp. 156). Aquila, 1972/78-79, pp.243-244.
Schmidt, E., 1984. A túzok, a magyar puszta fejedelme. Honismeret, 1984/12/5, pp.41-44.
Somfalvi, E., 2013. Csak 12 túzok. Magyar VADÁSZLAP, 2013/22/6, pp.355-357.
Spakovszky, P., 2009. Túzok (Otis tarda) állományának monitoringja a LIFE programban = Monitoring of the Great Bustard (Otis tarda) population in the LIFE-project. Szélkiáltó, 2009/14/14, pp.21.
Spakovszky, P., Pellinger, A., Burda, B., 2011. A mosoni túzok (Otis tarda) állomány hosszú távú fenntartásának természetvédelmi problémái. Ornis Hungarica, 2011/9, pp.133-140.
Spakovszky, P., Raab, R., Julius, E., 2012. Túzok (Otis tarda) élőhelyek fragmentálódása a Mosoni- síkon. Szélkiáltó, 2012/15, pp.15.
Sterbetz, I., 1961. Túzok-génbank Békés megyében. Békés Megyei Természetvédelmi Évkönyv, 1961/1, pp.113-129.
Sterbetz, I., 1964. A magyar túzok (Otis t. tarda L.) természetvédelmi problémái. Állattani közlemények, 1964/51/1-4, pp.135-139.
Sterbetz, I., 1969. A magyar túzok elgondolkoztató statisztikája. Búvár (1960-1989), 1969/14/3, pp.149-151.
Sterbetz, I., 1975. A kelet-magyarországi túzok (Otis t. tarda L.) populációk területigényének alakulása. Aquila, 1975/82, pp.155-163.
Sterbetz, I., 1976. A túzok (Otis t.tarda L.) környezete Magyarországon. Aquila, 1976/83, pp.53-73.
Sterbetz, I., 1979. Vizsgálatok a túzok (Otis t. tarda L.) táplálkozásáról 1977/78 téli aspektusában. Aquila, 1979/86, pp.93-100.
Sterbetz, I.1980. A túzok (Otis t. tarda L.) és a reznek (Otis tetrax orientalis Hart.) Békés megyében. A Békés Megyei Múzeumok közleményei, 1980/6, pp.131-143.
Sterbetz, I., 1980. Comparative investigations into the reproduction behaviour of monogamous, polygamous and unmated Great Bustard populations in South-Eastern Hungary = Monogám, poligám és pár nélküli túzokpopulációk szaporodási magatartásának összehasonlító vizsgálata Délkelet Magyarországon. Aquila, pp.31-47.
Sterbetz, I., 1984. A magyarországi túzok (Otis t. tarda L., 1758) populációk életképességének vizsgálta 1971-1982 időközéből. Aquila, 1984/91, pp.93-97.
Sterbetz, I., 1987. Tapasztalatok metszéspontjában: A nagy túzok és a reznek. Búvár (1960-1989), 1987/42/1, pp.29.
Sterbetz, I., 1999. A túzok (Otis tarda L., 1758) egy dél-magyarországi állományának ötven éves vizsgálata. Aquila, 1999/105-106, pp.71-75.
Szimuly, Gy., 1989. Túzok (Otis tarsa) előfordulási adatok magyar-osztrák határsávból 1987-ben. Madártani tájékoztató, 1989/3-4/júl-dec, pp.11-12.
Tóth, J., 2014. A túzok helyzete itthon és Európában. Élet és tudomány, 2014/69/17, pp.517.
Urbán, S., 1979. Occurrence of Great Bustard on the Island of Szentendre. Aquila, pp.191.
Vadász, Cs. and Lóránt, M., 2014. Key mortality causes of the Great Bustard (Otis tarda) in Central Hungary: an analysis of known fatalities. Ornis Hungarica, pp.32-41.
Vastag, G., 1978. Aktív természetvédelem: A túzok mesterséges keltetése és nevelése: A Vadbiológiai Kutató Állomáson. Búvár (1960-1989), 1978/33/6, pp.263-266.
Végvári, Zs. and Kapocsi, I., 2005. Habitat use, nest site selection and conservation status of the Great Bustard (Otis tarda) in the Hortobágy National Park between 1999-2004. Aquila, pp.169-174.
Vöröss, L.Zs., 1988. Jelentés a “túzok éve 86” akció tapasztalatairól Fejér megyében. Madártani tájékoztató, 1988/1-2/jan-dec, pp.12-14.
Wachenhusen, A., 1984. Túzok. Aquila, 1984/3-4, pp.165.
Appendix B. Occurrence records of the Great Bustard between 1828–2014 within the Carpathian Basin
Upon acceptance, this dataset will be available in the Dryad repository: www.dryad.org (accessed on 17 November 2022).
Appendix C. Pearson’s Correlation Coefficients among Rasters of Bioclimatic Variables
| bio_1 | bio_10 | bio_11 | bio_12 | bio_13 | bio_14 | bio_15 | bio_16 | bio_17 | bio_18 | bio_19 | bio_2 | bio_3 | bio_4 | bio_5 | bio_6 | bio_7 | bio_8 | bio_9 | |
| bio_1 | 1.000 | 0.975 | 0.929 | −0.332 | −0.506 | −0.189 | −0.424 | −0.527 | −0.172 | −0.798 | 0.027 | 0.463 | 0.296 | 0.209 | 0.969 | 0.857 | 0.333 | 0.401 | 0.580 |
| bio_10 | 0.975 | 1.000 | 0.829 | −0.463 | −0.601 | −0.321 | −0.324 | −0.623 | −0.310 | −0.815 | −0.128 | 0.530 | 0.183 | 0.416 | 0.991 | 0.739 | 0.511 | 0.517 | 0.471 |
| bio_11 | 0.929 | 0.829 | 1.000 | −0.049 | −0.268 | 0.073 | −0.544 | −0.280 | 0.100 | −0.674 | 0.310 | 0.263 | 0.424 | −0.163 | 0.825 | 0.976 | −0.022 | 0.144 | 0.719 |
| bio_12 | −0.332 | −0.463 | −0.049 | 1.000 | 0.897 | 0.906 | −0.304 | 0.906 | 0.924 | 0.629 | 0.881 | −0.479 | 0.137 | −0.740 | −0.453 | 0.049 | −0.712 | −0.761 | 0.241 |
| bio_13 | −0.506 | −0.601 | −0.268 | 0.897 | 1.000 | 0.687 | 0.095 | 0.988 | 0.709 | 0.751 | 0.707 | −0.521 | 0.002 | −0.622 | −0.611 | −0.185 | −0.649 | −0.730 | 0.104 |
| bio_14 | −0.189 | −0.321 | 0.073 | 0.906 | 0.687 | 1.000 | −0.599 | 0.684 | 0.994 | 0.419 | 0.886 | −0.384 | 0.192 | −0.688 | −0.298 | 0.174 | −0.642 | −0.725 | 0.288 |
| bio_15 | −0.424 | −0.324 | −0.544 | −0.304 | 0.095 | −0.599 | 1.000 | 0.109 | −0.592 | 0.279 | −0.528 | −0.090 | −0.355 | 0.321 | −0.371 | −0.584 | 0.189 | 0.122 | −0.405 |
| bio_16 | −0.527 | −0.623 | −0.280 | 0.906 | 0.988 | 0.684 | 0.109 | 1.000 | 0.708 | 0.775 | 0.695 | −0.536 | 0.001 | −0.641 | −0.631 | −0.194 | −0.667 | −0.727 | 0.091 |
| bio_17 | −0.172 | −0.310 | 0.100 | 0.924 | 0.709 | 0.994 | −0.592 | 0.708 | 1.000 | 0.415 | 0.915 | −0.394 | 0.204 | −0.713 | −0.289 | 0.201 | −0.663 | −0.731 | 0.332 |
| bio_18 | −0.798 | −0.815 | −0.674 | 0.629 | 0.751 | 0.419 | 0.279 | 0.775 | 0.415 | 1.000 | 0.209 | −0.376 | −0.090 | −0.350 | −0.801 | −0.612 | −0.395 | −0.362 | −0.458 |
| bio_19 | 0.027 | −0.128 | 0.310 | 0.881 | 0.707 | 0.886 | −0.528 | 0.695 | 0.915 | 0.209 | 1.000 | −0.403 | 0.211 | −0.728 | −0.126 | 0.401 | −0.676 | −0.754 | 0.573 |
| bio_2 | 0.463 | 0.530 | 0.263 | −0.479 | −0.521 | −0.384 | −0.090 | −0.536 | −0.394 | −0.376 | −0.403 | 1.000 | 0.592 | 0.488 | 0.606 | 0.090 | 0.760 | 0.573 | −0.062 |
| bio_3 | 0.296 | 0.183 | 0.424 | 0.137 | 0.002 | 0.192 | −0.355 | 0.001 | 0.204 | −0.090 | 0.211 | 0.592 | 1.000 | −0.383 | 0.269 | 0.361 | −0.060 | 0.011 | 0.225 |
| bio_4 | 0.209 | 0.416 | −0.163 | −0.740 | −0.622 | −0.688 | 0.321 | −0.641 | −0.713 | −0.350 | −0.728 | 0.488 | −0.383 | 1.000 | 0.404 | −0.282 | 0.929 | 0.671 | −0.330 |
| bio_5 | 0.969 | 0.991 | 0.825 | −0.453 | −0.611 | −0.298 | −0.371 | −0.631 | −0.289 | −0.801 | −0.126 | 0.606 | 0.269 | 0.404 | 1.000 | 0.730 | 0.535 | 0.528 | 0.451 |
| bio_6 | 0.857 | 0.739 | 0.976 | 0.049 | −0.185 | 0.174 | −0.584 | −0.194 | 0.201 | −0.612 | 0.401 | 0.090 | 0.361 | −0.282 | 0.730 | 1.000 | −0.188 | 0.044 | 0.733 |
| bio_7 | 0.333 | 0.511 | −0.022 | −0.712 | −0.649 | −0.642 | 0.189 | −0.667 | −0.663 | −0.395 | −0.676 | 0.760 | −0.060 | 0.929 | 0.535 | −0.188 | 1.000 | 0.705 | −0.258 |
| bio_8 | 0.401 | 0.517 | 0.144 | −0.761 | −0.730 | −0.725 | 0.122 | −0.727 | −0.731 | −0.362 | −0.754 | 0.573 | 0.011 | 0.671 | 0.528 | 0.044 | 0.705 | 1.000 | −0.278 |
| bio_9 | 0.580 | 0.471 | 0.719 | 0.241 | 0.104 | 0.288 | −0.405 | 0.091 | 0.332 | −0.458 | 0.573 | −0.062 | 0.225 | −0.330 | 0.451 | 0.733 | −0.258 | −0.278 | 1.000 |
Appendix D. Dendrogram of the Hierarchical Clustering for the Pearson’s Correlation Coefficients among Rasters of Bioclimatic Variables
Figure A1.
Dendrogram of the Hierarchical Clustering for the Pearson’s Correlation Coefficients among Rasters of Bioclimatic Variables.
Figure A1.
Dendrogram of the Hierarchical Clustering for the Pearson’s Correlation Coefficients among Rasters of Bioclimatic Variables.

Appendix E. Response Curves of the Selected Bioclimatic Variables
Figure A2.
Response Curves of the Selected Bioclimatic Variables.

References
- Cahill, A.E.; Aiello-Lammens, M.E.; Fisher-Reid, M.C.; Hua, X.; Karanewsky, C.J.; Yeong Ryu, H.; Sbeglia, G.C.; Spagnolo, F.; Waldron, J.B.; Warsi, O.; et al. How does climate change cause extinction? Proc. R. Soc. B Biol. Sci. 2013, 280, 20121890. [Google Scholar] [CrossRef] [PubMed]
- Moritz, C.; Agudo, R. The future of species under climate change: Resilience or decline? Science 2013, 341, 504–508. [Google Scholar] [CrossRef] [PubMed]
- Lovejoy, T.E.; Hannah, L.J. (Eds.) Biodiversity and Climate Change; Yale University Press: New Haven, United States, 2019. [Google Scholar]
- Jackson, S.T.; Sax, D.F. Balancing biodiversity in a changing environment: Extinction debt, immigration credit and species turnover. Trends Ecol. Evol. 2019, 2010, 153–160. [Google Scholar] [CrossRef] [PubMed]
- Santos, M.J.; Smith, A.B.; Dekker, S.C.; Eppinga, M.B.; Leitão, P.J.; Moreno-Mateos, D.; Morueta-Holme, N.; Ruggeri, M. The role of land use and land cover change in climate change vulnerability assessments of biodiversity: A systematic review. Landsc. Ecol. 2021, 36, 3367–3382. [Google Scholar] [CrossRef]
- Dawson, T.P.; Jackson, S.T.; House, J.I.; Prentice, I.C.; Mace, G.M. Beyond Predictions: Biodiversity Conservation in a Changing Climate. Science 2011, 2011, 53–58. [Google Scholar] [CrossRef] [Green Version]
- Santangeli, A.; Lehikoinen, A.; Bock, A.; Peltonen-Sainio, P.; Jauhiainen, L.; Girardello, M.; Valkama, J. Stronger response of farmland birds than farmers to climate change leads to the emergence of an ecological trap. Biol. Conserv. 2018, 217, 166–172. [Google Scholar] [CrossRef]
- Estrada, A.; Delgado, M.P.; Arroyo, B.; Traba, J.; Morales, M.B. Forecasting large-scale habitat suitability of European bustards under climate change: The role of environmental and geographic variables. PLoS ONE 2016, 11, 0149810. [Google Scholar] [CrossRef] [Green Version]
- Kubelka, V.; Šálek, M.; Tomkovich, P.; Végvári, Z.; Freckleton, R.P.; Székely, T. Global pattern of nest predation is disrupted by climate change in shorebirds. Science 2018, 362, 680–683. [Google Scholar] [CrossRef] [Green Version]
- Araújo, M.B.; Pearson, R.G.; Rahbek, C. Equilibrium of species’ distributions with climate. Ecography 2005, 28, 693–695. [Google Scholar] [CrossRef]
- Porfirio, L.L.; Harris, R.M.; Lefroy, E.C.; Hugh, S.; Gould, S.F.; Lee, G.; Bindoff, N.L.; Mackey, B. Improving the use of species distribution models in conservation planning and management under climate change. PLoS ONE 2014, 9, e113749. [Google Scholar] [CrossRef]
- Alonso, J.C.; Palacín, C. The world status and population trends of the Great Bustard (Otis tarda). Chin. Birds 2010, 1, 141–147. [Google Scholar] [CrossRef] [Green Version]
- Alonso, J.C. The Great Bustard: Past, present and future of a globally threatened species. Ornis Hung. 2014, 22, 1–13. [Google Scholar] [CrossRef] [Green Version]
- Mi, C.; Huettmann, F.; Sun, R.; Guo, Y. Combining occurrence and abundance distribution models for the conservation of the Great Bustard. PeerJ 2017, 5, 4160. [Google Scholar] [CrossRef] [PubMed] [Green Version]
- Lengyel, S.; Varga, K.; Kosztyi, B.; Lontay, L.; Déri, E.; Török, P.; Tóthmérész, B. Grassland restoration to conserve landscape-level biodiversity: A synthesis of early results from a large-scale project. Appl. Veg. Sci. 2012, 15, 264–276. [Google Scholar] [CrossRef]
- Deák, B.; Valkó, O.; Török, P.; Tóthmérész, B. Factors threatening grassland specialist plants-A multi-proxy study on the vegetation of isolated grasslands. Biol. Conserv. 2016, 204, 255–262. [Google Scholar] [CrossRef]
- Faragó, S.; Végvári, Z. Túzok. In Magyarország Madáratlasza; Agrárminisztérium; Szép, T., Csörgő, T., Halmos, G., Lovászi, P., Nagy, K., Schmidt, A., Eds.; Magyar Madártani és Természetvédelmi Egyesület: Budapest, Hungary, 2021. [Google Scholar]
- Szabó, K.; Bozsó, M.; Boros, E.; Pénzes, Z. A Túzok Hazai Populációinak Genetikai Változatossága [Genetic Diversity of the Hungarian Great Bustard Populations]. A Kárpát-Medence Állatvilágának Kialakulása [The Evolution of the Fauna in Carpathian Basin]; Magyar Természettudományi Múzeum: Budapest, Hungary, 2007; pp. 297–302. [Google Scholar]
- Larrosa, C.; Carrasco, L.R.; Milner-Gulland, E.J. Unintended feedbacks: Challenges and opportunities for improving conservation effectiveness. Conserv. Lett. 2016, 9, 316–326. [Google Scholar] [CrossRef] [Green Version]
- Loiselle, B.A.; Howell, C.A.; Graham, C.H.; Goerck, J.M.; Brooks, T.; Smith, K.G.; Williams, P.H. Avoiding pitfalls of using species distribution models in conservation planning. Conserv. Biol. 2003, 17, 1591–1600. [Google Scholar] [CrossRef]
- Villero, D.; Pla, M.; Camps, D.; Ruiz-Olmo, J.; Brotons, L. Integrating species distribution modelling into decision-making to inform conservation actions. Biodivers. Conserv. 2017, 26, 251–271. [Google Scholar] [CrossRef]
- Varga, Z. Geographical patterns of biological diversity in the Palaearctic Region and the Carpathian Basin. Acta Zool. Acad. Sci. Hung. 1995, 41, 71–92. [Google Scholar]
- Billerman, B.; Keeney, K.; Rodewald, P.G.; Schulenberg, T.S. (Eds.) Birds of the World; Cornell Laboratory of Ornithology: Ithaca, NY, USA, 2022. [Google Scholar]
- Pinto, M.; Rocha, P.; Moreira, F. Long-term trends in great bustard (Otis tarda) populations in Portugal suggest concentration in single high quality area. Biol. Conserv. 2005, 124, 415–423. [Google Scholar] [CrossRef]
- Kessler, M. Status of the Western Great Bustard Otis tarda tarda in Asia, and its significance to an updated estimate of the global population of Great Bustards. Sandgrouse Great Bustard Spec. Issue 2022, 44, 6. [Google Scholar]
- Alonso, J.C.; Magaña, M.; Palacín, C.; Martín, C.A. Correlates of male mating success in great bustard leks: The effects of age, weight, and display effort. Behav. Ecol. Sociobiol. 2010, 64, 1589–1600. [Google Scholar] [CrossRef]
- Hijmans, R.J. Raster: Geographic Data Analysis and Modeling. 2021, R package Version 3.5-9. Available online: https://CRAN.R-project.org/package=raster (accessed on 17 November 2022).
- Guarino, M.V.; Sime, L.; Schroeder, D.; Ridley, J. The first 250 years of the Heinrich 11 iceberg discharge: Last Interglacial HadGEM3-GC3. 1 simulations for CMIP6-PMIP4. Clim. Past Discuss. 2022, 1–26. [Google Scholar]
- Phillips, S.J.; Dudík, M. Modeling of species distributions with MaxEnt: New extensions and a comprehensive evaluation. Ecography 2008, 31, 161–175. [Google Scholar] [CrossRef]
- Philips, S.; Dudik, M.; Schapire, R. Maxent Software, Version 3.3. 3e; Global Biodiversity Information Facility: Copenhagen, Denmark, 2010. [Google Scholar]
- Kramer-Schadt, S.; Niedballa, J.; Pilgrim, J.D.; Schröder, B.; Lindenborn, J.; Reinfelder, V.; Stillfried, M.; Heckmann, I.; Scharf, A.K.; Augeri, D.M.; et al. The importance of correcting for sampling bias in MaxEnt species distribution models. Divers. Distrib. 2013, 19, 1366–1379. [Google Scholar] [CrossRef]
- Sterbetz, I. A túzok (Otis t.tarda L.) környezete Magyarországon. Aquila 1976, 1976, 53–73. [Google Scholar]
- Mateo-Tomas, P.; Olea, P.P. Anticipating knowledge to inform species management: Predicting spatially explicit habitat suitability of a colonial vulture spreading its range. PLoS ONE 2010, 5, e12374. [Google Scholar] [CrossRef] [Green Version]
- Shcheglovitova, M.; Anderson, R.P. Estimating optimal complexity for ecological niche models: A jackknife approach for species with small sample sizes. Ecol. Model. 2013, 269, 9–17. [Google Scholar] [CrossRef]
- Phillips, S.J.; Elith, J. POC plots: Calibrating species distribution models with presence-only data. Ecology 2010, 91, 2476–2484. [Google Scholar] [CrossRef]
- Fielding, A.H.; Bell, J.F. A review of methods for the assessment of prediction errors in conservation presence/absence models. Environ. Conserv. 1997, 24, 38–49. [Google Scholar] [CrossRef]
- Radosavljevic, A.; Anderson, R.P. Making better Maxent models of species distributions: Complexity, overfitting and evaluation. J. Biogeogr. 2014, 41, 629–643. [Google Scholar] [CrossRef]
- Roberts, D.R.; Bahn, V.; Ciuti, S.; Boyce, M.S.; Elith, J.; Guillera-Arroita, G.; Hauenstein, S.; Lahoz-Monfort, J.J.; Schröder, B.; Thuiller, W.; et al. Cross-validation strategies for data with temporal, spatial, hierarchical, or phylogenetic structure. Ecography 2017, 40, 913–929. [Google Scholar] [CrossRef] [Green Version]
- R Core Team. R: A Language and Environment for Statistical Computing; R Foundation for Statistical Computing: Vienna, Austria, 2021; Available online: https://www.R-project.org/ (accessed on 17 November 2022).
- Wickham, H.; Bryan, J. Readxl: Read Excel Files. R Package Version 1.3.1. 2019. Available online: https://CRAN.R-project.org/package=readxl (accessed on 17 November 2022).
- Bivand, R.; Lewin-Koh, N. Maptools: Tools for Handling Spatial Objects. R Package Version 1.1-1. 2021. Available online: https://CRAN.R-project.org/package=maptools (accessed on 17 November 2022).
- Bivand, R.; Rundel, C. Rgeos: Interface to Geometry Engine—Open Source (‘GEOS’). R Package Version 0.5-5. 2020. Available online: https://CRAN.R-project.org/package=rgeos (accessed on 17 November 2022).
- Roger, B.; Tim, K.; Barry, R. Rgdal: Bindings for the ‘Geospatial’ Data Abstraction Library. R Package Version 1.5-32. 2022. Available online: https://CRAN.R-project.org/package=rgdal (accessed on 17 November 2022).
- Urbanek, S. rJava: Low-Level R to Java Interface. R Package Version 1.0-5. 2021. Available online: https://CRAN.R-project.org/package=rJava (accessed on 17 November 2022).
- Hijmans, R.J.; Phillips, S.; Leathwick, J.; Elith, J. dismo: Species Distribution Modeling. R Package Version 1.3-3. 2020. Available online: https://CRAN.R-project.org/package=dismo (accessed on 17 November 2022).
- Delgado, M.P.; Traba, J.; Morales, M.B. Climate niche constraints in two coexisting steppe birds: The little and the great bustards. Ardeola 2011, 58, 223–238. [Google Scholar] [CrossRef]
- Rakonczay, Z.; Vörös Könyv, A. Magyarországon Kipusztult és Veszélyeztetett Növény- és állat-Fajták; Akadémiai Kiadó: Budapest, Hungary, 1990. [Google Scholar]
- Juhász, L. A magyar puszta ékessége: A túzok. Díszmadár Mag. 2012, 19, 24–29. [Google Scholar]
- Webb, S.L.; Olson, C.V.; Dzialak, M.R.; Harju, S.M.; Winstead, J.B.; Lockman, D. Landscape features and weather influence nest survival of a ground-nesting bird of conservation concern, the greater sage-grouse, in human-altered environments. Ecol. Process. 2012, 1, 1–15. [Google Scholar] [CrossRef]
- Tanner, E.P.; Elmore, R.D.; Fuhlendorf, S.D.; Davis, C.A.; Dahlgren, D.K.; Orange, J.P. Extreme climatic events constrain space use and survival of a ground-nesting bird. Glob. Change Biol. 2017, 23, 1832–1846. [Google Scholar] [CrossRef]
- Vincze, O.; Kosztolányi, A.; Barta, Z.; Küpper, C.; Alrashidi, M.; Amat, J.A.; Argüelles Ticó, A.; Burns, F.; Cavitt, J.; Conway, W.C.; et al. Parental cooperation in a changing climate: Fluctuating environments predict shifts in care division. Glob. Ecol. Biogeogr. 2017, 26, 347–358. [Google Scholar] [CrossRef] [Green Version]
- Marcer, A.; Sáez, L.; Molowny-Horas, R.; Pons, X.; Pino, J. Using species distribution modelling to disentangle realised versus potential distributions for rare species conservation. Biol. Conserv. 2013, 166, 221–230. [Google Scholar] [CrossRef]
Figure 1.
Map of the study region indicating country borders (thin black lines), the boundaries of the Carpathian Basin (thick black line), and the occurrence points of the Great Bustard. Abbreviations of areas within the study region: TB—Transdanubia; GP—Great Plain; SGP—Southern Great Plain.
Figure 1.
Map of the study region indicating country borders (thin black lines), the boundaries of the Carpathian Basin (thick black line), and the occurrence points of the Great Bustard. Abbreviations of areas within the study region: TB—Transdanubia; GP—Great Plain; SGP—Southern Great Plain.

Figure 2.
Predicted distribution ranges of the Great Bustard for (a) historical and (b) future time periods, projected using MaxEnt models fitted on occurrence locations of the study species within the Carpathian Basin. The dots indicate occurrences, the black line represents the Carpathian Basin, whereas the grey polygons show the potential presence of the Great Bustard, the grey color scale of which indicates presence probabilities.


Table 1.
Temporal changes in the number of occurrence locations, expressed as a function of the decade.
Table 1.
Temporal changes in the number of occurrence locations, expressed as a function of the decade.
| Decade | Number of Locations |
|---|---|
| 1829–1847 | 3 |
| 1850–1859 | 1 |
| 1860–1869 | 2 |
| 1870–1879 | 3 |
| 1880–1889 | 2 |
| 1890–1899 | 8 |
| 1900–1909 | 1 |
| 1910–1919 | 11 |
| 1920–1929 | 31 |
| 1930–1939 | 58 |
| 1940–1949 | 71 |
| 1950–1959 | 45 |
| 1960–1969 | 100 |
| 1970–1979 | 76 |
| 1980–1989 | 73 |
| 1990–1999 | 20 |
| 2000–2009 | 18 |
| 2010–2014 | 3 |
Table 2.
Importance levels of bioclimatic variables calculated as contributions in isolation retrieved from MaxEnt models fitted on the occurrence records of the Great Bustard within the Carpathian Basin, computed for (a) the preselected set of nine bioclimatic variables and (b) the selected subset of the four bioclimatic proxies. Variables with high contribution metrics are indicated in bold.
| AUC | Bioclimatic Variable | Contribution |
|---|---|---|
| (a) Complete set | ||
| AUC = 0.9511 | Mean annual temperature | 0.8043 |
| Annual precipitation | 1.1814 | |
| Precipitation seasonality | 0.6187 | |
| Precipitation of warmest quarter | 0.7611 | |
| Mean diurnal range of temperature | 0.4039 | |
| Isothermality | 0.1899 | |
| Temperature seasonality | 0.6646 | |
| Mean temperature of wettest quarter | 0.9848 | |
| Mean temperature of driest quarter | 0.8748 | |
| (b) Selected subset | ||
| AUC = 0.9375 | Mean annual temperature | 0.8186 |
| Annual precipitation | 1.1317 | |
| Mean temperature of wettest quarter | 0.9472 | |
| Mean temperature of driest quarter | 0.8879 |
Publisher’s Note: MDPI stays neutral with regard to jurisdictional claims in published maps and institutional affiliations. |
© 2022 by the authors. Licensee MDPI, Basel, Switzerland. This article is an open access article distributed under the terms and conditions of the Creative Commons Attribution (CC BY) license (https://creativecommons.org/licenses/by/4.0/).
Share and Cite
MDPI and ACS Style
Ottó, B.; Végvári, Z. Bioclimatic Preferences of the Great Bustard in a Steppe Region. Diversity 2022, 14, 1138. https://doi.org/10.3390/d14121138
AMA Style
Ottó B, Végvári Z. Bioclimatic Preferences of the Great Bustard in a Steppe Region. Diversity. 2022; 14(12):1138. https://doi.org/10.3390/d14121138
Chicago/Turabian StyleOttó, Beatrix, and Zsolt Végvári. 2022. "Bioclimatic Preferences of the Great Bustard in a Steppe Region" Diversity 14, no. 12: 1138. https://doi.org/10.3390/d14121138
Note that from the first issue of 2016, this journal uses article numbers instead of page numbers. See further details here.