Article

Identifying and Remediating Soil Microbial Legacy Effects of Invasive Grasses for Restoring California Coastal Sage Scrub Ecosystems

1
Division of Biological Sciences, University of California, San Diego, CA 92093, USA
2
U.S. National Park Service, Pacific West Regional Office, San Francisco, CA 94104, USA
3
CosmosID, Germantown, MD 20874, USA
4
Center for Conservation Biology, University of California, Riverside, CA 92521, USA
5
Department of Plant Sciences and Landscape Architecture, University of Connecticut, Storrs, CT 06269, USA
6
Department of Ecology and Evolutionary Biology, University of Tennessee, Knoxville, TN 37996, USA
7
Department of Microbiology, University of California, Riverside, CA 92521, USA
*
Author to whom correspondence should be addressed.
Diversity 2022, 14(12), 1095; https://doi.org/10.3390/d14121095
Submission received: 1 November 2022 / Revised: 5 December 2022 / Accepted: 8 December 2022 / Published: 9 December 2022
(This article belongs to the Special Issue Ecology and Conservation of the Endangered Sage Scrub Ecosystem)

Abstract

:
As invasive grasses encroach upon native ecosystems, they have the potential to transform intact California coastal sage scrub (CSS) into non-native grasslands. This occurs—in part—due to legacy effects: changes in soil microbial composition elicited by grass invasions with long-term impacts on soil and native vegetation. Along with direct effects on CSS vegetation, legacy effects may alter microbial communities which may in turn impact native plant growth. To tease apart these factors, we monitored growth in three CSS species inoculated with either uninvaded soil or sterilized uninvaded soil that were subsequently planted into a site characterized by observed microbial legacy effects. Our findings indicate native plant growth can be explained by changes in soil microorganisms. Specifically, native Artemisia californica and Baccharis pilularis grew larger in plots with unsterilized uninvaded soil inoculum, which contained a larger abundance of Gemmatimonadetes and Glomus, compared to the sterilized soil inoculum plots. Therefore, microbial augmentation may not only improve restoration in post-invasive sites but long-term changes in soil microbial communities may be linked to native plant growth. Furthermore, adding uninvaded soil replete with native microbes has the potential to support restoration of invaded sites by promoting native plant survival and establishment in these restored ecosystems.

Graphical Abstract

1. Introduction

There are over 300 rangeland invasive plants in the United States that alter sensitive habitat, poison animals, reduce plant diversity, and deplete resources [1]. In California, shrub cover has decreased by 90% largely due to plant invasion, transforming the landscape from coastal sage scrub (CSS) to non-native grassland [2]. Coastal sage scrub is a hotspot of endemic species, characterized by low-growing shrubs in the inland and coastal areas of California and northwest coastal Baja California. A number of rare and endangered species rely on CSS for survival, with 100 of the endemic species proposed for or under protection [3]. The cover of California sagebrush (Artemisia californica Less.), a foundation species in CSS, has decreased from 17.7% to 6.1% in the last 62 years [4]. Despite the fragility and importance of CSS, research conducted in this system has been sparse [5], especially in the wake of non-native grass invasions. The role of non-native grass invasions and invasive grass impacts on both below and aboveground processes has mounting importance for promoting the survival and overall health of these threatened CSS ecosystems.
Invasive grasses alter carbon storage in the soil [6], inputs of nitrogen and other elements [7], organic matter content [8], water flow, and soil quality. These changes in soil physical and chemical properties can increase the competitive ability of invasive grasses and allow them to dominate landscapes. Although invasive plants may exert influences on soil microbial communities, the indirect effects of these belowground changes on native plant communities are context dependent.
Microbes are critical facilitators of the carbon and nitrogen cycles, primary decomposers of organic matter, and important mutualists and pathogens of most plant species [9]. Variations in the carbon to nitrogen ratio (C:N) of plant litter, resulting from invasion, can alter soil microbial communities, ostensibly shifting fungal to bacterial ratios (fungi:bacteria) and dominant taxa or communities within invaded soil [10]. Introductions of translocated microbes [11] and root exudates [12] from invasive plants can also contribute to observed changes to these soil microbial communities. Root exudates from invasive plants that are high in quercetin have been shown to increase arbuscular mycorrhizal fungi (AMF) colonization of the invasive plant roots [12]. Invasive plants could utilize this beneficial AMF association to outcompete and displace native plants. Soil bacteria are important agents of decomposition and nutrient cycling in CSS. As exotic plant invasions drive changes to bacterial community composition [13], these may correspond with native plant growth. AMF are the most common plant mutualists; these AMF symbionts associate with the roots of most plant species [14]. Arbuscular mycorrhizal fungi not only increase plant access to phosphorus [15,16], but also stabilize soil aggregates [17] and enhance plant resistance to root-associated pathogens [15,18]; moreover, these AMF putatively ameliorate allelopathic soil conditions related to plant invasions [19]. Many AM fungi are generalists which may facilitate AM-associations with invading plant species. These generalists manifest in underscoring the invasiveness of particular plant species if AM fungal symbionts increase the competitiveness of the invasive plant thus displacing native plants that are either non-mycorrhizal or exhibit weakly mycorrhizal tendencies. In contrast, some invasive plants preclude AM associations and in turn inhibit mutualistic efficacy and abundance (Mycorrhizal Degradation Hypothesis; [20]). When plants invade, these invasions may either putatively increase or decrease the abundance and diversity of AMF [21]. Occasionally, invasive AMF taxa are introduced into the invaded range [22].
These types of changes in the soil microbial community brought on by plant invasions can indirectly affect native plant growth [6,10,23,24,25,26,27]. Native plant cover can decline if important nutrient cycles become altered [28], food webs change, or plant pathogens are introduced to the soil [26,29]. The indirect effects of invasive plant growth on native plants are largely dependent upon the native and invasive species studied [30], site specifics, time of invasion, and invasive cover [6], resulting in conflicting results across studies. There is mounting evidence about the context dependency relationship and how important invasive grasses affect native plants [6]. Moreover, these changes in the soil microbial composition sometimes last for years after the invasive plant has been removed. These “legacy effects”, by definition, are the biotic and abiotic impact of a species that persists after the species has been removed from an area [24]. Legacy effects of plant invasions may be particularly important in conserving CSS ecosystems in the wake of perennial non-native grass invasions that form persistent monocultural stands.
A prevalent invasive grass in CSS ecosystems is Phalaris aquatica L. (Harding grass), which outcompetes and displaces native plants by forming large monocultures in riparian and upland systems of the invaded range. This grass is highly aggressive [31], mycorrhizal [32], perennial, and deep-rooted; it was transplanted as pasture grass from the Mediterranean [1] to the United States coastal valleys, foothills, and roadsides, spanning from Oregon to California. Despite the invasiveness of this grass, little is known about its impact of native CSS plants, associated soil microorganisms, and abiotic properties and edaphic factors in CSS ecosystems.
To address these putative impacts and assess constraints to CSS restoration in P. aquatica invaded ecosystems, we conducted a greenhouse study to better understand how long-term invasions alter soil microbial conditions and native plant growth. We monitored the performance of three native plants (Artemisia californica Less., Salvia leucophylla E. Greene, and Baccharis pilularis DC.) and the invasive grass, P. aquatica, grown in uninvaded soil as compared to soil previously invaded by P. aquatica (i.e., post-invasive soil). To determine if the performance of native plants grown in post-invasive soils were inhibited by soils type, if these putative differences in plant growth were biotic in origin, and whether any observed changes in plant growth were reversible, we monitored the performance of the same three native plant species inoculated with either unsterilized or sterilized uninvaded soil after transplant into the post-invaded site. Moreover, we characterized the bacterial and fungal communities in treatment sites and in the surrounding intact and post-invasive sites. We hypothesized that (1) differences in native plant growth can be explained by changes in the soil microbial community and (2) remediation of the soil microbial conditions through inoculation will improve restoration in post-invasive sites.

2. Materials and Methods

2.1. Field Site

Rancho Sierra Vista (RSV, a unit of the Santa Monica Mountains National Recreation Area) is a lowland site in Southern California that was originally coastal sage scrub (CSS), however, RSV has a long history of ranching and agriculture that have transformed much of the landscape to non-native grassland. Since the 1950s, this site was open, dry field agriculture, with soil series Mipolomol, consisting of loamy, mixed, superactive, thermic, shallow Entic Haploxerolls (US Department of Agriculture, Washington, DC, USA).
The first record of P. aquatica in RSV occurred in November 2002 [33]. Phalaris aquatica was first planted, albeit unsuccessfully, for use as livestock fodder in the 1970s prior to the establishment of the Santa Monica Mountains National Recreation Area in 1978. As it was unpalatable as livestock forage, P. aquatica rapidly expanded to approximately 10 ha (34°09′10.3″ N, 118°57′08.2″ W) forming a monocultural stand. At the full extent of establishment, this grass reaches ~1.1 m.
Invasive control efforts began in the late 1990s through the early 2000s. Phalaris aquatica removal by park managers throughout the 10-ha area began in 2006 leveraging a combination of mowing and synthetic post-emergent herbicide application (glyphosate). By 2013, P. aquatica infestation was eradicated in several areas and cover was reduced to routine maintenance in the remaining hectarage. Although post-treatment areas of P. aquatica were surrounded by intact CSS, which ostensibly provided ample propagule pressure, native plant recruitment was virtually nonexistent in the years following invasive control and management. If unfavorable soil conditions precluded native plant recruitment, then traditional restoration strategies that included out-planting large numbers of native plant seedlings might prove insufficient in restoring the native plant populations. In fact, using a single method such as traditional out-planting may not be effective in establishing native communities, as the replacement habitat rarely matches the microbial or floristic habitat that was lost [34].

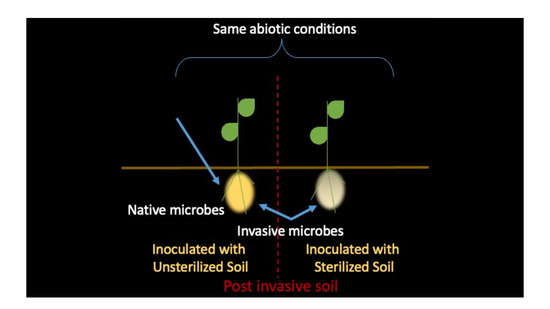
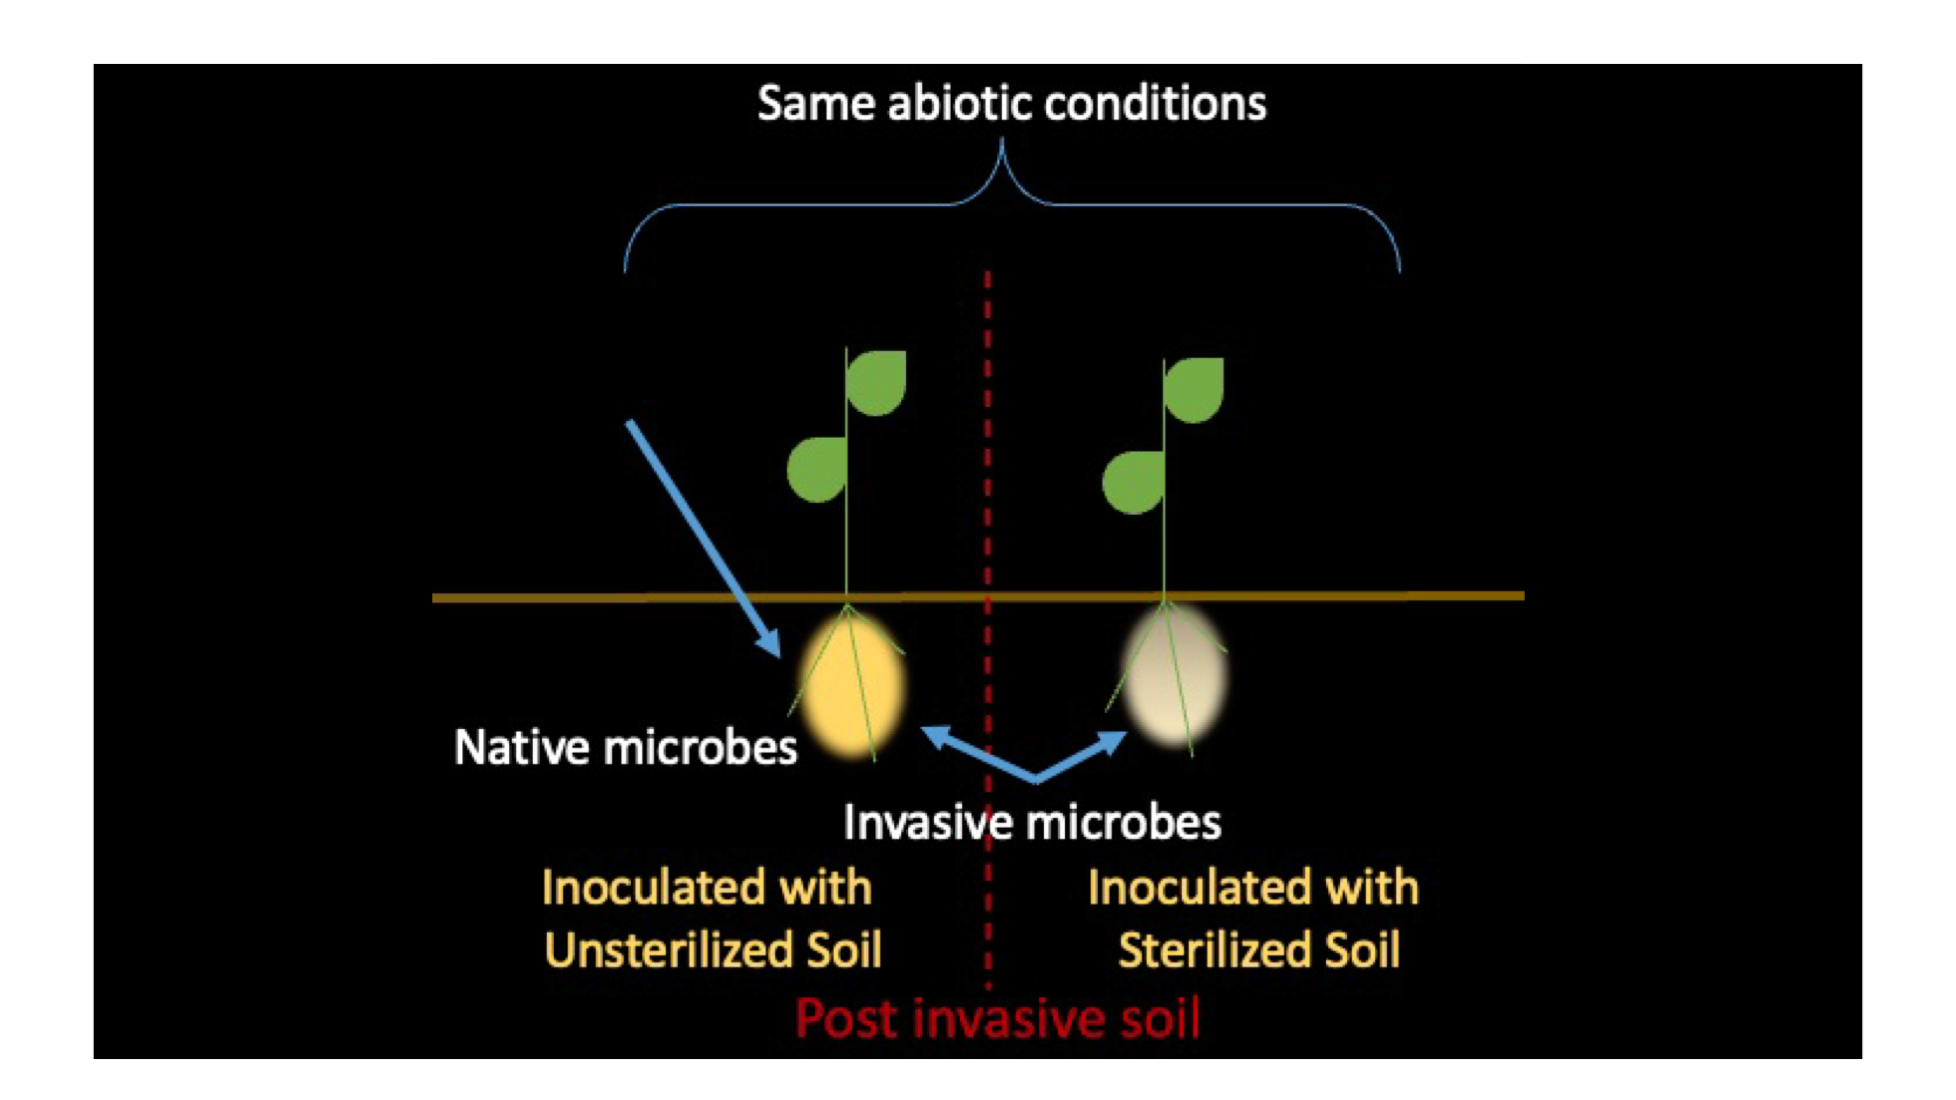
2.2. Experimental Setup

We deployed experimental manipulations using a randomized block design with the native plants California sagebrush (Artemisia californica Less.), purple sage (Salvia leucophylla E. Greene), and coyote brush (Baccharis pilularis DC.). These native plants were treated by introducing either unsterilized (UT) or sterilized (ST) uninvaded soil as a soil amendment, growth medium, or inoculum source. All three selected plant species are mycorrhizal and non-leguminous. Selection criteria included dominance in CSS and observed abundance within uninvaded soils surrounding the proximal post-invasive site.
On 22 January 2014, this 10-ha site was arranged into three blocks that each contained 10 plots (1 m × 1 m). Six of the 10 plots were single-species plots containing six plants each and the remaining four plots were mixed species plots containing two of each plant species. Five of the 10 plots were UT plots and five were ST plots. We created mixed species plots to investigate whether there were any interspecies effects on the plant growth or microbial composition of the soil. Moreover, we used these plots to determine if certain species could act as nurse plants for those that grew poorly in the post-invasive soil. Each plot was replicated three times (one per block); none of the plots contain mixed plants that varied in inocula sources. We avoided mixing those that were inoculated with ST with those inoculated with UT soil. A total of 180 plants were planted in the experiment (90 with ST inoculum and 90 with UT inoculum). It is worth noting that the mixed-unsterilized experimental plot in block one was lost (ostensibly resulting from herbivory); therefore 174 plants remained for subsequent analysis (instead of the aforementioned 180).

2.3. Soil Inoculum

We defined “uninvaded soil” as soil in which intact CSS has historically grown uninterrupted. The uninvaded soil used in this study was collected from an intact stand of CSS in RSV, California. This intact stand historically had neither livestock nor cultivation. We collected soil approximately one mile west of the 10-ha field site on the side of an east facing slope (34°09′16.0″ N 118°57′54.7″ W) where S. leucophylla, B. pilularis, and A. californica are prevalent. The soil was collected at ~10 randomly selected locations across the slope. We collected approximately 19 L of soil from the top 15 cm of soil using a sterilized 20 cm-diameter shovel. Half of the soil volume (~9.5 L) was transported back to the Aronson laboratory at the University of California Riverside (Riverside, CA, USA) for sterilization to eliminate any plant-associated microorganisms. The soil was first sieved through a 1-cm2 stainless steel mesh and then steam-sterilized for 24 h, followed by a 48-h incubation period, and then a second 24-h sterilization period. The unsterilized and sterilized soils were never mixed together. They were each combined with BM2 peat moss (Berger; Saint-Modeste, QC, Canada) germinating mix in a sterilized cement mixer at a ratio of four parts peat moss: one part soil. Hereafter, these mixtures are referred to as either sterilized (ST) or unsterilized (UT) soil inoculum.

2.4. Plant Growth Conditions

On January 22, 2014, 1000 seeds per species were sown in three separate plant flats (540 mm × 280 mm × 50 mm) filled with commercial potting mix and peat moss. After germination and two weeks of growth, n = 100 seedlings per species were transplanted into Ray Leach cone-tainers (Steuwe & Sons, Inc., Tangent, OR, USA; 3.8 cm-diameter × 21 cm-deep) with one seedling in each cone-tainer. Each cone-tainer was packed with either the unsterilized or sterilized soil inoculum, a 20-mm space between the soil surface and the top of the cone-tainer was made to allow room for irrigation. The seedlings were watered every other day and were grown in a mesh outdoor greenhouse with indirect sunlight on the Santa Monica Mountains National Recreation Area property.
Conditions in the greenhouse were maintained at temperatures of 29.4 °C max and 14.4 °C min. Plants were placed in random locations throughout the outdoor greenhouse; treatments were separated by at least one meter to prevent cross-contamination during watering. After about five months of growth (6 September 2013–22 January 2014) under these conditions, 18 of the A. californica grown with sterilized soil inoculum, seven A. californica grown with unsterilized soil inoculum, and one B. pilularis grown with sterilized soil inoculum perished and thus were omitted from future analyses. Due to this mortality, n = 60 plants per species (instead of the original 85) were transplanted into the 10-ha post-invasive field site on 22 January 2014. The field site is a NW facing slope in full sunlight. We used power augers to drill holes about 38 cm deep × 20 cm wide for out-planting in the field. After careful removal of seedlings from cone-tainers, we shook each seedling to dislodge excess soil; then, seedlings were planted into the holes. Seedlings were subsequently watered once per week by community volunteers using a utility vehicle mounted with a water tank.

2.5. Plant Harvest

We harvested plants on 20 August 2014, after approximately eight months of growth in the field. One plant from each plot was randomly selected for harvesting; this harvest totaled 30 individuals out of 174 plants. At harvest, the entire plant was carefully and slowly excavated from the soil with soil knives to ensure minimal root loss, after which the shoot was separated from the roots with shears. The shoots were placed into clean paper bags and the roots were shaken lightly to remove loose soil and placed in sterile bags (Whirlpak, Nasco, Madison, WI, USA) for transport to the laboratory at UC Riverside. We defined rhizosphere soil as the soil still clinging to the surface of the roots after being shaken, while bulk soil samples were collected under each harvested plant with soil knives. All soil and root samples were placed on dry ice in the field and transported to a −20 °C freezer for archiving at the Aronson laboratory at UC Riverside within 24 h of harvest time.

2.6. Soil Core Collection

We collected soil cores throughout the duration of our field experiment, beginning with 10 February 2014. These bi-monthly collections (i.e., soil cores that were collected every other month), comprised a total of 150 soil cores, which were placed on dry ice and immediately shipped to the laboratory from the field and processed for nitrogen analysis. Soil cores collected during the other three months (213 soil cores total) were stored at −20 °C for subsequent DNA extraction and sequencing at the Aronson laboratory at UC Riverside. Soil cores for sequencing were collected directly under the drip-line of native plants at 5 cm-depths with a sterile corer. One soil core was collected in each unmixed plot under every plant and three cores were taken in each mixed plot (one per species) during each sampling session. Soil cores for nitrogen analysis were also 5 cm-deep but were taken from the middle of each plot, equidistant from the plants inside.
During each sampling session, 10 additional soil cores were also collected under the canopy of the surrounding intact CSS and another 10 soil cores were collected in random locations throughout the 10-ha site, not inside an experimental plot. These last 20 soil cores were designated as uninvaded soil and post-invasive soil controls, respectively. A total of 71 soil cores were taken during every sampling event for sequencing and 50 soil cores for nitrogen analysis. These collections occurred six times during the experiment for a grand total of 363 soil cores taken. Using a soil temperature probe, we also measured soil temperature and water content next to each location where soil cores were collected.

2.7. Leachate Analyses

Plant available nitrogen (nitrate and ammonium) was determined for each soil core. Forty mL of 2M KCl (148 g KCl + 1 L H20) was added to 10 g of the original soil core. The sample was placed on a shaker table for 1 h at 200 rpm before settling for another 1 h. The supernatant was then gravity filtered and the final extract was collected in vials. Ammonium analysis followed Weatherburn [35] and nitrate analysis followed Doane and Horwath [36]. For ammonium analysis, 80 µL of sample were mixed with 60 µL of salicylate solution and 60 µL of bleach solution, then read on a microplate reader at 650 nm. For the nitrate analysis, 100 µL of sample were combined with 100 µL of reagent solution (50 mL vanadium chloride solution, 3.3 mL sulfanilamide solution, 3.3 mL N-(1-Naphthyl)ethylenediamine (NED) solution, and 400 mL DI water) and read on a microplate reader at 540 nm. Two technical replicates were run for each sample.

2.8. 16S DNA Extraction Quantification and Barcoded Targeted Amplicon Sequencing

The 16S ribosomal RNA gene (16S rRNA) V3 and V4 regions were analyzed to classify the diversity of bacteria in the soil. Microbial DNA was extracted as per [37]. A NanoDrop 2000/2000c UV-Vis spectrophotometer (Thermo Fisher Scientific, Wilmington, DE, USA) was used to quantify the DNA in soil extracts.
PCR for bacteria and archaea was performed using primers that target the 16S V3 and V4 regions (S-D-Bact-0341-b-S-17 and S-D-Bact-0785- a-A-21; [38]) of the 16S rRNA gene. Microbial genomic DNA (2.5 µL) was combined with forward and reverse primer (5 µL each), and 2x KAPA HiFi HotStart ReadyMix (KAPA Biosystems, Wilmington, MA, USA) (12.5 µL). A Bio-Rad MJ Research PTC 200 Thermocycler was used to amplify 96 samples at a time with the following program: 95 °C for 3 min, 25 cycles of 95 °C for 30 s, 55 °C for 30 s, 72 °C for 5 min, and hold at 4 °C. AMPure XP beads (Beckman Coulter Genomics, Danvers, MA, USA) were used to purify the 16S amplicon without primer and primer dimer sequences. Dual indices and Illumina sequencing adapters were attached to the amplicon using the Nextera XT Index Kit (Illumina, San Diego, CA, USA). Amplicon DNA (5 µL) was combined with 2x KAPA HiFi HotStart ReadyMix (25 µL), Index 1 and 2 primers (5 µL each), and PCR grade water (10 µL). The same thermocycler was used with the following program: 95 °C for 3 min, eight cycles of 95 °C for 30 s, 55 °C for 30 s, 72 °C for 30 s, 72 °C for 5 min, and hold at 4 °C. A second bead cleanup was used to purify the final library before quantification. The samples were verified with gel electrophoresis after every step. The samples were quantified in duplicate using the Quant-iT PicoGreen dsDNA assay kit (Life Technologies, Grand Island, NY, USA). All samples were pooled together in equimolar concentrations then sequenced with an Illumina MiSeq instrument at UCR.
We performed a search using BLAST (NCBI) to verify Cyanobacteria findings. We filtered the OTU table by taxonomy (specifically Cyanobacteria), then chose representative sequences based on this filtering. The BLAST search was performed using the NCBI BioSystems Database [39] and was limited to only Cyanobacteria.

2.9. AMF DNA Extraction Quantification and Barcoded Targeted Amplicon Sequencing

The SSU rRNA gene was analyzed to classify the diversity of mycorrhizae in the soil as per [40]. Microbial DNA was extracted as per [37]. A NanoDrop 2000/2000c UV-Vis spectrophotometer (Thermo Fisher Scientific, Wilmington, DE, USA) was used to quantify the DNA in soil extracts. Polymerase chain reactions for fungi was performed using the primer pairs WANDA-AML2 in duplicate for the 18S region; this primer set contains both Glomeromycotina-specific (AML2) and a universal eukaryote primer (WANDA) to target amplicons that provide resolution specifically for the monophyletic AMF group [40,41]. We constructed our libraries by using a dual-indexing approach, as per [40]. Microbial genomic DNA (1 μL) was combined with forward and reverse primer (5 μL each), and Phusion DNA Polymerase (Thermo Fisher Scientific, Wilmington, DE, USA) (12.5 µL). A Bio-Rad MJ Research PTC 200 Thermocycler was used to amplify 96 samples at a time with the following program: 95 °C for 2 min, 40 cycles of 95 °C for 30 s, 60 °C for 1 min, 68 °C for 1 min, and hold at 10 °C. AMPure XP beads (Beckman Coulter Genomics, Danvers, Massachusetts, USA) was used to purify the extracts and amplicon. Our first-step PCR reactions (i.e., PCR1) used primers containing universal tails, which were synthesized 5′ to the locus specific sequences [42]. Dual indices and Illumina sequencing adapters were attached to the amplicon. Diluted (1:10) amplicon DNA (1 μL) was combined with Phusion (12.5 μL), Index 1 and 2 primers (2.5 μL each), BSA (0.1 μL) and PCR grade water (6.4 μL). The same thermocycler was used with the following program: 95 °C for 2 min, 15 cycles of 95 °C for 10 s, 55 °C for 30 s, 72 °C for 30 s, and hold at 10 °C. A second bead cleanup was used to purify the final library before quantification. The samples were verified with gel electrophoresis after every step. The samples were quantified in duplicate using a Qubit 2.0 Fluorometer (Thermo Fisher Scientific, Wilmington, DE, USA). All samples were pooled together in equimolar concentrations then sequenced with an Illumina MiSeq instrument.

2.10. DNA Extraction from Roots

Sterile forceps were used to carefully remove large pieces of soil and debris from the root surface, the root ball was then split if needed, and placed into a sterile Petri dish filled with 10% bleach. The root was then submerged, pressed gently, and moved back and forth in the bleach until excess soil disengaged from the root. The roots were then washed with milliQ water to clean off any remaining bleach, cut into 1-cm pieces, and 0.15 g were weighed out into bead tubes for extraction. Bead solution and C1 solution was added to the tubes before a 1-h incubation in a 65 °C heating block. Tubes were vortexed every 15 min for 5–10 s then microbial DNA extraction was carried out using a MO BIO PowerSoil DNA Isolation kit (MO BIO Laboratories Inc., Carlsbad, CA, USA) following the manufacturer’s instructions and using a PowerLyzer 24 bench top bead-based homogenizer (Mo Bio Laboratories, Inc., Carlsbad, CA, USA).

2.11. Data Analysis

To analyze the plant length and biomass data, we used JMP13 statistical software (JMP, Version 13. SAS Institute Inc., Cary, NC, USA, 1989–2007) to perform a linear regression between plant length in UT compared to ST soil. Quantitative Insights into Microbial Ecology (QIIME; [43]) was used to quality filter the sequences and determine taxonomic identity against the Greengenes reference databases using 97% similarity. Analysis of similarity (ANOSIM) was performed in QIIME using a Unifrac index to statistically compare community similarity among treatments. We performed alpha diversity analyses and generated PCoA plots using QIIME. Beta diversity analyses were performed using MicrobiomeAnalyst [44]. To analyze the abundance of certain taxa in the soil samples, we used JMP13 to perform a two-way ANOVA with factors soil type (uninvaded or post- invasive), month (April or February), and soil*month at the phylum, class, order, family, and genus levels. We used the vegan [45] and ggpubr [46] packages in R to perform PERMANOVA analyses and generate plots to graphically depict our data, respectively.
For SSU, we used smalt (http://www.sanger.ac.uk/science/tools/smalt-0; accessed on 1 October 2019) to remove PhiX contamination and cutadapt [47] to filter sequences. We used the forward read and checked quality with FastQC [48]. Demultiplexing was performed in QIIME 1.9.1 and taxonomy was assigned using BLAST against the MaarjAM database [49].

3. Results

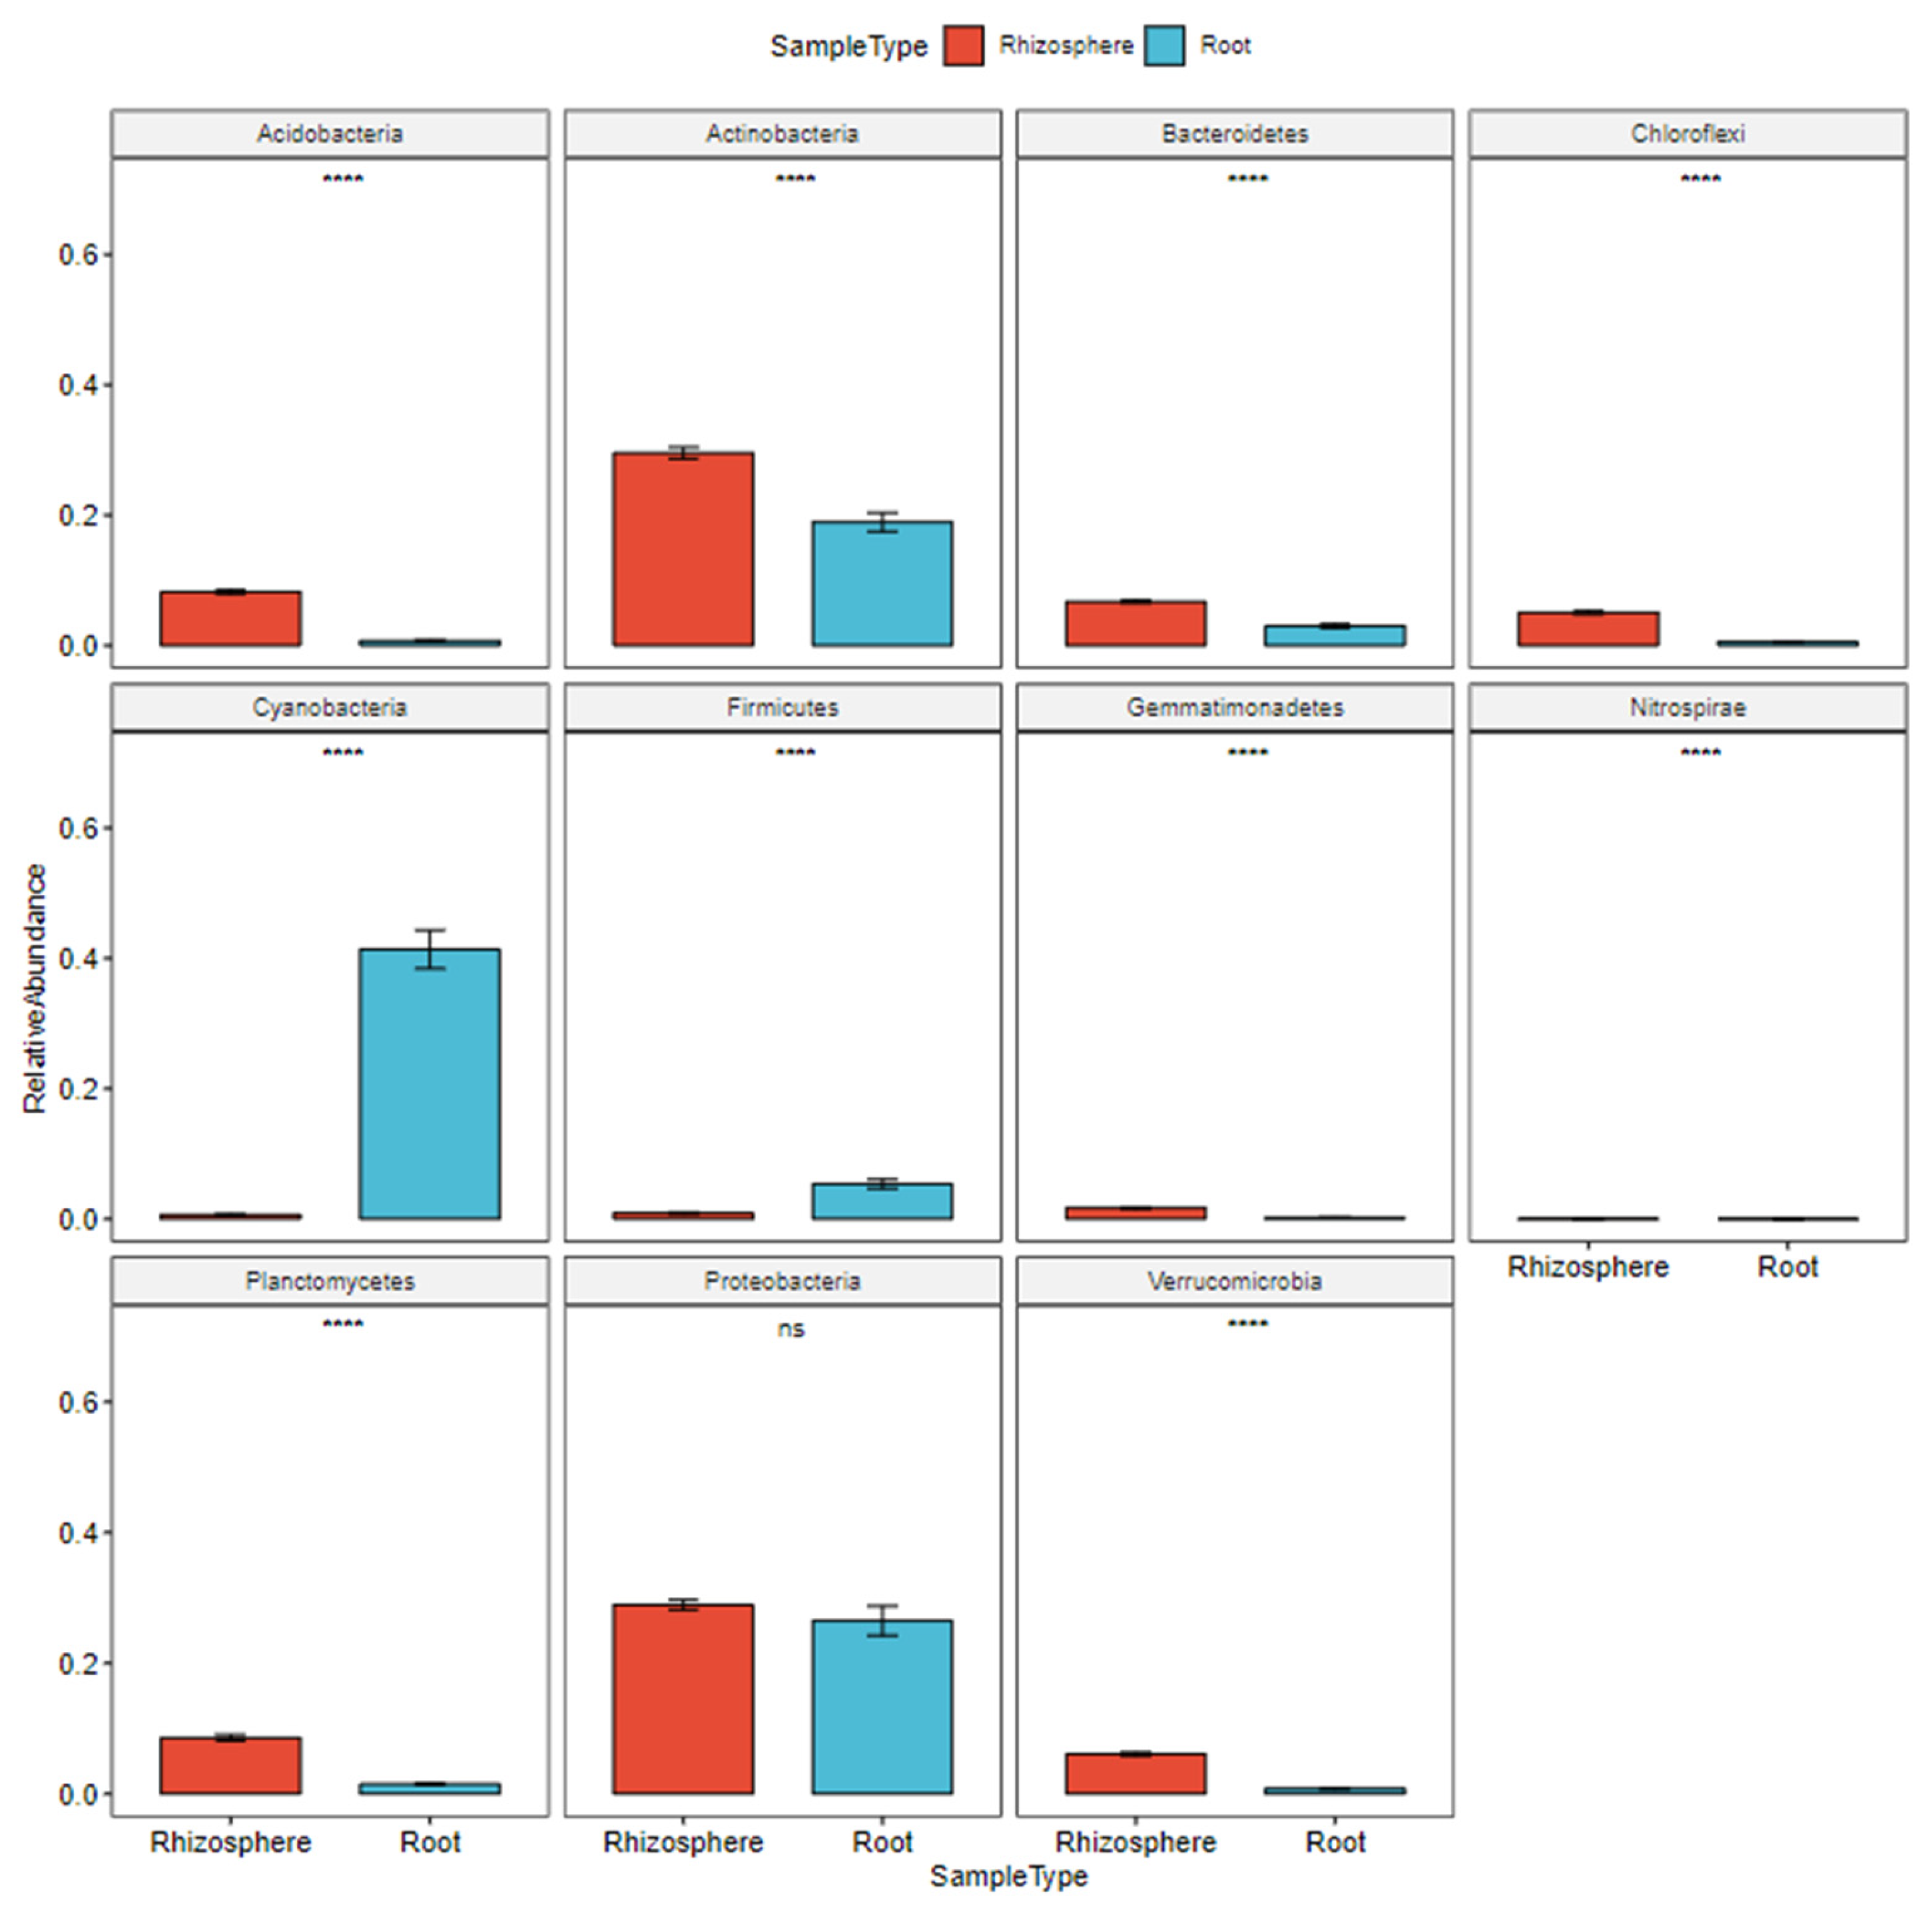
3.1. Bacteria and Leachate

The amount of nitrate was higher in post-invasive soil (p < 0.001), while ammonium did not differ between soil types. The total bacterial composition of the treatment and control plot soils were not significantly different from each other (p > 0.05) in February and April (Figure 1). The bacterial composition did not differ by block or mixed/non-mixed plots.
For the plants harvested in August, roots and rhizosphere microbial composition were significantly different from each other (p < 0.01), with the rhizosphere composition differing by treatment (UT or ST; p < 0.01; Figure 2). We found differences in the relative abundance of microbial groups at various taxonomic levels between the roots and rhizosphere samples and the rhizosphere in UT compared to ST soils.
Eleven phyla dominated all root and rhizospere samples, with Acidobacteria, Actinobacteria, Bacteroidetes, Chloroflexi, Cyanobacteria, Firmicutes, Gemmatimonadetes, Nitrospirae, Planctomycetes, Proteobacteria, and Verrucomicrobia accounting for ~95% of sequences in each sample. Cyanobacteria alone made up ~41% of sequences in each root sample. Forty-two additional phyla were present but not dominant in both roots and rhizosphere. There were significant differences in the relative abundance of certain taxa between root and rhizosphere: in rhizosphere, there was relatively more Acidobacteria (p < 0.0001), Actinobacteria (p < 0.0001), Bacteroidetes (p < 0.0001), Chloroflexi (p < 0.0001), Gemmatimonadetes (p < 0.0001), Nitrospirae (p < 0.0001), Planctomycetes (p < 0.0001), Verrucomicrobia (p < 0.0001), and a lower amount of Cyanobacteria (p < 0.0001) and Firmicutes (p < 0.0001) (Figure 3). The representative sequences in the BLAST search results matched to Cyanobacteria genera at ~85 % identity on average with good E-values.
Streptomyces was the most abundant genus identified, but did not differ in abundance between roots and rhizosphere. Of the remaining 284 detected low-abundance genera, there were several differences between the root and rhizosphere. The seven most abundant include Kaistobacter (p < 0.0001), Rhodoplanes (p < 0.0001), and Rubrobacter (p < 0.001), which were more abundant in the rhizosphere, while Agrobacterium (p < 0.0001), Bacillus (p < 0.001), and Rhizobium (p < 0.0001) taxa were detected as more abundant in roots than in rhizosphere soils.

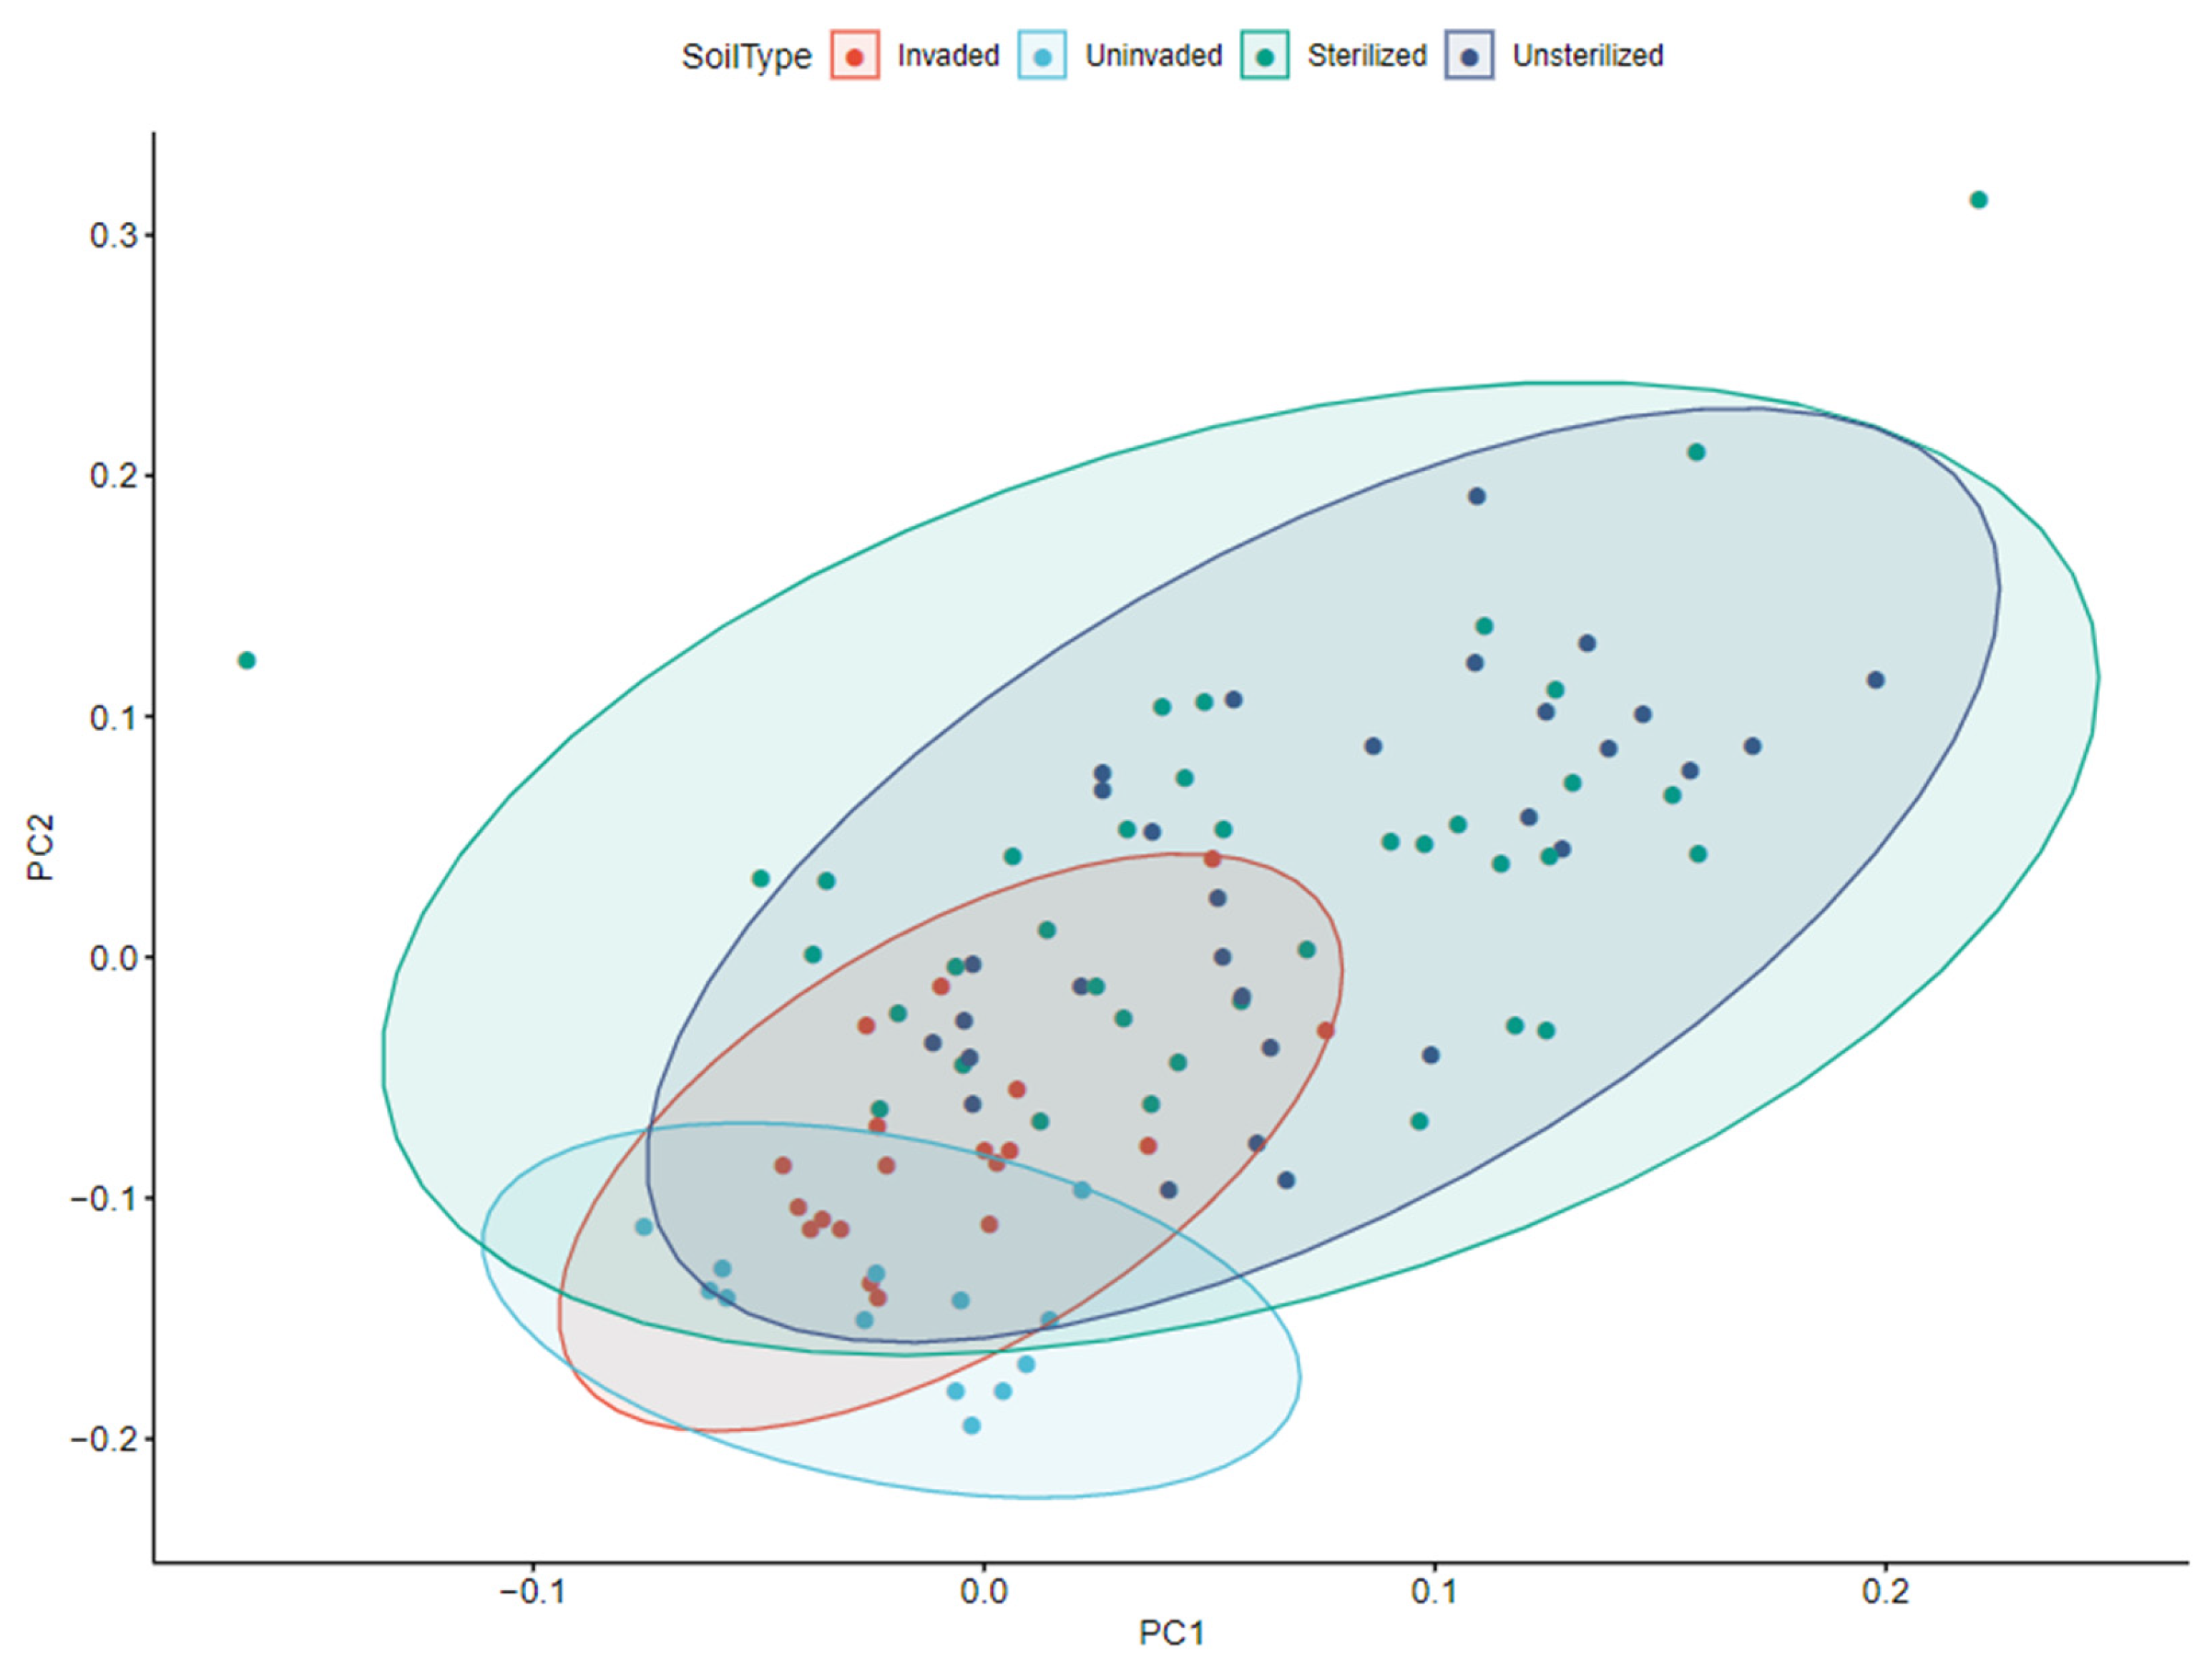
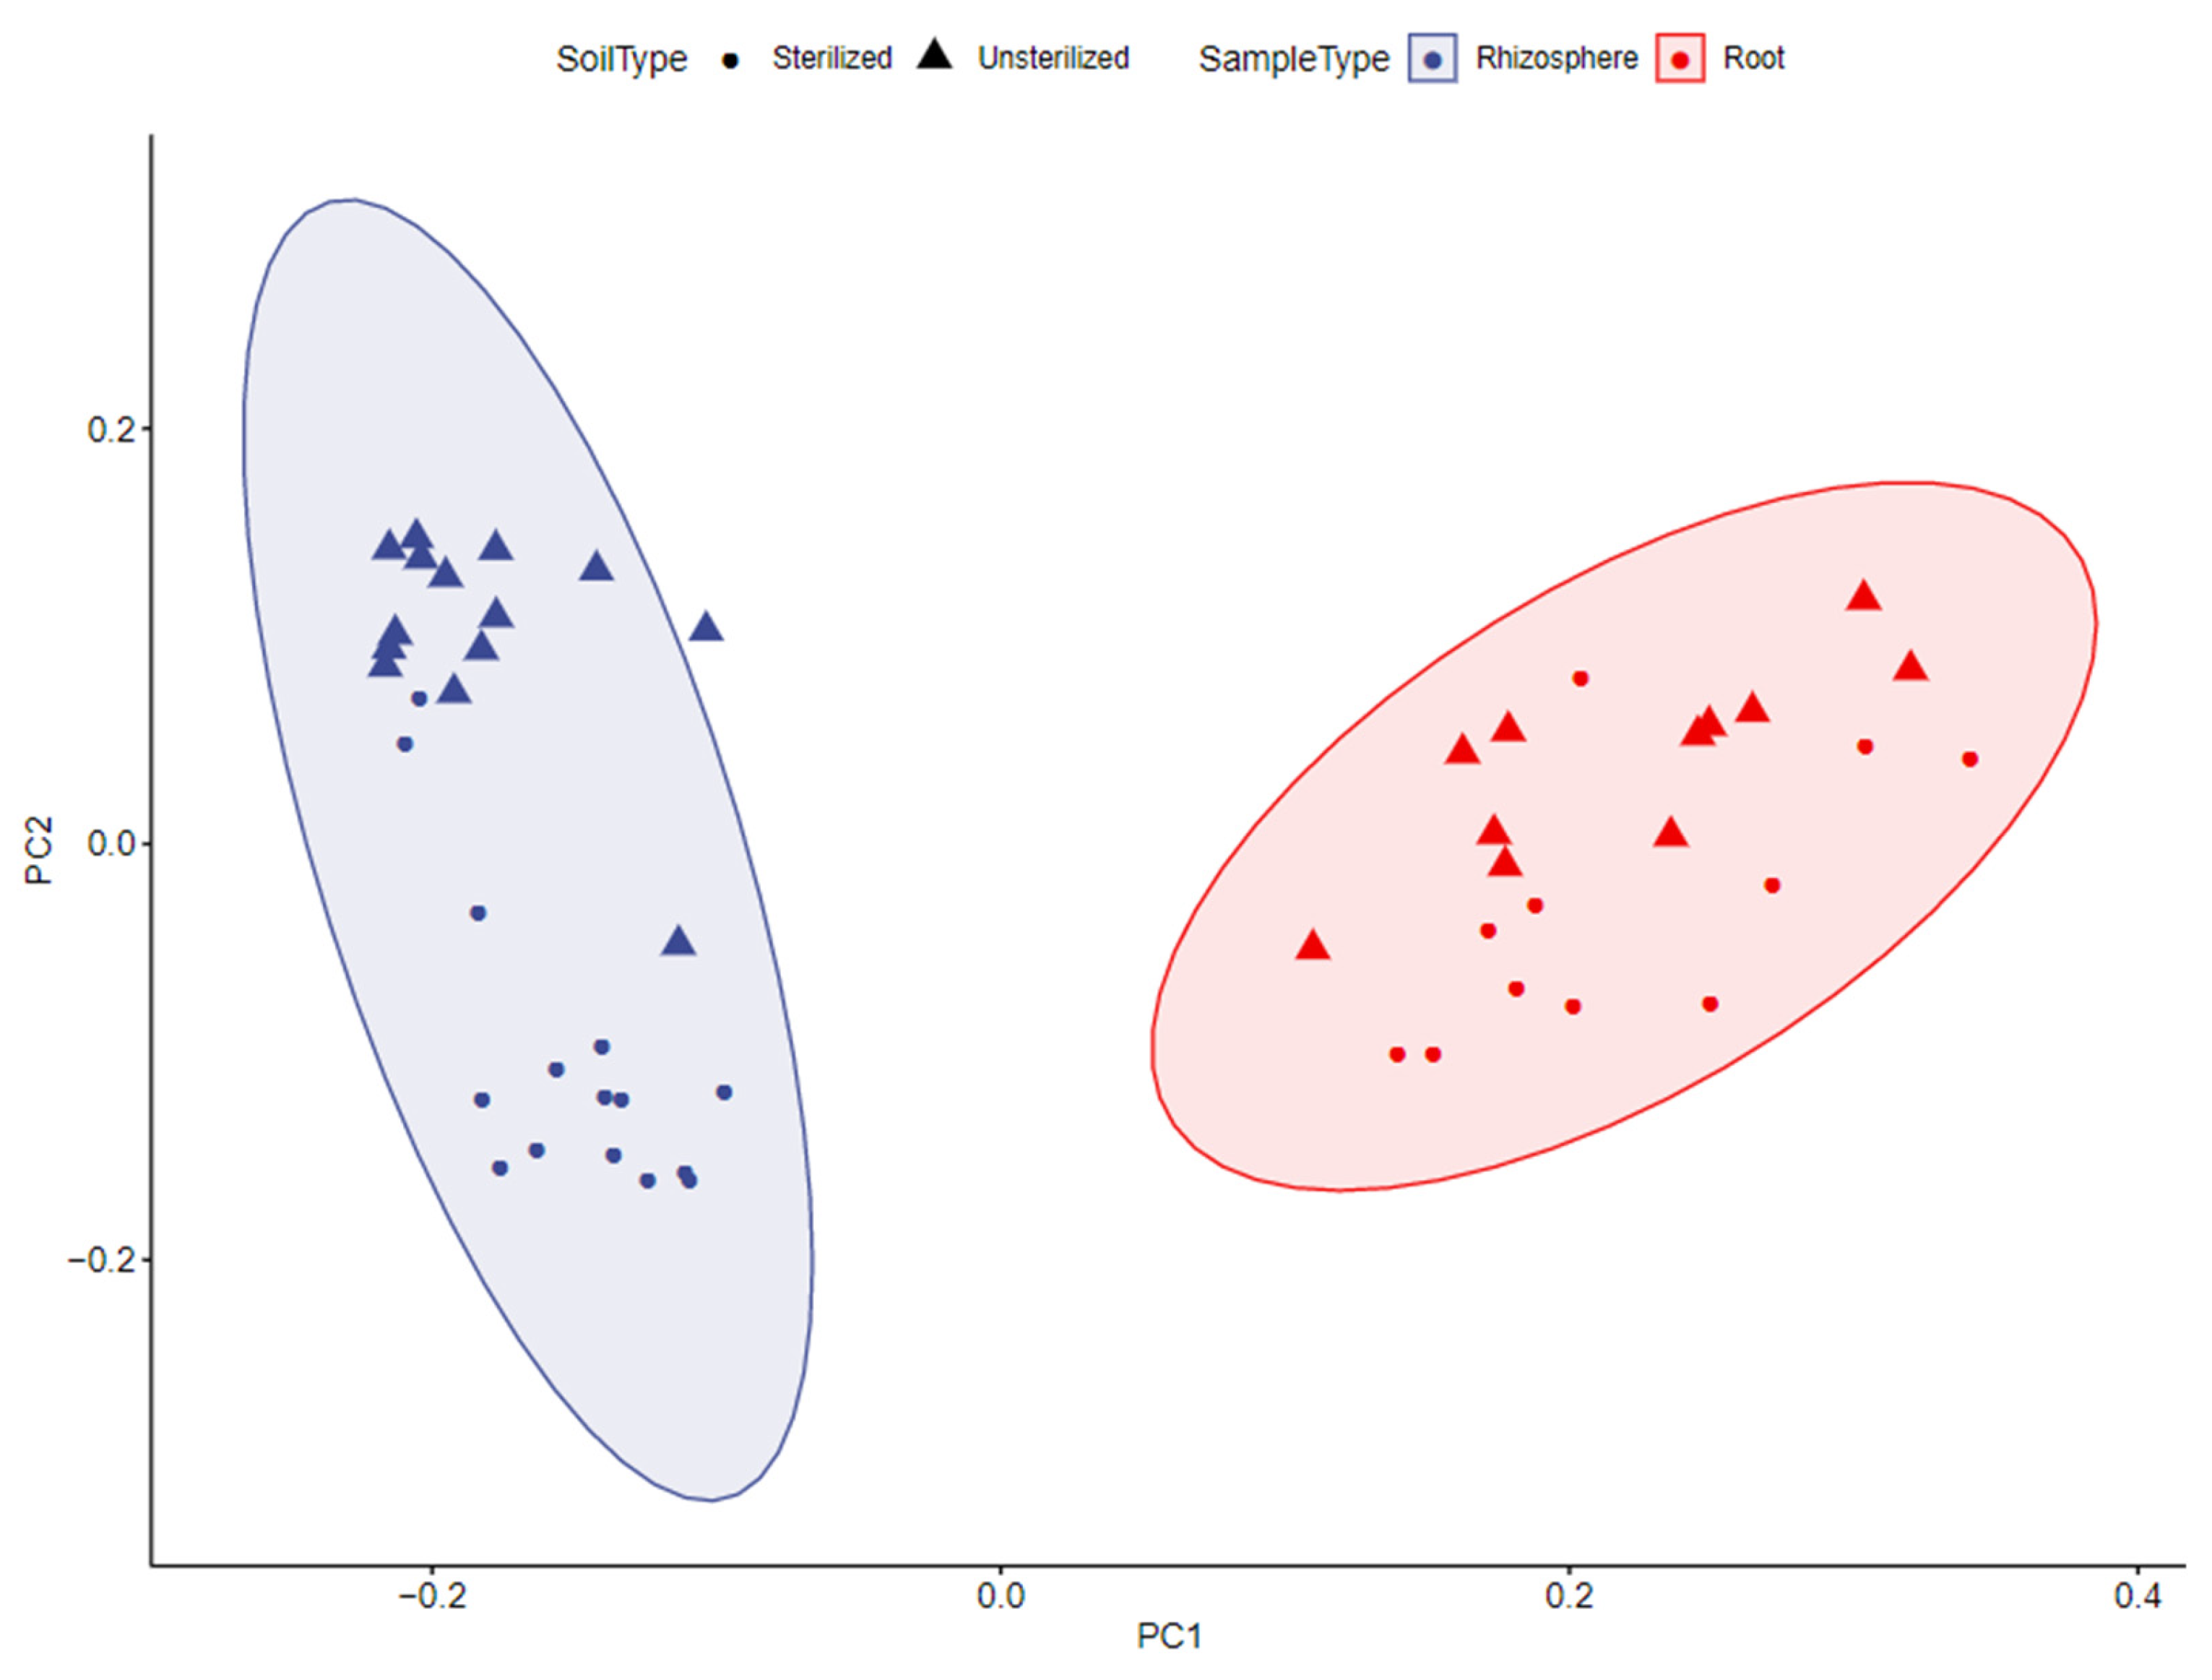
3.2. Rhizosphere by Treatment

Nine phyla dominated the rhizosphere samples, with Acidobacteria, Actinobacteria, Bacteroidetes, Chloroflexi, Gemmatimonadetes, Planctomycetes, Proteobacteria, Firmicutes, and Verrucomicrobia accounting for 95% of each sample. Thirty-three additional phyla were present, but not dominant in the rhizosphere of both UT and ST treatments. There were significant differences in the relative abundance of Gemmatimonadetes (p < 0.01) with more abundance occurring in UT rhizosphere soil compared to ST rhizosphere soil.

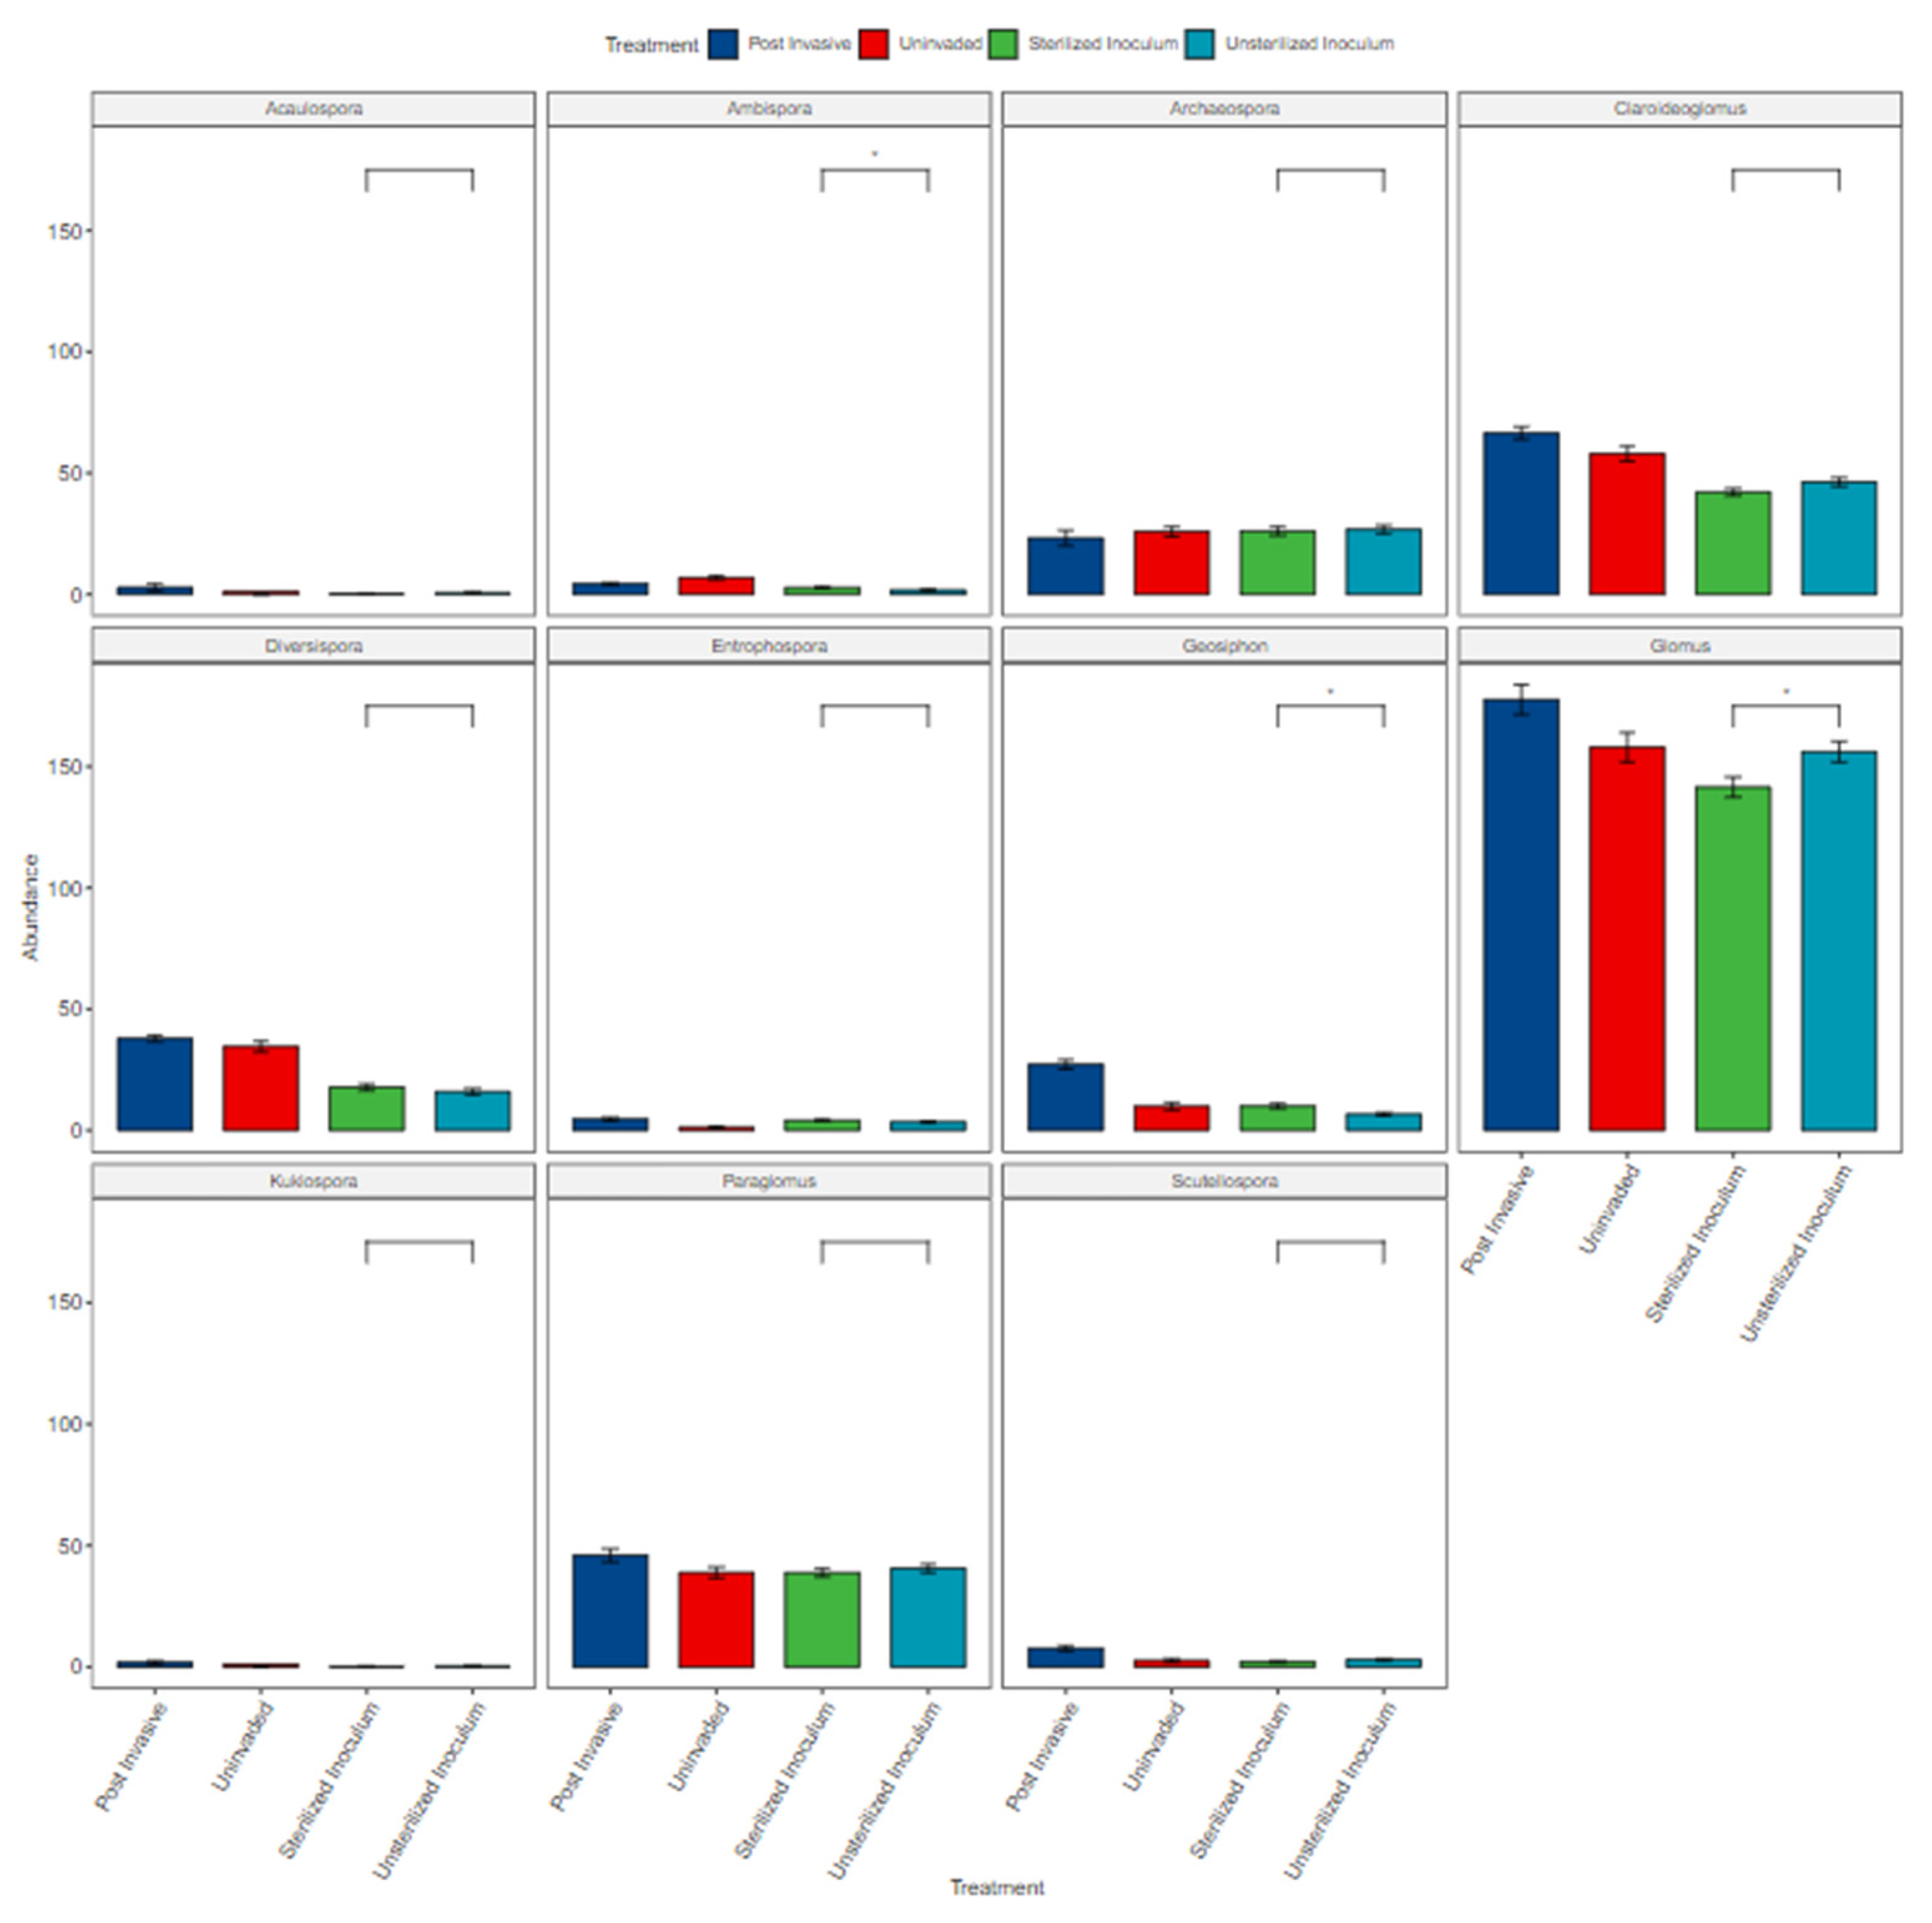
3.3. Fungal Composition

The total fungal composition of the treatment and control plot soils were statistically equivalent to each other (p > 0.05) in February and April. All OTUs belonged to 4 orders, 9 families, and 11 genera within the phylum Glomeromycota. We detected these 11 genera: Acaulospora, Ambispora, Archaeospora, Claroideoglomus, Diversispora, Entrophospora, Geosiphon, Glomus, Kuklospora, Paraglomus, and Scutellospora. In UT treatment plots we found a larger abundance of Glomus (p < 0.05), while in ST plots we found a larger abundance of Ambispora (p < 0.05) and Geosiphon (p < 0.05; Figure 4).

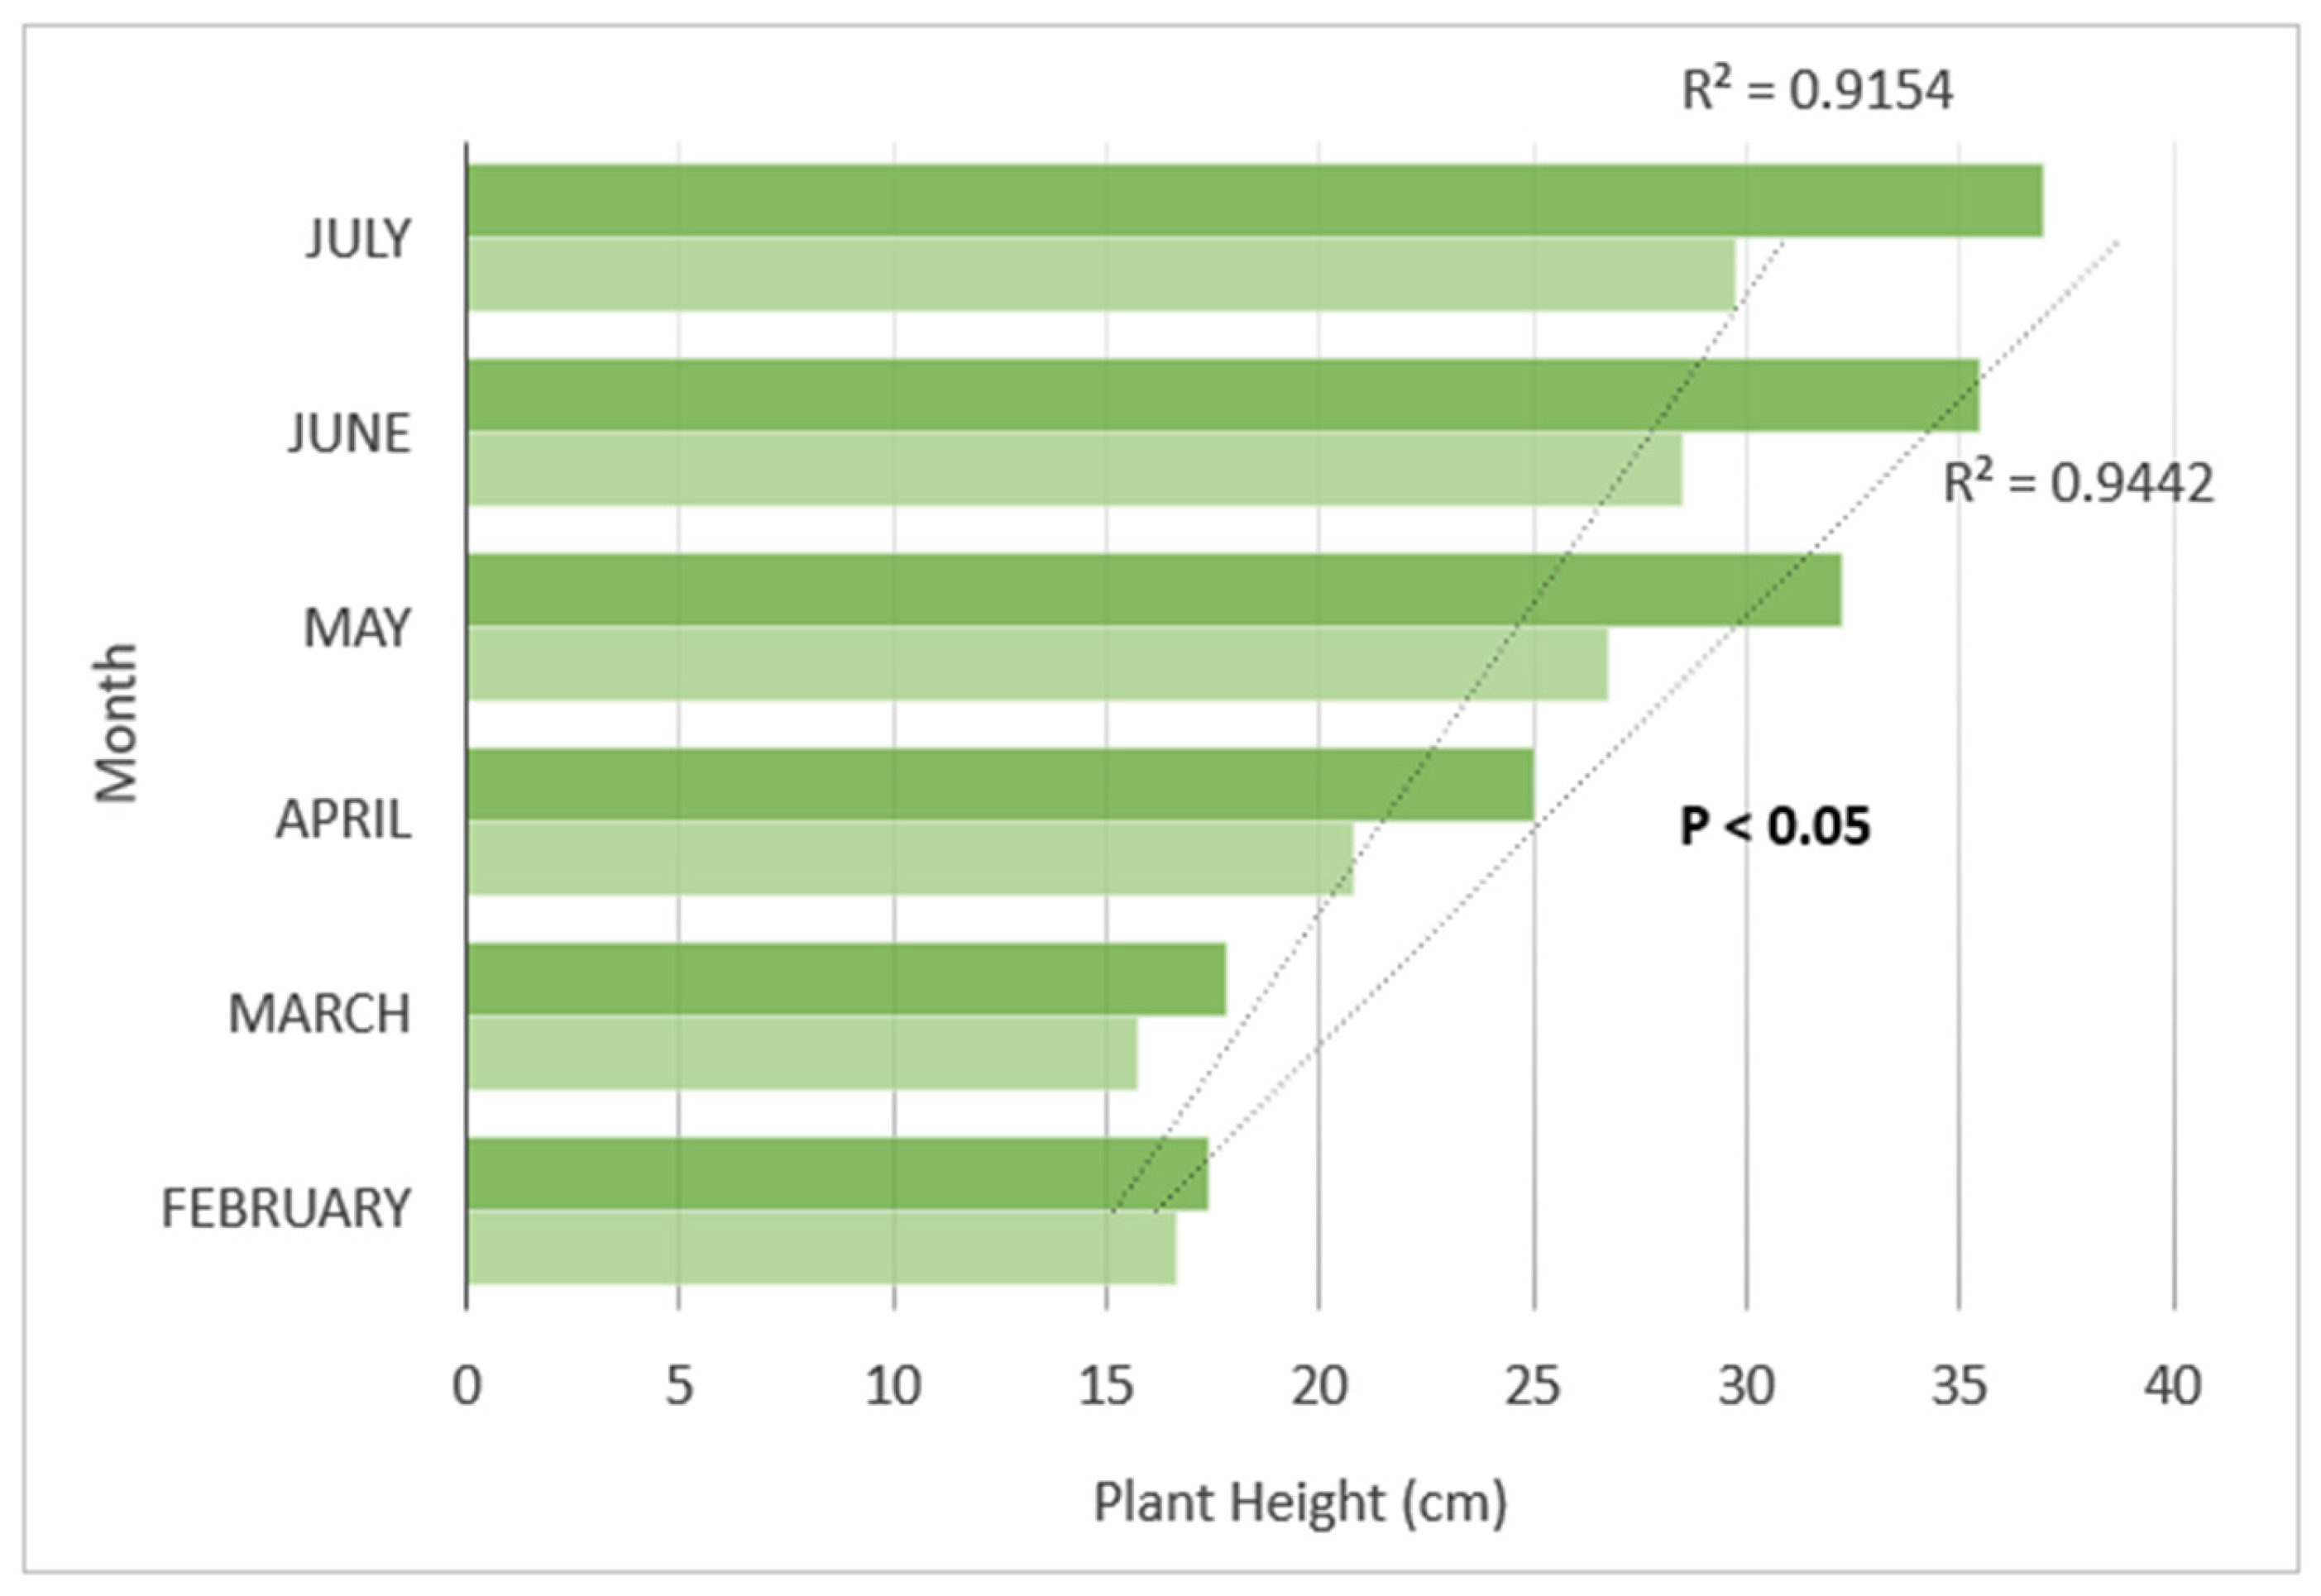
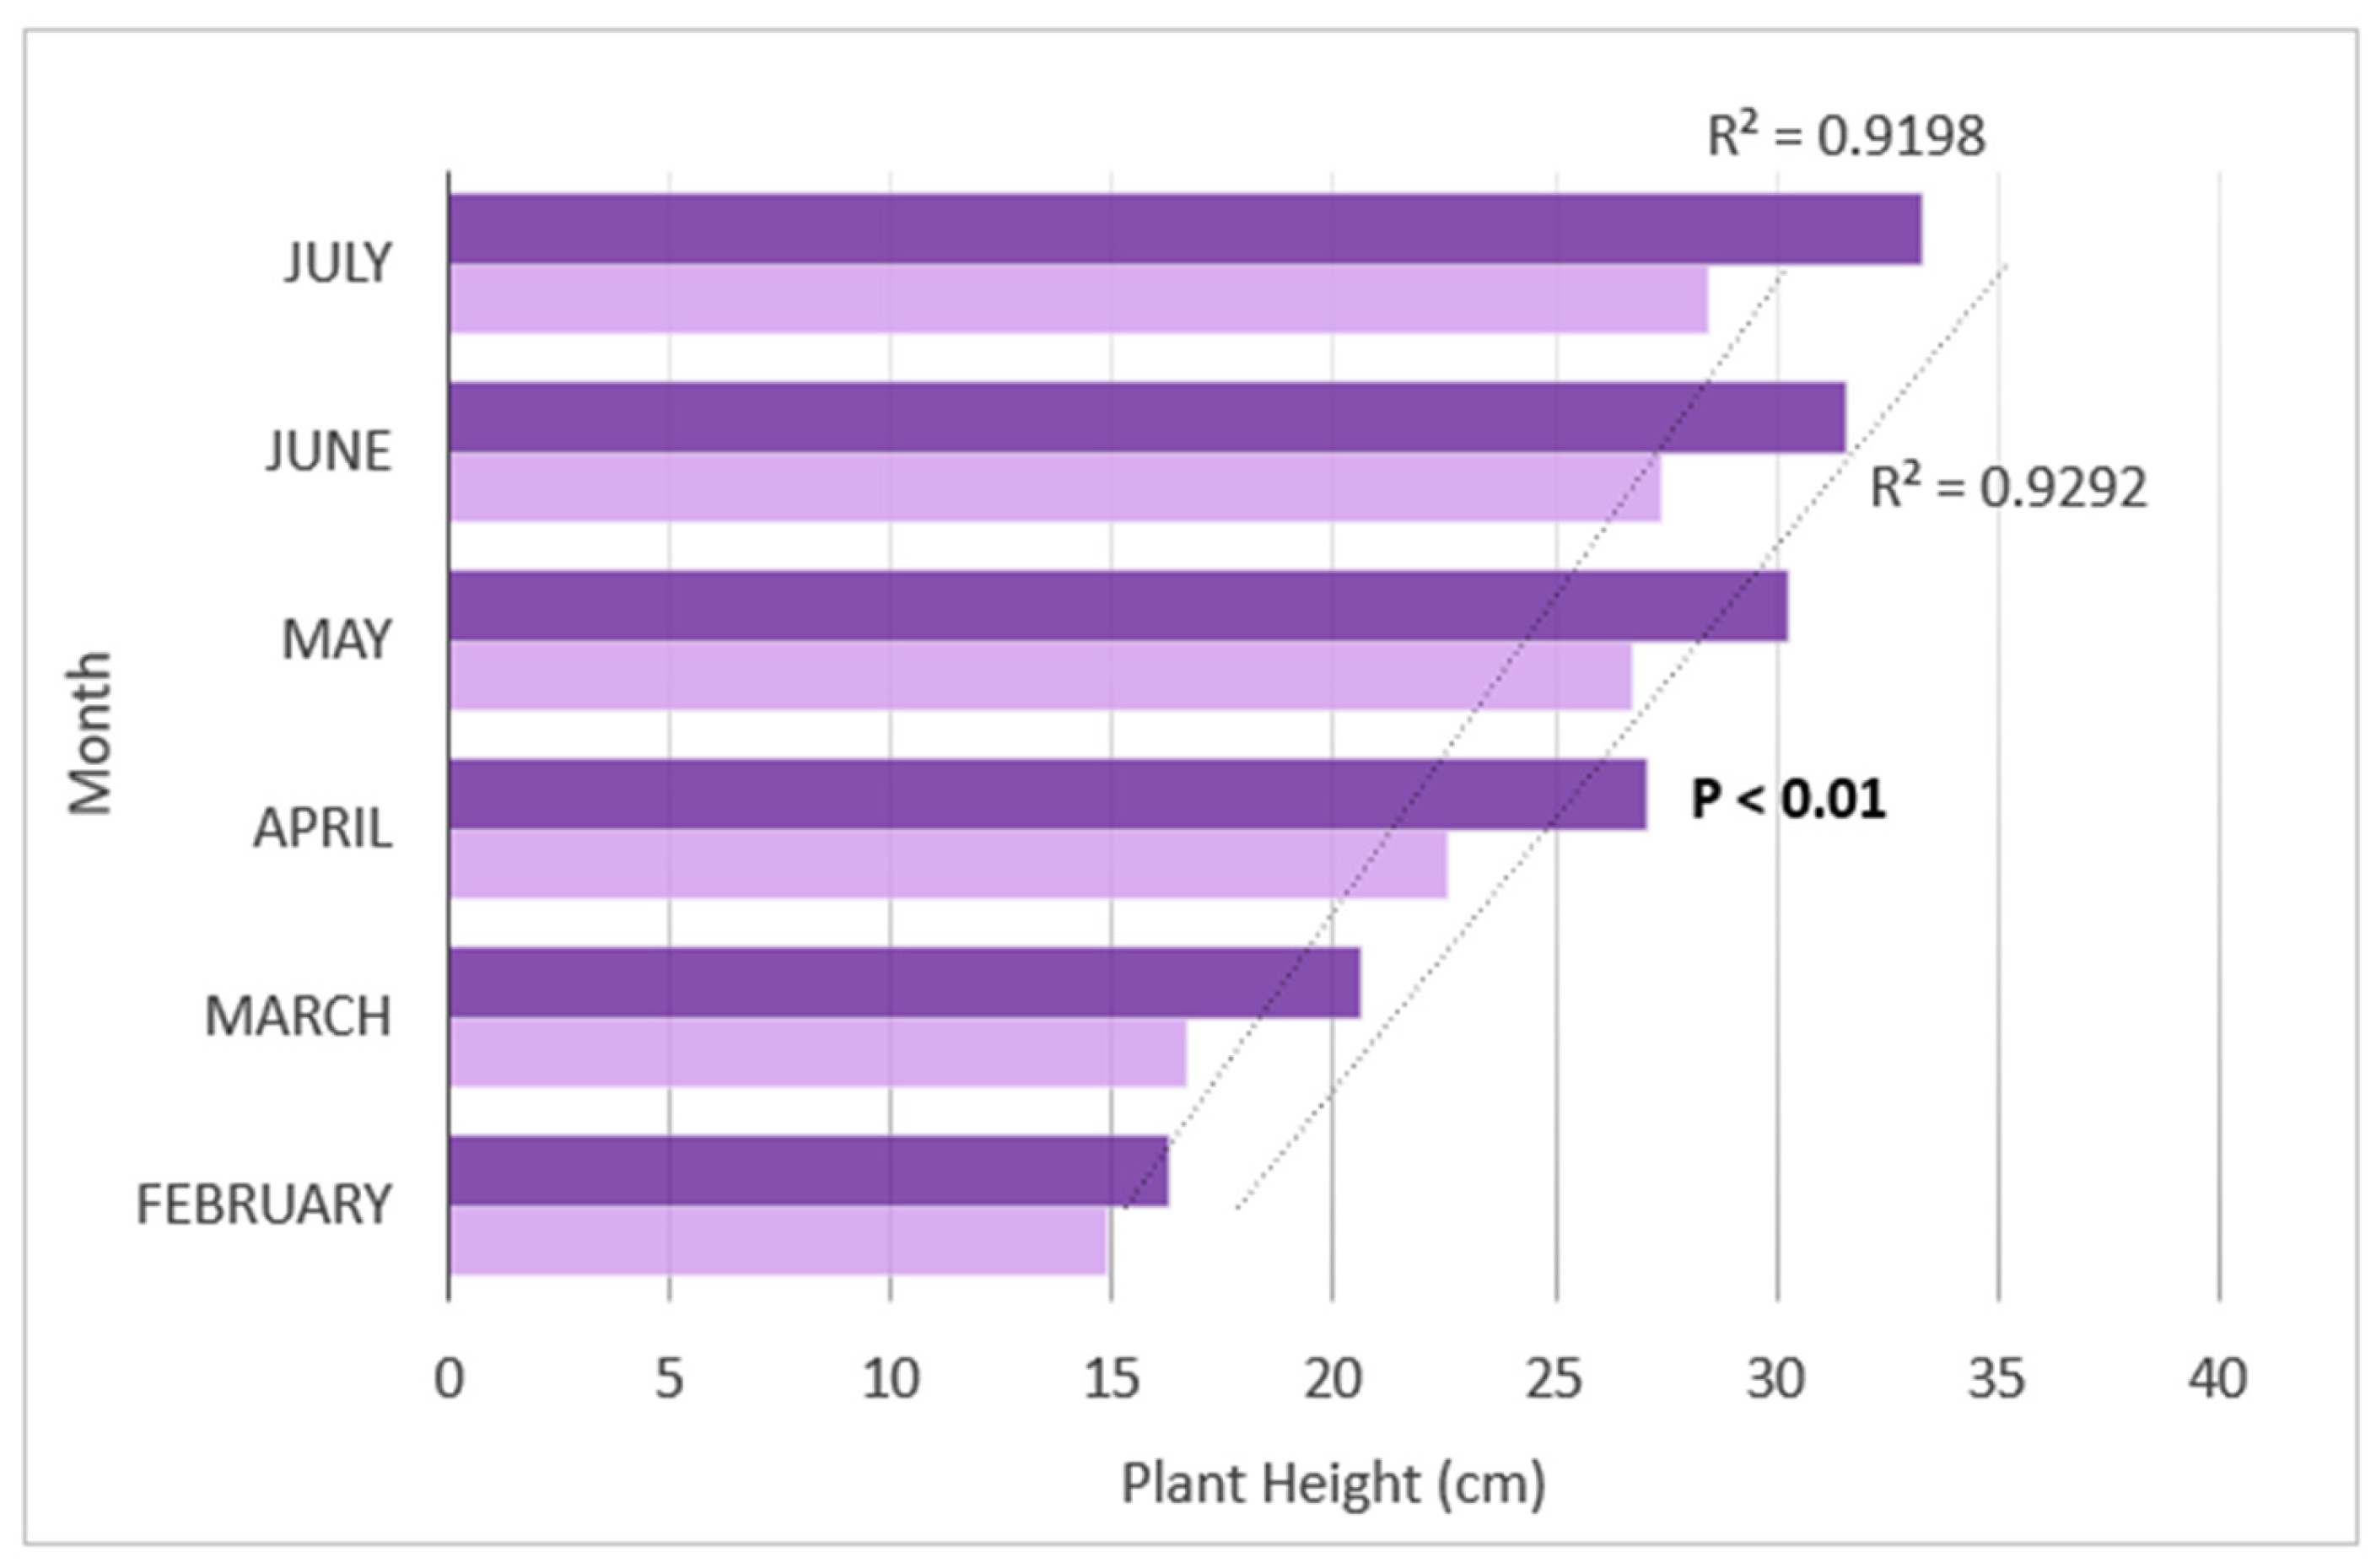
3.4. Plant Growth Trends

After about eight months of growth in the field (February–August), there was a significant correlation between plant growth and soil type that was species-specific (p < 0.01). The total seedling length for all species ranged from 9–66.5 cm and the total biomass ranged from 1.76–21.99 g in the last month of growth. The A. californica (p < 0.05; Figure 5) and B. pilularis (p < 0.01; Figure 6) seedlings had longer lengths in UT plots as compared to ST plots. Salvia leucophylla was not affected by inoculum type. We found significant differences in native plant growth and the composition of microbial taxa between UT and ST plots, indicating that the post-invasive microbial communities in ST plots were different than those from the uninvaded soil communities in UT plots; ostensibly these differences across soil microbiomes could impact plant growth.

4. Discussion

4.1. Bacterial Composition

4.1.1. Roots and Rhizosphere

The root and rhizosphere communities of the 30 harvested plants were different in their overall microbial composition. This is most likely due to the lack of selective pressure for microbial species in the rhizosphere compared to the roots. The most striking difference was the greater abundance of cyanobacteria in roots as compared to the rhizosphere soils.
Cyanobacteria are photosynthetic bacteria and are the only prokaryotes capable of producing oxygen. Some cyanobacteria are N-fixing and live in a symbiotic relationship with plants or fungi [50]. The large quantity of cyanobacteria and Firmicutes in these roots suggests that these bacteria are very important for the growth of native shrubs and gives us more insight into the healthy functioning of these systems. However, it is worth noting that Cyanobacteria are most commonly found in moist soils, rather than arid soils as was characteristic of soils in our study. Thus, database bias may have contributed to this observed trend. In order to check this, we performed a BLAST search using the NCBI BioSystems Database. Since each of the reference sequences showed a similar high percentage match to multiple Cyanobacteria genera, this is a good indication that the OTUs genuinely represent Cyanobacteria, rather than relics of chloroplast-containing taxa that can be recovered from databases prior to quality filtering.

4.1.2. Rhizosphere by Treatment

The only significant difference between soil treatments was the abundance of Gemmatimonadetes, a bacterial phylum well adapted for living in arid, exposed soils [51]. Gemmatimonadetes has been found in high abundance in soils that suppress the harmful plant fungal pathogen Fusarium oxysporum [52]. Fusarium species infect a broad range of host plants and are difficult to irradicate from soil due to their resistant spores that can remain viable in soil for many years. When dissecting the microbial anatomy of soils that are able to suppress this harmful pathogen, Gemmatimonadetes was found in high abundance along with four other rhizobacterial phyla [52]. This indicates that the presence of Gemmatimonadetes may be beneficial to plant health. In addition, Gemmatimonadetes has been shown to decrease in abundance in eroded unhealthy soils [53] and to significantly reduce the toxicity of Cadmium in contaminated soils [54]. Even a small change in Gemmatimonadetes soil abundance has been suggested to have a large impact on grassland soil properties, which could impact plant growth [55]. It may be that Gemmatimonadetes is indicative of a healthy soil community. Given the lower abundance of Gemmatimonadetes in sterilized soil inoculum (ST) plots, this may be a sign of declining soil health in that soil type. Further studies regarding the ecology of Gemmatimonadetes are required to fully understand this abundance trend.

4.2. Fungal Composition

Glomus is the largest genus of AMF, comprising ~85 species [56]. Glomalean fungi are obligate symbionts that are dependent on plant roots for their survival. Another abundant genus detected in our study was Ambispora, from the AM family Ambisporaceae, a cryptic ancestral guild of AM fungi that allocates low levels of biomass to both intraradical and extramatrical hyphae [57] and maintains mycorrhizal associations with plant roots. Geosiphon, however, does not form mycorrhizal associations with plants, but instead forms an endosymbiotic relationship with cyanobacteria [58]. We detected a high abundance of Geosiphon in native plant roots. The observed increased abundance of Glomus in the unsterilized soil inoculum (UT) plots may have contributed to the observed greater plant growth in both A. californica and B. pilularis as Glomus has been shown to enhance semiarid plant survival by improving growth in very dry conditions [59]. In fact, Glomus has been used widely as a biofertilizer to enhance plant growth [60,61] and has been shown to be more effective than traditional fertilizer in enhancing plant growth [62] Considering that the growth response to different AMF species varies among plant species [63], it may be that A. californica and B. pilularis depend on Glomus in particular for growth. Therefore, the lack of Glomus in the post-invasive soil could decrease the growth of these plants and possibly prevent them from naturally establishing in the site.
It is possible that these observed trends are due to abiotic changes that were not measured, presence of glyphosate in the soil, or other biotic changes such as shifts in pathogenic or saprotrophic fungi. Glyphosate has a half-life of approximately two weeks and does not have residual soil activity on the seedbank. Additionally, several years had elapsed between herbicide treatment and transplant of seedlings into the site. As far as unmeasured abiotic changes, all plants were subject to the same soil additions, sun exposure, moisture, slope aspect, soil texture (Mipolomol), pH, and elevation. We did not observe differences in either plant growth or microbial composition by block. It is most likely that the microbial changes brought on by Harding grass are responsible for the trends observed in this study.
Although our study targeted multiple loci, we only described a portion of the microbial community. Ostensibly, detection of additional fungal groups and soil animals which could have further contributed to altering soil microbial community composition and functioning was beyond the scope of our study. When soil core sampling occurred, we took cores at the drip zone of the plant, hoping to capture both rhizosphere and bulk soil communities. However, it may be that the surrounding bulk soil overwhelmed the minute differences between rhizosphere soils in the UT compared to ST plots. This may be why we observed differences by treatment (UT or ST) only in the rhizosphere of the destructively sampled plants, but not in the soil cores taken in February and April. In the future, it may be best for studies such as this to either sample closer to the roots or sample plants throughout the experiment, rather than just at the end.
Although this study shows evidence that P. aquatica invasions, and their subsequent removal, have lasting impact on above and belowground ecosystems, it has some spatial limitations. For instance, we collected our “uninvaded soil” from one site in southern California that was intact and replete with native vegetation and conducted the main body of the study in one “post-invasion” site. Therefore, our conclusions are limited solely to this ecosystem. However, our previous greenhouse experiment revealed that there were microbial legacy effects from the invasive grass at this particular site. Here, we observed reduced native plant performance after P. aquatica removal over several years prior to conducting this field experiment.

5. Conclusions

We identified quantifiable and lingering soil legacy effects left behind by the invasive P. aquatica in our study site [37] that affect the growth of some CSS native plants. Now we understand that these legacy effects have a definite microbial component. There are several short-term studies that show invasive plants can alter the soil biotic community [54] and several others that suggest there may be some long-term biotic legacy effects. Here, we show that there are definite changes in the bacterial and fungal composition of soils that persist for years after an invasive plant has been removed and that these changes can alter native plant growth.
Our findings indicate that soil inoculum does beneficially impact native plant growth in a restoration and that the microbial communities associated with inoculated native plants differ from non-inoculated native plants. Future work will focus on determining if these differences in the soil microbial community are directly responsible for increased native plant growth. If a direct connection can be found, then remediation of the soil microbial community through inoculation could improve restoration in post-invasive sites. As a relatively small amount of unsterilized soil inoculum (~9.5 L) was sufficient for propagation of 90 native plants before planting into the restoration site, the methods stated in this paper should be feasible for scale-up to larger restorations.

Author Contributions

Conceptualization, B.P., I.C.I. and E.L.A.; methodology, B.P., I.C.I. and E.L.A.; software, B.P., M.R.M., H.S. and K.A.; validation, B.P., M.R.M., H.S., K.A. and I.C.I.; formal analysis, K.A., B.P., M.R.M. and H.S.; investigation, B.P., M.R.M. and E.L.A.; resources, B.P., I.C.I. and E.L.A.; data curation, E.L.A.; writing—original draft, B.P. and M.R.M.; writing—review and editing, B.P., M.R.M. and E.L.A.; visualization B.P., K.A. and M.R.M.; supervision, E.L.A. and I.C.I.; project administration, E.L.A., I.C.I., B.P. and M.R.M.; funding acquisition, E.L.A. and B.P. All authors have read and agreed to the published version of the manuscript.

Funding

This research was supported by the Santa Monica Mountains National Recreation Area (U.S. National Park Service), USDA NIFA AFRI grant CA-R-PPA-5101-CG, USDA NIFA HATCH grant CA-R-PPA-5093-H, and NSF ICER-1541047. Also, B.P. was supported by the National Science Foundation Graduate Fellowship DGE-1326120 and the UCR Center for Conservation Biology Shipley Skinner fund.

Data Availability Statement

The data form the study can be obtained upon request from the corresponding author.

Acknowledgments

We thank T. Barsotti, C. Carey, K. Caso, D. Jackson, G. Logan, R. Richards, S. Saroa, M. Phillips, A. Swanson, and J. Valliere for intellectual feedback and insightful comments on previous drafts.

Conflicts of Interest

The authors declare no conflict of interest.

References

  1. DiTomaso, J.M. Invasive weeds in rangelands: Species, impacts, and management. Weed Sci. 2000, 48, 255–265. [Google Scholar]
  2. Westman, E.W. Diversity relations and succession in Californian coastal sage scrub. Ecology 1981, 62, 170–184. [Google Scholar] [CrossRef]
  3. Rubinoff, D. Evaluating the California Gnatcatcher as an umbrella species for conservation of southern California coastal sage scrub. Conserv. Biol. 2001, 15, 1374–1383. [Google Scholar]
  4. D’Antonio, C.M.; Vitousek, P.M. Biological Invasions by Exotic Grasses, the Grass/Fire Cycle, and Global Change. Annu. Rev. Ecol. Syst. 1992, 23, 63–87. [Google Scholar] [CrossRef]
  5. Lowry, E.; Rollinson, E.J.; Laybourn, A.J.; Scott, T.E.; Aiello-Lammens, M.E.; Gray, S.M.; Mickley, J.; Gurevitch, J. Biological invasions: A field synopsis, systematic review, and database of the literature. Ecol. Evol. 2012, 3, 182–196. [Google Scholar] [CrossRef]
  6. Eviner, V.T.; Hoskinson, S.A.; Hawkes, C.V. Ecosystem impacts of exotic plants can feed back to increase invasion in western US rangelands. Rangelands 2010, 32, 21–31. [Google Scholar] [CrossRef] [Green Version]
  7. Ehrenfeld, J.G. Effects of exotic plant invasions on soil nutrient cycling processes. Ecosystems 2003, 6, 503–523. [Google Scholar]
  8. Saggar, S.; McIntosh, P.D.; Hedley, C.B.; Knicker, H. Changes in soil microbial biomass, metabolic quotient, and organic matter turnover under Hieracium (H. pilosella L.). Biol. Fertil. Soils 1999, 30, 232–238. [Google Scholar] [CrossRef]
  9. Ehrenfeld, J.G.; Ravit, B.; Elgersma, K. Feedback in the Plant-Soil System. Ann. Rev. Environ. Resour. 2005, 30, 75–115. [Google Scholar] [CrossRef] [Green Version]
  10. Dickens, S.J.M.; Allen, E.B.; Santiago, L.; Crowley, D. Exotic annuals reduce soil heterogeneity in coastal sage scrub soil chemical and biological characteristics. Soil Biol. Biochem. 2013, 58, 70–81. [Google Scholar] [CrossRef]
  11. Jeong, S.; Kim, T.; Choi, B.; Kim, Y.; Kim, E. Invasive Lactuca serriola seeds contain endophytic bacteria that contribute to drought tolerance. Sci. Rep. 2021, 11, 13307. [Google Scholar] [CrossRef] [PubMed]
  12. Tian, B.; Pei, Y.; Huang, W.; Ding, J.; Siemann, E. Increasing flavonoid concentrations in root exudates enhance associations between arbuscular mycorrhizal fungi and an invasive plant. ISME J. 2021, 15, 1919–1930. [Google Scholar] [PubMed]
  13. McLeod, M.L.; Bullington, L.; Cleveland, C.C.; Rousk, J.; Lekberg, Y. Invasive plant-derived dissolved organic matter alters microbial communities and carbon cycling in soils. Soil Biol. Biochem. 2021, 156, 108191. [Google Scholar] [CrossRef]
  14. Bever, J.D.; Schultz, P.A.; Pringle, A.; Morton, J.B. Arbuscular Mycorrhizal Fungi: More Diverse than Meets the Eye, and the Ecological Tale of Why. Bioscience 2001, 51, 923–931. [Google Scholar] [CrossRef] [Green Version]
  15. Batten, K.M.; Scow, K.M.; Davies, K.F.; Harrison, S.P. Two Invasive Plants Alter Soil Microbial Community Composition in Serpentine Grasslands. Biol. Invasions 2006, 8, 217–230. [Google Scholar] [CrossRef]
  16. Lankau, E.W.; Lankau, R.A. Plant species capacity to drive soil fungal communities contributes to differential impacts of plant–soil legacies. Ecology 2014, 95, 3221–3228. [Google Scholar] [CrossRef]
  17. Miller, R.M.; Jastrow, J.D. Mycorrhizal fungi influence soil structure. In Arbuscular Mycorrhizas: Molecular Biology and Physiology; Kluwer Academic Press: Dordrecht, The Netherlands, 2000; pp. 3–18. [Google Scholar]
  18. Klironomos, J. Feedback with soil biota contributes to plant rarity and invasiveness in communities. Nature 2002, 417, 67–70. [Google Scholar] [CrossRef]
  19. Barto, K.; Friese, C.; Cipollini, D. Arbuscular Mycorrhizal Fungi Protect a Native Plant from Allelopathic Effects of an Invader. J. Chem. Ecol. 2010, 36, 351–360. [Google Scholar] [CrossRef]
  20. Vogelsang, K.M.; Bever, J.D.; Griswold, M.; Schultz, P.A. The Use of Mycorrhizal Fungi in Erosion Control Applications; Final Report for Caltrans Contract No. 65A0070; California Department of Transportation: Sacramento, CA, USA, 2004. [Google Scholar]
  21. Aprahamian, A.M.; Lulow, M.E.; Major, M.R.; Balazs, K.R.; Treseder, K.K.; Maltz, M.R. Arbuscular mycorrhizal inoculation in coastal sage scrub restoration. Botany 2016, 94, 493–499. [Google Scholar] [CrossRef]
  22. Sieverding, E.; Oehl, F. Are arbuscular mycorrhizal fungal species invasive-derived from our knowledge about their distribution in different ecosystems? In BCPC Symposium Proceedings No. 81: Plant Protection and Plant Health in Europe: Introduction and Spread of Invasive Species; Monograph Series; The British Crop Protection Council: Alton, UK, 2005; pp. 197–202. [Google Scholar]
  23. Bever, J.D.; Dickie, I.A.; Facelli, E.; Facelli, J.M.; Klironomos, J.; Moora, M.; Rillig, M.C.; Stock, W.D.; Tibbett, M.; Zobel, M. Rooting theories of plant community ecology in microbial interactions. Trends Ecol. Evol. 2010, 25, 468–478. [Google Scholar]
  24. Cuddington, K. Legacy effects: The persistent impact of ecological interactions. Biol. Theory 2011, 6, 203–210. [Google Scholar] [CrossRef]
  25. Hawkes, C.V.; Belnap, J.; D’Antonio, C.; Firestone, M.K. Arbuscular mycorrhizal assemblages in native plant roots change in the presence of invasive exotic grasses. Plant Soil 2006, 281, 369–380. [Google Scholar] [CrossRef]
  26. Jordan, N.R.; Larson, D.L.; Huerd, S.C. Soil modification by invasive plants: Effects on native and invasive species of mixed-grass prairies. Biol. Invasions 2008, 10, 177–190. [Google Scholar]
  27. Mangla, S.; Callaway, I.M.; Callaway, R.M. Exotic invasive plant accumulates native soil pathogens which inhibit native plants. J. Ecol. 2008, 96, 58–67. [Google Scholar] [CrossRef]
  28. Liao, C.; Peng, R.; Luo, Y.; Zhou, X.; Wu, X.; Fang, C.; Chen, J.; Li, B. Altered ecosystem carbon and nitrogen cycles by plant invasion: A meta-analysis. New Phytol. 2008, 177, 706–714. [Google Scholar] [PubMed]
  29. Belnap, J.; Phillips, S.L.; Sherrod, S.K.; Moldenke, A. Soil biota can change after exotic plant invasion: Does this affect ecosystem processes? Ecology 2005, 86, 3007–3017. [Google Scholar]
  30. Bozzolo, F.H.; Lipson, D.A. Differential responses of native and exotic coastal sage scrub plant species to N additions and the soil microbial community. Plant Soil 2013, 371, 37–51. [Google Scholar] [CrossRef]
  31. Tran, J.; Cavagnaro, T.R. Growth and mycorrhizal colonization of two grasses in soils with different inundation histories. J. Arid Environ. 2010, 74, 715–717. [Google Scholar] [CrossRef]
  32. Asghari, H.; Cavagnaro, T. Arbuscular mycorrhizas enhance plant interception of leached nutrients. Funct. Plant Biol. 2011, 38, 219–226. [Google Scholar]
  33. Calflora: Information on California Plants for Education, Research, and Conservation. The Calflora Database. Distribution Data from Eileen Berbeo and Tarja Sag, Council for Watershed Health, and Cal-IPC Checklists. 2014. Available online: http://www.calflora.org/cgi-bin/noccdetail.cgi?seq_num=wb830-264andtaxon=Phalaris+aquatica (accessed on 11 May 2018).
  34. Bowler, P.A. Ecological restoration of coastal sage scrub and its potential role in habitat conservation plans. Environ. Manag. 2000, 26, S85–S96. [Google Scholar] [CrossRef]
  35. Weatherburn, M.W. Phenol-hypochlorite reaction for determination of ammonia. Anal. Chem. 1967, 39, 971–974. [Google Scholar]
  36. Doane, T.A.; Horwath, W.R. Spectrophotometric determination of nitrate with a single reagent. Anal. Lett. 2003, 36, 2713–2722. [Google Scholar]
  37. Pickett, B.; Irvine, I.C.; Bullock, E.; Arogyaswamy, K.; Aronson, E. Legacy effects of invasive grass impact soil microbes and native shrub growth. Invasive Plant Sci. Manag. 2019, 12, 22–35. [Google Scholar] [CrossRef]
  38. Klindworth, A.; Pruesse, E.; Schweer, T.; Peplies, J.; Quast, C.; Horn, M.; Glöckner, F.O. Evaluation of general 16S ribosomal RNA gene PCR primers for classical and next-generation sequencing-based diversity studies. Nucleic Acids Res. 2013, 41, e1. [Google Scholar] [PubMed]
  39. Geer, L.Y.; Marchler-Bauer, A.; Geer, R.C.; Han, L.; He, J.; He, S.; Liu, C.; Shi, W.; Bryant, S.H. The NCBI biosystems database. Nucleic Acids Res. 2010, 38, 492–496. [Google Scholar] [CrossRef] [Green Version]
  40. Schmidt, K.T.; Maltz, M.; Ta, P.; Khalili, B.; Weihe, C.; Phillips, M.; Aronson, E.; Lulow, M.; Long, J.; Kimball, S. Identifying mechanisms for successful ecological restoration with salvaged topsoil in coastal sage scrub communities. Diversity 2020, 12, 150. [Google Scholar] [CrossRef] [Green Version]
  41. Lee, J.; Lee, S.; Young, J.P.W. Improved PCR primers for the detection and identification of arbuscular mycorrhizal fungi. FEMS Microbiol. Ecol. 2008, 65, 339–349. [Google Scholar] [CrossRef] [Green Version]
  42. Berry, D.; Mahfoudh, K.B.; Wagner, M.; Loy, A. Barcoded primers used in multiplex amplicon pyrosequencing bias amplification. Appl. Environ. Microbiol. 2011, 78, 612. [Google Scholar] [CrossRef] [Green Version]
  43. Kuczynski, J.; Stombaugh, J.; Walters, W.A.; González, A.; Caporaso, J.G.; Knight, R. Using QIIME to analyze 16S rRNA gene sequences from microbial communities. Curr. Protoc. Microbiol. 2012, 27, 1–28. [Google Scholar] [CrossRef]
  44. Dhariwal, A.; Chong, J.; Habib, S.; King, I.; Agellon, L.B.; Xia, J. MicrobiomeAnalyst-a web-based tool for comprehensive statistical, visual, and meta-analysis of microbiome data. Nucleic Acids Res. 2017, 45, 180–188. Available online: http://www.microbiomeanalyst.ca/faces/home.xhtml (accessed on 1 October 2019). [CrossRef]
  45. Oksanen, J.; Blanchet, F.G.; Friendly, M.; Kindt, R.; Legendre, P.; McGlinn, D.; Minchin, P.R.; O’Hara, R.B.; Simpson, G.L.; Solymos, P.; et al. Vegan: Community Ecology Package. R Package Version 2.5-2. 2018. Available online: https://cran.r-project.org/web/packages/vegan/index.html (accessed on 1 October 2019).
  46. Kassambara, A. ggpubr: ‘ggplot2’ Based Publication Ready Plots. R Package Version 0.1.7. 2018. Available online: https://cran.r-project.org/web/packages/ggpubr/index.html (accessed on 1 October 2019).
  47. Martin, M. Cutadapt removes adapter sequences from high-throughput sequencing reads. EMBnet. J. 2011, 17, 5–7. [Google Scholar]
  48. Andrews, S. FastQC: A Quality Control Tool for High Throughput Sequence Data. 2010. Available online: http://www.bioinformatics.babraham.ac.uk/projects/fastqc (accessed on 1 October 2019).
  49. Öpik, M.; Vanatoa, A.; Vanatoa, E.; Moora, M.; Davison, J.; Kalwij, J.M.; Reier, Ü.; Zobel, M. The online database MaarjAM reveals global and ecosystemic distribution patterns in arbuscular mycorrhizal fungi (Glomeromycota). New Phytologist 2010, 188, 223–241. [Google Scholar] [CrossRef] [PubMed]
  50. Rai, A.N.; Singh, A.K.; Syiem, M.B. Chapter 23—Plant growth-promoting abilities in Cyanobacteria. In Cyanobacteria; Mishra, A.K., Tiwari, D.N., Rai, A.N., Eds.; Academic Press: Cambridge, MA, USA, 2019; pp. 459–476. [Google Scholar]
  51. DeBruyn, J.; Nixon, L.; Fawaz, M.; Johnson, M.; Radosevich, M. Global Biogeography and Quantitative Season Dynamics of Gemmatimonadetes in Soil. Appl. Environ. Microbiol. 2011, 77, 295–300. [Google Scholar]
  52. Cha, J.Y.; Han, S.; Hong, H.J.; Cho, H.; Kim, D.; Kwon, Y.; Kwon, S.; Crusemann, M.; Lee, Y.B.; Kim, J.F.; et al. Microbial and biochemical basis of a Fusarium wilt-suppressive soil. ISME J. 2016, 10, 119–129. [Google Scholar]
  53. Qiu, L.; Zhang, Q.; Zhu, H.; Reich, P.B.; Banerjee, S.; van der Heijden, M.G.A.; Sadowsky, M.J.; Ishii, S.; Jia, X.; Shao, M.; et al. Erosion reduces soil microbial diversity, network complexity and multifunctionality. ISME J. 2021, 15, 2474–2489. [Google Scholar] [CrossRef]
  54. Wang, M.; Li, S.; Chen, S.; Meng, N.; Li, X.; Zheng, H.; Zhao, C.; Wang, D. Manipulation of the rhizosphere bacterial community by biofertilizers is associated with mitigation of cadmium phytotoxicity. Sci. Total Environ. 2019, 649, 413–421. [Google Scholar] [CrossRef]
  55. Cao, J.; Wang, H.; Holden, N.M.; Adamowski, J.F.; Biswas, A.; Zhang, X.; Feng, Q. Soil properties and microbiome of annual and perennial cultivated grasslands on the Qinghai-Tibetan plateau. Land Degrad. Dev. 2021, 32, 5306–5321. [Google Scholar]
  56. Kirk, A.; Fox, S.; Entz, M.; Tenuta, M. Preliminary findings on the arbuscular mycorrhizal colonization of organic wheat. In Proceedings of the 16th IFOAM Organic World Congress, Modena, Italy, 19 June 2008. [Google Scholar]
  57. Weber, S.E.; Diez, J.M.; Andrews, L.V.; Goulden, M.L.; Aronson, E.L.; Allen, M.F. Responses of arbuscular mycorrhizal fungi to multiple coinciding global change drivers. Fungal Ecol. 2019, 40, 62–71. [Google Scholar] [CrossRef]
  58. Schussler, A. Molecular phylogeny, taxonomy, and evolution of Geoshiphon pyriformis and arbuscular mycorrhizal fungi. Plant Soil 2002, 241, 75–83. [Google Scholar] [CrossRef]
  59. Gong, M.; Tang, M.; Chen, H.; Zhang, Q.; Feng, X. Effects of two Glomus species on the growth and physiological performance of Sophora davidii seedlings under water stress. New For. 2013, 44, 399–408. [Google Scholar] [CrossRef]
  60. Berruti, A.; Lumini, E.; Balestrini, R.; Bianciotto, V. Arbuscular mycorrhizal fungi as natural biofertilizers: Let’s benefit from past successes. Front. Microbiol. 2016, 6, 1559. [Google Scholar] [CrossRef] [PubMed] [Green Version]
  61. Jack, C.N.; Petipas, R.H.; Cheeke, T.E.; Rowland, J.L.; Friesen, M.L. Microbial inoculants: Silver bullet or microbial Jurassic park? Trends Microbiol. 2021, 29, 299–308. [Google Scholar] [CrossRef] [PubMed]
  62. Pawar, P.B.; Khadilkar, J.P.; Kulkarni, M.V.; Melo, J.S. Compariative assessment using Glomus mosseae and NPK fertigation to evaluate its role in enhancing growth and yield of groundnut (Arachis hypogaea L.). J. Plant Nutr. 2020, 43, 1697–1711. [Google Scholar] [CrossRef]
  63. Van der Heijden, M.G.A.; Boller, T.; Wiemken, A.; Sanders, I.R. Different arbuscular mycorrhizal fungal species are potential determinantes of plant community structure. Ecology 1998, 79, 2082–2091. [Google Scholar] [CrossRef]
Figure 1. Principal coordinates analysis plot based on the weighted Unifrac distance metric for bacterial taxa in treatment and control plots. Ellipses represent standard deviations of the weighted average of treatments at the 95% confidence level.
Diversity 14 01095 g001
Figure 2. Principal coordinates analysis plot based on the weighted Unifrac distance metric for bacterial taxa. Ellipses represent standard deviations of the weighted average of treatments at the 95% confidence level. The rhizosphere soil is represented in blue, while the roots are represented in red.
Diversity 14 01095 g002
Figure 3. Relative abundances of genera (Acidobacteria, Actinobacteria, Bacteroidetes, Chloroflexi, Cyanobacteria, Firmicutes, Gemmatmonadetes, Nitrospirae, Planctomycetes, Proteobacteria, and Verrucomicrobia). Ten were significantly different between root and rhizosphere samples. Standard errors are represented in the figure by the error bars attached to each column (ns, not significant; “****”, p < 0.0001).
Diversity 14 01095 g003
Figure 4. Relative abundances of genera (Acaulospora, Ambispora, Archaeospora, Claroideoglomus, Diversispora, Entrophospora, Geosiphon, Glomus, Kuklospora, Paraglomus, and Scutellospora). Three were significantly different between treatment plots. Standard errors are represented in the figure by the error bars attached to each column (ns, not significant; “*”, p < 0.05).
Diversity 14 01095 g004
Figure 5. Artemisia californica plant height with unsterilized (dark green) compared to sterilized (light green) uninvaded soil inoculum.
Diversity 14 01095 g005
Figure 6. Baccharis pilularis height with unsterilized (dark purple) compared to sterilized (light purple) native soil inoculum.
Diversity 14 01095 g006
Publisher’s Note: MDPI stays neutral with regard to jurisdictional claims in published maps and institutional affiliations.

