

Spatial Distribution of the Taxonomic Diversity of Phytoplankton and Bioindication of the Shallow Protected Lake Borovoe in the Burabay National Natural Park, Northern Kazakhstan


Abstract
:1. Introduction
2. Materials and Methods
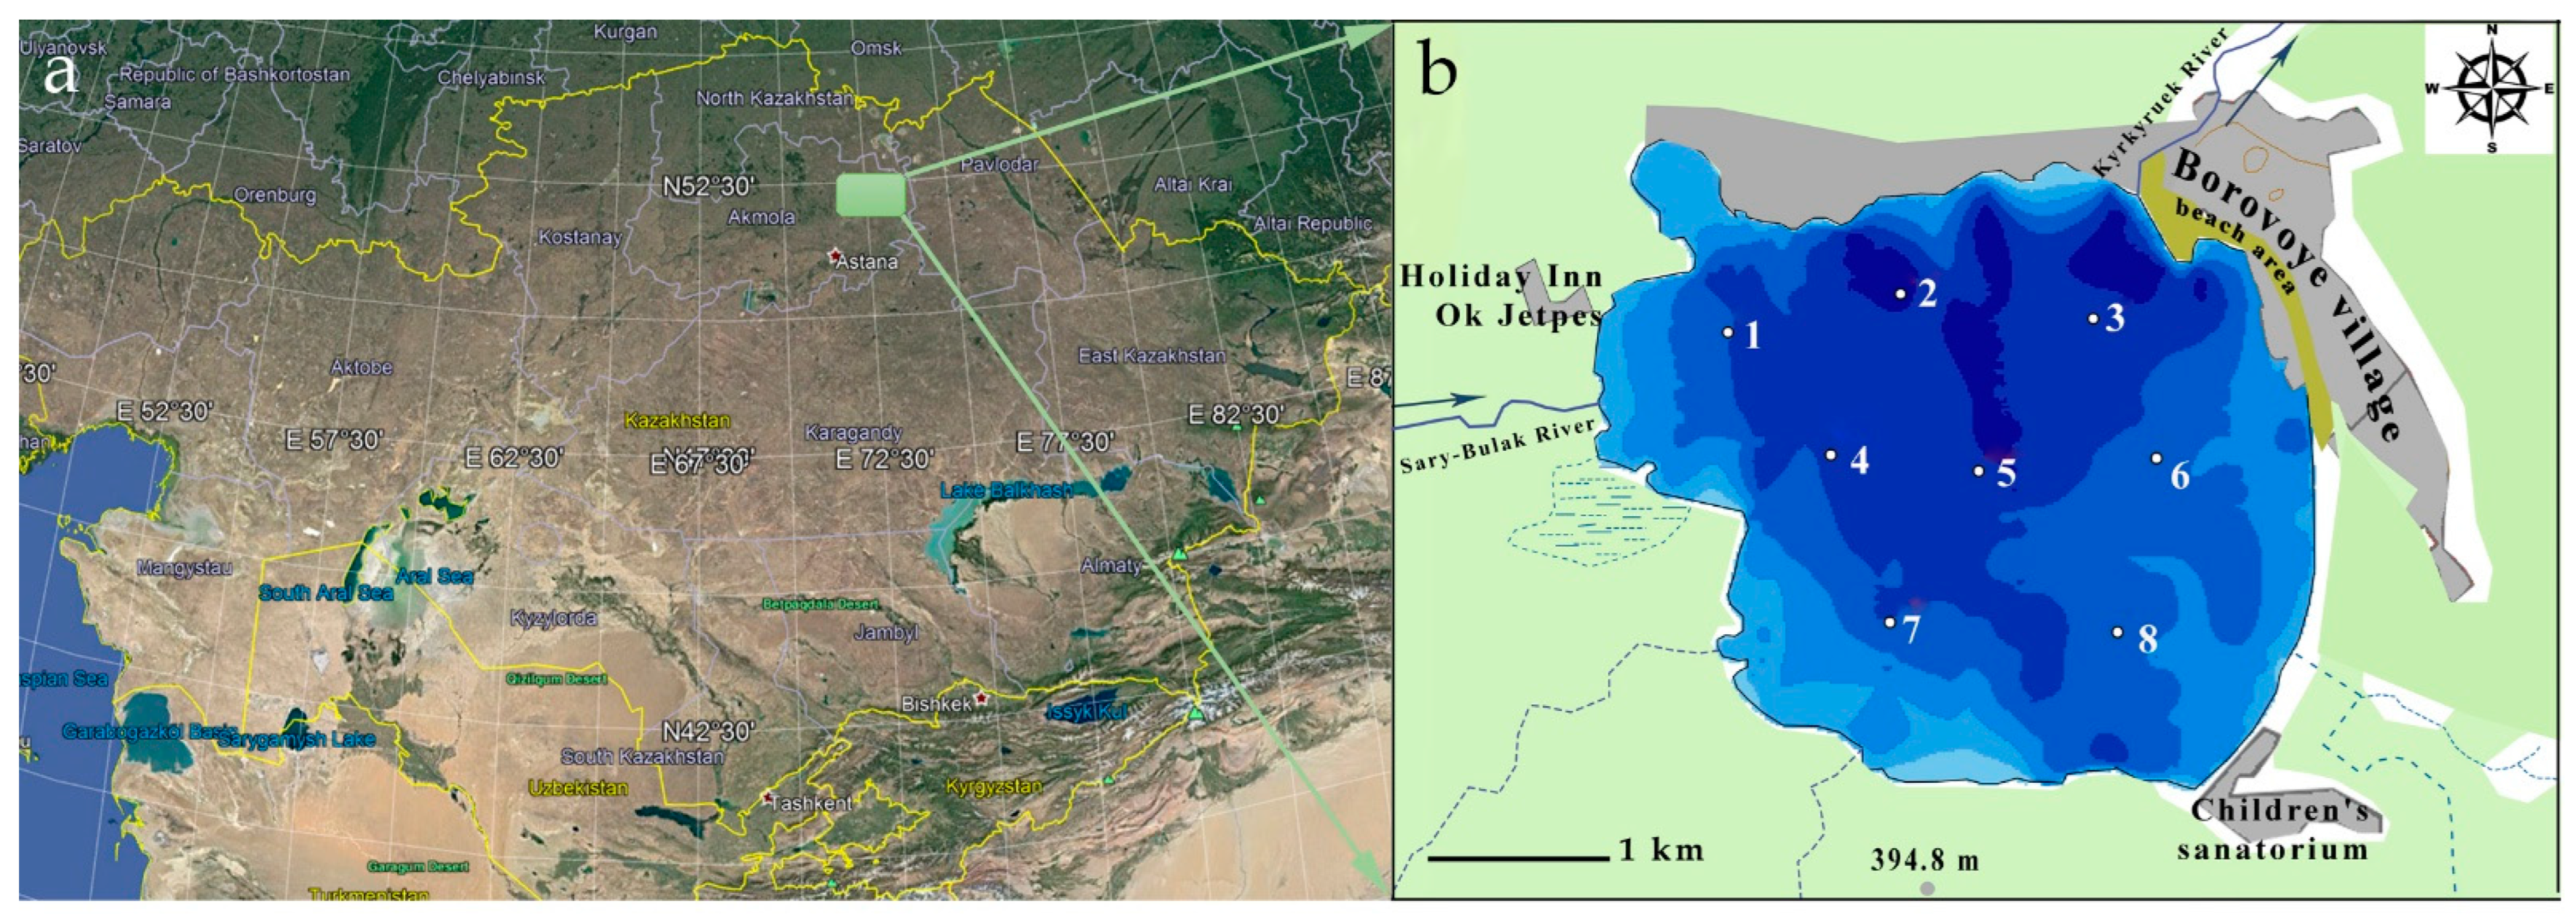
2.1. Description of Study Site
2.2. Sampling and Laboratory Analysis
3. Results
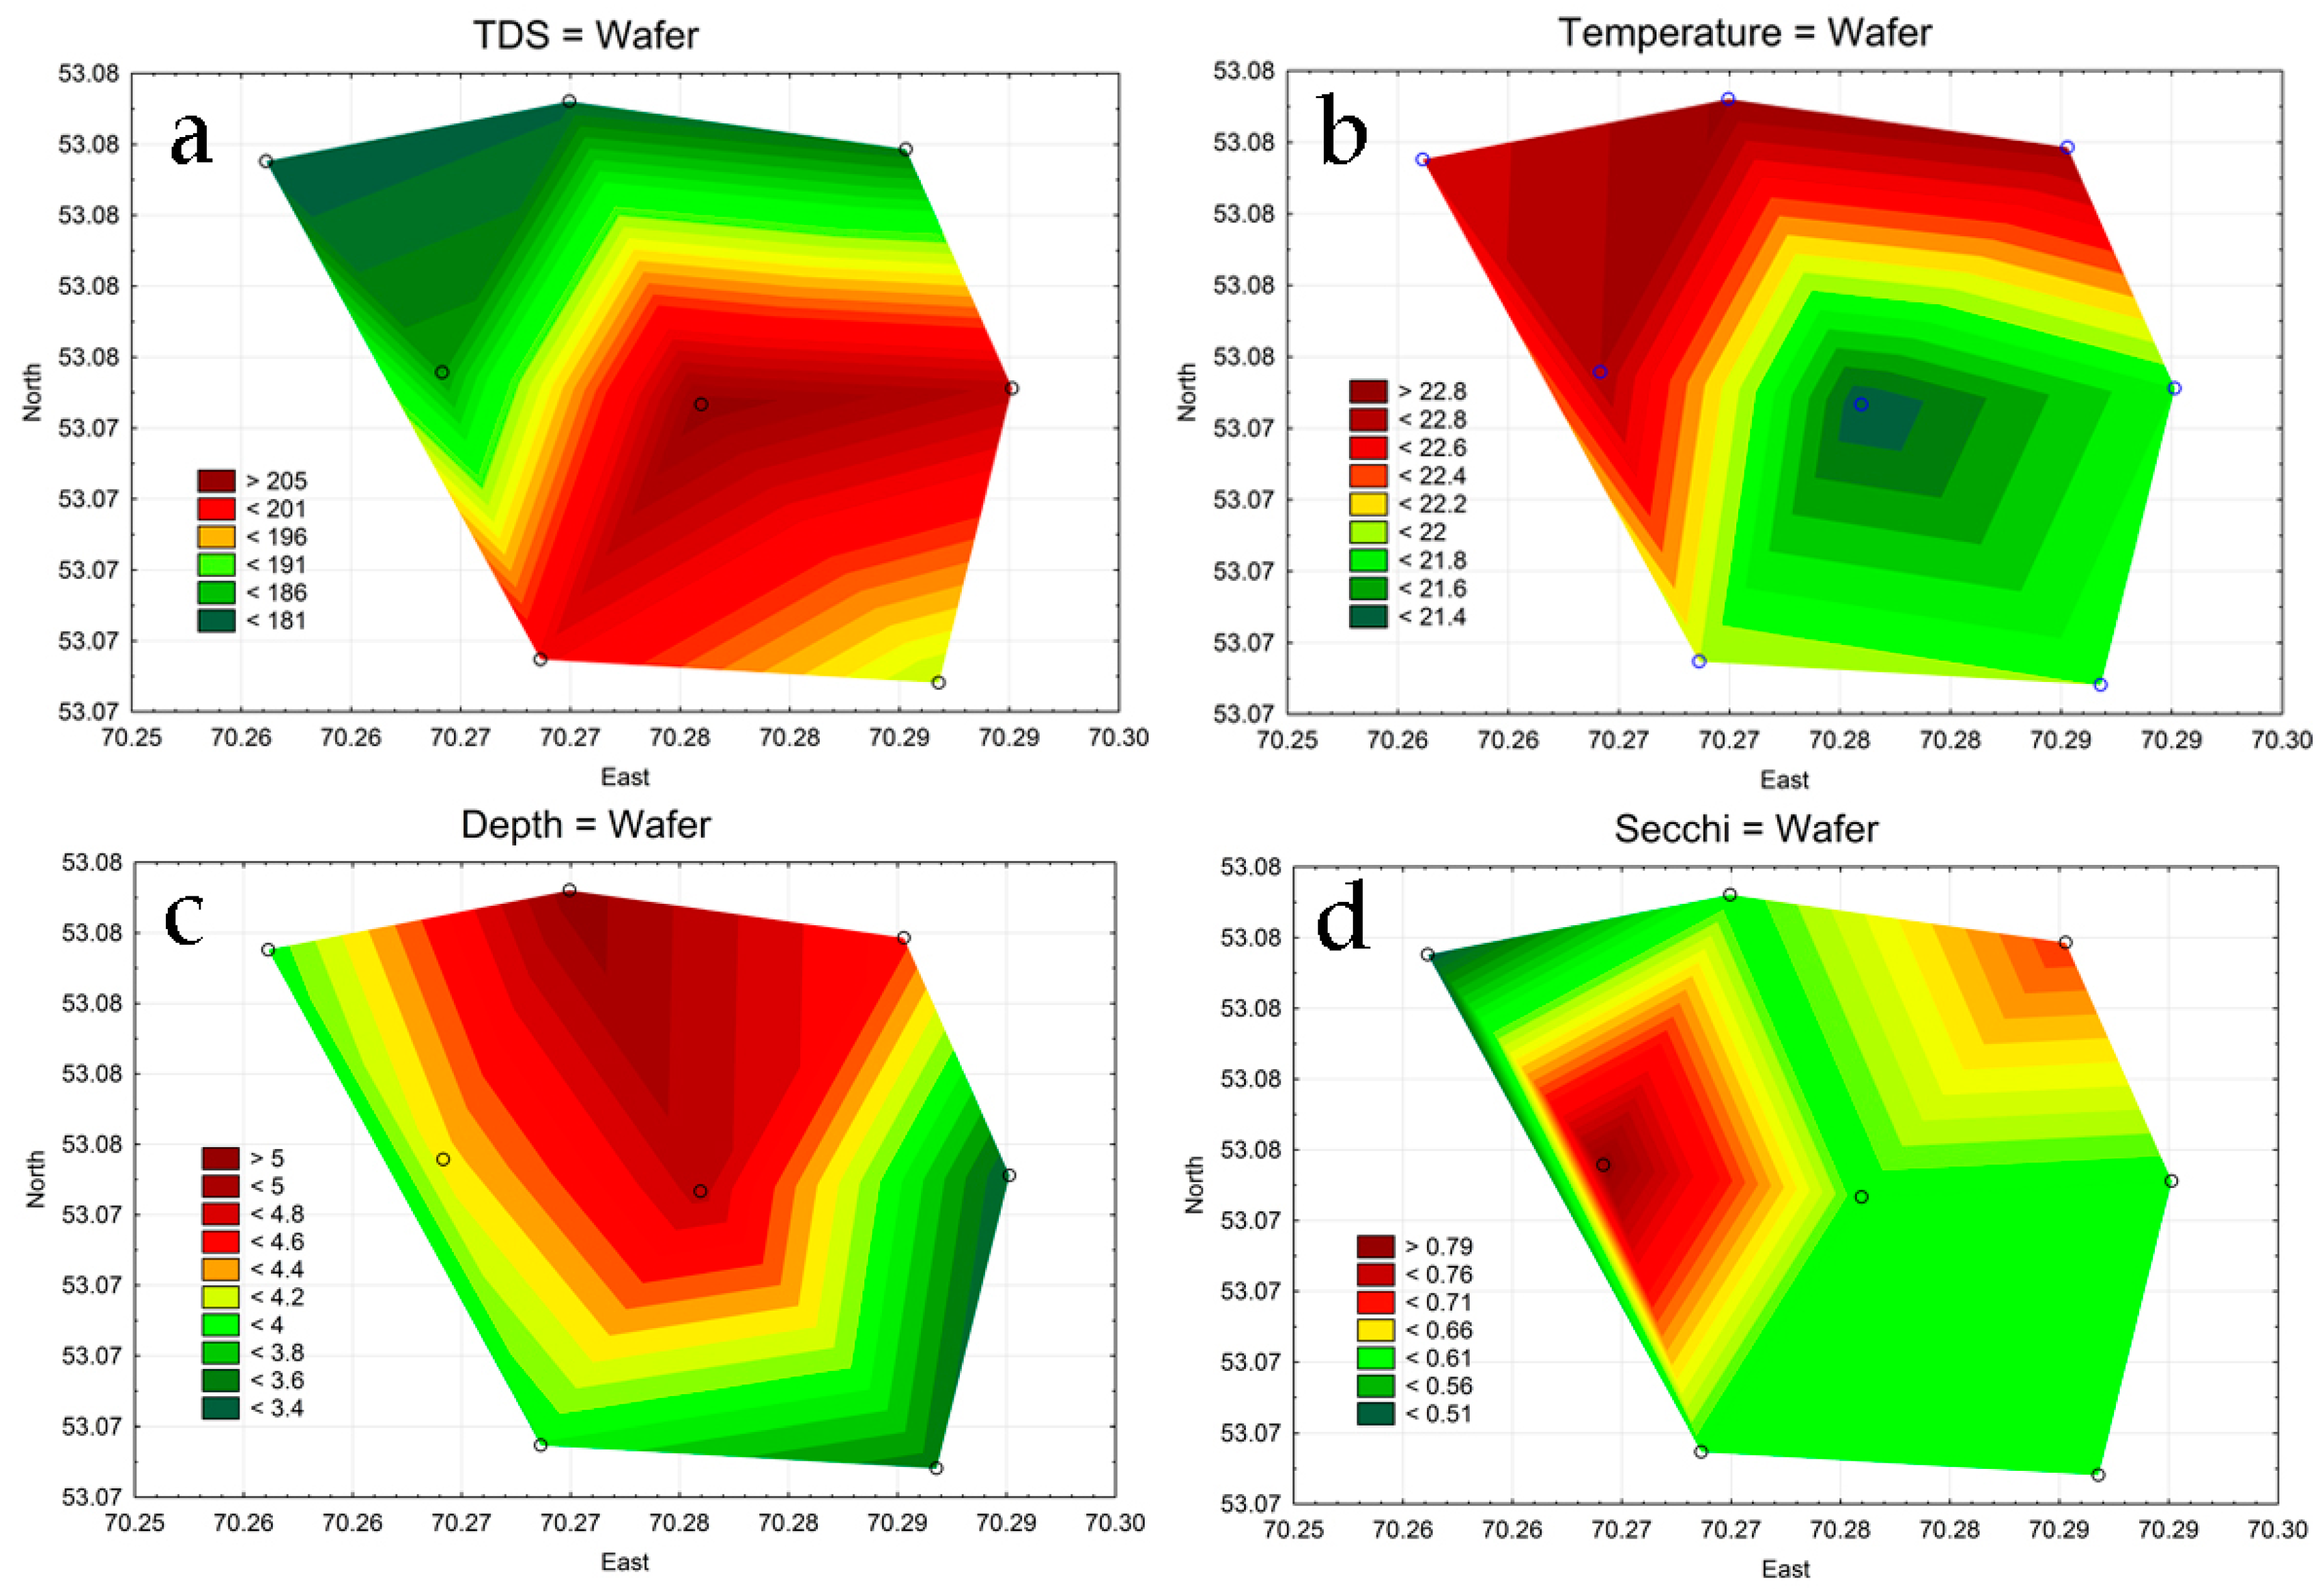
3.1. Environmental Characteristics of the Lake Borovoe
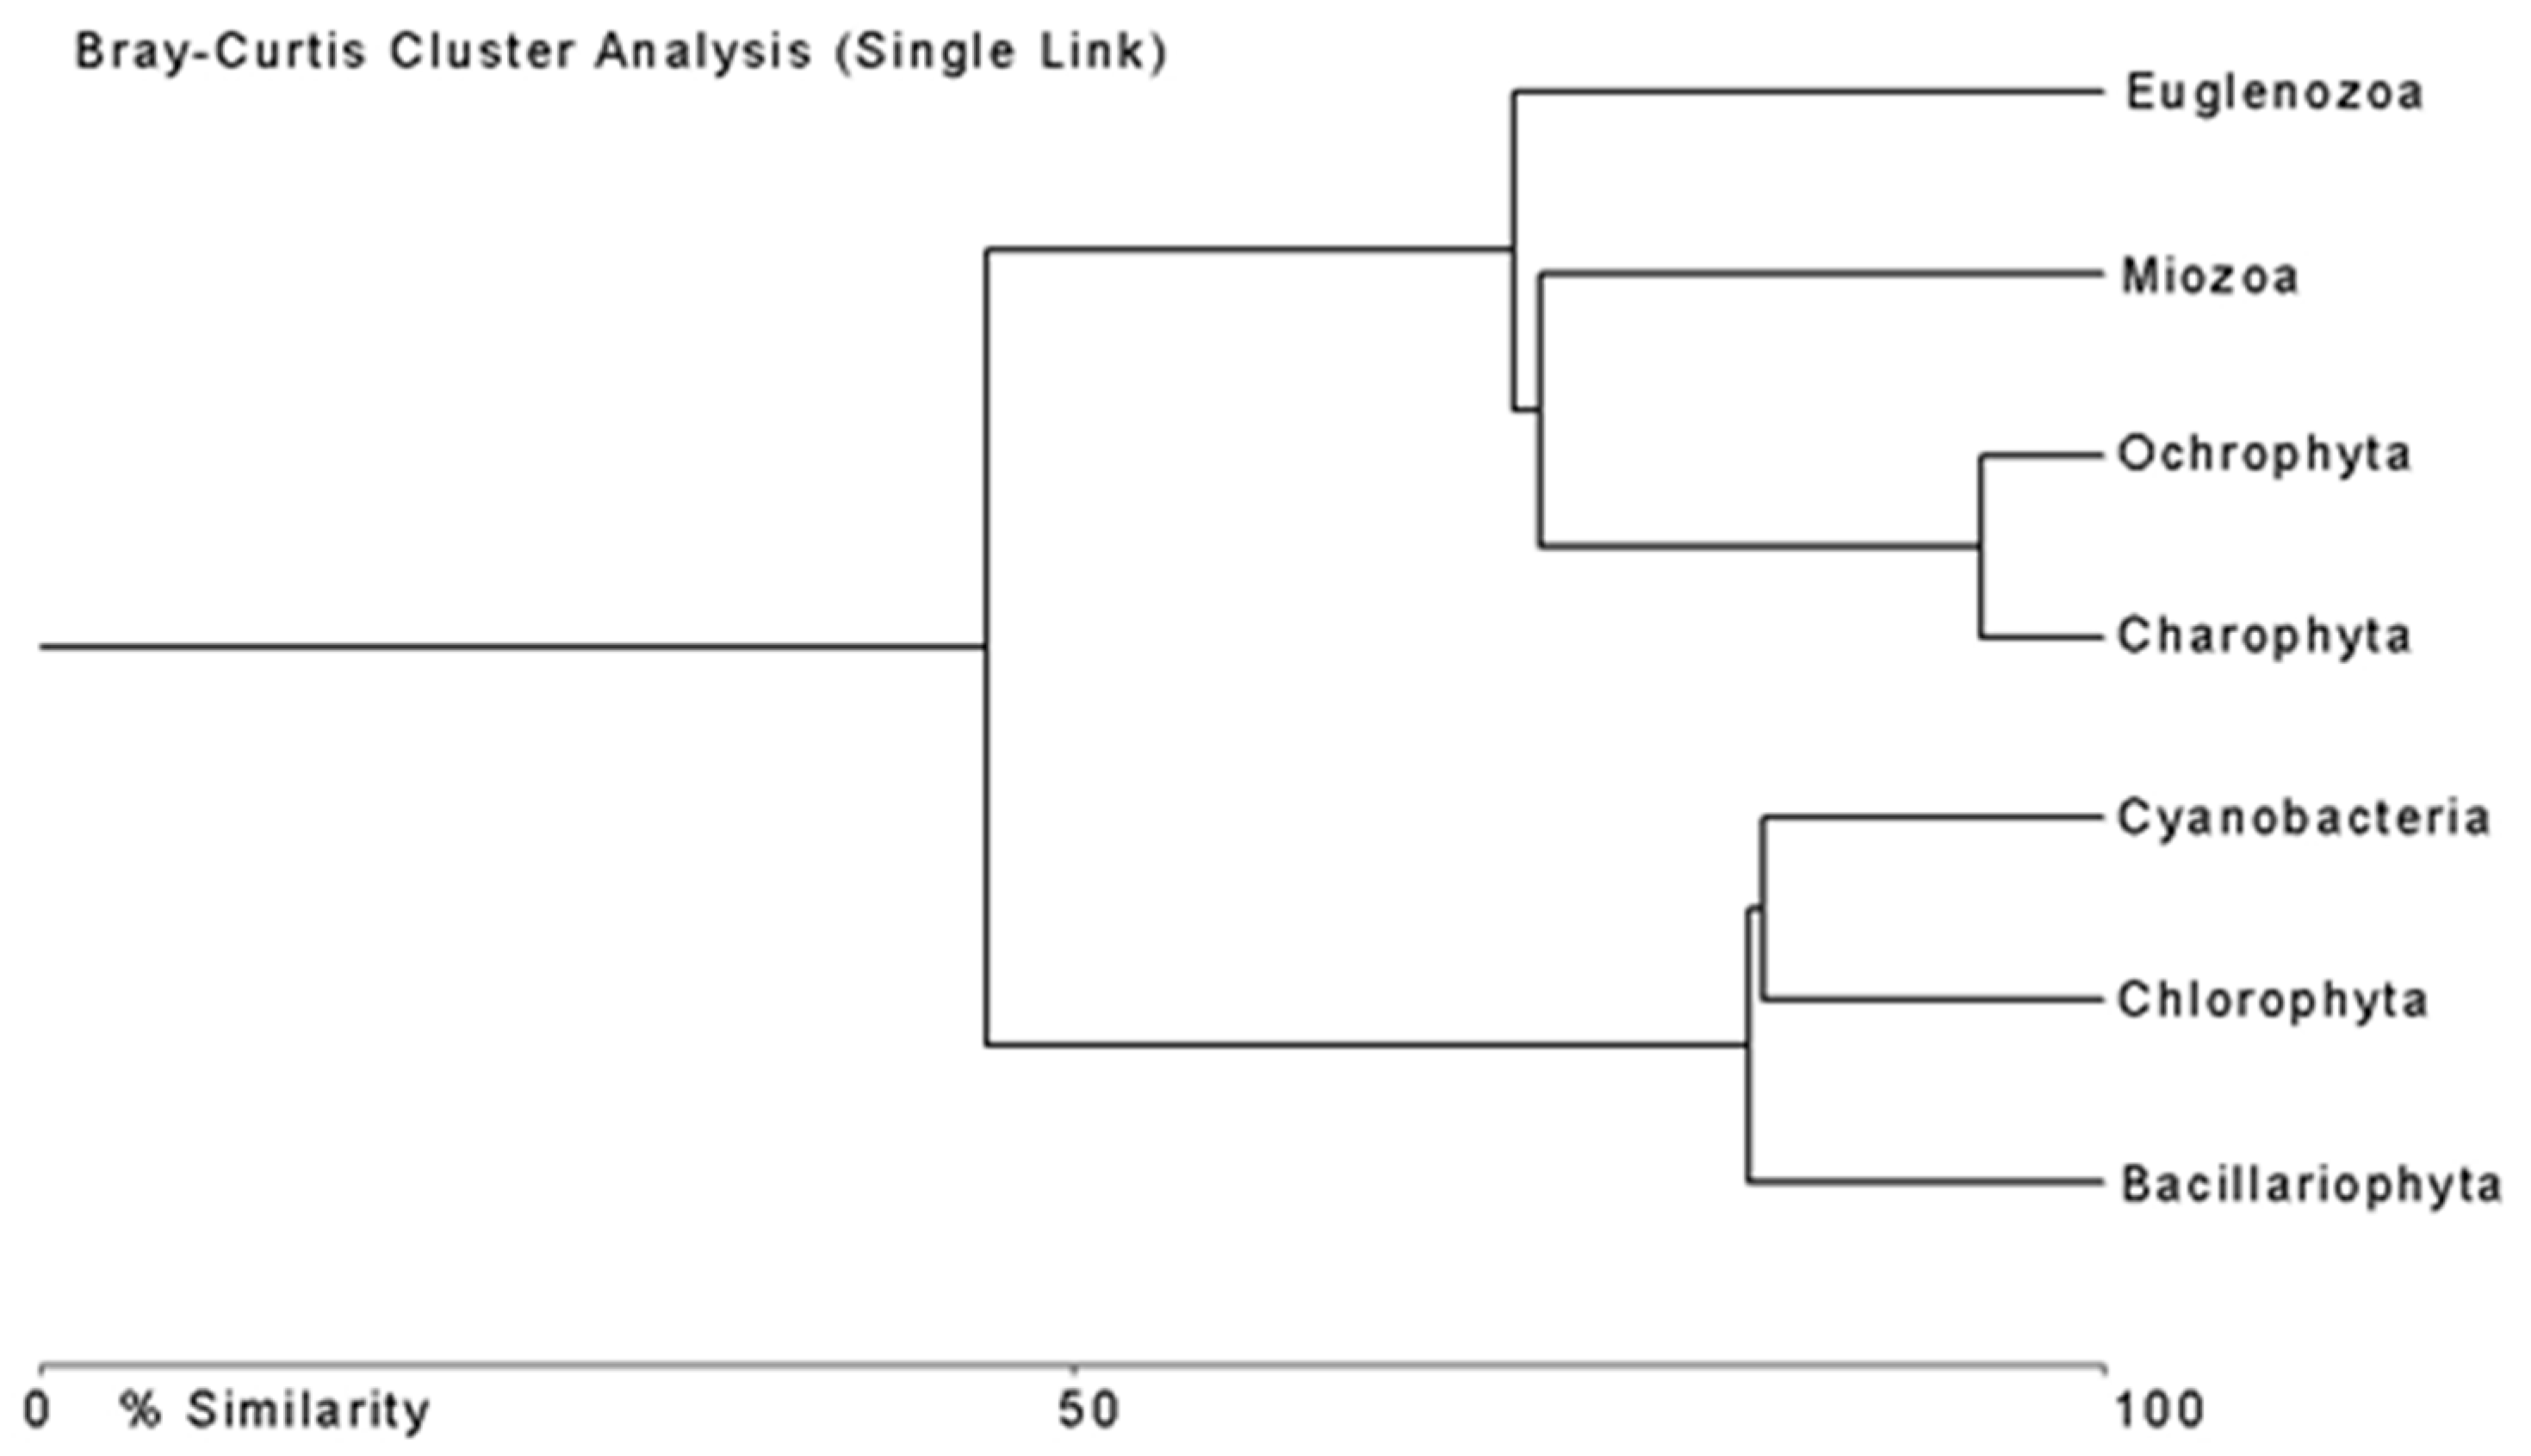
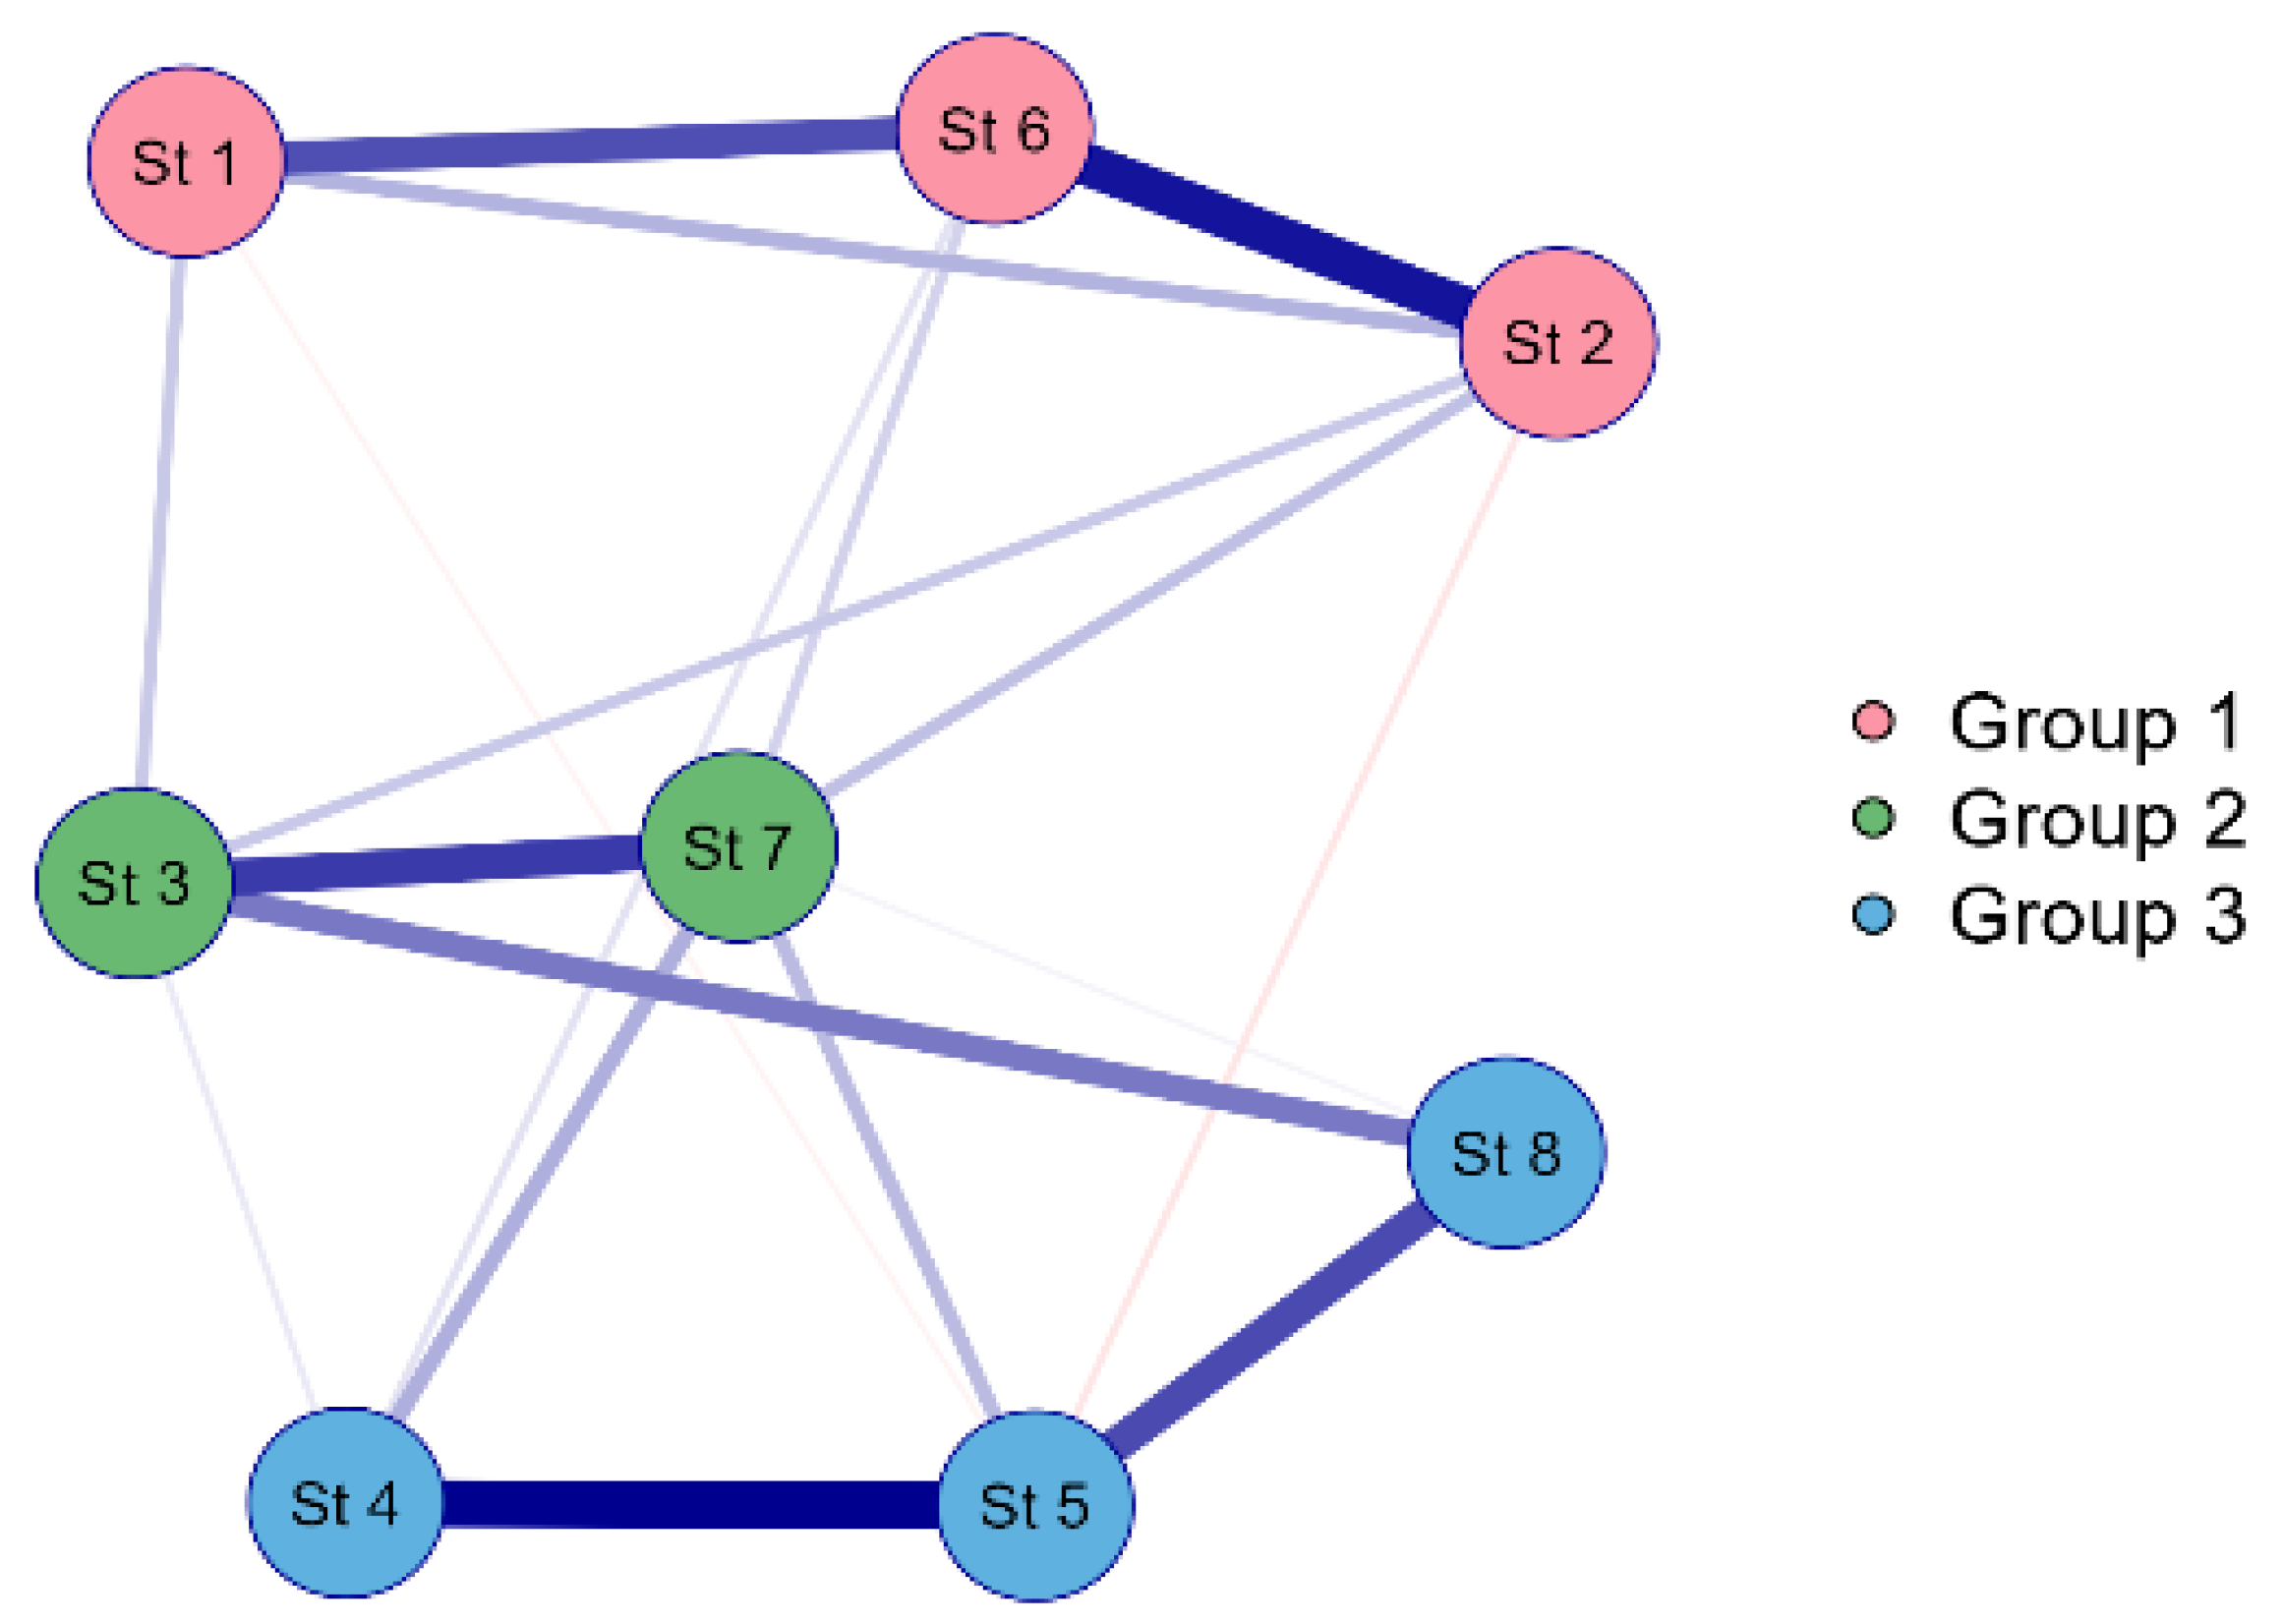
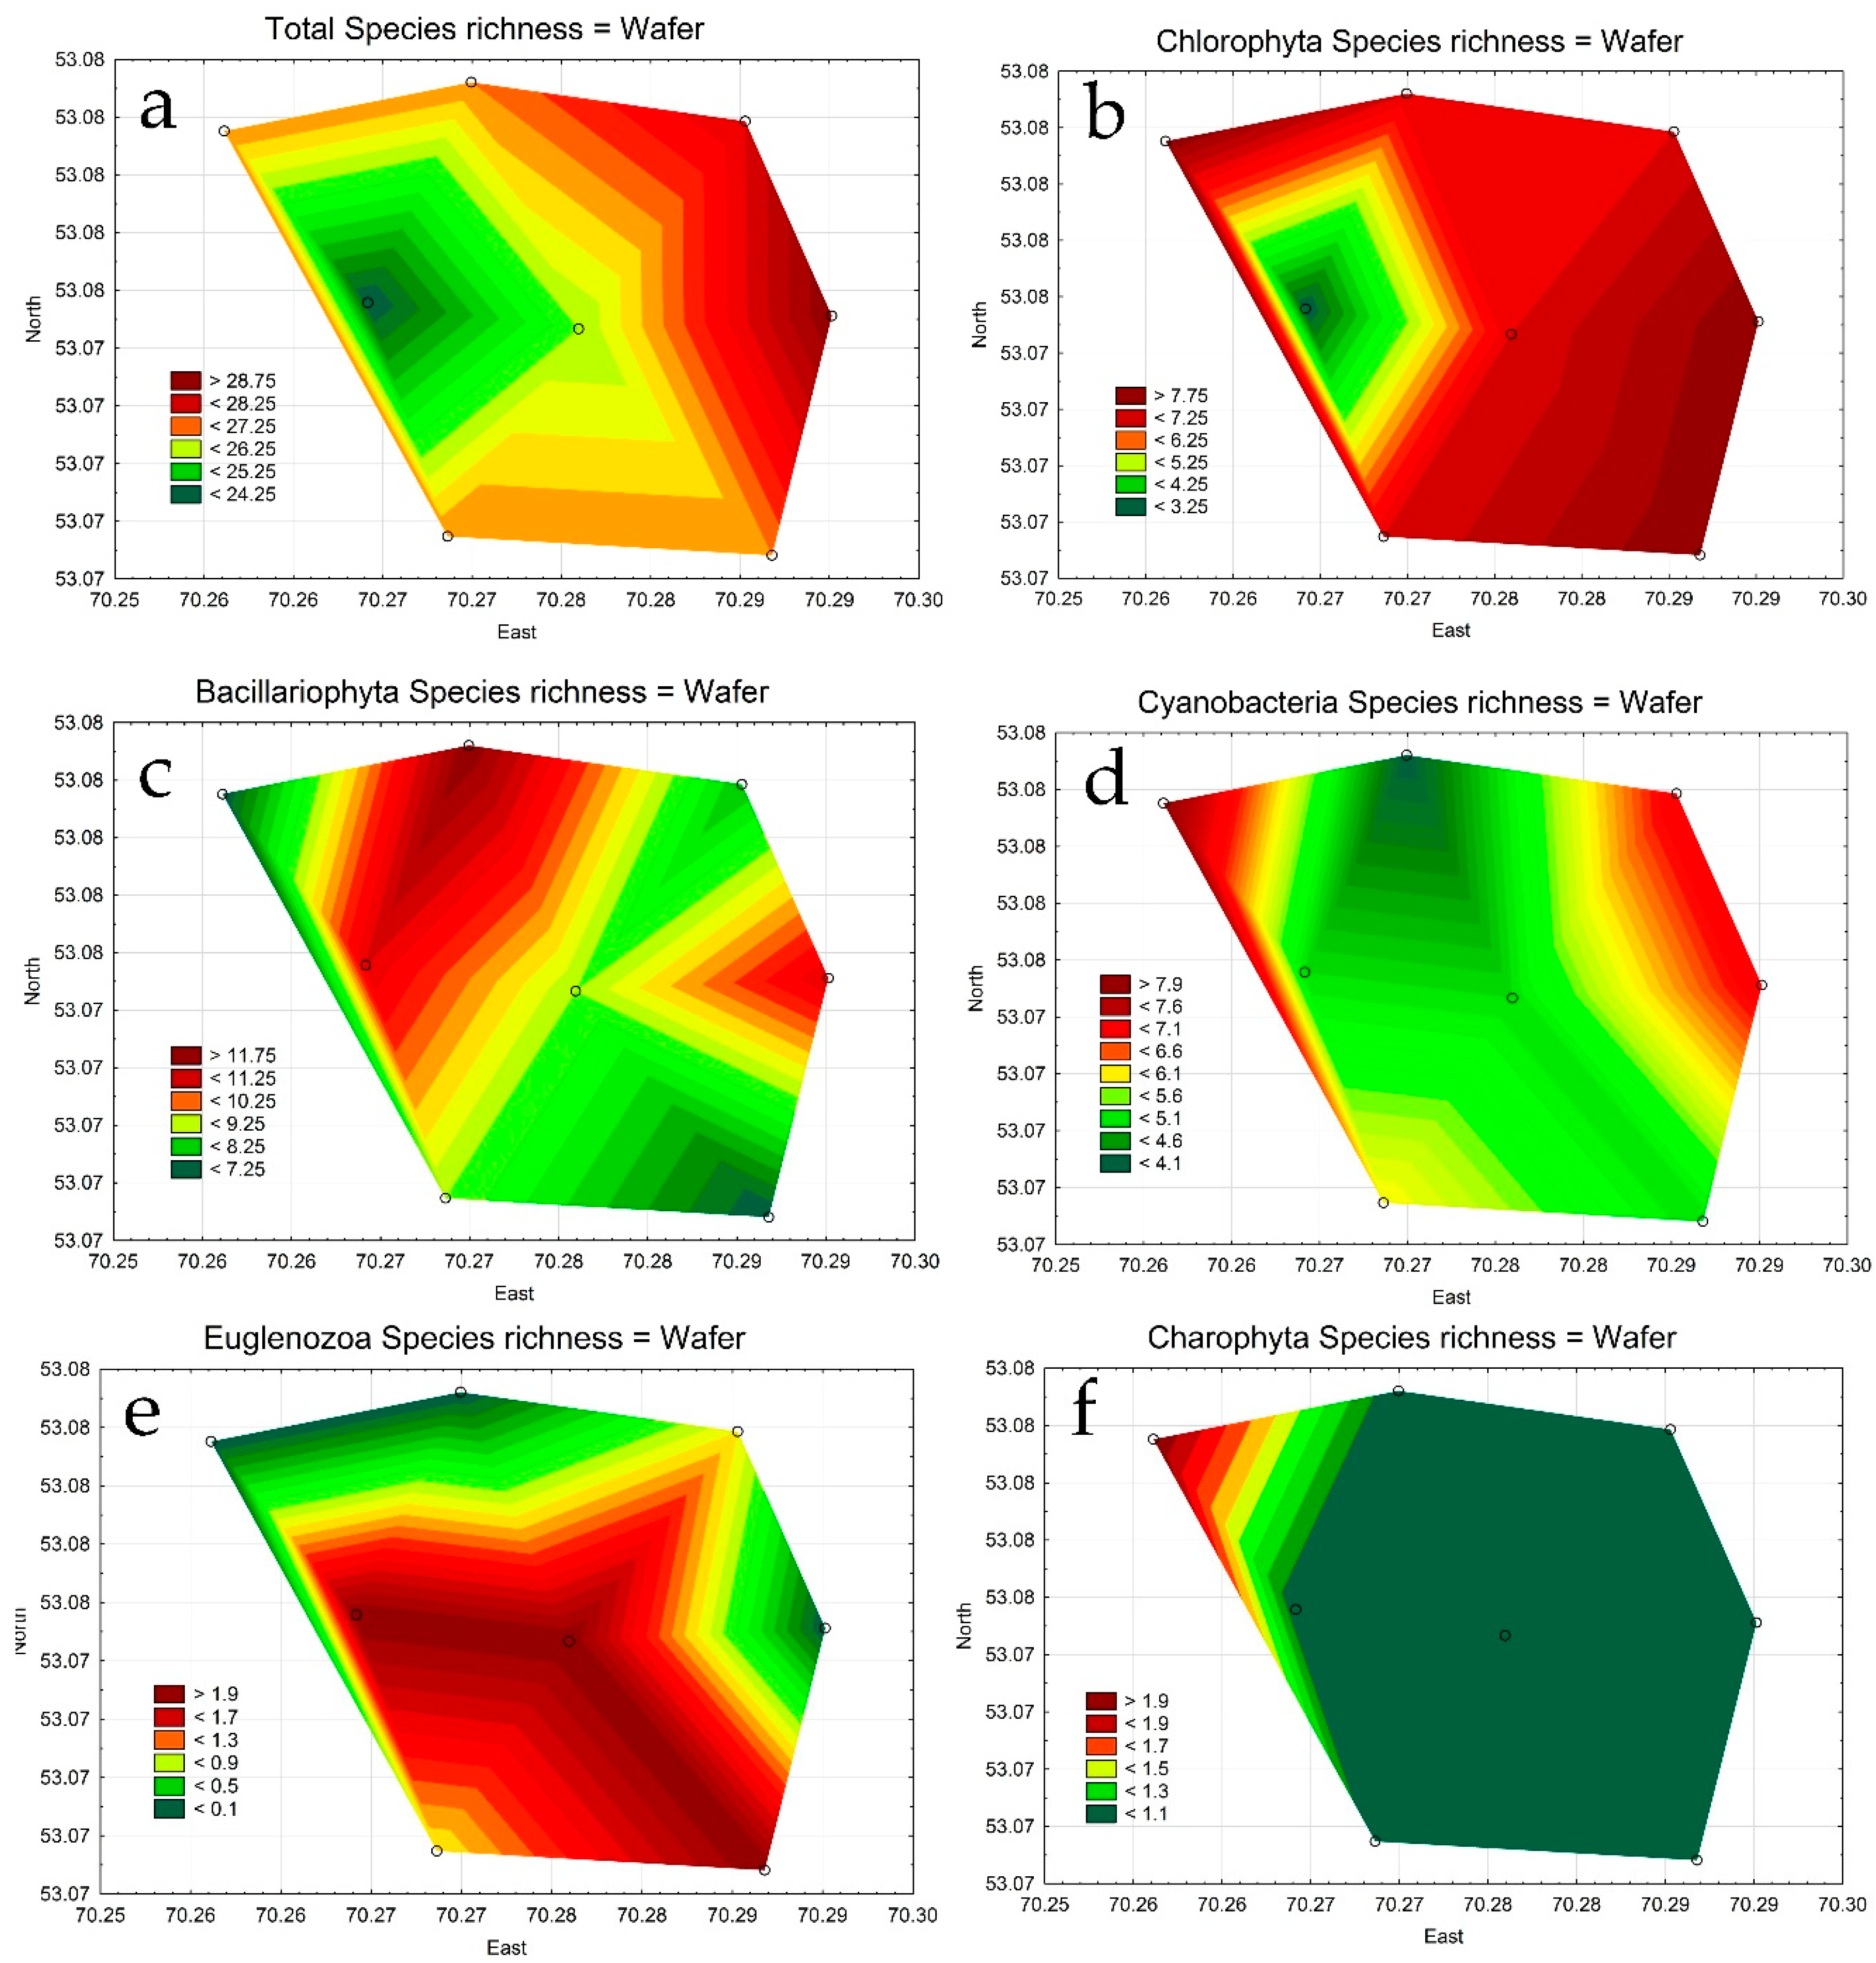
3.2. Phytoplankton in the Lake Borovoe
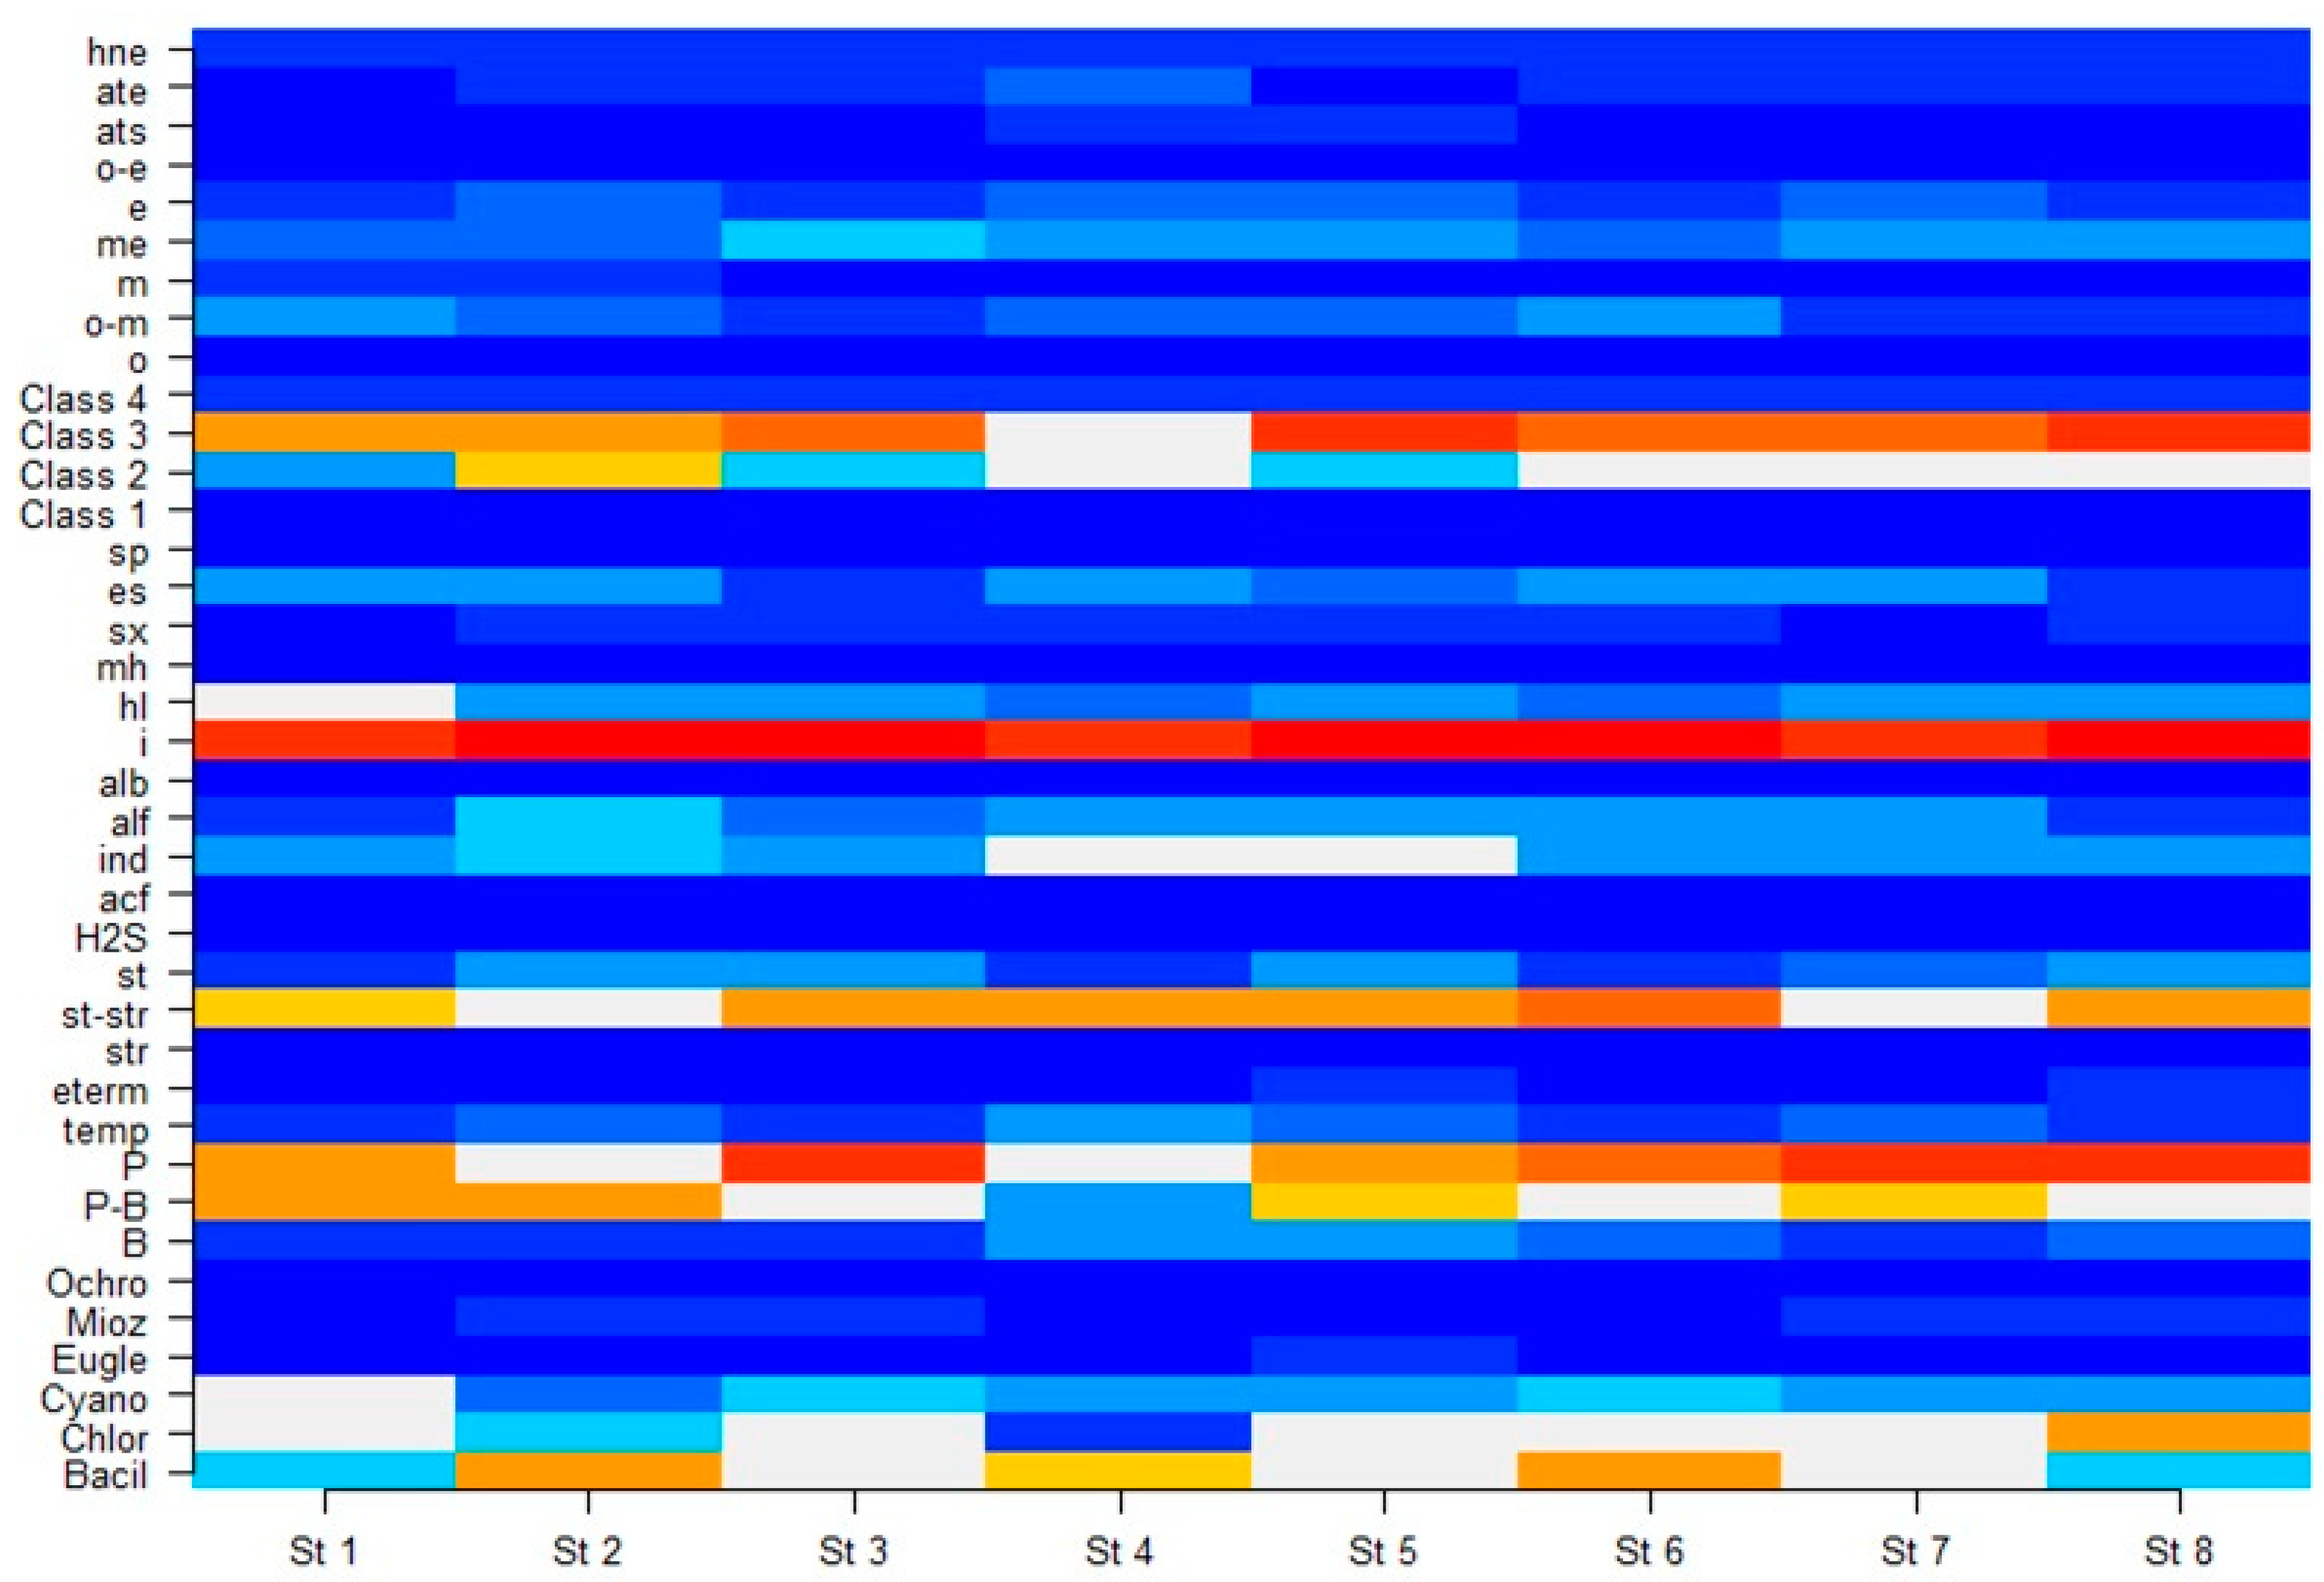
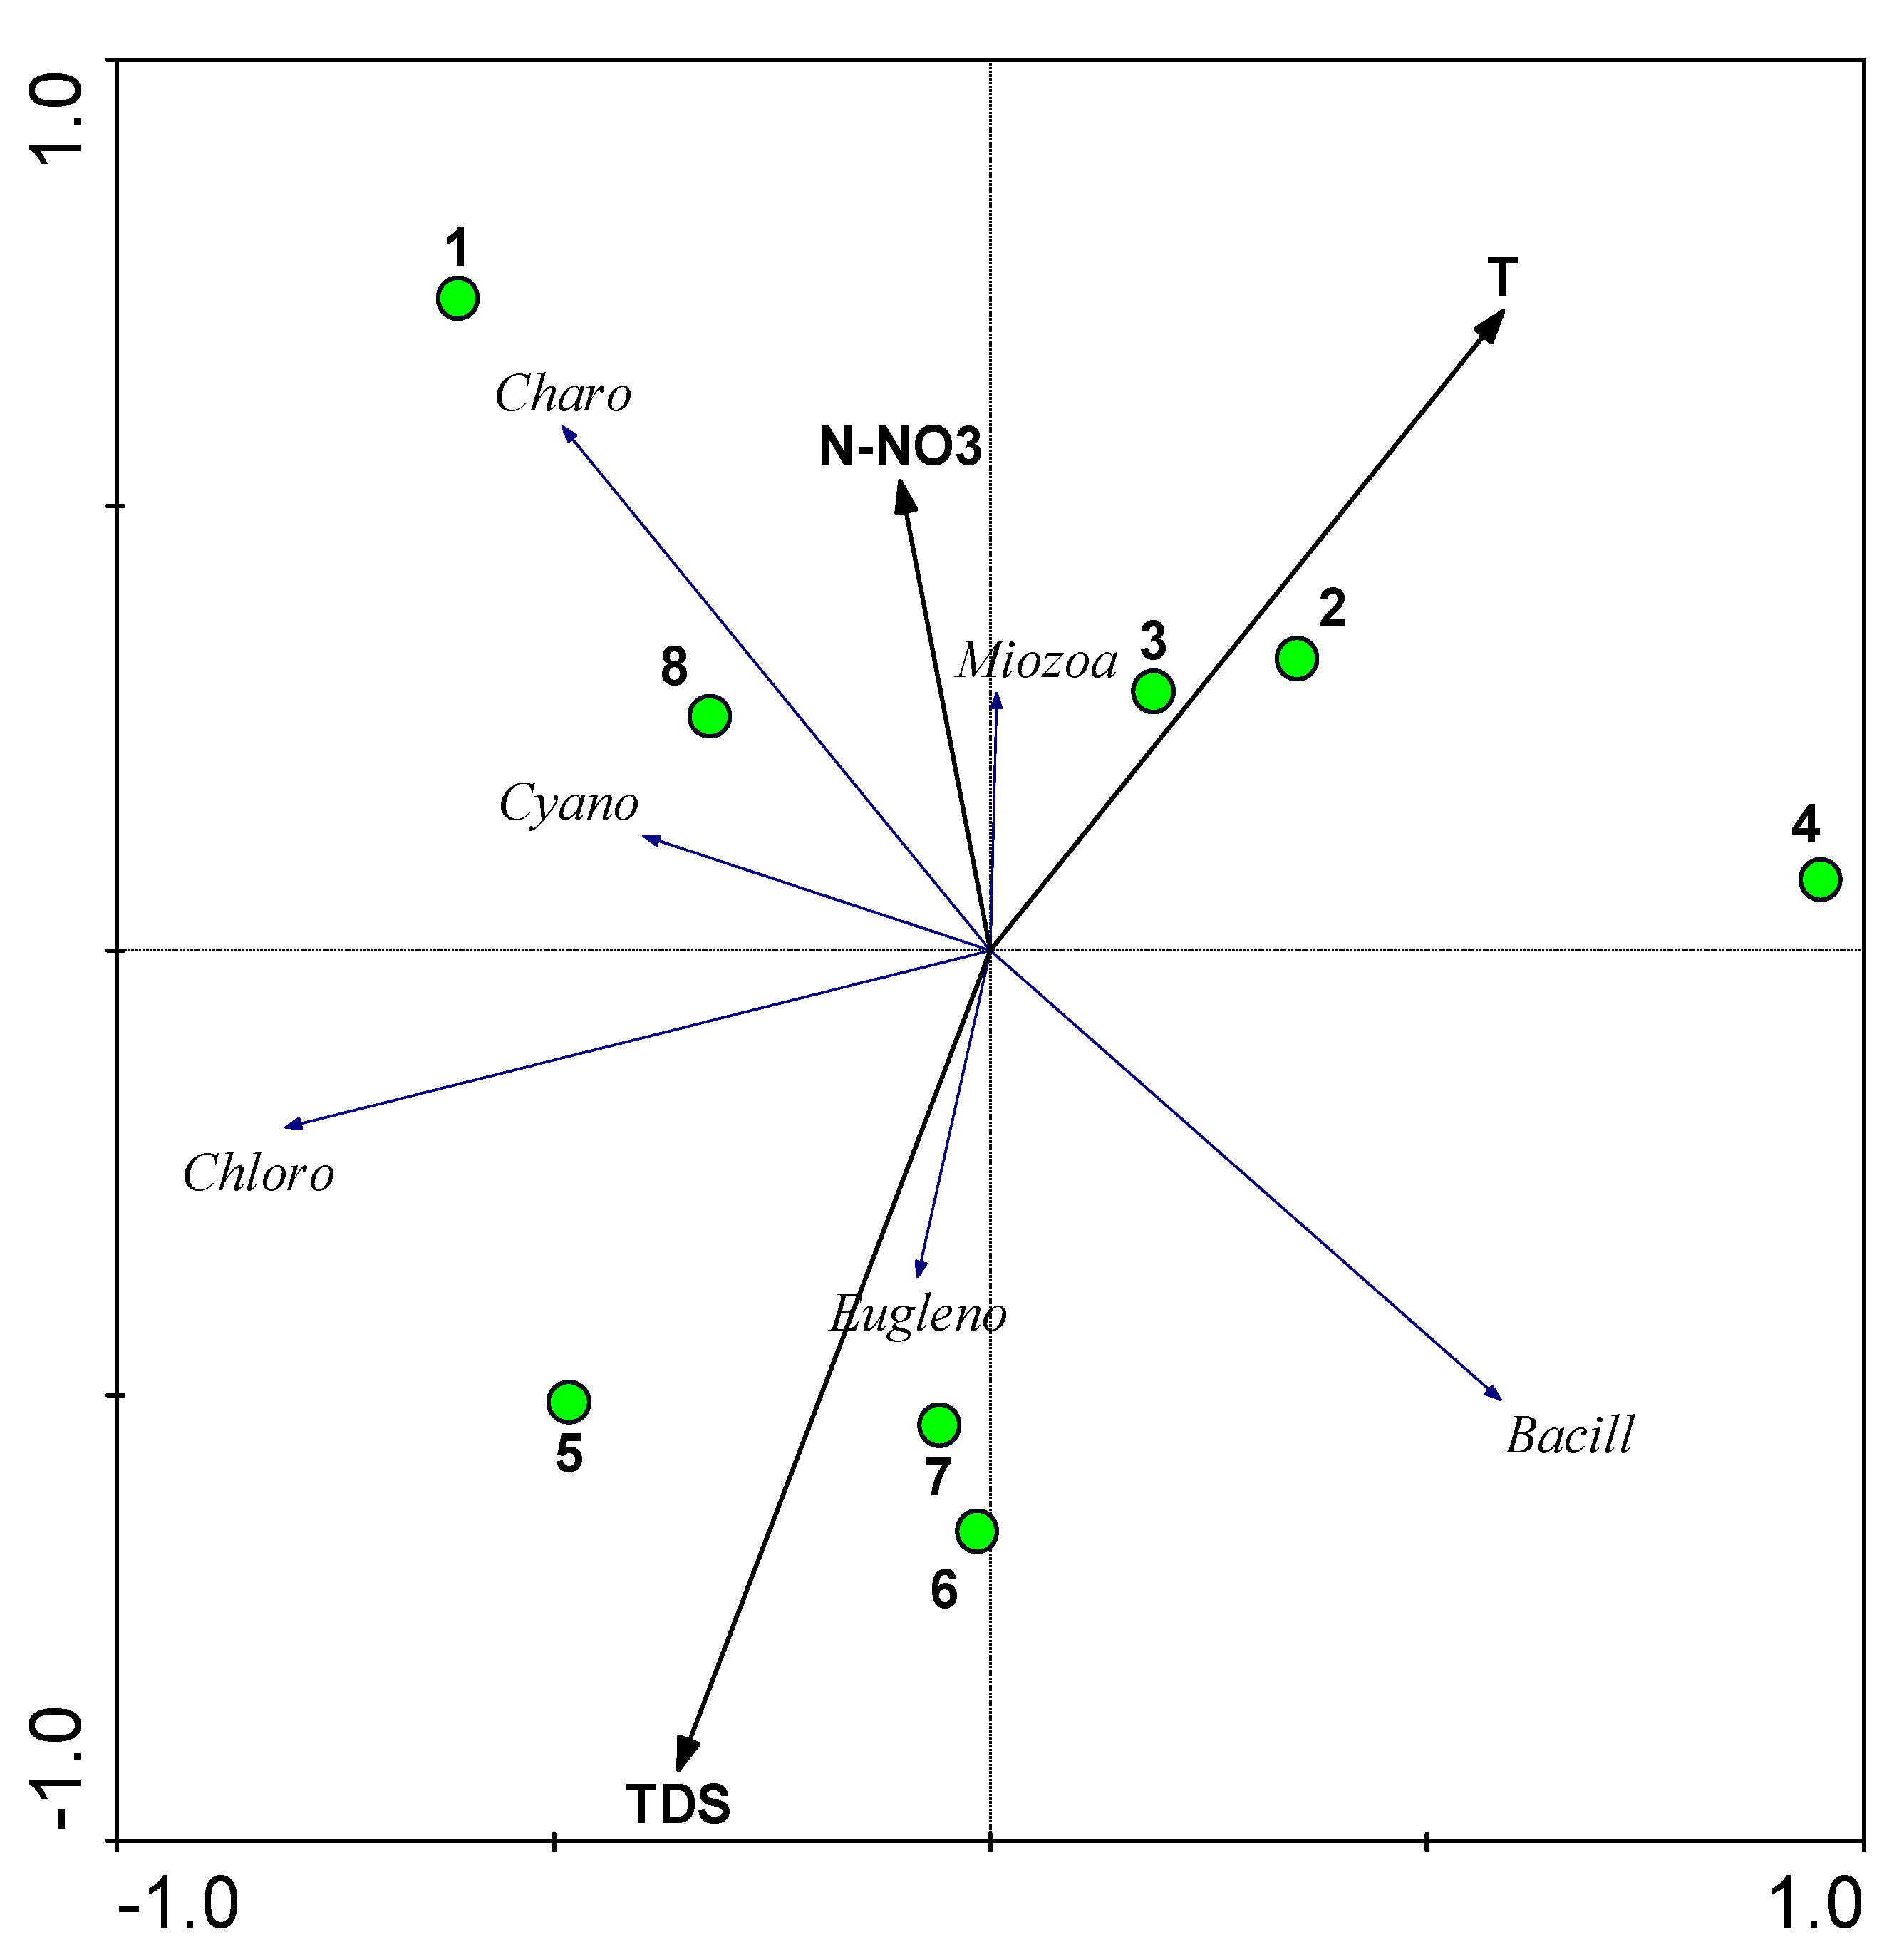
3.3. Phytoplankton Indicators of Water Quality
4. Discussion
5. Conclusions
Author Contributions
Funding
Institutional Review Board Statement
Informed Consent Statement
Data Availability Statement
Acknowledgments
Conflicts of Interest
Appendix A

| Station | 1 | 2 | 3 | 4 | 5 | 6 | 7 | 8 | Average |
|---|---|---|---|---|---|---|---|---|---|
| North | 53.08152 | 53.08321 | 53.08186 | 53.07557 | 53.07467 | 53.07512 | 53.06748 | 53.06682 | |
| East | 70.25613 | 70.26995 | 70.28529 | 70.26416 | 70.27596 | 70.29014 | 70.26864 | 70.28679 | |
| Depth, m | 3.92 ± 0.06 | 5.06 ± 0.05 | 4.55 ± 0.06 | 4.25 ± 0.06 | 4.85 ± 0.04 | 3.4 ± 0.02 | 3.89 ± 0.04 | 3.53 ± 0.02 | 4.18 |
| Secchi, m | 0.5 ± 0.09 | 0.6 ± 0.09 | 0.7 ± 0.08 | 0.8 ± 0.06 | 0.6 ± 0.05 | 0.6 ± 0.05 | 0.6 ± 0.05 | 0.6 ± 0.06 | 0.63 |
| T °C | 22.61 ± 0.6 | 22.92 ± 0.5 | 22.86 ± 0.6 | 22.8 ± 0.6 | 21.3 ± 0.5 | 21.8 ± 0.5 | 22 ± 0.3 | 21.9 ± 0.5 | 22.27 |
| pH | 8.17 ± 0.01 | 8.16 ± 0.01 | 8.18 ± 0.02 | 8.16 ± 0.02 | 8.43 ± 0.01 | 8.19 ± 0.01 | 8.16 ± 0.01 | 8.12 ± 0.01 | 8.20 |
| TDS, mg L−1 | 180 ± 11.51 | 180.8 ± 11.2 | 182.2 ± 10.8 | 183.8 ± 9.58 | 207.8 ± 11.0 | 204.6 ± 10.0 | 201.4 ± 9.56 | 191.7 ± 9.12 | 191.5 |
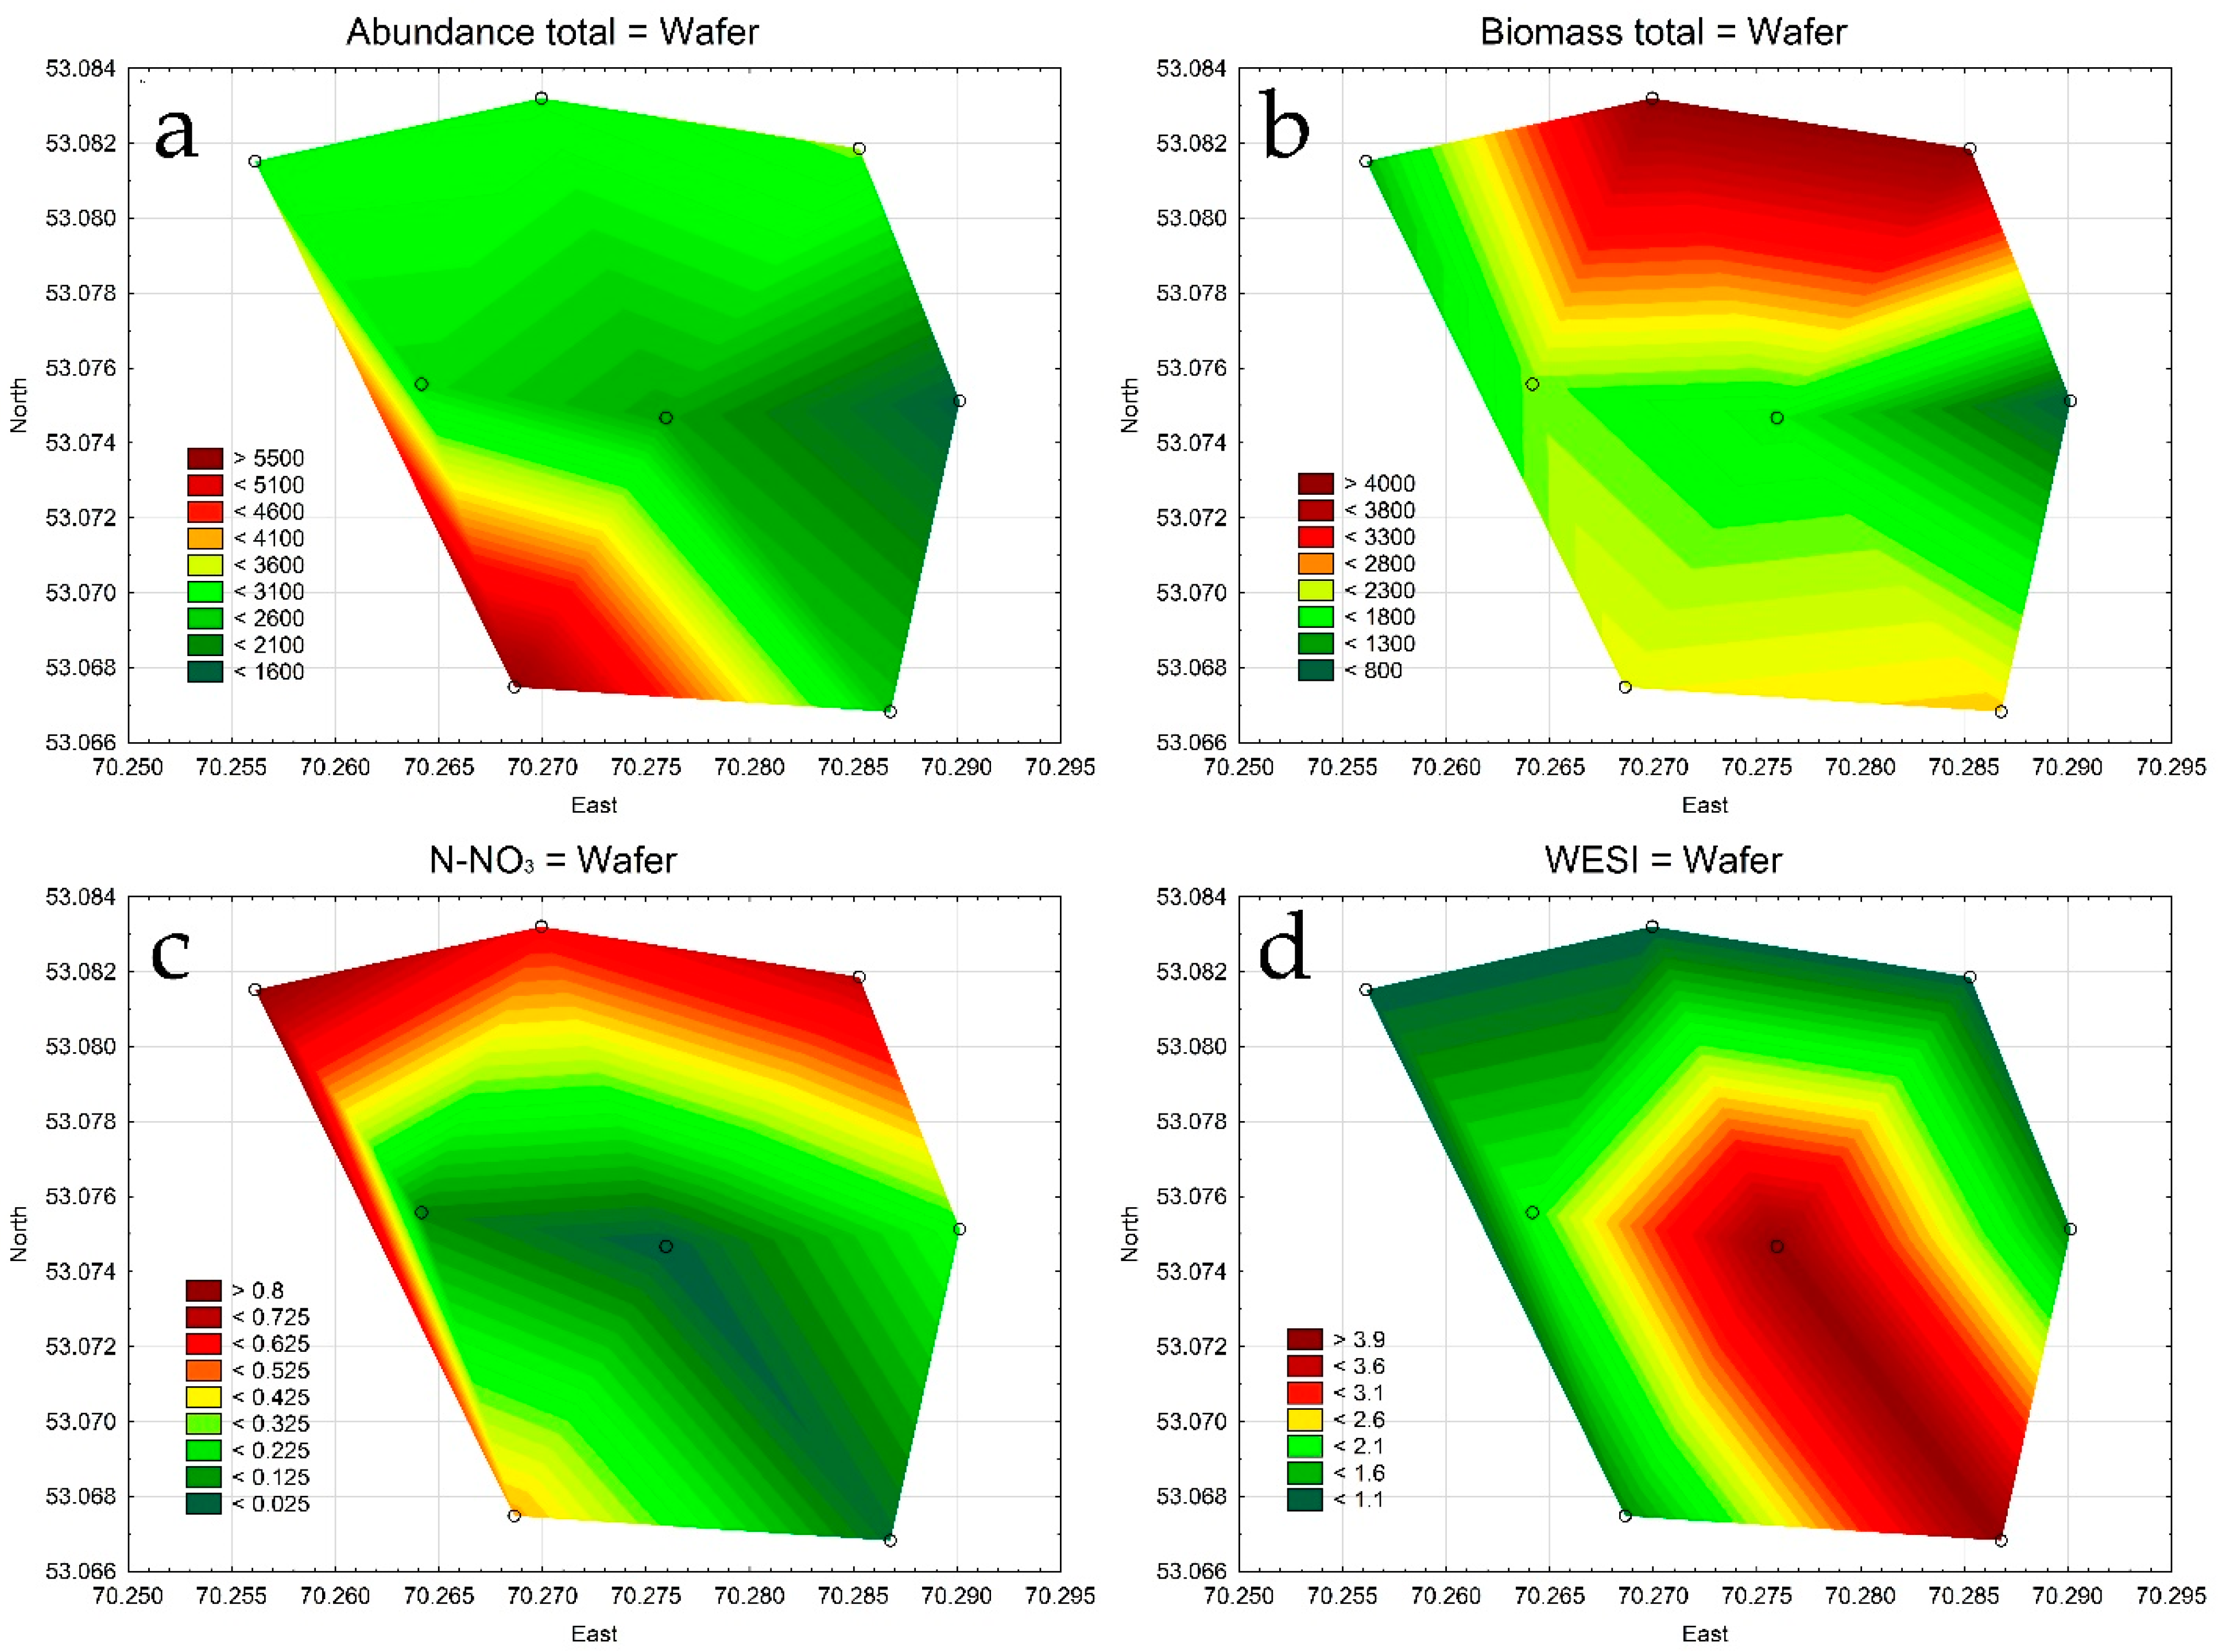
| N-NO3, mg L−1 | 0.816 ± 0.32 | 0.599 ± 0.12 | 0.700 ± 0.24 | 0.090 ± 0.01 | 0.000 ± 0.0 | 0.272 ± 0.02 | 0.466 ± 0.10 | 0.039 ± 0.01 | 0.373 |
| Index S | 1.82 ± 0.18 | 1.98 ± 0.15 | 1.77 ± 0.17 | 1.94 ± 0.18 | 1.99 ± 0.16 | 1.63 ± 0.13 | 2.00 ± 0.20 | 1.52 ± 0.11 | 1.83 |
| Index WESI | 1.00 | 1.00 | 1.00 | 2.00 | 4.00 | 1.33 | 1.33 | 4.00 | 1.96 |
| Abundance, cells L−1 | 2982.9 ± 193.3 | 3026.5 ± 220.7 | 3238.9 ± 245.9 | 2642.7 ± 222.8 | 2226.9 ± 137.9 | 1540.2 ± 80.1 | 5968.4 ± 575.0 | 2474.3 ± 141.5 | 3012.6 |
| Biomass mg L−1 | 1403.2 ± 78.4 | 4086.6 ± 270.0 | 4087.5 ± 215.0 | 2044.2 ± 95.6 | 1732.5 ± 101.6 | 772.5 ± 38.8 | 2386.8 ± 129.9 | 2554 ± 149.0 | 2383.4 |
| Shannon Index | 0.753 ± 0.17 | 0.614 ± 0.15 | 0.659 ± 0.14 | 0.552 ± 0.11 | 0.797 ± 0.17 | 0.885 ± 0.18 | 0.401 ± 0.10 | 0.864 ± 0.16 | 0.691 |
| Taxa | 1 | 2 | 3 | 4 | 5 | 6 | 7 | 8 | Hab | T | Oxy | pH | Sal | D | Sap | Index S | Tro | Aut-Het |
|---|---|---|---|---|---|---|---|---|---|---|---|---|---|---|---|---|---|---|
| Cyanobacteria | ||||||||||||||||||
| Anabaena contorta Bachmann | 0 | 0 | 0 | 0 | 0 | 1 | 0 | 0 | P | - | st-str | - | - | - | - | - | - | - |
| Anagnostidinema amphibium (C. Agardh ex Gomont) Strunecký, Bohunická, J.R. Johansen and J. Komárek | 1 | 0 | 0 | 0 | 0 | 0 | 0 | 0 | P-B, S | - | st-str, H2S | - | hl | - | a-o | 2.6 | m | - |
| Anathece clathrata (West and G.S. West) Komárek, Kastovsky and Jezberová | 1 | 1 | 1 | 1 | 1 | 1 | 1 | 1 | P | - | - | - | hl | - | o-a | 1.8 | me | - |
| Aphanocapsa holsatica (Lemmermann) G. Cronberg and Komárek | 0 | 0 | 1 | 0 | 0 | 0 | 0 | 0 | P | - | - | - | i | - | o-b | 1.4 | me | - |
| Aphanocapsa incerta (Lemmermann) G. Cronberg and Komárek | 0 | 0 | 0 | 0 | 0 | 1 | 1 | 0 | P-B | - | - | - | i | - | b | 2.2 | me | - |
| Aphanocapsa planctonica (G.M. Smith) Komárek and Anagnostidis | 1 | 1 | 1 | 0 | 0 | 1 | 0 | 0 | P | - | - | - | i | - | - | - | o | - |
| Chroococcus minimus (Keissler) Lemmermann | 1 | 0 | 0 | 0 | 0 | 0 | 0 | 0 | P-B | - | - | - | hl | - | - | - | o-m | - |
| Chroococcus minutus (Kützing) Nägeli | 0 | 0 | 0 | 1 | 1 | 0 | 0 | 0 | P-B | - | - | ind | i | - | o-a | 1.8 | o-m | - |
| Merismopedia tenuissima Lemmermann | 1 | 0 | 0 | 0 | 0 | 0 | 0 | 0 | P-B | - | - | - | hl | - | b-a | 2.4 | e | - |
| Microcystis aeruginosa (Kützing) Kützing | 1 | 1 | 1 | 1 | 1 | 1 | 1 | 1 | P | - | - | - | hl | - | b | 2.1 | e | - |
| Planktolyngbya contorta (Lemmermann) Anagnostidis and Komárek | 0 | 0 | 1 | 0 | 0 | 0 | 0 | 0 | P | - | - | - | - | - | o-a | 1.8 | me | - |
| Planktolyngbya limnetica (Lemmermann) Komárková-Legnerová and Cronberg | 1 | 1 | 0 | 1 | 0 | 0 | 0 | 0 | P-B, S | - | st-str | - | hl | - | o-b | 1.5 | e | - |
| Radiocystis geminata Skuja | 1 | 0 | 1 | 0 | 1 | 0 | 1 | 1 | P | - | - | - | - | - | - | - | me | - |
| Rhabdoderma lineare Schmidle and Lauterborn | 0 | 0 | 0 | 0 | 0 | 1 | 1 | 1 | P | - | - | - | - | - | b | 2.2 | - | - |
| Snowella atomus Komárek and Hindák | 0 | 0 | 1 | 1 | 1 | 1 | 1 | 1 | P | - | - | - | - | - | - | - | me | - |
| Bacillariophyta | ||||||||||||||||||
| Achnanthidium minutissimum (Kützing) Czarnecki | 0 | 0 | 0 | 0 | 0 | 1 | 0 | 0 | P-B | eterm | st-str | ind | i | es | x-b | 0.95 | o-e | ate |
| Amphora ovalis (Kützing) Kützing | 0 | 0 | 0 | 1 | 0 | 0 | 0 | 0 | B | temp | st-str | alf | i | sx | o-b | 1.5 | me | ate |
| Aulacoseira granulata (Ehrenberg) Simonsen | 1 | 1 | 0 | 1 | 0 | 0 | 0 | 0 | P-B | temp | st-str | ind | i | es | b | 2 | me | ate |
| Caloneis bacillum (Grunow) Cleve | 0 | 0 | 0 | 1 | 1 | 0 | 0 | 0 | B | temp | st-str | ind | i | es | o | 1.3 | me | ats |
| Cyclotella meneghiniana Kützing | 0 | 1 | 1 | 0 | 1 | 0 | 1 | 0 | P-B | temp | st | alf | hl | sp | a-o | 2.8 | e | hne |
| Cymbella cistula (Ehrenberg) O. Kirchner | 0 | 0 | 0 | 0 | 1 | 0 | 0 | 0 | B | - | st-str | alf | i | sx | o | 1.2 | e | ats |
| Cymbella helvetica Kützing | 0 | 0 | 0 | 0 | 0 | 1 | 0 | 0 | B | - | str | ind | i | - | o-x | 0.6 | o-m | - |
| Diatoma vulgaris Bory | 0 | 0 | 1 | 0 | 0 | 0 | 0 | 0 | P-B | - | st-str | ind | i | sx | b | 2.2 | me | ate |
| Discostella stelligera (Cleve and Grunow) Houk and Klee | 1 | 1 | 1 | 1 | 1 | 1 | 1 | 1 | P | - | - | ind | i | - | o-b | 1.4 | o-m | - |
| Epithemia adnata (Kützing) Brébisson | 0 | 0 | 0 | 0 | 0 | 0 | 0 | 1 | B | temp | st | alb | i | sx | o | 1.2 | me | ats |
| Eunotia arcus Ehrenberg | 0 | 0 | 0 | 1 | 0 | 0 | 0 | 0 | B | - | st-str | acf | i | - | x-o | 0.5 | ot | ats |
| Fragilaria capucina Desmazières | 0 | 1 | 0 | 0 | 0 | 0 | 0 | 0 | P-B | - | - | ind | i | es | b-o | 1.6 | m | - |
| Fragilaria radians (Kützing) D.M.Williams and Round | 1 | 1 | 1 | 1 | 1 | 1 | 1 | 1 | P-B | - | st-str | alf | i | sx | b-o | 1.7 | o-m | - |
| Gomphonella olivacea (Hornemann) Rabenhorst | 0 | 1 | 1 | 1 | 1 | 1 | 1 | 1 | B | - | st-str | alf | i | es | o-b | 1.45 | e | ate |
| Gomphonema acuminatum Ehrenberg | 1 | 0 | 0 | 0 | 0 | 0 | 0 | 0 | B | - | st | ind | i | es | o-b | 1.4 | o-m | ats |
| Eunotia arcus Ehrenberg | 0 | 0 | 0 | 1 | 0 | 0 | 0 | 0 | B | - | st-str | acf | i | - | x-o | 0.5 | ot | ats |
| Fragilaria capucina Desmazières | 0 | 1 | 0 | 0 | 0 | 0 | 0 | 0 | P-B | - | - | ind | i | es | b-o | 1.6 | m | - |
| Fragilaria radians (Kützing) D.M. Williams and Round | 1 | 1 | 1 | 1 | 1 | 1 | 1 | 1 | P-B | - | st-str | alf | i | sx | b-o | 1.7 | o-m | - |
| Gomphonella olivacea (Hornemann) Rabenhorst | 0 | 1 | 1 | 1 | 1 | 1 | 1 | 1 | B | - | st-str | alf | i | es | o-b | 1.45 | e | ate |
| Gomphonema acuminatum Ehrenberg | 1 | 0 | 0 | 0 | 0 | 0 | 0 | 0 | B | - | st | ind | i | es | o-b | 1.4 | o-m | ats |
| Gomphonema gracile Ehrenberg | 0 | 1 | 0 | 0 | 0 | 0 | 0 | 0 | B | temp | st | alf | i | es | x-b | 0.8 | m | ats |
| Gyrosigma strigilis (W. Smith) J.W. Griffin and Henfrey | 0 | 0 | 1 | 0 | 0 | 0 | 0 | 0 | B | - | - | - | mh | - | - | - | - | - |
| Halamphora veneta (Kützing) Levkov | 0 | 0 | 0 | 1 | 0 | 1 | 0 | 0 | B | - | st-str | alf | i | es | a-o | 2.6 | e | ate |
| Lindavia comta (Kützing) Nakov, Gullory, Julius, Theriot, and Alverson | 0 | 1 | 0 | 0 | 0 | 1 | 0 | 0 | P | - | st | alf | i | sx | o | 1.2 | o-m | - |
| Melosira varians C.Agardh | 1 | 1 | 1 | 1 | 1 | 1 | 1 | 1 | P-B | temp | st-str | ind | hl | es | b | 2.1 | me | hne |
| Pauliella taeniata (Grunow) Round and Basson | 0 | 0 | 0 | 0 | 1 | 0 | 1 | 0 | B | - | - | alf | mh | - | b | 2.0 | - | - |
| Pinnularia viridis (Nitzsch) Ehrenberg | 0 | 0 | 0 | 0 | 0 | 0 | 1 | 0 | P-B | temp | st-str | ind | i | es | x | 0.3 | o-e | ate |
| Sellaphora pupula (Kützing) Mereschkovsky | 0 | 0 | 0 | 0 | 0 | 0 | 0 | 1 | B | eterm | st | ind | hl | sx | o-a | 1.9 | me | ate |
| Staurosira leptostauron (Ehrenberg) Kulikovskiy and Genkal | 0 | 0 | 0 | 0 | 0 | 1 | 0 | 0 | - | - | - | - | - | - | 1.1 | - | - | |
| Stephanodiscus hantzschii Grunow | 1 | 0 | 1 | 1 | 1 | 1 | 1 | 1 | P | temp | st | alf | i | es | a-o | 2.7 | o-m | hne |
| Surirella elegans Ehrenberg | 0 | 1 | 0 | 0 | 0 | 0 | 0 | 0 | P-B | - | str | alf | i | - | o | 1 | me | - |
| Ulnaria acus (Kützing) Aboal | 1 | 0 | 0 | 0 | 0 | 1 | 0 | 0 | P-B | - | st-str | alf | i | es | o-a | 1.85 | o-m | - |
| Ulnaria amphirhynchus (Ehrenberg) Compère and Bukhtiyarova | 0 | 1 | 0 | 0 | 0 | 0 | 0 | 0 | P-B | - | - | alf | i | es | b | 2 | o-m | - |
| Ulnaria capitata (Ehrenberg) Compère | 0 | 0 | 0 | 0 | 0 | 0 | 1 | 0 | P-B | - | st-str | alf | i | es | o-b | 1.5 | e | ats |
| Euglenozoa | ||||||||||||||||||
| Lepocinclis ovum (Ehrenberg) Lemmermann | 0 | 0 | 0 | 1 | 1 | 0 | 1 | 1 | P | eterm | st | ind | i | - | b-a | 2.4 | - | - |
| Trachelomonas hispida (Perty) F.Stein | 0 | 0 | 1 | 0 | 1 | 0 | 0 | 0 | P-B | eterm | st-str | - | i | - | b | 2.2 | - | - |
| Miozoa | ||||||||||||||||||
| Ceratium hirundinella (O.F. Müller) Dujardin | 1 | 1 | 1 | 0 | 1 | 1 | 1 | 1 | P | - | st-str | - | i | - | o | 1.3 | - | - |
| Gymnodinium variabile E.C. Herdman | 0 | 0 | 0 | 0 | 0 | 0 | 1 | 0 | P | - | - | - | - | - | o-b | 1.5 | - | - |
| Naiadinium polonicum (Woloszynska) Carty | 0 | 1 | 1 | 1 | 0 | 0 | 0 | 1 | P | - | st | - | - | - | o | 1.3 | - | - |
| Peridinium bipes F. Stein | 0 | 0 | 0 | 0 | 0 | 0 | 0 | 1 | P | - | st-str | - | oh | - | o | 1.3 | - | - |
| Peridinium cinctum (O.F. Müller) Ehrenberg | 0 | 0 | 1 | 0 | 0 | 0 | 0 | 0 | P-B | - | st-str | - | i | - | b-o | 1.6 | - | - |
| Ochrophyta | ||||||||||||||||||
| Dinobryon divergens O.E. Imhof | 1 | 1 | 1 | 1 | 1 | 1 | 1 | 1 | P | - | st-str | ind | i | - | o-b | 1.45 | - | - |
| Chlorophyta | ||||||||||||||||||
| Binuclearia lauterbornii (Schmidle) Proschkina-Lavrenko | 1 | 0 | 0 | 0 | 0 | 0 | 0 | 0 | - | - | - | - | - | - | o-a | 1.8 | - | |
| Chlorella vulgaris Beyerinck [Beijerinck] | 1 | 1 | 1 | 0 | 1 | 1 | 1 | 1 | P-B, pb,S | - | - | - | hl | - | a | 3.1 | - | |
| Desmodesmus brasiliensis (Bohlin) E.Hegewald | 0 | 0 | 0 | 0 | 1 | 1 | 1 | 1 | P-B | - | st-str | - | - | - | b | 2 | - | |
| Monoraphidium contortum (Thuret) Komárková-Legnerová | 1 | 0 | 1 | 0 | 0 | 0 | 0 | 0 | P-B | - | st-str | - | i | - | b | 2.2 | - | |
| Monoraphidium convolutum (Corda) Komárková-Legnerová | 0 | 0 | 0 | 0 | 0 | 1 | 0 | 1 | P-B | - | st-str | - | - | - | b | 2.3 | - | |
| Monoraphidium minutum (Nägeli) Komárková-Legnerová | 0 | 0 | 0 | 0 | 0 | 0 | 0 | 1 | P-B | - | st-str | - | i | - | b-a | 2.5 | - | |
| Mucidosphaerium pulchellum (H.C. Wood) C.Bock, Proschold and Krienitz | 0 | 0 | 0 | 0 | 1 | 0 | 0 | 0 | P-B | - | st-str | ind | i | - | b | 2.3 | - | |
| Myrmecia irregularis (J.B. Petersen) Ettl and Gärtner | 1 | 0 | 1 | 0 | 1 | 1 | 1 | 1 | P | - | - | - | oh | - | - | - | - | |
| Neglectella solitaria (Wittrock) Stenclová and Kastovsky | 0 | 0 | 1 | 0 | 1 | 0 | 0 | 0 | P | - | st | ind | i | - | b-o | 1.7 | - | |
| Oocystis borgei J.W. Snow | 0 | 1 | 0 | 0 | 0 | 0 | 0 | 0 | P-B | - | st-str | ind | i | - | o-a | 1.9 | - | |
| Oocystis pusilla Hansgirg | 0 | 0 | 0 | 0 | 0 | 0 | 1 | 1 | P | - | - | - | oh | - | o-b | 1.4 | - | |
| Pseudodidymocystis planctonica (Korshikov) E.Hegewald and Deason | 0 | 1 | 0 | 0 | 0 | 1 | 1 | 0 | - | - | - | - | - | - | o-a | 1.8 | - | |
| Scenedesmus quadricauda (Turpin) Brébisson | 1 | 1 | 0 | 1 | 1 | 1 | 1 | 1 | P | - | - | ind | i | - | b | 2.1 | - | |
| Schroederia setigera (Schröder) Lemmermann | 1 | 0 | 0 | 0 | 0 | 0 | 0 | 0 | P | - | st-str | - | i | - | b-o | 1.7 | - | |
| Tetradesmus obliquus (Turpin) M.J.Wynne | 0 | 1 | 1 | 0 | 1 | 0 | 1 | 1 | P-B, S | - | st | - | i | - | b-a | 2.4 | - | |
| Tetraëdron minimum (A. Braun) Hansgirg | 1 | 1 | 1 | 1 | 0 | 1 | 1 | 1 | P-B | - | st-str | - | i | - | b | 2.1 | - | |
| Tetraëdron minutissimum Korshikov | 0 | 0 | 1 | 0 | 1 | 0 | 0 | 1 | P-B | - | st-str | - | i | - | b | 2.1 | - | |
| Tetrastrum staurogeniiforme (Schröder) Lemmermann | 0 | 0 | 0 | 0 | 0 | 1 | 0 | 0 | P-B | - | st-str | - | i | - | b | 2.2 | - | |
| Charophyta | ||||||||||||||||||
| Cosmarium baileyi Wolle | 1 | 1 | 1 | 1 | 1 | 1 | 1 | 1 | B | - | - | - | - | - | o | 1.2 | - | - |
| Cosmarium undulatum Corda ex Ralfs | 1 | 0 | 0 | 0 | 0 | 0 | 0 | 0 | P-B | - | - | acf | i | - | - | - | m | - |
| Station | 1 | 2 | 3 | 4 | 5 | 6 | 7 | 8 |
|---|---|---|---|---|---|---|---|---|
| Species richness in phyla | ||||||||
| Bacillariophyta | 7 | 11 | 8 | 10 | 9 | 11 | 9 | 7 |
| Chlorophyta | 7 | 6 | 7 | 2 | 8 | 8 | 8 | 10 |
| Charophyta | 2 | 1 | 1 | 1 | 1 | 1 | 1 | 1 |
| Cyanobacteria | 8 | 4 | 7 | 5 | 5 | 7 | 6 | 5 |
| Euglenozoa | 0 | 0 | 1 | 1 | 2 | 0 | 1 | 1 |
| Miozoa | 1 | 2 | 3 | 1 | 1 | 1 | 2 | 3 |
| Ochrophyta | 1 | 1 | 1 | 1 | 1 | 1 | 1 | 1 |
| Total Species number | 26 | 25 | 28 | 21 | 27 | 29 | 28 | 28 |
| Substrate | ||||||||
| B | 2 | 3 | 3 | 6 | 5 | 4 | 3 | 4 |
| P-B | 12 | 12 | 9 | 6 | 10 | 9 | 10 | 9 |
| P | 11 | 9 | 14 | 9 | 12 | 13 | 14 | 15 |
| Temperature | ||||||||
| temp | 3 | 4 | 3 | 5 | 4 | 2 | 4 | 3 |
| eterm | 0 | 0 | 1 | 1 | 2 | 1 | 1 | 2 |
| Water moving and oxygenation | ||||||||
| str | 0 | 1 | 0 | 0 | 0 | 1 | 0 | 0 |
| st-str | 10 | 9 | 11 | 11 | 11 | 13 | 9 | 11 |
| st | 2 | 5 | 5 | 3 | 5 | 2 | 4 | 6 |
| H2S | 1 | 0 | 0 | 0 | 0 | 0 | 0 | 0 |
| pH | ||||||||
| acf | 1 | 0 | 0 | 1 | 0 | 0 | 0 | 0 |
| ind | 6 | 7 | 5 | 8 | 9 | 6 | 6 | 6 |
| alf | 3 | 7 | 4 | 5 | 6 | 6 | 6 | 3 |
| alb | 0 | 0 | 0 | 0 | 0 | 0 | 0 | 1 |
| Salinity | ||||||||
| i | 15 | 16 | 17 | 14 | 17 | 17 | 15 | 16 |
| hl | 8 | 6 | 5 | 4 | 5 | 4 | 5 | 5 |
| mh | 0 | 0 | 1 | 0 | 1 | 0 | 1 | 0 |
| Watanabe | ||||||||
| sx | 1 | 2 | 2 | 2 | 2 | 2 | 1 | 3 |
| es | 5 | 6 | 3 | 6 | 4 | 6 | 5 | 3 |
| sp | 0 | 1 | 1 | 0 | 1 | 0 | 1 | 0 |
| Class of water quality based on species-specific index saprobity S | ||||||||
| Class 1 | 0 | 0 | 0 | 1 | 0 | 0 | 1 | 0 |
| Class 2 | 6 | 10 | 7 | 8 | 7 | 9 | 8 | 9 |
| Class 3 | 12 | 12 | 13 | 9 | 14 | 13 | 13 | 14 |
| Class 4 | 3 | 2 | 2 | 3 | 3 | 3 | 3 | 2 |
| Trophic state | ||||||||
| o | 1 | 1 | 1 | 1 | 0 | 1 | 0 | 0 |
| o-m | 6 | 4 | 3 | 4 | 4 | 6 | 3 | 3 |
| m | 2 | 2 | 0 | 0 | 0 | 0 | 0 | 0 |
| me | 4 | 4 | 7 | 6 | 5 | 4 | 5 | 6 |
| e | 3 | 4 | 3 | 4 | 4 | 3 | 4 | 2 |
| o-e | 0 | 0 | 0 | 0 | 0 | 1 | 1 | 0 |
| Autotrophy–heterotrophy | ||||||||
| ats | 1 | 1 | 0 | 2 | 2 | 0 | 1 | 1 |
| ate | 1 | 2 | 2 | 4 | 1 | 3 | 2 | 2 |
| hne | 2 | 2 | 3 | 2 | 3 | 2 | 3 | 2 |
References
- Kurmanbaeva, A.S.; Khusainov, A.T.; Zhumai, E. Ecological condition of the Burabay lake of the Burabay State National Natural Park. Sci. News Kazakhstan 2019, 3, 202–209. (In Russian) [Google Scholar]
- IUCN. Available online: https://www.iucn.org/about-iucn (accessed on 24 October 2022).
- Goryunova, A.I.; Danko, E.K. (Eds.) Lake Fund of Kazakhstan. Section 1. Lakes of the Kokchetav region (within the borders of 1964–1999); Bastau Publishing LLP: Almaty, Kazakhstan, 2009; 70p. (In Russian) [Google Scholar]
- Skakun, V.A.; Kiseleva, V.A.; Goryunova, A.I. The ecosystem of Lake Borovoy and the possibilities of its transformation. Selevinia 2002, 1–4, 249–264. (In Russian) [Google Scholar]
- Krupa, E.G. Zooplankton of the lakes of the Shchuchinsko-Borovsk system (northern Kazakhstan) as an indicator of their trophic status. Terra 2007, 3, 60–66. (In Russian) [Google Scholar]
- Ismailova, A.A.; Zhamankara, A.K.; Akbaeva, L.K.; Adamov, A.A.; Abakumov, A.I.; Tulegenov, S.A.; Muratov, R.M. Hydrochemical and hydrobiological indicators as characteristics of the ecological state of lakes (on the example of Burabay and Ulken Shabakty lakes). Bull. Kazakh Natl. Univ. Biol. Ser. 2013, 3, 503–507. (In Russian) [Google Scholar]
- Voronikhin, N.N. To the algae flora of the Kazakh SSR. Bull. Acad. Sci. Kazakh SSR Alma-Ata 1947, 30, 70–73. (In Russian) [Google Scholar]
- Voronikhin, N.N. About some algae of the Borovsky Reserve. Proc. All-Union Hydrobiol. Soc. 1951, 3, 5–52. (In Russian) [Google Scholar]
- Voronikhin, N.N.; Krasnoperova, L.A. Zignemous algae of the Borovsky Reserve (Kokchetav region). News Taxon. Low. Plants Leningr. 1970, 7, 46–63. (In Russian) [Google Scholar]
- Demchenko, L.A. Aquatic vegetation of the lake Borovoe. Proc. State Nat. Reserve Borovoe 1948, 1, 52–61. (In Russian) [Google Scholar]
- Krasnoperova, L.A. Zignemous algae of Kazakhstan. (Chlorophyta: Zygnematales). Ph.D. Biol. Sciences, Leningrad State University, Leningrad, Russia, 1971. (In Russian). [Google Scholar]
- Ismagulova, A.Z. Green algae of reservoirs of the Borovoe nature reserve (Kaz. SSRP). Proceedings of 1st International Conference “Actual Problems of Modern Algology”, Cherkasy, Russia, 23–25 September 1987; Naukova Dumka: Kyiv, Ukraine, 1987; pp. 65–66. (In Russian). [Google Scholar]
- Ismagulova, A.Z. Green algae of water bodies of the Kokchetav region. In Botanicheskie Materialy Gerbariya Botanicheskogo Instituta Botaniki Akademii Nauk Kazakhskoi S S R. Alma Ata; Institute of Botany of the Academy of Sciences of Kaz. SSR Press: Alma-Ata, Kazakhstan, 1989; pp. 119–133. (In Russian) [Google Scholar]
- Sviridenko, B.F. Flora and Vegetation of Water Bodies in Northern Kazakhstan; Publishing house of the Omsk State Pedagogical University: Omsk, Russia, 2000; p. 196. (In Russian) [Google Scholar]
- Abiev, S.A.; Nurashov, S.B.; Sametova, E.S.; Toleuzhanova, A.T. Algoflora of Kokshetau—Borovsky lake systems. In Proceedings of the International Scientific Conference “Modern Trends in the Study of the Flora of Kazakhstan and Its Protection” Almaty, Republic of Kazakhstan, 24–26 April 2014; Institute of Botany of the Academy of Sciences of Kaz. SSR Press: Almaty, Kazakhstan, 2014; pp. 206–209. (In Russian). [Google Scholar]
- Dembowska, E.A.; Mieszczankin, T.; Napiórkowski, P. Changes of the phytoplankton community as symptoms of deterioration of water quality in a shallow lake. Environ. Monit. Assess. 2018, 190, 95. [Google Scholar] [CrossRef] [Green Version]
- Aazami, J.; Sari, A.E.; Abdoli, A.; Sohrabi, H.; Van den Brink, P.J. Assessment of ecological quality of the Tajan river in Iran using a multimetric macroinvertebrate index and species traits. Environ. Manag. 2015, 56, 260–269. [Google Scholar] [CrossRef] [Green Version]
- Svensson, O.; Bellamy, A.S.; Van den Brink, P.J.; Tedengren, M.; Gunnarsson, J.S. Assessing the ecological impact of banana farms on water quality using aquatic macroinvertebrate community composition. Environ. Sci. Pollut. Res. 2018, 25, 13373–13381. [Google Scholar] [CrossRef] [Green Version]
- Qin, B.Q.; Gao, G.; Zhu, G.W.; Zhang, Y.L.; Song, Y.Z.; Tang, X.M.G.; Xu, H.; Deng, J.M. Lake eutrophication and its ecosystem response. Chin. Sci. Bull. March 2013, 58, 961–970. [Google Scholar] [CrossRef] [Green Version]
- Krupa, E.G.; Barinova, S.S.; Romanova, S.M.; Khitrova, E.A. Hydrochemical and Hydrobiological Characteristics of the Lakes of the Shchuchinsko-Borovsk Resort Zone (Northern Kazakhstan) and the Main Methodological Approaches to Assessing the Ecological State of Small Water Bodies; Republican State Enterprise “Institute of Zooology” of The Science Committee of The Ministry of Education and Science of The Republic of Kazakhstan LLP “Kazakhstan Agency of Applied Ecology” Publishing house Etalon Print LLP: Almaty, Kazakhstan, 2021; p. 300. (In Russian) [Google Scholar]
- Barinova, S.; Bilous, O.; Ivanova, N. New Statistical Approach to Spatial Analysis of Ecosystem of the Sasyk Reservoir, Ukraine. Int. J. Ecotoxicol. Ecobiol. 2016, 1, 118–126. [Google Scholar] [CrossRef]
- Barinova, S. Ecological mapping in application to aquatic ecosystems bioindication: Problems and methods. Int. J. Environ. Sci. Nat. Resour. 2017, 3, 1–7. [Google Scholar] [CrossRef] [Green Version]
- Krupa, E.G.; Barinova, S.S.; Ponamareva, L.; Tsoy, V.N. Statistical mapping and 3-D surface plots in phytoplankton analysis of the Balkhash Lake (Kazakhstan). Transylv. Rev. Syst. Ecol. Res. Wetl. Divers. 2018, 20, 1–16. [Google Scholar] [CrossRef] [Green Version]
- Krupa, E.; Romanova, S.; Berkinbaev, G.; Yakovleva, N.; Sadvakasov, E. Zooplankton as Indicator of the Ecological State of Protected Aquatic Ecosystems (Lake Borovoe, Burabay National Nature Park, Northern Kazakhstan). Water 2020, 12, 2580. [Google Scholar] [CrossRef]
- Romanov, R.E.; Zhamangara, A. Pre-Symposium Field Excursion Report: Results in context of regional charophyte knowledge. IRGC News 2017, 28, 11–13. [Google Scholar]
- Uteshev, A.S. Climate of Kazakhstan; Hydrometeorological Publishing House: Leningrad, Russia, 1959; p. 371. [Google Scholar]
- Abakumov, V.A. (Ed.) Guidance on Methods of Hydrobiological Analysis of Surface Waters and Bottom Sediments; Gidrometeoizdat: Leningrad, Russia, 1983; 240p. (In Russian) [Google Scholar]
- Kiselev, I.A. Research methods of plankton. In Life of the Fresh Water of the USSR; Pavlovsky, E.N., Zhadin, V.I., Eds.; USSR Academy of Sciences: Moscow/Leningrad, Russia, 1956; pp. 188–253. (In Russian) [Google Scholar]
- Kiselev, I.A. Plankton of the Seas and Continental Water Bodies; Nauka: Leningrad, Russia, 1969; p. 657. (In Russian) [Google Scholar]
- Semenov, A.D. (Ed.) Guidance on the Chemical Analysis of Land Surface Water; Gidrometeoizdat: Leningrad, Russia, 1977; p. 541. (In Russian) [Google Scholar]
- Komárek, J.; Anagnostidis, K. Cyanoprokaryota. Teil 1: Chroococcales. In Süsswasser flora von Mitteleuropa 19/1; Ettl, H., Gärtner, G., Heynig, H., Mollenhauer, D., Eds.; Gustav Fisher: Jena, Stuttgart, Lübeck, Ulm, Germany, 1998. [Google Scholar]
- Komárek, J.; Anagnostidis, K. Cyanoprokaryota. Teil 2: Oscillatoriales. In Süsswasserflora von Mitteleuropa 19/2; In Büdel, B., Gärtner, G., Krienitz, L., Schagerl, M., Eds.; Elsevier: München, Germany, 2005; p. 759. [Google Scholar]
- Krammer, K.; Lange-Bertalot, H. Bacillariophyceae. 2. Bacillariaceae, Epithemiaceae, Surirellaceae. Süßwasserflora von Mitteleuropa, 2/2; G. Fischer: Stuttgart/Jena, Germany, 1988; p. 596. [Google Scholar]
- Krammer, K.; Lange-Bertalot, H. Bacillariophyceae. 3. Centrales, Fragilariaceae, Eunotiaceae. Süsswasserflora von Mitteleuropa 2/3; G. Fischer: Stuttgart/Jena, Germany, 1991; p. 576. [Google Scholar]
- Krammer, K.; Lange-Bertalot, H. Bacillariophyceae. 4. Achnanthaceae, Kritische Ergänzungen zu Navicula (Lineolatae) und Gomphonema Gesamtliteraturverzeichnis. Teil 1–4. Süβwasserflora von Mitteleuropa 2/4; G. Fischer: Stuttgart/Jena, Germany, 1991; p. 437. [Google Scholar]
- John, D.M.; Whitton, B.A.; Brook, A.J. (Eds.) The Freshwater Algal Flora of the British Isles: An Identification Guide to Freshwater and terrestrial Algae; Cambridge University Press: Cambridge, UK, 2011; p. 878. [Google Scholar]
- Guiry, M.D.; Guiry, G.M.; AlgaeBase World-Wide Electronic Publication. National University of Ireland, Galway. Available online: http://www.algaebase.org (accessed on 24 June 2022).
- Magurran, A.E. Ecological Diversity and Its Measurements; Princeton University Press: Princeton, NJ, USA, 1988; p. 192. [Google Scholar] [CrossRef]
- Sládeček, V. Diatoms as indicators of organic pollution. Acta Hydroch. Hydrobiol. 1986, 14, 555–566. [Google Scholar] [CrossRef]
- Barinova, S.S.; Medvedeva, L.A.; Anissimova, O.V. Diversity of Algal Indicators in Environmental Assessment; Pilies Studio: Tel Aviv, Israel, 2006; p. 495. Available online: https://drive.google.com/drive/folders/1FNW2oIMkvujsouuL9GF4c478k99qMPho (accessed on 30 August 2022). (In Russian)
- Barinova, S.; Bilous, O.; Tsarenko, P.M. Algae Indication of Waterbodies in Ukraine: Methods and Perspectives; Haifa University Publishing House: Haifa, Kiev, 2019; pp. 297–367. Available online: https://drive.google.com/drive/folders/1K3U-eEo0aYRu0s84C9XNtKePY9jK32yC (accessed on 30 August 2022). (In Russian)
- Barinova, S. Essential and practical bioindication methods and systems for the water quality assessment. Int. J. Environ. Sci. Nat. Resour. 2017, 2, 555588. [Google Scholar] [CrossRef]
- Love, J.; Selker, R.; Marsman, M.; Jamil, T.; Dropmann, D.; Verhagen, A.J.; Ly, A.; Gronau, Q.F.; Smira, M.; Epskamp, S.; et al. JASP: Graphical statistical software for common statistical designs. J. Stat. Softw. 2019, 88, 1–17. [Google Scholar] [CrossRef] [Green Version]
- Novakovsky, A.B. Abilities and base principles of program module “GRAPHS”. Sci. Rep. Komi Sci. Cent. Ural. Div. Russ. Acad. Sci. 2004, 27, 28. (In Russian) [Google Scholar]
- Ter Braak, C.J.F.; Šmilauer, P. CANOCO Reference Manual and CanoDraw for Windows User’s Guide: Software for Canonical Community Ordination (Version 4.5); Microcomputer Power Press: Ithaca, NY, USA, 2002; p. 500. [Google Scholar]
- Bragin, E.A.; Bragina, T.M. (Eds.) Wetlands in system of nature complexes of Northern Kazakhstan. General characteristic and nature conservation importance. In The Most Important Wetlands of Northern Kazakhstan (In Limits of Kostanay and West Part of North-Kazakhstan Regions); WWF series, issue 5; Russian University Press: Moscow, Russia, 2002; pp. 19–38. (In Russian) [Google Scholar]
- Reynolds, C.S. The Ecology of Phytoplankton; Cambridge University Press: Cambridge, UK, 2006; p. 535. [Google Scholar]
- Barinova, S.S.; Nevo, E.; Bragina, T.M. Ecological assessment of wetland ecosystems of northern Kazakhstan on the basis of hydrochemistry and algal biodiversity. Acta Bot. Croat. 2011, 70, 215–244. [Google Scholar] [CrossRef] [Green Version]
- Barinova, S.S.; Bragina, T.M.; Nevo, E. Algal species diversity of arid region lakes in Kazakhstan and Israel. Community Ecol. 2009, 10, 7–16. [Google Scholar] [CrossRef]
- Barinova, S.S.; Romanov, R.E. Towards an inventory of algal diversity of the Zerenda Lake, Northern Kazakhstan. In Biological Diversity of Asian Steppe, Proceedings of the III International Scientific Conference, Kostanay, Kazakhstan, 24–27 April 2017; Abil, E.A., Bragina, T.M., Eds.; KSPI: Kostanay, Kazakhstan, 2017; pp. 139–144. [Google Scholar]
- Barinova, S.; Krupa, E.; Tsoy, V.; Ponamareva, L. The application of phytoplankton in ecological assessment of the Balkhash Lake (Kazakhstan). Appl. Ecol. Environ. Res. 2018, 16, 2089–2111. [Google Scholar] [CrossRef]
- Krupa, E.G.; Barinova, S.M.; Romanova, S.M.; Malybekov, A.B. Hydrobiological assessment of the high mountain Kolsay Lakes (Kungey Alatau, Southeastern Kazakhstan) ecosystems in climatic gradient. Br. J. Environ. Clim. Change 2016, 6, 259–278. [Google Scholar] [CrossRef]
- Krupa, E.G.; Barinova, S.S.; Amirgaliyev, N.A.; Issenova, G.; Kozhabayeva, G. Statistical approach to estimate the anthropogenic sources of potentially toxic elements on the Shardara Reservoir (Kazakhstan). MOJ Eco. Environ. Sci. 2017, 2, 8–14. [Google Scholar] [CrossRef] [Green Version]
- Barinova, S.; Gabyshev, V.; Boboev, M.; Kukhaleishvili, L.; Bilous, O. Algal indication of climatic gradients. Am. J. Environ. Protection. Spec. Issue: Appl. Ecol. Probl. Innov. 2015, 4, 72–77. [Google Scholar] [CrossRef] [Green Version]
- IUCN. IUCN Red List Categories and Criteria, Version 3.1, 2nd ed.; IUCN: Gland, Switzerland; Cambridge, UK, 2012; p. 32. [Google Scholar]
- Muylaert, K.; Pérez-Martínez, C.; Sánchez-Castillo, P.; Lauridsen, T.L.; Vanderstukken, M.; Declerck, S.A.J.; Van der Gucht, K.; Conde-Porcuna, J.M.; Jeppesen, E.; De Meester, L.; et al. Influence of nutrients, submerged macrophytes and zooplankton grazing on phytoplankton biomass and diversity along a latitudinal gradient in Europe. Hydrobiologia 2010, 653, 79–90. [Google Scholar] [CrossRef]


| Phylum | 1 | 2 | 3 | 4 | 5 | 6 | 7 | 8 | Percent |
|---|---|---|---|---|---|---|---|---|---|
| Bacillariophyta | 7 | 11 | 8 | 10 | 9 | 11 | 9 | 7 | 40 |
| Chlorophyta | 7 | 6 | 7 | 2 | 8 | 8 | 8 | 10 | 25 |
| Cyanobacteria | 8 | 4 | 7 | 5 | 5 | 7 | 6 | 5 | 21 |
| Euglenozoa | 0 | 0 | 1 | 1 | 2 | 0 | 1 | 1 | 3 |
| Miozoa | 1 | 2 | 3 | 1 | 1 | 1 | 2 | 3 | 7 |
| Ochrophyta | 1 | 1 | 1 | 1 | 1 | 1 | 1 | 1 | 1 |
| Charophyta | 2 | 1 | 1 | 1 | 1 | 1 | 1 | 1 | 3 |
| Total | 26 | 25 | 28 | 21 | 27 | 29 | 28 | 28 | 100 |
| Station Group | 1 | 2 | 3 |
|---|---|---|---|
| Depth, m | 4.13 | 4.22 | 4.21 |
| Secchi, m | 0.57 | 0.65 | 0.67 |
| T, °C | 22.44 | 22.43 | 22.00 |
| pH | 8.17 | 8.17 | 8.24 |
| TDS, mg L−1 | 188.47 | 191.80 | 194.43 |
| N-NO3, mg L−1 | 0.56 | 0.58 | 0.04 |
| Index S | 1.81 | 1.89 | 1.81 |
| Index WESI | 1.11 | 1.17 | 3.33 |
| Abundance, cells L−1 | 2516.5 | 4603.7 | 2448.0 |
| Biomass mg L−1 | 2087.4 | 3237.2 | 2110.2 |
| Shannon Index | 0.751 | 0.530 | 0.738 |
Publisher’s Note: MDPI stays neutral with regard to jurisdictional claims in published maps and institutional affiliations. |
© 2022 by the authors. Licensee MDPI, Basel, Switzerland. This article is an open access article distributed under the terms and conditions of the Creative Commons Attribution (CC BY) license (https://creativecommons.org/licenses/by/4.0/).
Share and Cite
Barinova, S.; Krupa, E.; Khitrova, E. Spatial Distribution of the Taxonomic Diversity of Phytoplankton and Bioindication of the Shallow Protected Lake Borovoe in the Burabay National Natural Park, Northern Kazakhstan. Diversity 2022, 14, 1071. https://doi.org/10.3390/d14121071
Barinova S, Krupa E, Khitrova E. Spatial Distribution of the Taxonomic Diversity of Phytoplankton and Bioindication of the Shallow Protected Lake Borovoe in the Burabay National Natural Park, Northern Kazakhstan. Diversity. 2022; 14(12):1071. https://doi.org/10.3390/d14121071
Chicago/Turabian StyleBarinova, Sophia, Elena Krupa, and Elena Khitrova. 2022. "Spatial Distribution of the Taxonomic Diversity of Phytoplankton and Bioindication of the Shallow Protected Lake Borovoe in the Burabay National Natural Park, Northern Kazakhstan" Diversity 14, no. 12: 1071. https://doi.org/10.3390/d14121071