Article

The Quality of Sequence Data Affects Biodiversity and Conservation Perspectives in the Neotropical Damselfly Megaloprepus caerulatus

1
Division of Ecology and Evolution, University of Veterinary Medicine Hannover, Bünteweg 17d, 30559 Hannover, Germany
2
Division of Invertebrate Zoology, American Museum of Natural History, Central Park West at 79th Street, New York, NY 10024, USA
*
Author to whom correspondence should be addressed.
Diversity 2022, 14(12), 1056; https://doi.org/10.3390/d14121056
Submission received: 28 September 2022 / Revised: 15 November 2022 / Accepted: 22 November 2022 / Published: 1 December 2022
(This article belongs to the Special Issue Diversity, Ecology and Evolution of Odonata)

Abstract

:
Ideally, the footprint of the evolutionary history of a species is drawn from integrative studies including quantitative and qualitative taxonomy, biogeography, ecology, and molecular genetics. In today’s research, species delimitations and identification of conservation units is often accompanied by a set of—at minimum—two sequence markers appropriate for the systematic level under investigation. Two such studies re-evaluated the species status in the world’s largest Odonata, the Neotropical damselfly Megaloprepus caerulatus. The species status of the genus Megaloprepus has long been debated. Despite applying a highly similar set of sequence markers, the two studies reached different conclusions concerning species status and population genetic relationships. In this study, we took the unique opportunity to compare the two datasets and analyzed the reasons for those incongruences. The two DNA sequence markers used (16S rDNA and CO1) were re-aligned using a strict conservative approach and the analyses used in both studies were repeated. Going step by step back to the first line of data handling, we show that a high number of unresolved characters in the sequence alignments as well as internal gaps are responsible for the different outcomes in terms of species delimitations and population genetic relationships. Overall, this study shows that high quality raw sequence data are an indispensable requirement, not only in odonate research.

1. Introduction

Molecular genetic studies using mitochondrial and nuclear DNA markers strongly rely on high quality sequence data to reconstruct evolutionary patterns such as phylogenetic relationships, population structures, modes of adaptation, and species diversity in taxonomic groups. Specifically, when evaluating a hypothesis of species delimitation, the use of a set of DNA sequence markers has become standard. The advantages of Sanger sequencing include direct comparisons of genes for estimating genetic diversities and reconstructing phylogenies [1,2,3,4,5].
The repeatability of results under the most conserved scheme is a conditio sine qua non in science. In molecular genetics, one should expect, when using the same set of DNA markers and DNA samples coming from similar tissues/individuals, similar or the same results as an outcome. However, the quality of raw sequence data, interpretation of ambiguous data and alignment problems often affect the outcomes of reconstructions [6,7,8]. A recent example is two studies on the neotropical damselfly genus Megaloprepus (Zygoptera: Odonata), which apply the same set of DNA markers but reach contradictory results. In this genus, species status has long been questioned, not only because of differences in morphological patterns and a broad distribution across tropical Latin America, despite a highly conserved ecological niche, but also because of molecular genetic data [9]. In the 19th century, the first three species were described in this genus: M. caerulatus, M. latipennis and M. brevistigma [10]. Later, the species status of M. latipennis and M. brevistigma was refused [11] but the monotypic status of the genus was still under debate [9,12,13,14].
In a first attempt to evaluate the species status of Megaloprepus using genetic data, Feindt et al. [12] analyzed two mitochondrial sequence markers (NADH-dehydrogenase subunit 1 (nad1) and 16S ribosomal DNA (16S rDNA)) from more than 100 tissue samples of four populations in Mesoamerica: Los Tuxtlas Biosphere Reserve (Mexico), Corcovado National Park and Biological Research Station La Selva (Costa Rica), and Barro Colorado Island (Panama). The results showed a strong genetic isolation of populations with genetic distances comparable to species level differences in other odonate species (6.8% and 7.5% in ND1 and between 4% and 4.9% in 16S rDNA) [12]. The authors conclude that the genus Megaloprepus consists of at least three distinct species [12].
The second genetic dataset in a follow-up study by Fincke and colleagues [15] included tissue samples from 56 to 68 specimens of eight populations throughout Mesoamerica: Los Tuxtlas Biosphere Reserve (México), Cusoco National Park (Honduras), El Jaguar reserve and Bartola Reserve (Nicaragua), Corcovado National Park and Biological Research Station La Selva (Costa Rica), Barro Colorado Island (Panama), and Rio Canande Reserve (Ecuador). Here, the resulting phylogeny showed three clades similar to the previous study [12], except for the samples from Barro Colorado Island, which appeared as three paraphyletic clades [15]. However, in contrast to the phylogenetic clades, the genealogical haplotype networks revealed a high number of shared haplotypes between populations, despite high geographic distances. In addition, Fincke et al. [15] found a higher variability in the slower evolving 16S rDNA gene compared to the Cytochrome c oxidase subunit 1 (CO1) gene, a phenomenon not observed in odonates or other groups before, [5,16,17,18,19,20,21]. Furthermore, Finke et al. combined their 16S rDNA data with the Feindt et al. 16S rDNA data for their phylogenetic reconstruction. Finke et al. [15] described the population from the Corcovado National Park (Costa Rica), collected by them, as genetically distinct from the population at the same locality collected during a similar time period by Feindt et al. [12]—a result difficult to explain in biological terms. In short, the two studies draw remarkably different conclusions about the delimitation of species within the genus Megaloprepus, which in turn leads to a significant different perspective for conservation and biodiversity (3 versus 1 conservation unit).
To identify potential causes of these different results, we took the unique opportunity in this study to look deeper into the data handling and analyses of the two datasets. We focused on two main questions: (i) does adding (or not removing) unresolved characters and gaps from sequence alignments increase haplotype diversity, and “dilute” topologies in phylogenetic tree and genealogical network reconstructions? (ii) Does the reported higher variability in 16S rDNA hold up to the reanalysis? Consequently, the causal mechanisms that may have led to the above results and their different interpretation of phylogenetic trees and haplotype networks are explored—not only for those two datasets—but also as an example for a general awareness concerning a sensible use of genetic data.

2. Materials and Methods

2.1. Data Mining

The comparison of genetic data handling is based on the DNA marker genes 16S rDNA and CO1. For this purpose, we included the dataset from Fincke et al. [15]—hereafter Study-A, and the data of Feindt et al. [12] plus additionally sequenced CO1—hereafter Study-B (see Table S1 for species identifications and origin, accession numbers, and additional information).
For Study-A, the 16S rDNA dataset was provided on request as an alignment directly from Fincke et al., since sequences were not published on GenBank (NCBI, [22]). This dataset appeared as an alignment fraction prepared for a tree analysis, which therefore may include many question marks at the same positions inside the alignment. Usually, those questions marks in a bigger alignment stand for missing information sites, especially when several distinct species and genes are combined and/or if sequences of different lengths are used. The CO1 sequences were downloaded from GenBank [22]. Here it is important to mention that these CO1 sequences are labeled as unverified with the comment: “similar to cytochrome oxidase subunit I”. Such labels signify that the open reading frame is interrupted, potentially indicating sequencing errors. All sequences were verified as Megaloprepus via BLAST searches [23]. According to Fincke et al., primers are mentioned in [24]. Unfortunately, this reference only includes two primer sets for 16S rDNA and none for CO1. This fact makes objective comparisons and repetitions impossible.
For Study-B, 16S rDNA sequences were downloaded from GenBank [22]. Consequently, Study-A and Study-B, as well as the present study, use the same 16S dataset containing 106 individual sequences. In addition, because CO1 was not originally included in Study-B, CO1 marker genes were newly Sanger sequenced, following the steps described by Bergmann et al. [25], except that sequencing was performed at the Yale University (DNA Analysis Facility on Science Hill), and uploaded to GenBank [22]. In this study, each specimen that is included in the 16S rDNA Study-B dataset was also sequenced to obtain the CO1 dataset, and consequently, 106 CO1 sequences are analyzed here (see Table S1 for all accession numbers). For the 16S rDNA, gene fragment standard primers (P784 and P785) first described in Simon et al. [26] were used, and for CO1, the barcoding region using the primer set LCO 1490 and HCO 2198 [27] was sequenced.

2.2. Sequence Editing and Alignments

To identify the source of incongruence between the two study results concerning population genetic and phylogenetic relationships, three different alignments for each sequence marker were generated (total six alignments):
(i)
Alignments 1 include the original Study-A sequences (for CO1 and 16S rDNA separately),
(ii)
Alignments 2 consist of the edited Alignments 1 (again, separately for CO1 and 16S rDNA), and
(iii)
Alignments 3 include the combined sequence data from both studies (Alignments 2 from Study-A plus Study-B alignments for either CO1 or 16S rDNA).
All alignments were performed using MUSCLE [28] under standard conditions (gap open -400, gap extend 0) in the most conservative way.
For the Alignments 1, the sequence data from Study-A were used without any editing except for length cuts (16S rDNA Alignment 1 and CO1 Alignment 1, see Supplementary Material: Files S1 and S2). Because the original sequences were of different length, our cutting was intended to obtain the same length for all sequences and the longest possible overlap. We cut sequences in conserved regions within the alignment.
For generating the Alignments 2, the original sequence data from Alignment 1 was manually edited. The reasons, therefore, are the inaccuracies observed within individual sequences such as large gaps and ambiguous bases. For the 16S rDNA Alignment 2, this editing included a verification of gaps and/or missing data. First, all question marks were removed, and the dataset was realigned. This alignment partly removed internal gaps. However, in the next step we deleted individual sequences, which still had internal gaps, probably due to incomplete sequencing or non-readable chromatograms, and repeated the alignment. Finally, sequences were cut to the same length. In addition, we intended to align the 16S rDNA dataset using the secondary structure as reference, which, however, did not result in a better alignment.
For the CO1 Alignment 2, the approach was slightly different. Because of the high content of N bases throughout all individual sequences, the data handling and editing was as follows: We first deleted all sequences with N bases on different positions in the alignment. In addition, sequences containing equivocal bases such as R, S or M were strictly removed as those carry the risk of identifying false haplotypes. Because mitochondria are maternally inherited, heterozygous positions are not expected to lead to all mitochondrial genes of one individual being identical. In a next step, a verification of the N bases, which were at the same positions between sequences, was needed to assure a correct alignment. Therefore, the published mitochondrial genome of M. caerulatus (GenBank: KU958377 [29]) was used as a seed sequence. Reverse complement on the Study-A sequences was performed to ensure the correct reading frame and a strict removal of those N’s allowed a solid alignment. Finally, a length cut was performed (File S4: CO1 Alignment 2).
In a second attempt, we intended to align Study-A raw-sequences by ‘simply’ removing N’s and gaps and translating the dataset into amino acid sequences. This attempt left us with no alignment because the translation to amino acid sequences was interrupted. However, the final Alignments 2 and 3 translate correctly into amino acid sequences.
For Alignments 3, the edited Study-A 16S rDNA and CO1 Alignments 2 (Files S3 and S4) were combined with the corresponding sequence data of Study-B. Datasets were aligned and cut to the same length (Files S5 and S6: 16S rDNA and CO1 Alignment 3).
For all alignments, we report parsimony-informative sites performed in PAUP* vers. 4.0b8 [30] and the number of singleton sites determined in MEGA 11 [31], as the latter may indicate sequencing errors. MEGA defines a site as a singleton site “if at least three sequences contain unambiguous nucleotides or amino acids” [31].

2.3. Population Structure, Genealogical Network, and Phylogenetic Analyses

Genealogical relationships between individuals and populations were reconstructed for each of the 6 alignments, repeating the original procedures from studies A and B. Briefly, genetic diversity was estimated using DnaSP [32] and sequence divergence between and within groups was computed in MEGA 7 [33] using the Kimura 2-parameter (K2P) model [34]. Minimum spanning haplotype networks were calculated in POPART v. 1.7 [35] to visually display relationships and haplotype distribution. In addition, haplotype networks analyses were performed using the statistical parsimony software TCS by applying a parsimony connection limit of 95% for the haplotype distribution (TCS vers. 1.13, [36]). Finally, the genetic hierarchical population structure was studied via FST-values [37] and an analysis of molecular variance (AMOVA, [38]) using 10,000 permutations for statistical significance was performed in Arlequin 3.5 [39]. In the AMOVA, we decided to test for two hierarchic levels: (i) no grouping among populations and (ii) three groups. These assumptions are based on the results from the Study-A and on the hypothesis of three distinct groups, as suggested by Study-B.
Since the CO1 Alignment 1 included ambiguities, some analyses could not be performed because programs rejected the dataset. The following analyses are therefore not presented for the CO1 Alignment 1: the summary statistics via DnaSP [32], the AMOVA using Arlequin 3.5 [39], and the TCS analysis (TCS vers. 1.13 [36]).
Finally, phylogenies were reconstructed for each sequence marker separately, using the Alignments 3. In each tree search, three closely related sister species to Megaloprepus; Coryphagrion grandis, Mecistogaster linearis and Mecistogaster lucretia [40,41] were used as outgroups (Table S1). Phylogenetic tree reconstruction was performed via maximum likelihood inference using IQ-TREE [42] while allowing ModelFinder [43] to estimate the best substitution model. Branch confidence was estimated with 1000 bootstrap replicates [44]. Furthermore, we carried out phylogenetic reconstruction using Maximum Parsimony (MP) and Bayesian inference (BI) following the steps described in Study-B [12]. Briefly, MP was performed in PAUP* vers. 4.0b8 [30] using a full heuristic search (50% majority-rule, 1000 bootstrap replicates and reconnection branch swapping option (TBR)). MrBayes vers. 3.7 [45] was used to perform Bayesian analysis, where the most likely model of nucleotide substitution was tested separately for each locus in ModelTest vers. 3.7 [46] using the Akaike Information Criterion (AICc model selection) [47]. Finally, we used the following settings: two independent runs were performed under the best fit-model (JC for 16S rDNA and HKY+G for CO1) for 20 × 106 generations and each four Markov chains; trees were sampled every 1000 generations—but the first 20,000 trees were discarded as `burn-in’. Posterior probabilities and consensus topology is based on the remaining trees.

3. Results

3.1. Alignments

Study-A datasets originally included 56 individual sequences for 16S rDNA and 68 sequences for CO1 from eight populations from Mexico to Ecuador [15], whereas Study-B included 106 individual sequences from four populations (Table S1). The following four populations were also sampled in both studies in a similar time period: the Biosphere Reserve Los Tuxtlas in Mexico, the Biological Research Station La Selva in Costa Rica, Corcovado National Park, also in Costa Rica, and Barro Colorado Island in Panama, and should by theory give very similar genetic results.

3.1.1. 16S

The 16S rDNA Alignment 1 contained variable nucleotide positions that were partly masked—as variable nucleotide positions in one population were equipped with question marks in the other population and vice versa. In addition, since we were interested in verifying population structures and species splits, we had to delete six individual sequences because of unclear origin. These individual sequences were not mentioned in the Study-A species list ( RU_621, RU_828, or MC_530 (Table S1)). One sequence was deleted because it was downloaded from GenBank [22]. The 16S rDNA Alignment 1 therefore included only 49 sequences from seven populations with a total length of 577 bp. In total, 70 parsimony-informative characters out of 101 variable characters and 30 singleton sites were detected (see Supplementary File S1).
For the 16S rDNA Alignment 2, during editing, ten additional sequences had to be deleted from the Alignment 1 due to large internal gaps (such as RU631_HN, RU632_BCI, RU803_LT). Consequently, the final 16S rDNA Alignment 2 comprised 39 sequences. The alignment length was reduced to 325 bp because sequences from Nicaragua were significantly shorter than all others. An analysis without these sequences would have allowed an alignment length of 456 bp (see Supplementary Files S1 and S3) but would not have allowed for a comparison of genetic diversity among those populations. The resulting alignment contains 27 variable positions, whereof 26 are parsimony-informative sites, and there is only one singleton site.
Finally, the 16S rDNA Alignment 3—a combined alignment of both studies, contained 150 sequences from seven populations, with a total alignment length of 321 bp and 28 variable characters (26 parsimony-informative sites) (File S5). Furthermore, two singleton sites were found. See Table 1 for the final number of sequences per population in the Alignments 3. Screenshots from the 16S rDNA Alignment 1 and Alignment 3 show the alignment status (Supplementary Material Figures S1 and S2, File S7).

3.1.2. CO1

For the CO1 Alignment 1—contrary to the study design, in which we were only aiming to perform length cuts—seven sequences were removed to be able to reach a total alignment length of 419 bp. This removal was because of general sequence length where some of those sequences were as short as 117 bp, as well as the general overlapping area with sequences not starting with the same codon. Therefore, the final alignment included 61 individual sequences (File S2). The alignment contained 58 parsimony-informative characters while 26 variable positions are not parsimony-informative and 26 singleton sites were found.
Because of the strict reviewing and editing, Alignment 2 included only 29 individual sequences (42.6% of the original dataset) from seven populations (Table 1 and Table S1). The total alignment length resulted in 395 bp and included 54 variable characters, of which 42 are parsimony-informative sites. Twelve singleton sizes were found (File S4).
The final Alignment 3 included 135 individuals from seven populations, where 106 individual sequences originate from the newly sequenced 106 individuals from Study-B. It had a length of 395 bp, including 55 parsimony informative sites of a total of 59 variable characters, as well as four singleton sites (File S6).

3.2. Population Structure, Genealogical Network, and Phylogenetic Analyses

The application of a strict and conservative alignment approach to both datasets of Study-A demonstrated that the results of Study-A could not be replicated for any of the alignments. All haplotype networks and the phylogenetic tree topologies mirror the network and tree topologies of Study-B—most obvious, however, in Alignment 2 and Alignment 3. This effect appeared even though sequences in the Alignments 1 were not edited and the fact that the bioinformatic algorithms are the same.
The number of polymorphic sites, singleton sites, nucleotide diversity, and haplotype diversity per population site was, as expected, higher in Alignments 1 than in Alignments 2 or Alignments 3 for both sequence markers (Table 2 and Table 3). In particular, the analyses of the 16S rDNA Alignment 1 ( BCI and LS populations) show a high number of haplotype diversity most certainly due to the ambiguities within the sequences (Table 2). In the Alignments 2 and 3, haplotype diversity was reduced. This effect was most obvious in the BCI, La Selva and Nicaragua (NI) populations (Table 2). Furthermore, the genetic variability within the populations was high (genetic differentiation within groups via the Kimura 2-parameter (K2P) model) in the two Alignments 1 (CO1 and 16S rDNA, Table S2). Up to 1.69% was found in BCI in 16S rDNA and 0.75% in NI-b in CO1, and in this alignment, the unusual effect of a higher 16S genetic variability was repeatable. (Table S2). In contrast, in the Alignments 2 and 3 for CO1 and 16S rDNA, this high variability within populations was not observed. The highest variability within populations with 0.18% was found in the BCI (Panama) population in the 16S rDNA Alignment 3, 0.28% in the Los Tuxtlas population (Mexico) and 0.20% in BCI in the CO1 Alignment 3 (Table S2).
The genetic distance values between groups using the Kimura 2-parameter (K2P) model are in accordance with geography and sampling schemes, cf. [12]. Moreover, the values indicate geographic isolation among populations, which appear arranged in three clusters (with high genetic distances between clusters and low genetic distances within clusters). This pattern is visible in the analyses of all alignments (Alignments 1 to 3) for CO1 and 16S rDNA, although it is most obvious in the Alignments 3. The identified clusters are as follows: (i) RBLT, (ii) NI and CNP, and (iii) NI-b, LS, BCI and CAN (Table S2). Although the length of each marker gene studied in the Alignments 3 is due to the previous editing of the Alignment 2 relatively short, the observed genetic distances between clusters within a range of 4.26% to 5.06% in 16S rDNA and from 7.61% to 9.62% in CO1 are comprehensible for a species level (Table S2). The FST-values support these genetic distances. A significant isolation among all clusters and even populations was observed in all Alignments with FST-values of a minimum of FST = 0.84 (in 16S rDNA Alignment 1 between the Nicaragua populations NI and NI-b) (Table S2). Within clusters, the FST-values are inconsistent. On the other hand, between La Selva in Costa Rica and CAN Ecuador—geographically the most distant populations (app. 3300 km), the FST-value is relatively low at FST = 0.40, and the FST-value is between BCI and La Selva (app. 540 km) FST = 0.85.

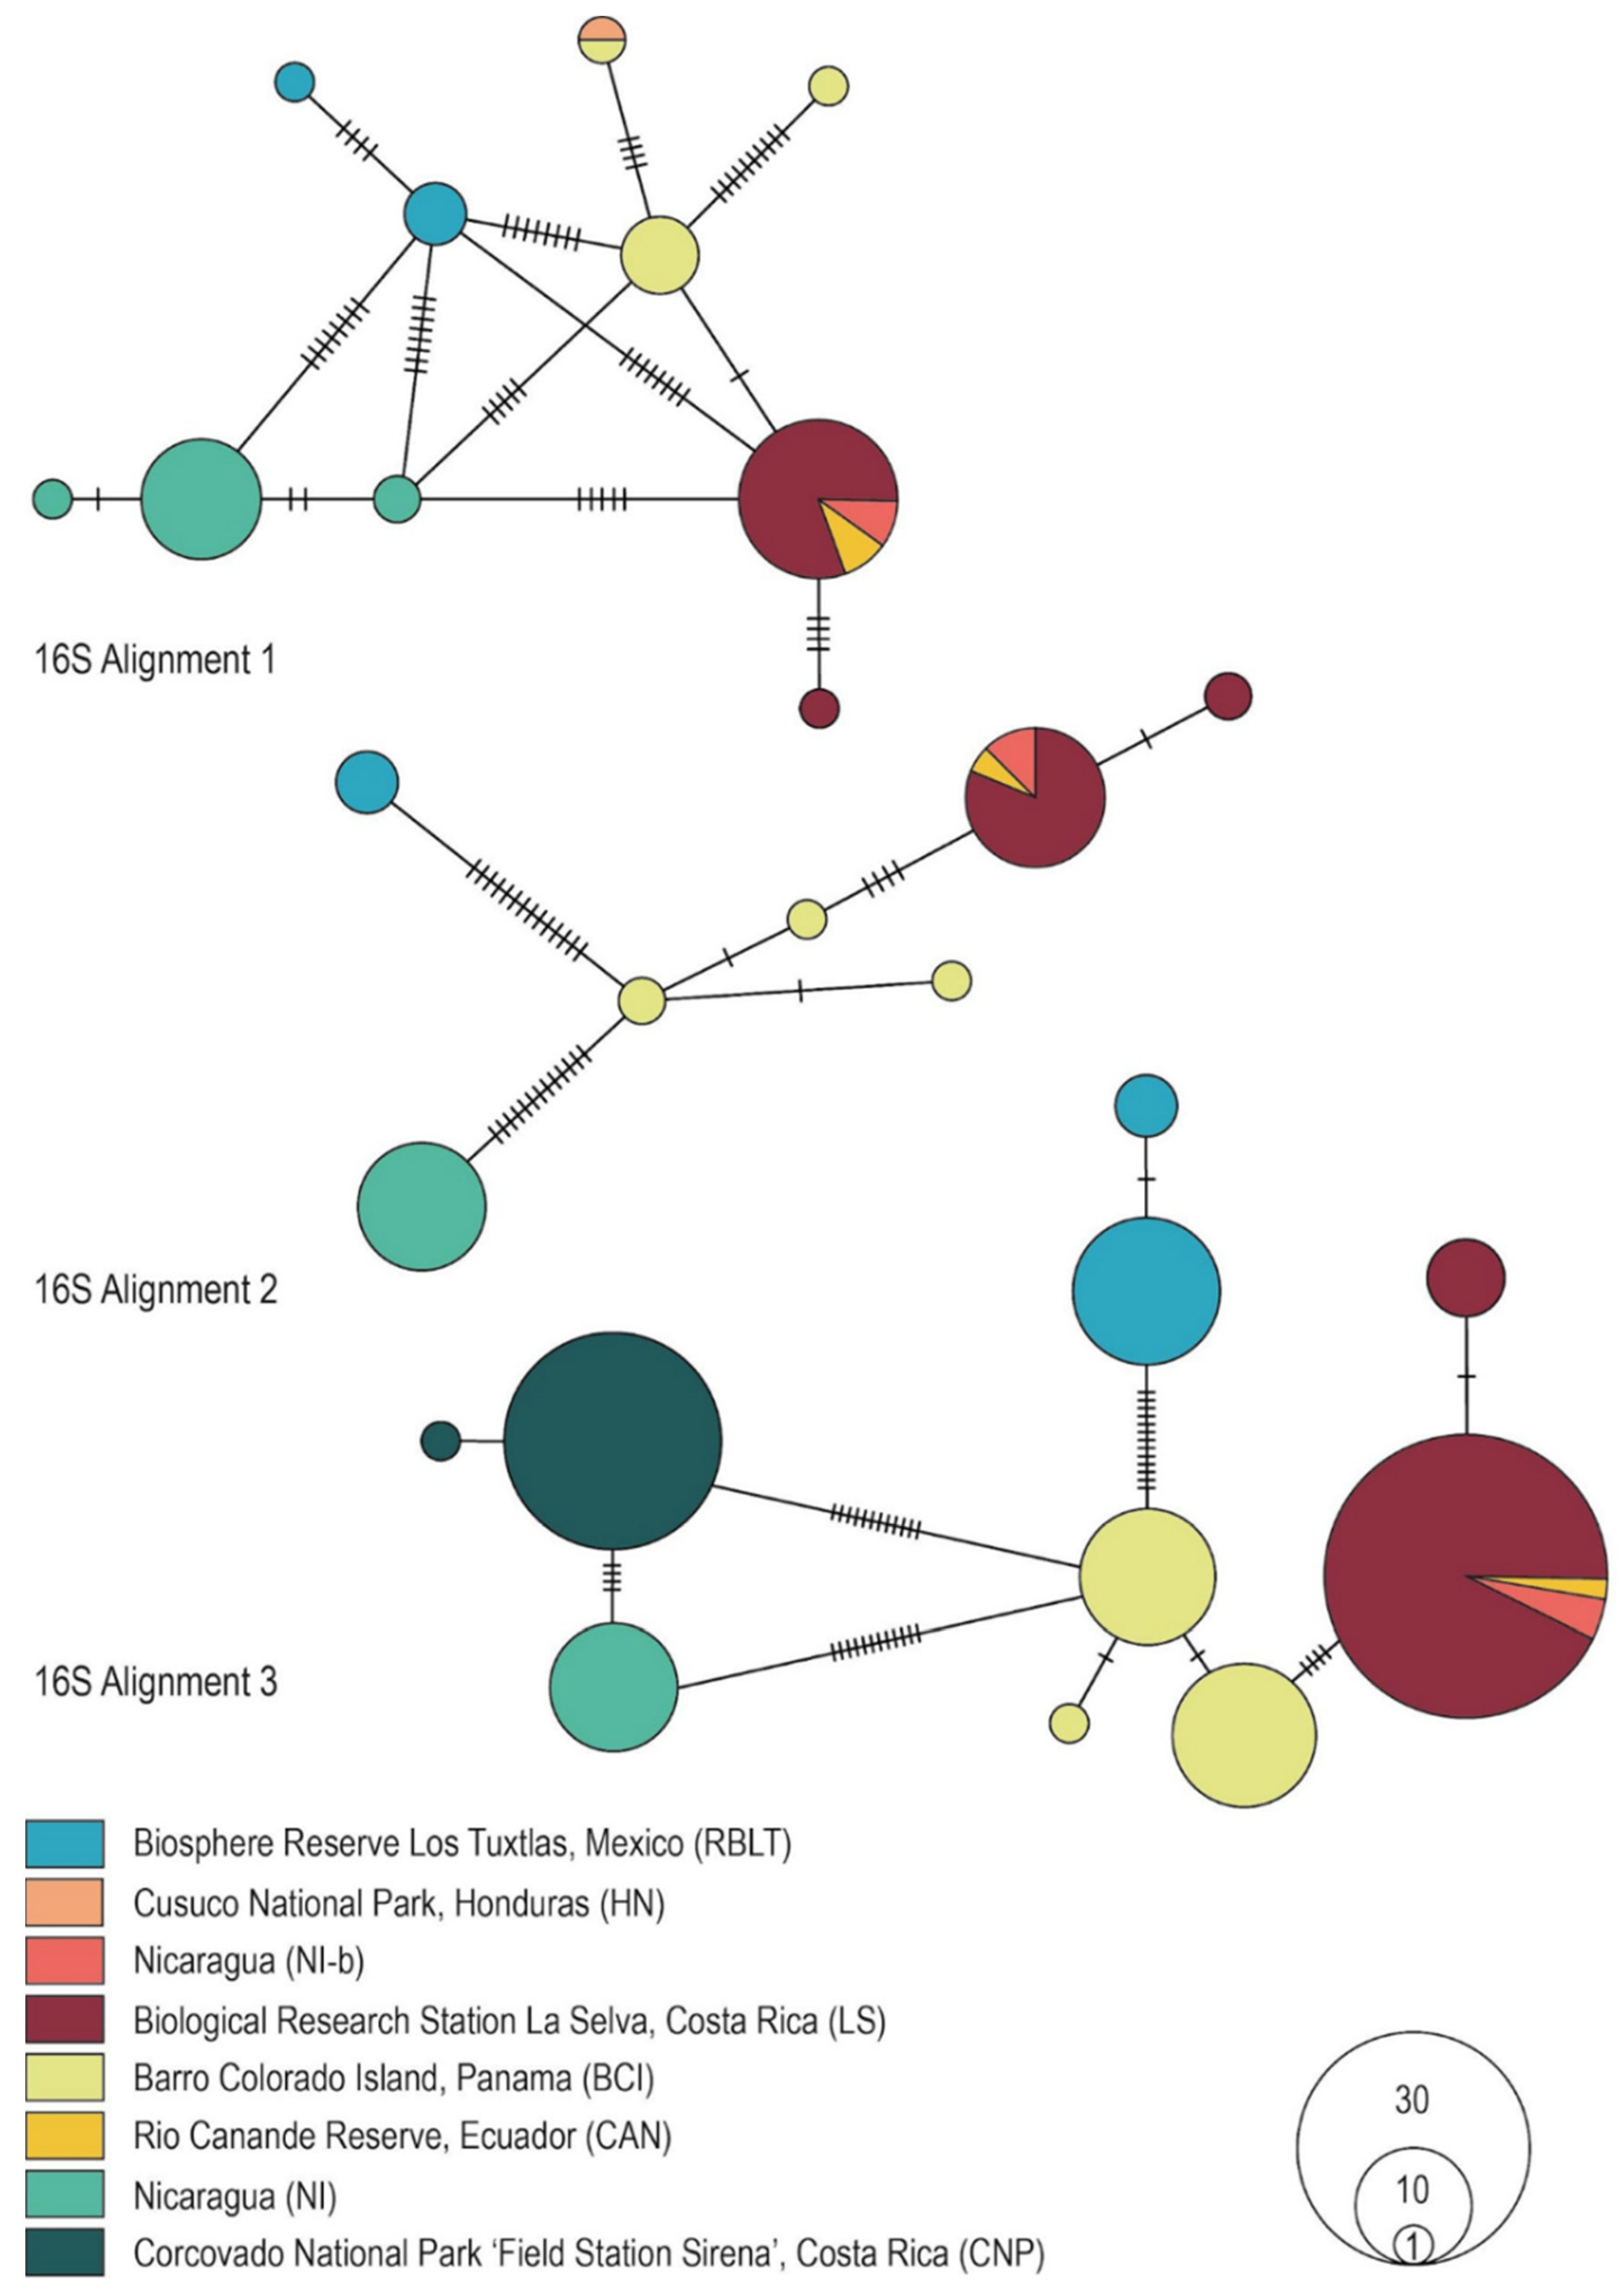
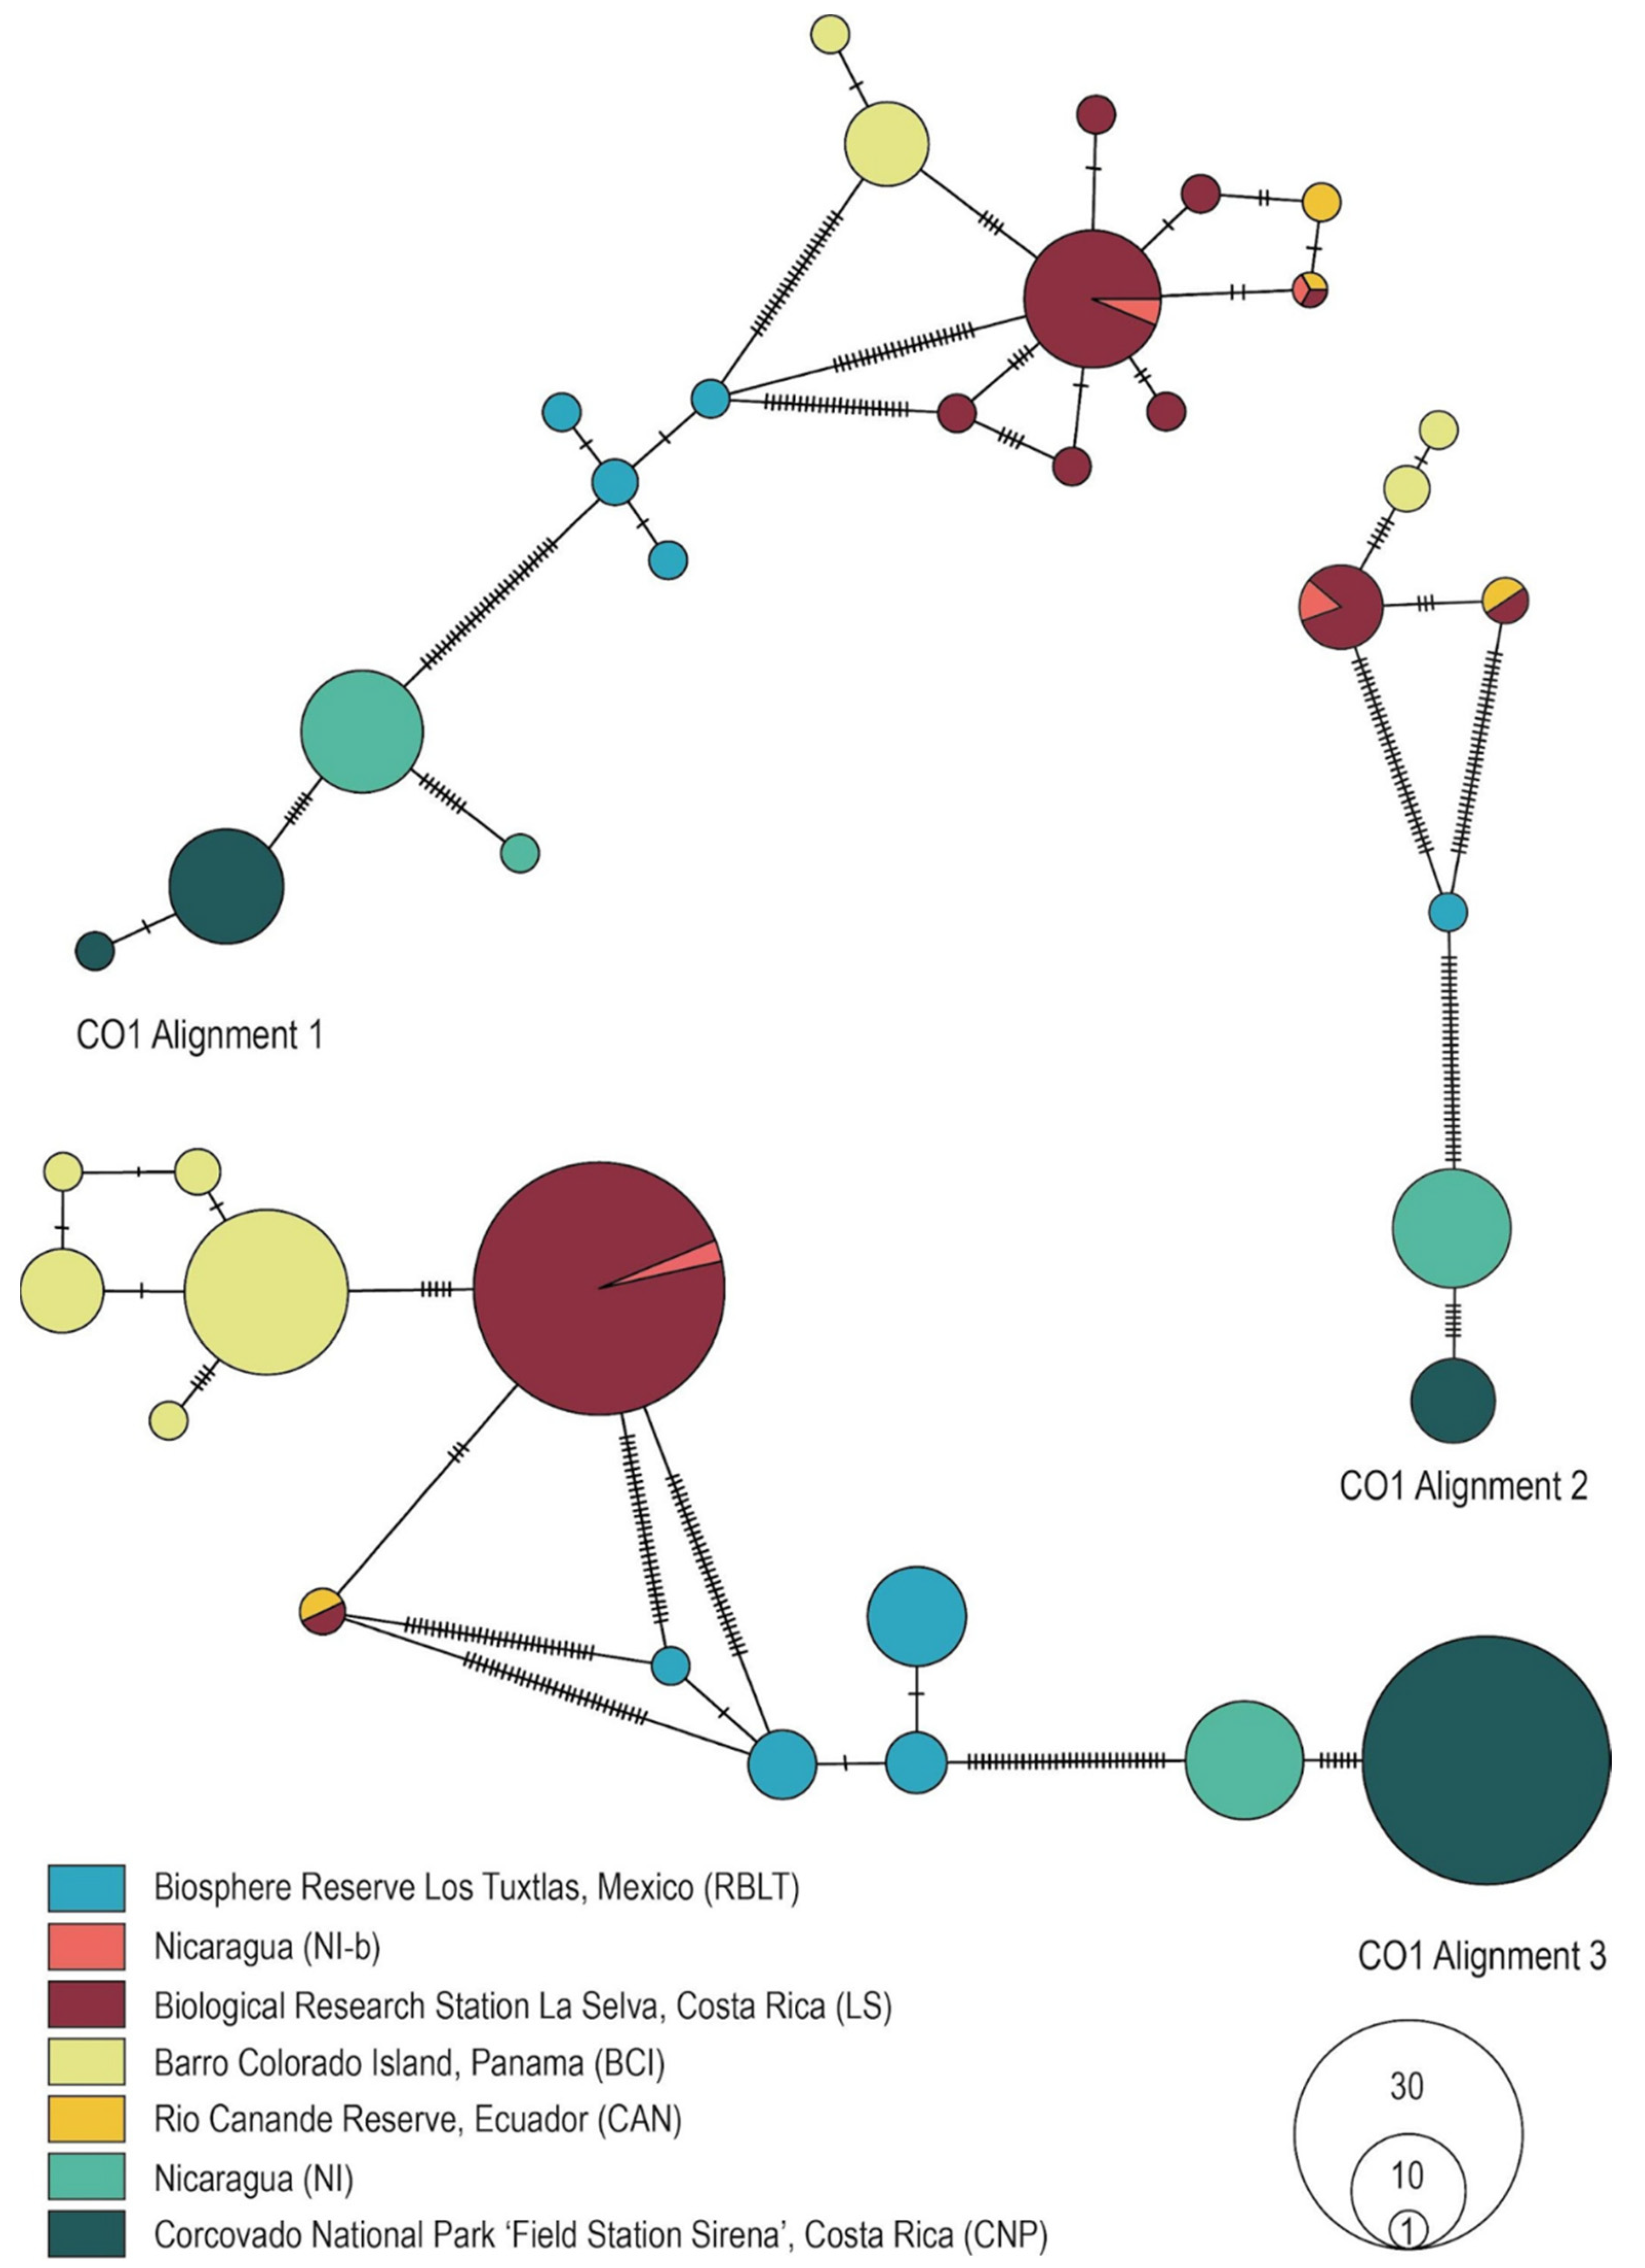
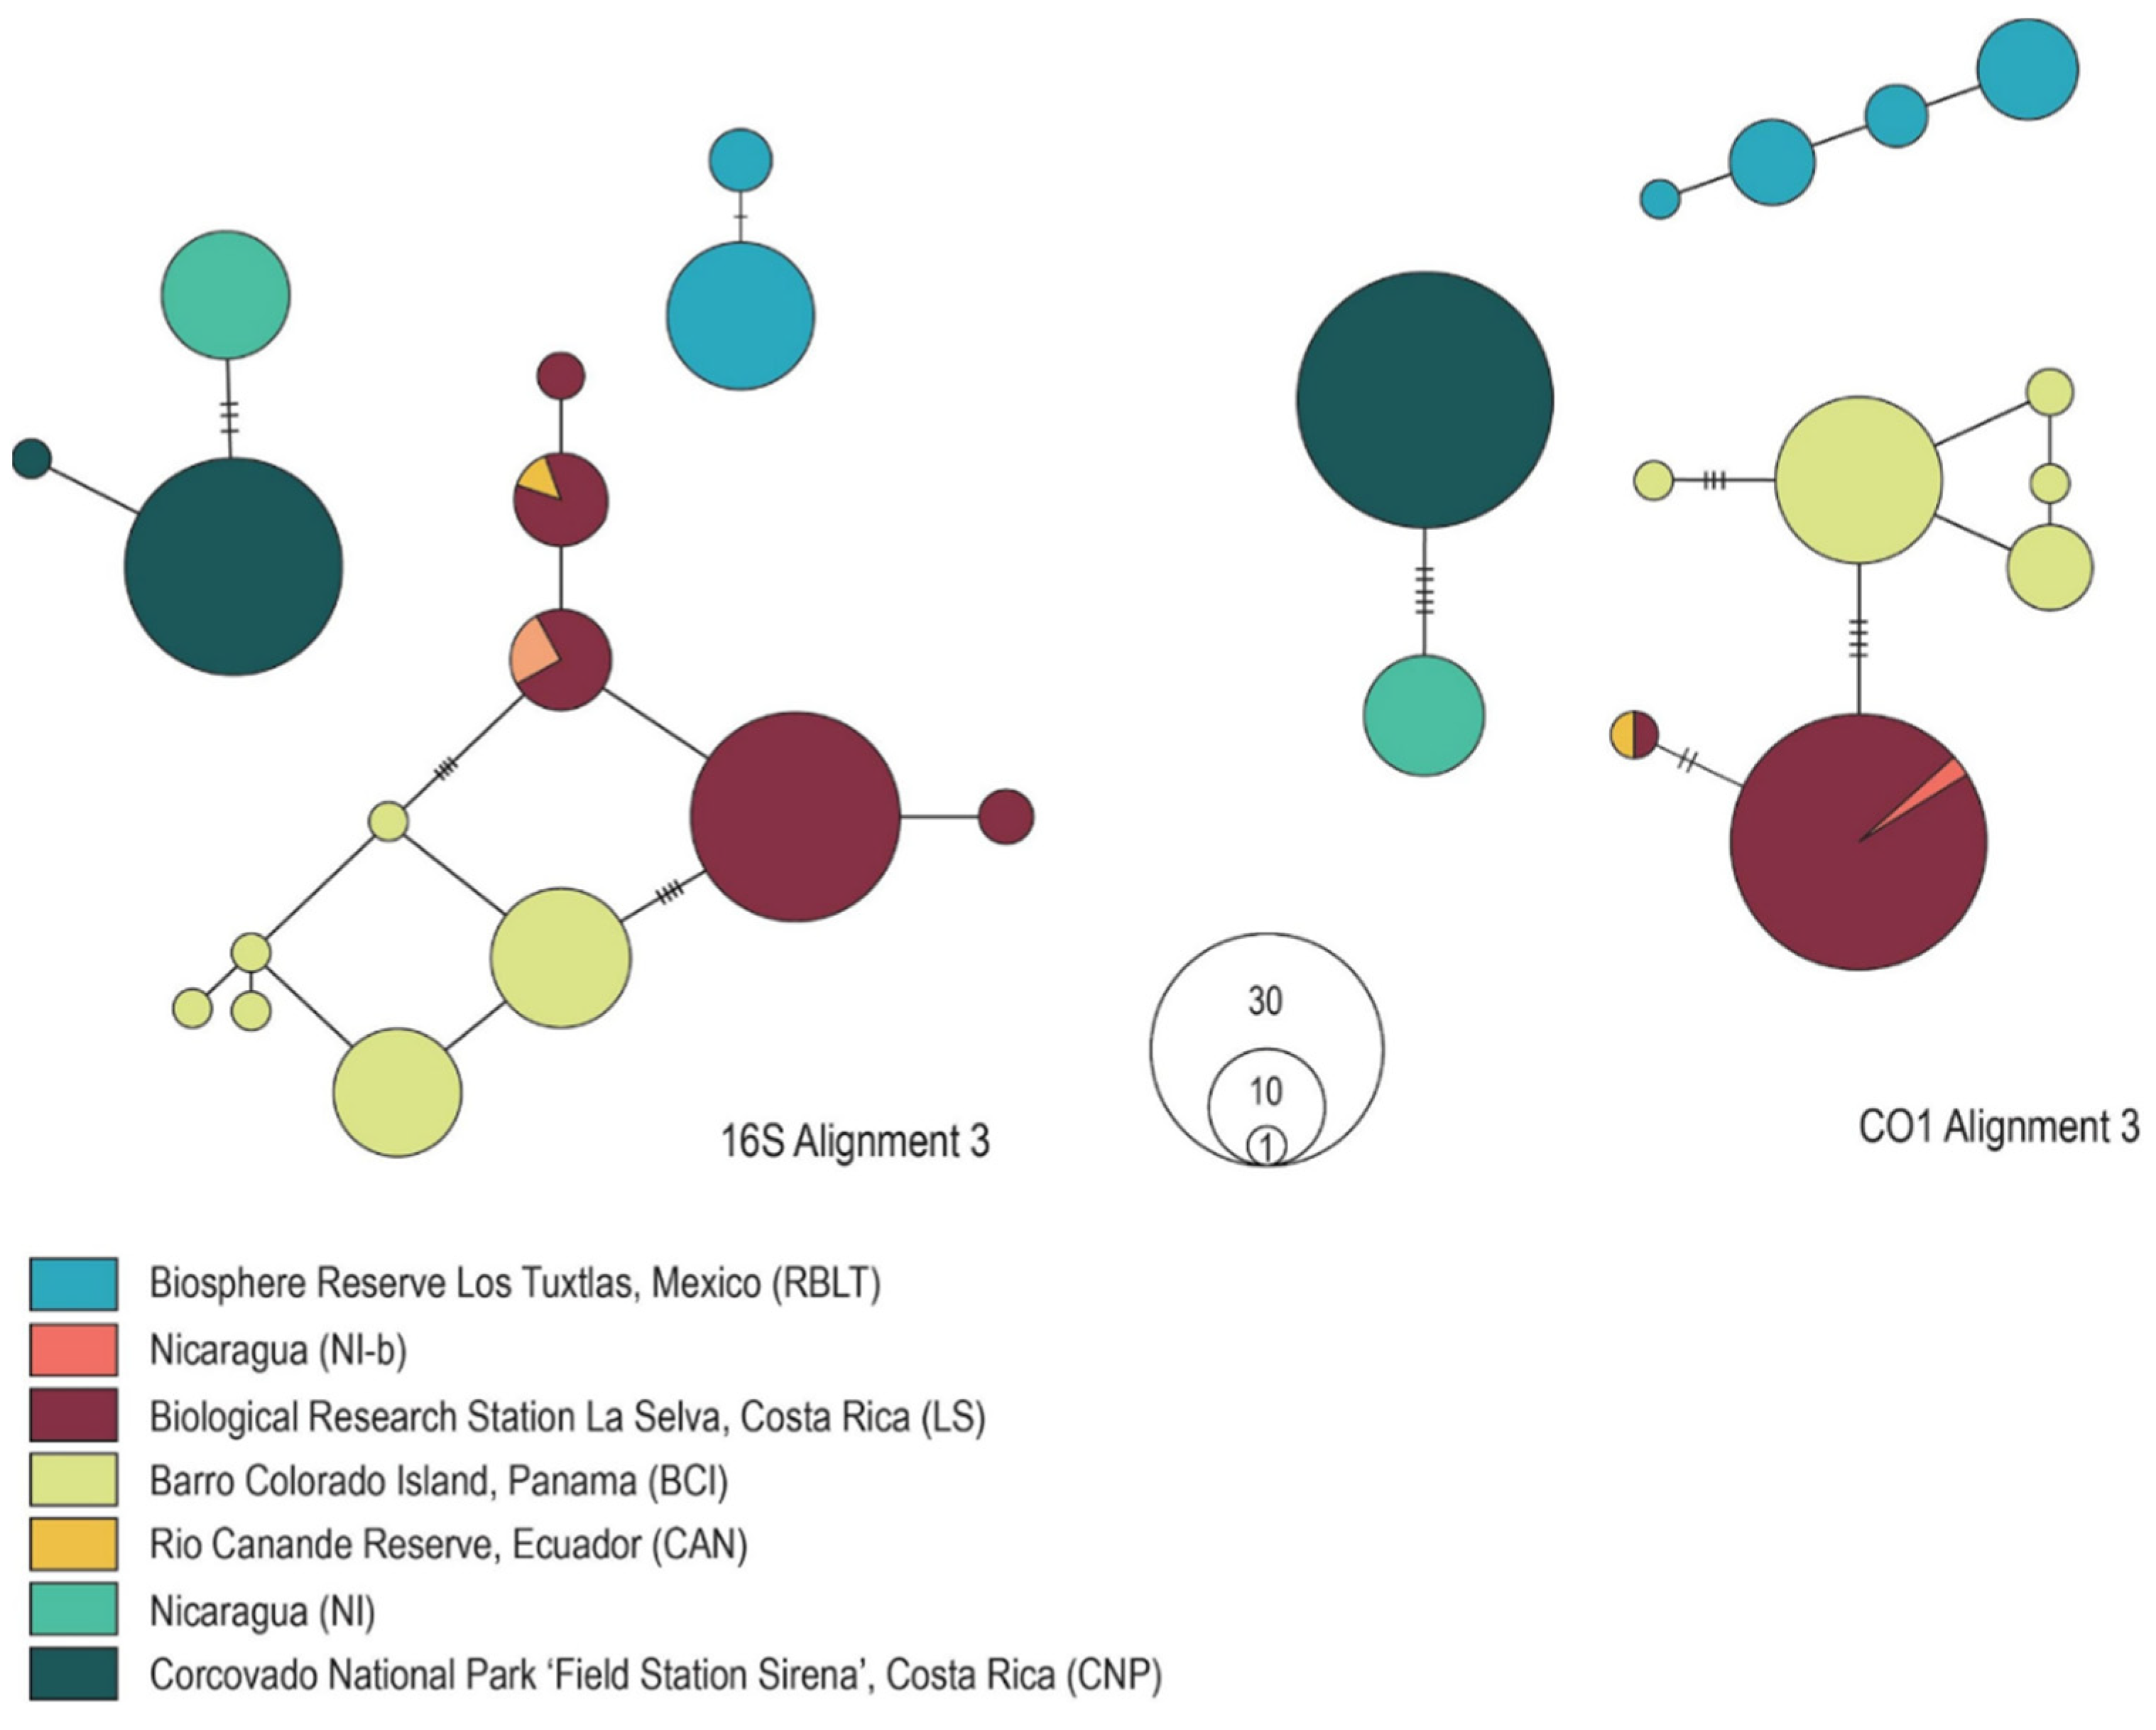
3.3. Genealogical Network Analyses

The minimum spanning haplotype networks performed in PopArt [35] show for all alignments three distinct clusters—although less explicit in the 16S and CO1 Alignments 1. The networks reflect the genetic distances precisely (Figure 1 and Figure 2). As the most northern population, samples from Mexico (RBLT) comprise the first group. The second cluster again contains the CNP population (Costa Rica) and NI population (Nicaragua). The third cluster includes the populations from Nicaragua (NI-b), Costa Rica (LS), Panama (BCI) and Ecuador (CAN). Unfortunately, PopArt [35] does not include a “cut-off connection limit”, as in the statistical parsimony approach (TCS analysis). The latter defines, depending on previously set similarity levels, either connected or separated haplotypes. TCS analyses [36] using a 95% connection limit also showed that haplotypes split into three distinct networks. Unfortunately, the TCS analysis was not possible for the CO1 Alignment 1. However, a split into three distinct clusters was obtained in the Alignments 2 (results shown for Alignments 3 in Figure 3, and results for the 16S rDNA Alignments 1 and 2, as well as CO1 Alignment 2 are shown in Figure S3, File S7). It supports the genetic sub-structuring demonstrated in Study-B.
Comparing haplotype networks for the Alignments 1 shown in the present study and the original networks from Study-A reveals a somewhat similar genealogical structure for 16S rDNA (cf. [15] and Figure 1). However, the close relatedness between CNP and NI-b from Study-A could not be confirmed here, as NI-b appears closely related to LS. In contrast, a different pattern was observed for CO1. While Study-A obtained only five haplotypes, we found 18 haplotypes in the present network (cf. [15] and Figure 2), a surprising result that cannot be explained by editing the alignments but is now in accordance with the more conserved 16S rDNA marker gene.
Finally, the AMOVA analyses of the different Alignments are in accordance with the previous results, although for the Alignment 1 the AMOVA could be performed only for the 16S rDNA dataset. For 16S rDNA in the no-grouping setting, the percentage of variation among groups was higher in Alignment 2 and 3 than in Alignment 1, whereas a high variation within groups was found in Alignment 1. However, significant differentiation between populations was observed in all three alignments, with ΦST values close to one. Taking the three groups into account, the highest level of variation was explained among groups while the variation among populations within groups was substantially lower, and significant differentiation among regions and among populations within regions was observed (Table S3a,b). For CO1, the results are very similar for Alignments 2 and 3: a significant differentiation among populations (ΦST values close to 1) was obtained in the no-grouping setting, and the highest variation is found among groups.

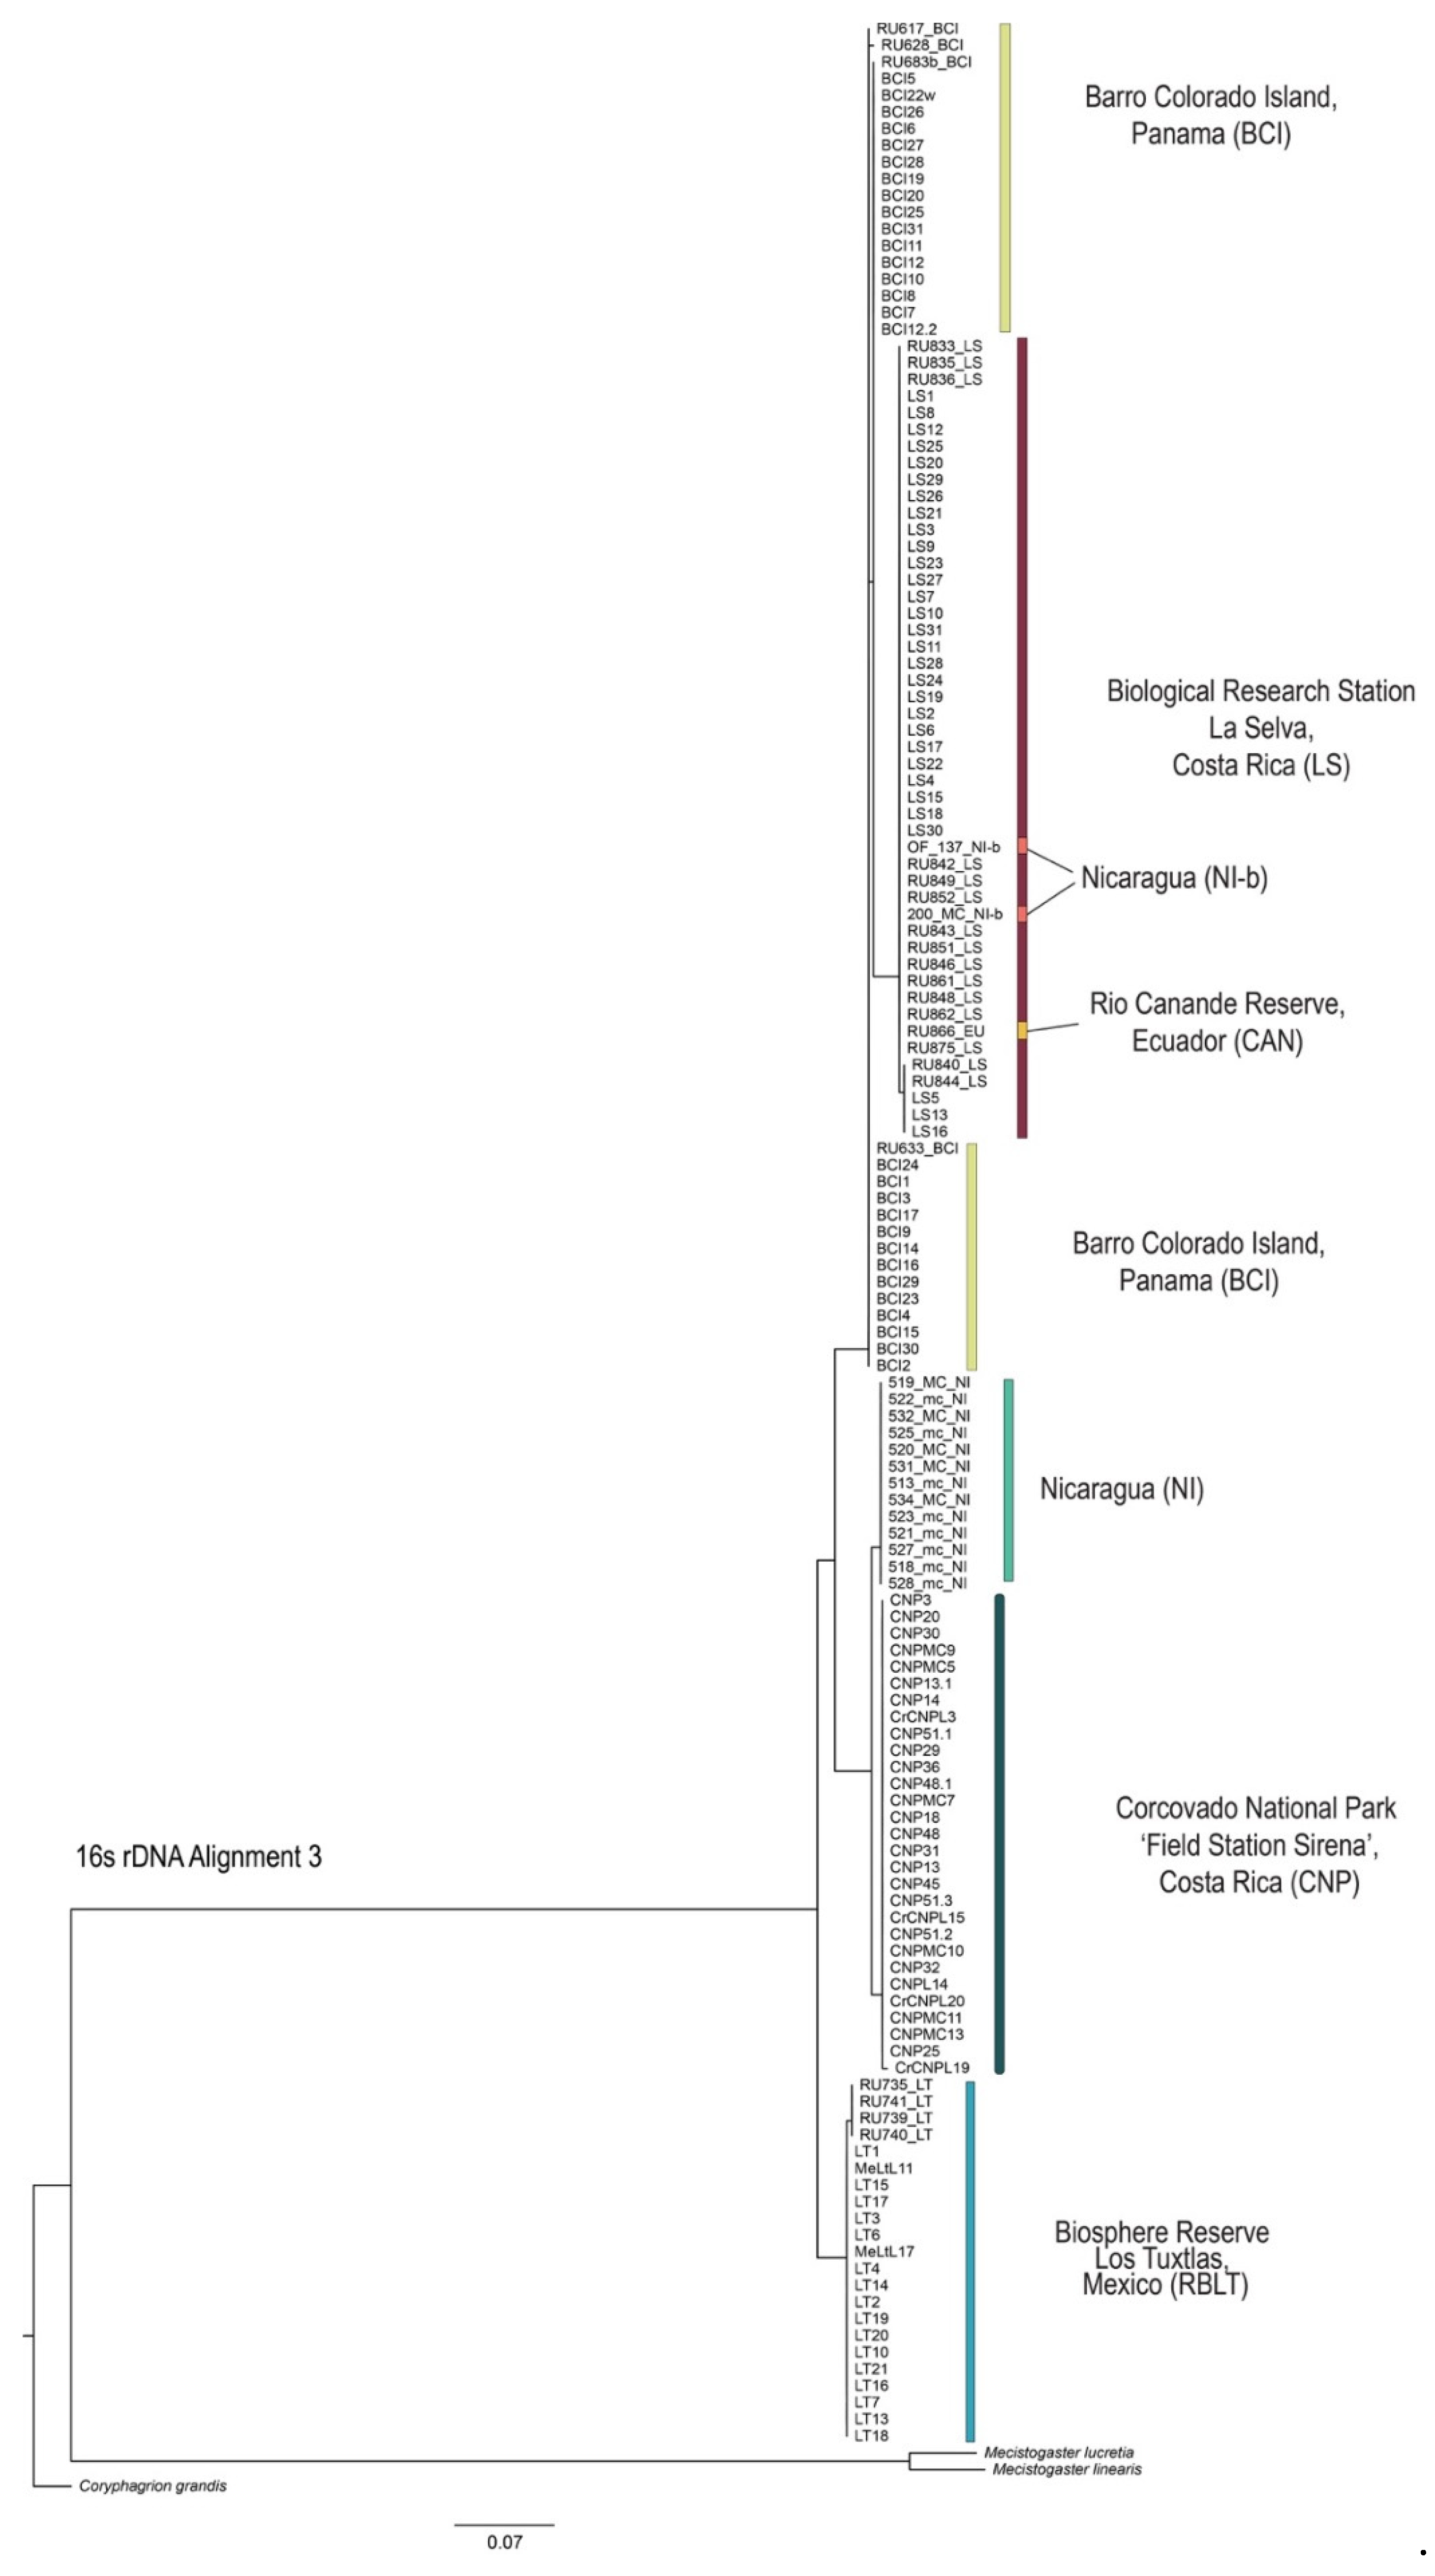
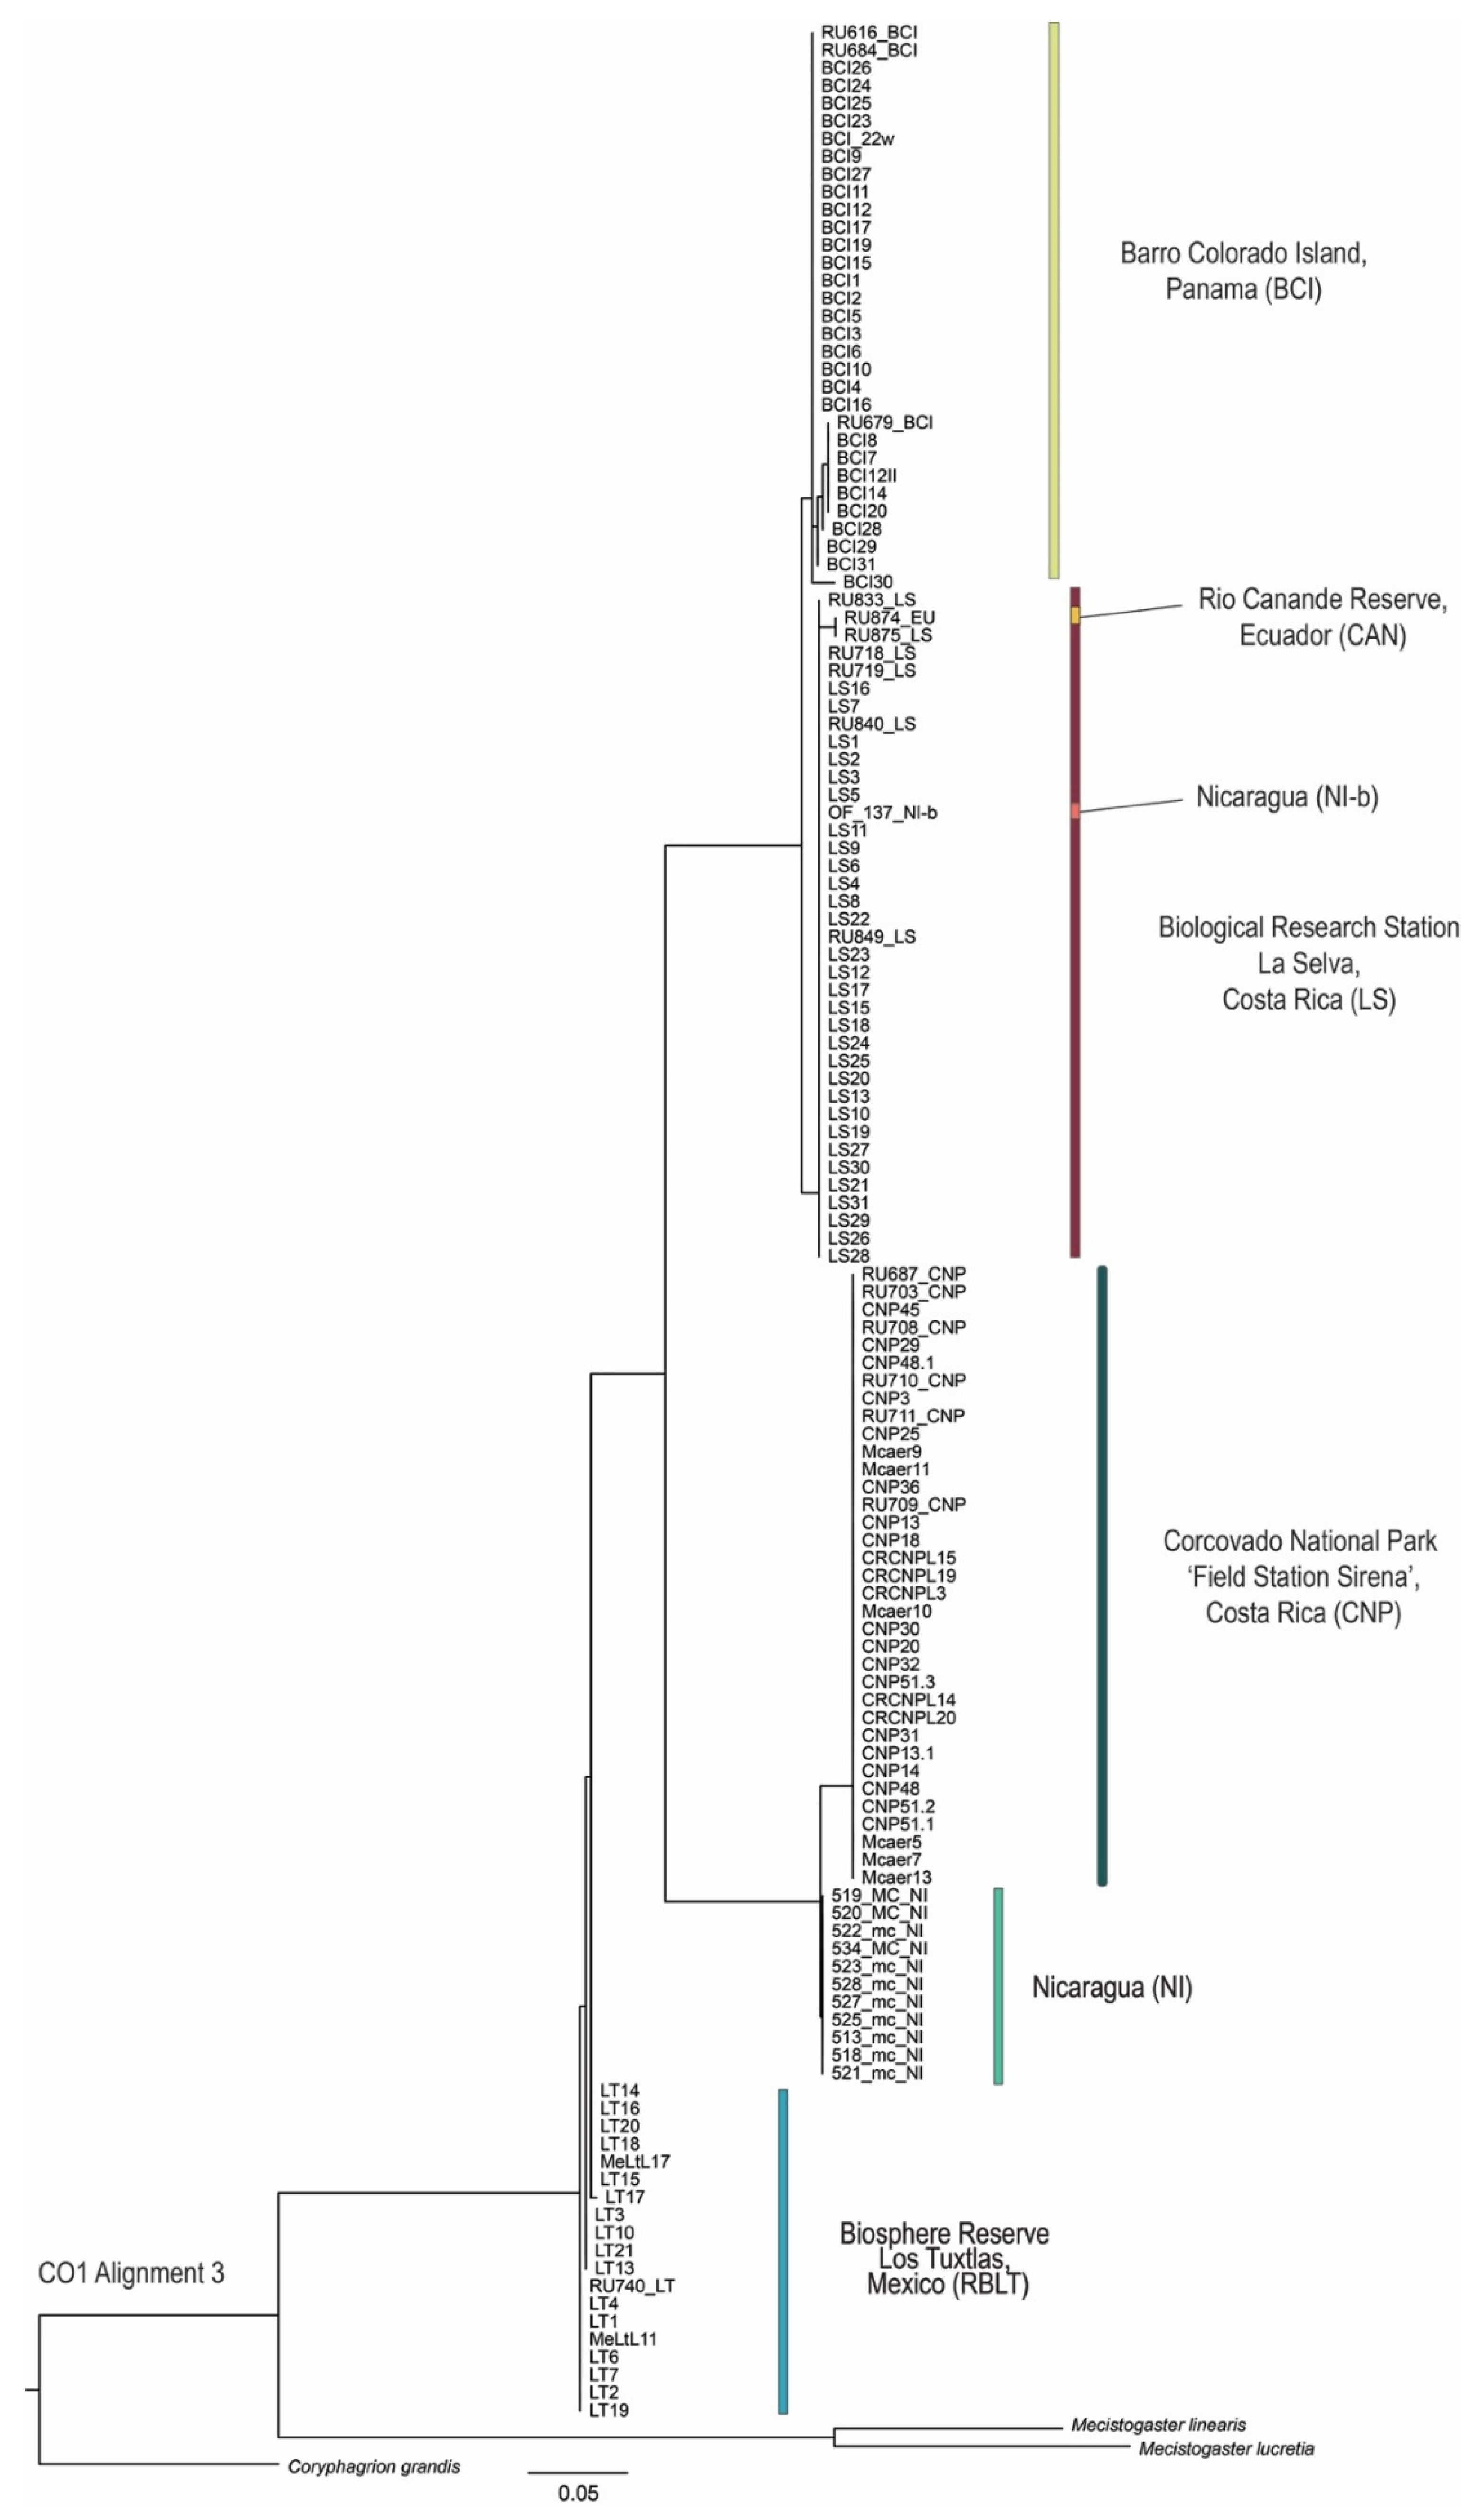
3.4. Phylogenetic Tree Reconstruction

For the phylogenetic tree reconstruction with IQ-TREE [42], ModelFinder identified TIM3+F+I for 16S rDNA and TN+F+G4 for CO1 as the best-fit substitution models. The resulting phylogenetic trees from all three different tree calculations show similar results for both sequence markers with strong support for most nodes (Figure 4 and Figure 5, MP and BI trees are shown in Figures S4–S7, File S7). The topologies show three main clades corresponding to the haplotype networks with RBLT as one clade, LS, BCI, NI and CAN as the second clade, and CNP and NI-b as the third clade. Here, it becomes obvious that individuals from one population are clustering together regardless of the origin of genetic samples—either Study A or B. This result shows a discrepancy with the phylogeny obtained in Study-A. Here, the two CNP datasets (one from Study-A and a second from Study-B) appeared as sister clades. Furthermore, the Study-B samples from CNP, LS and RBLT did not align well into the tree topology, appearing as separate sub-clades.

4. Discussion

Contemporary biodiversity research covers an enormous area, from cellular processes to species level and global ecology research. Evolutionary genetics can principally bridge the different levels of observation but unfortunately we have very few model systems available for doing so [48]. Odonata (dragonflies and damselflies) have been long established and prominent model systems in ecological and evolutionary research and are promising candidates for bridging some gaps. Odonates have revolutionized studies of sexual selection and fitness correlates by using genetic markers [49,50,51]. Despite this head start, the multitude of new comparative NGS genomic approaches for “next generation” ecological and biodiversity studies has not yet entered odonate research and most genetic studies in odonates still rely on single DNA marker genes mostly generated by Sanger sequencing.
Single DNA sequence markers are still highly valuable for the fast evaluation of biodiversity patterns, and for species delimitation and species identification studies, via character-based barcoding approaches [4,5,52,53]. Here, the quality of sequence data is crucial. Consequently, when applying Sanger sequencing, comprehensive and strict sequence evaluation methods and alignment approaches are a conditio sine qua non for reliable data analyses.
The quality of sequence data depends on many factors and mistakes can occur in any step from specimen collection to final data interpretation. As an example, for resolving taxonomic questions in Odonata by means of DNA barcoding, two main pitfalls have been described: (i) inaccuracies in the identification of voucher specimens and (ii) sequencing errors [54,55]. A recent publication showed that sequences deposited at GenBank described as Odonata specimens were actually dipteran DNA [55]. In another example, Lorenzo-Carballa et al. identified in a molecular revision of Ischnura aurora questionable DNA sequences [56]. Odonates are a good example for false molecular data interpretation in non-model organisms but clearly not the only one [57,58].
There is a multitude of reasons for sequencing errors, also for Sanger sequencing, which is generally characterized by a high correctness [59]. Probable causes include remaining primer dimers in the cycle-sequencing product, editing errors (including miss-called nucleotides), (cross-) contamination with DNA of other animals [60], and the amplification of pseudogenes (through poor primer design/low primer specificity) [61].
The present study took advantage of two similar datasets to address the historic question of the species status within the damselfly genus Megaloprepus. The two mitochondrial gene datasets revealed contrary genealogical relationships among populations and biogeographical clusters, with obvious consequences for species delimitation and the determination of conservation management units. Megaloprepus caerulatus has long been considered as a single species genus. Two studies have changed this status quo: while Feindt et al. [12] “simply” suggested that the genus Megaloprepus consists of more than one species, Fincke et al. [15] assigned subspecies status to three historically described species: M. caerulatus, M. c. brevistigma, M. c. latipennis [10,11]. A new recent study, however, defined four species within the genus Megaloprepus applying quantitative and qualitative morphology and molecular genetics [62]. Here, M. caerulatus, M. brevistigma, and M. latipennis received species status and a new species M. diaboli was described [62]. Such different results have significant consequences for the future conservation of the species, since the number of conservation units is different (one against four). Although Megaloprepus is not listed in the IUCN Red List of Threatened Species, an evaluation of conservation status is much needed. This is because the four Megaloprepus species occur in old grown tropical rainforests, population sizes appear to be small, they breed in tree holes of big old trees, they are sensitive towards heat, and do not cross big light gaps or open areas [9,63]. Neotropical rainforests are under great threat with high forest loss inside and outside protected areas [64], most likely driven by selective logging and therefore increasing edge effects. Those facts in combination clearly underline the need for conservation efforts. If the subspecies status had validity, the distributional range of Megaloprepus caerulatus would be from southern Mexico to Peru. This range, however, is now shared by four species but with local endemics and most likely only few overlapping zones [62]. There is a need for studies focusing on the anthropogenic impact on those species in more detail; however, the negative effects of small, isolated forest habitats with increasing temperatures and selective logging of big trees are apparently severe.
In this study, raw sequences were re-analyzed by applying a conservative alignment approach to highlight the consequences of not eliminating sequence ambiguities. Our strict editing of the original Study-A data reflects in both Alignments 1 (16S rDNA and CO1) the results of Study-B instead of Study-A, showing clear population sub-structuring, similar to the analyses of Alignment 2 and 3. Manual sequence editing demanded a deletion of nearly 30% of the sequences in 16S and more than 50% in CO1 from the original datasets. Sequences containing ambiguous bases must clearly be removed from a dataset to identify haplotypes, address diversity indices, or identify species units with certainty, as in mitochondrial DNA heterozygous loci are not expected. This has been underlined firstly by DnaSP [32], Arlequin 3.5 [39], and TCS vers. 1.13 [36], rejecting the CO1 Alignment 1, and secondly by the our genetic diversity estimates (when sequences are removed from the dataset diversity indices should decrease). Direct comparisons are possible between the 16S Alignment 1 and Alignment 2 in populations with more than one individual, such as BCI and RBLT. Here the number of polymorphic sites (parsimony informative), the number of singleton sites, and the number of haplotypes decreased significantly. Adding the Study-B data did not increase the diversity indices exponentially. This was observed, for example, in the RBLT population in 16S rDNA. In Alignment 2, only one haplotype from four individual sequences was identified, but in Alignment 3, two haplotypes from twenty-two individual sequences were obtained. Similarly, in CO1 from Alignment 2 with six individual sequences for CNP and from Alignment 3 with 35 individual sequences, only one haplotype was detected. The genetic distances within populations behaved similarly when sequences with ambiguities were removed. Leaving in ambiguous characters may lead to a higher haplotype diversity and diluted tree topologies, while strict editing (removal of sequences with unresolved characters and alignment corrections) may have the opposite effect by not detecting some haplotypes. We favor the conservative sequence validation approach, which reduces sample size and sequence length but increases reliability.
The haplotype networks presented in Study-A [15] contrast with all networks obtained in the present study. First, the suggested higher variability of the 16S rDNA gene compared to the CO1 gene fragment could not be confirmed; second, the relatedness of populations contrasts with the phylogeny presented (no clear sub-structuring among populations); and third, the observed mutational steps between populations are smaller than in Study-B. One explanation could be the algorithm used in Study-A, by PopArt [35]. The program masks any columns in the alignment with gaps or ambiguous characters. This way, sequences that are not truly identical become identical after these columns are removed (pers. com. J. Leigh). This effect could have occurred in the 16S rDNA marker because sequence variances between populations were masked through the inserted Ns which are found in the raw dataset.
The fact that in Study-A [15] the CO1 marker appears to evolve more slowly than the more conserved 16S rDNA gene fragment contradicts current knowledge in Odonata [1,18,65]. The protein coding CO1 gene accumulates mutations over time faster than the more conserved ribosomal 16S rDNA [1]. The high number of singleton sites observed within the 16S rDNA Alignment 1 in comparison to the CO1 Alignment 1 and Alignments 2 and 3 could be a reason for the higher variability of the 16S rDNA gene in Study-A. However, different mitochondrial genes perform differently and a given sequence marker is chosen depending on the research question, mutation rates and availability of primers or lab resources [1]. In odonates, for example, CO1 and 16S rDNA are—besides numerous other mitochondrial and nuclear genes—well-established marker genes for population genetic and phylogenetic studies [1,4,5,41,56,57,58,59,66,67,68,69]. The 16S rDNA gene is composed of highly conserved as well as variable regions (helices) [70], but overall shows less variability among groups than CO1. Recently also the nad 2 and the A+T-rich mitochondrial control region have been successfully used for species and population level research in Odonates [1,71] and should be included in future multi-gene approaches.
The haplotype networks and the phylogeny presented here show a clear grouping of all Megaloprepus individuals into three distinct clades with genetic distances at the species level, which supports and confirms the previous results of Feindt et al. [12,62]. The phylogeny of Fincke et al. [15] showed a similar topology, although the authors described a strict separation of the Study-A and Study-B CNP samples in their analyses. Unfortunately, a phylogenetic reconstruction for a concatenated 16S rDNA and CO1 dataset could not be estimated, because rigorous editing of the Study-A datasets did not leave enough specimens with sequences for both genes present. This could have allowed for a better insight into the discrepancies of the CNP population and the different grouping. When building the 16S rDNA Alignment 3 with the combined datasets, a reverse complement had to performed on one fraction of the sequence data to be able to align the two datasets. If comparing different strains of a gene (5′ to 3′ direction vs. 3′ to 5′ direction), gaps in the alignment could cause the observed pattern in Study-A. Alignments can strongly influence tree topologies and reporting alignment building methods in detail makes a study stronger and more comprehensible [65]. These results underline the great need for high-quality data and high scientific standards in data handling.
In the present study, the CO1 sequences from Study-A [15] were flagged as “CO1-like”. GenBank [22] assigns sequences with this label when the open reading frame of a sequence is somehow incomplete and automatic translation is not possible. As mentioned above, simple sequencing errors, (cross-) contamination but also pseudogenes may be responsible for “CO1-like” sequences. A (cross-) contamination could be excluded because during BLAST searches [23] most sections of the sequence except the N bases aligned 95–96% to existing CO1 sequences of the same species and up to 90% to other Odonata species. Pseudogenes are nuclear copies of mitochondrial derived genes (numts [72]) that accumulate mutations over time, disrupting the open reading frames. As genes that moved to the nuclear genome and lost function (non-coding), numts are interrupting phylogenetic analyses simply due to the violation of comparing homologous DNA [61]. Furthermore, when numts are analyzed and compared in population genetic studies, or with the aim of proving cryptic species, sequence comparisons are inconclusive such that faulty high genetic divergences can be obtained [61,73,74]. Only recently has the existence of numts been described in Leucorrhinia species (Odonata) [74]. In the present case, we did not observe stop codons inside the “CO1-like” sequences; rather, N bases were found at different positions inside the sequence. Unfortunately, the chromatograms are not available for exact troubleshooting but—from our perspective—those N bases appear to be sequencing errors from the sequencer itself, or are a result of manual editing (as they were of different lengths: 1–3 N bases in a row). Therefore, we did not further test for pseudogenes. Generally, in the case that editing may become necessary, chromatograms shall be reviewed manually to distinguish sequence quality (e.g., precise single peaks versus double peaks, miss-calls, or non-identifiable peaks) and low-quality chromatograms with unclear base calling should be redone. Data handling and analytical training in molecular evolution using nucleotide sequences are crucial for avoiding low sequence quality being used.
In addition, the availability of high-quality data is critical. Today, GenBank [22] and the Barcode of Life Data Systems (BOLD, [75]) are the main public resources for sequence data. Making sequencing data available belongs to good scientific standards and it should be mandatory for any publishing process, but this does not necessarily tell us about the quality of the data. There should be a greater awareness of this simple fact. Providing the original unedited chromatogram files along with the final data could help researchers to evaluate the data quality.

5. Conclusions

This study highlights the importance of high-quality raw sequence data as a backbone for phylogenetic tree and genealogical network analyses, as well as the use of strict hypothesis-related bioinformatic algorithms. This is especially true when it comes to species delimitation and discovery, which may have a significant impact on conservation management efforts.
Today, four species within the genus Megaloprepus are valid—all with sensitive habitat requirements. Biodiversity measures within the genus are based on the sequence data. However, future research is needed to identify the anthropogenic impact on these species and establish conservation measures.

Supplementary Materials

The following supporting information can be downloaded at: https://www.mdpi.com/article/10.3390/d14121056/s1, File S1: 16S_Alignment1, File S2: CO1_Alignment1, File S3: 16S_Alignment2, File S4: CO1_Alignment2, File S5: 16S_Alignment3, File S6: CO1_Alignment3, File S7: Figure S1. Screenshots of the 16S rDNA Alignment 1 and 16S rDNA Alignment 3. Figure S2. Screenshots of the CO1 Alignment 1 and CO1 Alignment 3. Figure S3. Genealogical relationships among Megaloprepus populations for the 16S rDNA Alignment 1 and 2, and the CO1 Alignment 2 based on statistical parsimony (95% connection limit) in TCS vers. 1.2.1. Figure S4. Phylogeny based on Bayesian inference using MrBayes vers. 3.7 for 16S rDNA Alignment3 the with posterior probabilities shown on the corresponding nodes. Figure S5. Phylogeny based on Bayesian inference using MrBayes vers. 3.7 for CO1 Alignment3 the with posterior probabilities shown on the corresponding nodes. Figure S6. Maximum parsimony tree obtained with PAUP* vers. 4.0b8 for the 16S rDNA Alignment3 with 1000 bootstrap replicates. Figure S7. Maximum parsimony tree obtained with PAUP* vers. 4.0b8 for the CO1 Alignment3 with 1000 bootstrap replicates. Table S1: Overview of species ID’s, sampling localities, and NCBI Accession numbers used for the present study. TableS2: Genetic distances (Kimura 2-parameter (K2P) model) between and within populations of Megaloprepus and as a measure of gene flow between populations the FST-values are shown. Table S3a: AMOVA design and results: for the 16S rDNA sequence marker under different settings (no groupings vs. 3 groups). Table S3b: AMOVA design and results: for the CO1 sequence marker under different settings (no groupings vs. 3 groups1).

Author Contributions

Conceptualization, W.F. and H.H.; formal analysis, data curation, and visualization, W.F.; writing, reviewing, and editing, W.F. and H.H. All authors have read and agreed to the published version of the manuscript.

Funding

This Open Access publication was founded by the Deutsche Forschungsgemeinschaft (DFG, German Research Foundation)—491,094,227 “Open Access Publication Funding” and the University of Veterinary Medicine Hannover, Foundation.

Institutional Review Board Statement

Not applicable.

Data Availability Statement

DNA sequences generated in this study have all been submitted to GenBank (https://www.ncbi.nlm.nih.gov/genbank/). Additional data are available in the supplementary material.

Acknowledgments

We are grateful to Bernd Schierwater for providing helpful comments and four anonymous reviewers for their excellent reviews.

Conflicts of Interest

The authors declare no conflict of interest.

References

  1. Cheng, Y.C.; Chen, M.Y.; Wang, J.F.; Liang, A.P.; Lin, C.P. Some mitochondrial genes perform better for damselfly phylogenetics: Species- and population-level analyses of four complete mitogenomes of Euphaea sibling species. Syst. Entomol. 2018, 43, 702–715. [Google Scholar] [CrossRef]
  2. Damm, S.; Schierwater, B.; Hadrys, H. An integrative approach to species discovery in odonates: From character-based DNA barcoding to ecology. Mol. Ecol. 2010, 19, 3881–3893. [Google Scholar] [CrossRef] [PubMed]
  3. Graham, C.H.; Ron, S.R.; Santos, J.C.; Schneider, C.J.; Moritz, C. Integrating phylogenetics and environmental niche models to explore speciation mechanisms in dendrobatid frogs. Evolution 2004, 58, 1781–1793. [Google Scholar] [CrossRef]
  4. Paknia, O.; Bergmann, T.; Hadrys, H. Some ‘ant’swers: Application of a layered barcode approach to problems in ant taxonomy. Mol. Ecol. Resour. 2015, 15, 1262–1274. [Google Scholar] [CrossRef]
  5. Rach, J.; Bergmann, T.; Paknia, O.; DeSalle, R.; Schierwater, B.; Hadrys, H. The marker choice: Unexpected resolving power of an unexplored CO1 region for layered DNA barcoding approaches. PLoS ONE 2017, 12, e0174842. [Google Scholar] [CrossRef] [Green Version]
  6. Lemmon, A.R.; Brown, J.M.; Stanger-Hall, K.; Lemmon, E.M. The effect of ambiguous data on phylogenetic estimates obtained by maximum likelihood and Bayesian inference. Syst. Biol. 2009, 58, 130–145. [Google Scholar] [CrossRef] [PubMed] [Green Version]
  7. Ogden, T.H.; Rosenberg, M.S. Multiple sequence alignment accuracy and phylogenetic inference. Syst. Biol. 2006, 55, 314–328. [Google Scholar] [CrossRef] [PubMed] [Green Version]
  8. Simon, S.; Blanke, A.; Meusemann, K. Reanalyzing the Palaeoptera problem—The origin of insect flight remains obscure. Arthropod Struct. Dev. 2018, 47, 328–338. [Google Scholar] [CrossRef] [PubMed]
  9. Fincke, O.M. Use of forest and tree species, and dispersal by giant damselflies (Pseudostigmatidae): Their prospects in fragmented forests. In Forest and Dragonflies, 4th WDA International Symposium of Odonatology; Pensoft: Sofia, Bulgaria, 2006; pp. 103–125. [Google Scholar]
  10. Selys, L.E.d. Synopsis des Agrionines. Première Légion—Pseudostigma. Bull. L’académie R. Sci. Lett. Beaux-Arts Belg. 1860, 2, 9–27. [Google Scholar]
  11. Selys, L.E.d. Révision du synopsis des Agrionines, premiére partie comprenant des légions Psuedostigma—Podagrion—Platycnemis et Protoneura. Mémoire Cour. Académie R. Belg. 1886, 38, 233. [Google Scholar]
  12. Feindt, W.; Fincke, O.; Hadrys, H. Still a one species genus? Strong genetic diversification in the world’s largest living odonate, the Neotropical damselfly Megaloprepus caerulatus. Conserv. Genet. 2014, 15, 469–481. [Google Scholar] [CrossRef]
  13. Ris, F. Libellen (Odonata) aus der Region der amerikanischen Kordilleren von Costarica bis Catamarca. Arch. Nat. 1916, 82A, 1–197. [Google Scholar]
  14. Schmidt, E. Odonata nebst Bemerkungen über die Anomisma und Chalcopteryx des Amazonas-Gebiets. In 1941–1942 Beiträge zur Fauna Perus Nach der Ausbeute der Hamburger Südperu Expedition 1936; G. Fischer: Hamburg, German, 1942; Volume 2, pp. 225–276. [Google Scholar]
  15. Fincke, O.M.; Xu, M.; Khazan, E.S.; Wilson, M.; Ware, J.L. Tests of hypotheses for morphological and genetic divergence in Megaloprepus damselflies across Neotropical forests. Biol. J. Linn. Soc. 2018, 125, 844–861. [Google Scholar] [CrossRef]
  16. Damm, S.; Hadrys, H. Trithemis morrisoni sp. nov. and T. palustris sp. nov. from the Okavango and Upper Zambezi Floodplains previously hidden under T. stictica (Odonata: Libellulidae). Int. J. Odonatol. 2009, 12, 131–145. [Google Scholar] [CrossRef]
  17. De Mandal, S.; Chhakchhuak, L.; Gurusubramanian, G.; Kumar, N.S. Mitochondrial markers for identification and phylogenetic studies in insects—A Review. DNA Barcodes 2014, 2, 1–9. [Google Scholar] [CrossRef]
  18. Papadopoulou, A.; Anastasiou, I.; Vogler, A.P. Revisiting the insect mitochondrial molecular clock: The mid-Aegean trench calibration. Mol. Biol. Evol. 2010, 27, 1659–1672. [Google Scholar] [CrossRef] [Green Version]
  19. Nicolas, V.; Schaeffer, B.; Missoup, A.D.; Kennis, J.; Colyn, M.; Denys, C.; Tatard, C.; Cruaud, C.; Laredo, C. Assessment of three mitochondrial genes (16S, Cytb, CO1) for identifying species in the Praomyini tribe (Rodentia: Muridae). PLoS ONE 2012, 7, e36586. [Google Scholar] [CrossRef] [PubMed] [Green Version]
  20. Fujisawa, T.; Vogler, A.P.; Barraclough, T.G. Ecology has contrasting effects on genetic variation within species versus rates of molecular evolution across species in water beetles. Proc. R. Soc. B Biol. Sci. 2015, 282, 20142476. [Google Scholar] [CrossRef] [Green Version]
  21. Shearer, T.; Van Oppen, M.; Romano, S.; Wörheide, G. Slow mitochondrial DNA sequence evolution in the Anthozoa (Cnidaria). Mol. Ecol. 2002, 11, 2475–2487. [Google Scholar] [CrossRef]
  22. Clark, K.; Karsch-Mizrachi, I.; Lipman, D.J.; Ostell, J.; Sayers, E.W. GenBank. Nucleic Acids Res. 2016, 44, D67–D72. [Google Scholar] [CrossRef] [PubMed] [Green Version]
  23. Johnson, M.; Zaretskaya, I.; Raytselis, Y.; Merezhuk, Y.; McGinnis, S.; Madden, T.L. NCBI BLAST: A better web interface. Nucleic Acids Res. 2008, 36, W5–W9. [Google Scholar] [CrossRef]
  24. Ware, J.; May, M.; Kjer, K. Phylogeny of the higher Libelluloidea (Anisoptera: Odonata): An exploration of the most speciose superfamily of dragonflies. Mol. Phylogenetics Evol. 2007, 45, 289–310. [Google Scholar] [CrossRef] [PubMed]
  25. Bergmann, T.; Rach, J.; Damm, S.; DeSalle, R.; Schierwater, B.; Hadrys, H. The potential of distance-based thresholds and character-based DNA barcoding for defining problematic taxonomic entities by CO1 and ND1. Mol. Ecol. Resour. 2013, 13, 1069–1081. [Google Scholar] [CrossRef] [PubMed]
  26. Simon, C.; Frati, F.; Beckenbach, A.; Crespi, B.; Liu, H.; Flook, P. Evolution, weighting, and phylogenetic utility of mitochondrial gene sequences and a compilation of conserved polymerase chain reaction primers. Ann. Entomol. Soc. Am. 1994, 87, 651–701. [Google Scholar] [CrossRef]
  27. Folmer, O.; Black, M.; Hoeh, W.; Lutz, R.; Vrijenhoek, R. DNA primers for amplification of mitochondrial cytochrome c oxidase subunit I from diverse metazoan invertebrates. Mol. Mar. Biol. Biotechnol. 1994, 3, 294–299. [Google Scholar] [PubMed]
  28. Edgar, R.C. MUSCLE: Multiple sequence alignment with high accuracy and high throughput. Nucleic Acids Res. 2004, 32, 1792–1797. [Google Scholar] [CrossRef] [PubMed] [Green Version]
  29. Feindt, W.; Osigus, H.-J.; Herzog, R.; Mason, C.E.; Hadrys, H. The complete mitochondrial genome of the neotropical helicopter damselfly Megaloprepus caerulatus (Odonata: Zygoptera) assembled from next generation sequencing data. Mitochondrial DNA Part B 2016, 1, 497–499. [Google Scholar] [CrossRef] [PubMed] [Green Version]
  30. Swofford, D.L. PAUP * Phylogenetic Analysis Using Parsimony (* and Other Methods). 2002. Available online: http://www2.ib.unicamp.br/profs/sfreis/SistematicaMolecular/Aula09MetodoParcimonia/Leituras/ThePhylogeneticHandbookParcimonia.pdf (accessed on 27 September 2022).
  31. Tamura, K.; Stecher, G.; Kumar, S. MEGA11: Molecular evolutionary genetics analysis version 11. Mol. Biol. Evol. 2021, 38, 3022–3027. [Google Scholar] [CrossRef]
  32. Librado, P.; Rozas, J. DnaSP v5: A software for comprehensive analysis of DNA polymorphism data. Bioinformatics 2009, 25, 1451–1452. [Google Scholar] [CrossRef] [Green Version]
  33. Kumar, S.; Stecher, G.; Tamura, K. MEGA7: Molecular evolutionary genetics analysis version 7.0 for bigger datasets. Mol. Biol. Evol. 2016, 33, 1870–1874. [Google Scholar] [CrossRef] [Green Version]
  34. Kimura, M. A simple method for estimating evolutionary rates of base substitutions through comparative studies of nucleotide sequences. J. Mol. Evol. 1980, 16, 111–120. [Google Scholar] [CrossRef] [PubMed]
  35. Leigh, J.W.; Bryant, D. popart: Full-feature software for haplotype network construction. Methods Ecol. Evol. 2015, 6, 1110–1116. [Google Scholar] [CrossRef]
  36. Clement, M.; Posada, D.; Crandall, K. TCS: A computer program to estimate gene genealogies. Mol. Ecol. 2000, 9, 1657–1660. [Google Scholar] [CrossRef] [PubMed]
  37. Wright, S. Evolution and the Genetics of Populations, Volume 2, The Theory of Gene Frequencies; University of Chicago Press: Chicago, IL, USA, 1969. [Google Scholar]
  38. Excoffier, L.; Smouse, P.E.; Quattro, J.M. Analysis of molecular variance inferred from metric distances among DNA haplotypes: Application to human mitochondrial DNA restriction data. Genetics 1992, 131, 479–491. [Google Scholar] [CrossRef] [PubMed]
  39. Excoffier, L.; Lischer, H.E. Arlequin suite ver 3.5: A new series of programs to perform population genetics analyses under Linux and Windows. Mol. Ecol. Resour. 2010, 10, 564–567. [Google Scholar] [CrossRef] [PubMed]
  40. Groeneveld, L.F.; Clausnitzer, V.; Hadrys, H. Convergent evolution of gigantism in damselflies of Africa and South America? Evidence from nuclear and mitochondrial sequence data. Mol. Phylogenetics Evol. 2007, 42, 339–346. [Google Scholar] [CrossRef] [PubMed]
  41. Toussaint, E.F.; Bybee, S.M.; Erickson, R.J.; Condamine, F.L. Forest giants on different evolutionary branches: Ecomorphological convergence in helicopter damselflies. Evolution 2019, 73, 1045–1054. [Google Scholar] [CrossRef]
  42. Nguyen, L.-T.; Schmidt, H.A.; von Haeseler, A.; Minh, B.Q. IQ-TREE: A fast and effective stochastic algorithm for estimating maximum-likelihood phylogenies. Mol. Biol. Evol. 2014, 32, 268–274. [Google Scholar] [CrossRef]
  43. Kalyaanamoorthy, S.; Minh, B.Q.; Wong, T.K.; von Haeseler, A.; Jermiin, L.S. ModelFinder: Fast model selection for accurate phylogenetic estimates. Nat. Methods 2017, 14, 587. [Google Scholar] [CrossRef] [Green Version]
  44. Hoang, D.T.; Chernomor, O.; Von Haeseler, A.; Minh, B.Q.; Vinh, L.S. UFBoot2: Improving the ultrafast bootstrap approximation. Mol. Biol. Evol. 2017, 35, 518–522. [Google Scholar] [CrossRef] [PubMed]
  45. Ronquist, F.; Huelsenbeck, J.P. MrBayes 3: Bayesian phylogenetic inference under mixed models. Bioinformatics 2003, 19, 1572–1574. [Google Scholar] [CrossRef] [PubMed] [Green Version]
  46. Posada, D. jModelTest: Phylogenetic model averaging. Mol. Biol. Evol. 2008, 25, 1253–1256. [Google Scholar] [CrossRef] [PubMed]
  47. Akaike, H. Information theory and an extension of the maximum likelihood principle. In Selected Papers of Hirotugu Akaike; Springer: Berlin/Heidelberg, Germany, 1998; pp. 199–213. [Google Scholar]
  48. Tautz, D.; Arctander, P.; Minelli, A.; Thomas, R.H.; Vogler, A.P. A plea for DNA taxonomy. Trends Ecol. Evol. 2003, 18, 70–74. [Google Scholar] [CrossRef]
  49. Fincke, O.M.; Hadrys, H. Unpredictable offspring survivorship in the damselfly, Megaloprepus coerulatus, shapes parental behavior, constrains sexual selection, and challenges traditional fitness estimates. Evolution 2001, 55, 762–772. [Google Scholar] [CrossRef] [PubMed]
  50. Hadrys, H.; Wargel, A.; Giere, S.; Kraus, B.; Streit, B. A panel of microsatellite markers to detect and monitor demographic bottlenecks in the riverine dragonfly Orthetrum coerulescens F. Mol. Ecol. Notes 2007, 7, 287–289. [Google Scholar] [CrossRef]
  51. Hadrys, H.; Timm, J.; Streit, B.; Giere, S. A panel of microsatellite markers to study sperm precedence patterns in the emperor dragonfly Anax imperator (Odonata: Anisoptera). Mol. Ecol. Notes 2007, 7, 296–298. [Google Scholar] [CrossRef]
  52. DeSalle, R.; Schierwater, B.; Hadrys, H. MtDNA: The small workhorse of evolutionary studies. Front. Biosci.-Landmark 2017, 22, 873–887. [Google Scholar] [CrossRef] [PubMed] [Green Version]
  53. Koroiva, R.; Pepinelli, M.; Rodrigues, M.E.; de Oliveira Roque, F.; Lorenz-Lemke, A.P.; Kvist, S. DNA barcoding of odonates from the Upper Plata basin: Database creation and genetic diversity estimation. PLoS ONE 2017, 12, e0182283. [Google Scholar] [CrossRef] [Green Version]
  54. Koroiva, R.; Kvist, S. Estimating the barcoding gap in a global dataset of cox1 sequences for Odonata: Close, but no cigar. Mitochondrial DNA Part A 2018, 29, 765–771. [Google Scholar] [CrossRef]
  55. Vega-Sánchez, Y.M.; Lorenzo-Carballa, M.O.; Vilela, D.S.; Guillermo-Ferreira, R.; Koroiva, R. Comment on “Molecular identification of seven new Zygopteran genera from South China through partial cytochrome oxidase subunit I (COI) gene”. Meta Gene 2020, 25, 100759. [Google Scholar] [CrossRef]
  56. Lorenzo-Carballa, M.O.; Sanmartín-Villar, I.; Cordero-Rivera, A. Molecular and Morphological Analyses Support Different Taxonomic Units for Asian and Australo-Pacific Forms of Ischnura aurora (Odonata, Coenagrionidae). Diversity 2022, 14, 606. [Google Scholar] [CrossRef]
  57. Meiklejohn, K.A.; Damaso, N.; Robertson, J.M. Assessment of BOLD and GenBank—Their accuracy and reliability for the identification of biological materials. PLoS ONE 2019, 14, e0217084. [Google Scholar] [CrossRef] [Green Version]
  58. Arabi, J.; Cruaud, C.; Couloux, A.; Hassanin, A. Studying sources of incongruence in arthropod molecular phylogenies: Sea spiders (Pycnogonida) as a case study. Comptes Rendus Biol. 2010, 333, 438–453. [Google Scholar] [CrossRef] [PubMed]
  59. Goodwin, S.; McPherson, J.D.; McCombie, W.R. Coming of age: Ten years of next-generation sequencing technologies. Nat. Rev. Genet. 2016, 17, 333. [Google Scholar] [CrossRef]
  60. Wilson, C.G.; Nowell, R.W.; Barraclough, T.G. Cross-contamination explains “inter and intraspecific horizontal genetic transfers” between asexual bdelloid rotifers. Curr. Biol. 2018, 28, 2436–2444.e2414. [Google Scholar] [CrossRef] [Green Version]
  61. Buhay, J.E. “COI-like” sequences are becoming problematic in molecular systematic and DNA barcoding studies. J. Crustac. Biol. 2009, 29, 96–110. [Google Scholar] [CrossRef]
  62. Feindt, W.; Hadrys, H. The damselfly genus Megaloprepus (Odonata: Pseudostigmatidae): Revalidation and delimitation of species-level taxa including the description of one new species. Zootaxa 2022, 5115, 487–510. [Google Scholar] [CrossRef] [PubMed]
  63. Khazan, E.S. Tests of biological corridor efficacy for conservation of a Neotropical giant damselfly. Biol. Conserv. 2014, 177, 117–125. [Google Scholar] [CrossRef]
  64. Hansen, M.C.; Wang, L.; Song, X.-P.; Tyukavina, A.; Turubanova, S.; Potapov, P.V.; Stehman, S.V. The fate of tropical forest fragments. Sci. Adv. 2020, 6, eaax8574. [Google Scholar] [CrossRef] [PubMed] [Green Version]
  65. Brower, A.V.; Desalle, R. Practical and theoretical considerations for choice of a DNA sequence region in insect molecular systematics, with a short review of published studies using nuclear gene regions. Ann. Entomol. Soc. Am. 1994, 87, 702–716. [Google Scholar] [CrossRef]
  66. Damm, S.; Dijkstra, K.-D.B.; Hadrys, H. Red drifters and dark residents: The phylogeny and ecology of a Plio-Pleistocene dragonfly radiation reflects Africa’s changing environment (Odonata, Libellulidae, Trithemis). Mol. Phylogenetics Evol. 2010, 54, 870–882. [Google Scholar] [CrossRef] [PubMed]
  67. Damm, S.; Hadrys, H. A dragonfly in the desert: Genetic pathways of the widespread Trithemis arteriosa (Odonata: Libellulidae) suggest male-biased dispersal. Org. Divers. Evol. 2012, 12, 267–279. [Google Scholar] [CrossRef]
  68. Dijkstra, K.-D.B.; Kalkman, V.J.; Dow, R.A.; Stokvis, F.R.; Van Tol, J. Redefining the damselfly families: A comprehensive molecular phylogeny of Zygoptera (Odonata). Syst. Entomol. 2014, 39, 68–96. [Google Scholar] [CrossRef]
  69. Vega-Sánchez, Y.M.; Mendoza-Cuenca, L.F.; González-Rodríguez, A. Complex evolutionary history of the American Rubyspot damselfly, Hetaerina americana (Odonata): Evidence of cryptic speciation. Mol. Phylogenetics Evol. 2019, 139, 106536. [Google Scholar] [CrossRef] [PubMed]
  70. Misof, B.; Anderson, C.; Buckley, T.; Erpenbeck, D.; Rickert, A.; Misof, K. An empirical analysis of mt 16S rRNA covarion-like evolution in insects: Site-specific rate variation is clustered and frequently detected. J. Mol. Evol. 2002, 55, 460–469. [Google Scholar] [CrossRef]
  71. Bronstein, O.; Kroh, A.; Haring, E. Mind the gap! The mitochondrial control region and its power as a phylogenetic marker in echinoids. BMC Evol. Biol. 2018, 18, 80. [Google Scholar] [CrossRef] [PubMed] [Green Version]
  72. Lopez, J.V.; Yuhki, N.; Masuda, R.; Modi, W.; O’Brien, S.J. Numt, a recent transfer and tandem amplification of mitochondrial DNA to the nuclear genome of the domestic cat. J. Mol. Evol. 1994, 39, 174–190. [Google Scholar] [CrossRef]
  73. Song, H.; Buhay, J.E.; Whiting, M.F.; Crandall, K.A. Many species in one: DNA barcoding overestimates the number of species when nuclear mitochondrial pseudogenes are coamplified. Proc. Natl. Acad. Sci. USA 2008, 105, 13486–13491. [Google Scholar] [CrossRef] [PubMed] [Green Version]
  74. Ožana, S.; Dolný, A.; Pánek, T. Nuclear copies of mitochondrial DNA as a potential problem for phylogenetic and population genetic studies of Odonata. Syst. Entomol. 2022, 47, 591–602. [Google Scholar] [CrossRef]
  75. Ratnasingham, S.; Hebert, P.D. BOLD: The Barcode of Life Data System (http://www.barcodinglife.org/). Mol. Ecol. Notes 2007, 7, 355–364. [Google Scholar] [CrossRef]
Figure 1. Minimum spanning haplotype networks showing the genealogical relationships within the genus Megaloprepus for the three different 16S rDNA alignments. POPART vers. 1.7 [35] was used to build the networks. Populations are color-coded in accordance with their origin.
Diversity 14 01056 g001
Figure 2. Minimum spanning haplotype networks showing the genealogical relationships within the genus Megaloprepus for the three different CO1 alignments. POPART vers. 1.7 [35] was used to build the networks. Populations are color-coded in accordance with their origin.
Diversity 14 01056 g002
Figure 3. Genealogical relationships among Megaloprepus populations for the 16S rDNA Alignment 3 (left) and the CO1 Alignment 3 (right) based on statistical parsimony (95% connection limit) in TCS vers. 1.2.1 [36]. Populations are color-coded according to their origin.
Diversity 14 01056 g003
Figure 4. Phylogeny using the 16S rDNA sequence marker showing the relationships of the different Megaloprepus samples from Study-A and Study-B (Alignment 3) performed via maximum likelihood inference using IQ-TREE [42] with 1000 bootstrap replicates. Coryphagrion grandis, Mecistogaster linearis and Mecistogaster lucretia are outgroups. For the species IDs please compare Table S1. Color codes match with Figure 1, Figure 2 and Figure 3 and are in accordance with the sample origin.
Diversity 14 01056 g004
Figure 5. Phylogeny using the CO1 sequence marker showing the relationships of the different Megaloprepus samples from Study-A and Study-B (Alignment 3) performed via maximum likelihood inference using IQ-TREE [42] with 1000 bootstrap replicates. Coryphagrion grandis, Mecistogaster linearis and Mecistogaster lucretia are outgroups. For the species IDs please compare Table S1. Color codes match with Figure 1, Figure 2 and Figure 3 and are in accordance with the sample origin.
Diversity 14 01056 g005
Table 1. Final number of sequences included in the Alignments 3 per study (A and B), sampling location, and genetic marker.
Sampling LocationCO116S rDNA
N Study-AN Study-BN Study-AN Study-B
Biosphere Reserve Los Tuxtlas, Mexico (RBLT)118418
Cusuco National Park, Honduras (HN)////
Nicaragua * (NI)11/13/
Nicaragua * (NI-b)1/2/
Biological Research Station La Selva, Costa Rica (LS)6301530
Corcovado National Park ‘Field Station Sirena’, Costa Rica (CNP)629/29
Barro Colorado Island, Panama (BCI)329429
Rio Canande Reserve, Ecuador (CAN)1/1/
N total2910639106
* In Nicaragua there are two sampling points: Natural Reserve El Jaguar and Reserve Bartola (belonging to the Biological Reserve Indio Maíz). However, the information about which sequences originate from which sampling locality is missing in Study-A. Here, the populations were labeled NI and NI-b. According to our in-house barcodes, NI-b belongs to Reserve Bartola—Biological Reserve Indio Maíz.
Table 2. Summary statistics for the 16S rDNA gene fragment of Megaloprepus. Shown are N: number of individuals, S: number of polymorphic sites (parsimony informative), H: number of haplotypes, Hd (±SD): haplotype diversity (standard deviation) and π (±SD): nucleotide diversity (standard deviation).
16S rDNA
Population *NSHHd (±SD)π (±SD)
Alignment 1
577 bp
BCI71540.714 (0.181)0.015 (0.007)
RBLT5420.400 (0.237)0.006 (0.003)
LS181140.399 (0.138)0.003 (0.001)
CAN2020.000.00
HN1010.000.00
NI14330.385 (0.149)0.002 (0.003)
NI-b2321.000 (0.500)0.008 (0.006)
Total4929100.759 (0.047)0.021 (0.003)
Alignment 2
325 bp
BCI4230.833 (0.222)0.003 (0.001)
RBLT4010.000.00
LS15120.248 (0.131)0.001 (0.000)
CAN1010.000.00
NI13321.00 (0.250)0.008 (0.000)
NI-b2010.000.00
Total392670.722 (0.047)0.029 (0.002)
Alignment 3
321 bp
BCI33230.544 (0.036)0.002 (0.000)
CNP29120.069 (0.063)0.000 (0.000)
RBLT22120.312 (0.106)0.001 (0.000)
LS45120.202 (0.073)0.001 (0.000)
CAN1010.000.00
NI13010.000.00
NI-b2010.000.00
Total14527100.831 (0.015)0.029 (0.001)
* Sampling localities from north to south are: RBLT (Biosphere Reserve Los Tuxtlas, Veracruz, Mexico), HN (Cusuco National Park, Honduras), NI (El Jaguar reserve, Nicaragua), NI-b Biological Reserve Indio Maíz “Bartola Reserve”, Nicaragua, LS (Biological Research Station La Selva, Costa Rica), CNP (Corcovado National Park “Sirena Field Station”, Costa Rica), BCI (Barro Colorado Island, Panama) and CAN (Rio Canande Reserve, Esmeraldas Province, Ecuador).
Table 3. Summary statistics for the CO1 gene fragment of Megaloprepus. Shown are N: number of individuals, S: number of polymorphic sites (parsimony informative), H: number of haplotypes, Hd (±SD): haplotype diversity (standard deviation) and π (±SD): nucleotide diversity (standard deviation).
CO1
Population *NSHHd (±SD)π (±SD)
Alignment 1 **
419 bp
BCI7////
CNP11////
RBLT5////
LS21////
CAN2////
NI13////
NI-b2////
Total61////
Alignment 2
395 bp
BCI3120.667 (0.314)0.002 (0.001)
CNP6010.000.00
RBLT1010.000.00
LS6320.333 (0.215)0.003 (0.002)
CAN1010.000.00
NI11010.000.00
NI-b1010.000.00
Total295490.786 (0.049)0.052 (0.004)
Alignment 3
395 bp
BCI32650.502 (0.093)0.002 (0.006)
CNP35010.000.00
RBLT19340.713 (0.058)0.003 (0.000)
LS36320.056 (0.052)0.000 (0.000)
CAN1010.000.00
NI11010.000.00
NI-b1010.000.00
Total13559150.826 (0.017)0.055 (0.002)
* Sampling localities from north to south are: RBLT (Biosphere Reserve Los Tuxtlas, Veracruz, Mexico), HN (Cusuco National Park, Honduras), NI (El Jaguar reserve, Nicaragua), NI-b Biological Reserve Indio Maíz “Bartola Reserve”, Nicaragua, LS (Biological Research Station La Selva, Costa Rica), CNP (Corcovado National Park “Sirena Field Station”, Costa Rica), BCI (Barro Colorado Island, Panama) and CAN (Rio Canande Reserve, Esmeraldas Province, Ecuador). ** DnaSp could not analyze CO1 Alignment 1 because of the unidentifiable base content.
Publisher’s Note: MDPI stays neutral with regard to jurisdictional claims in published maps and institutional affiliations.

