
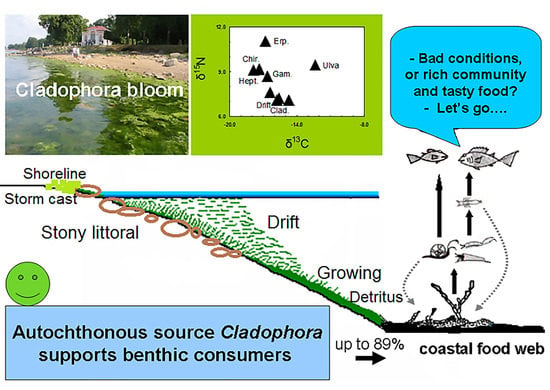
Benthic Invertebrates Abundance and Trophic Links in the Coastal Zone during Cladophora Blooms


Abstract
:
1. Introduction
2. Materials and Methods
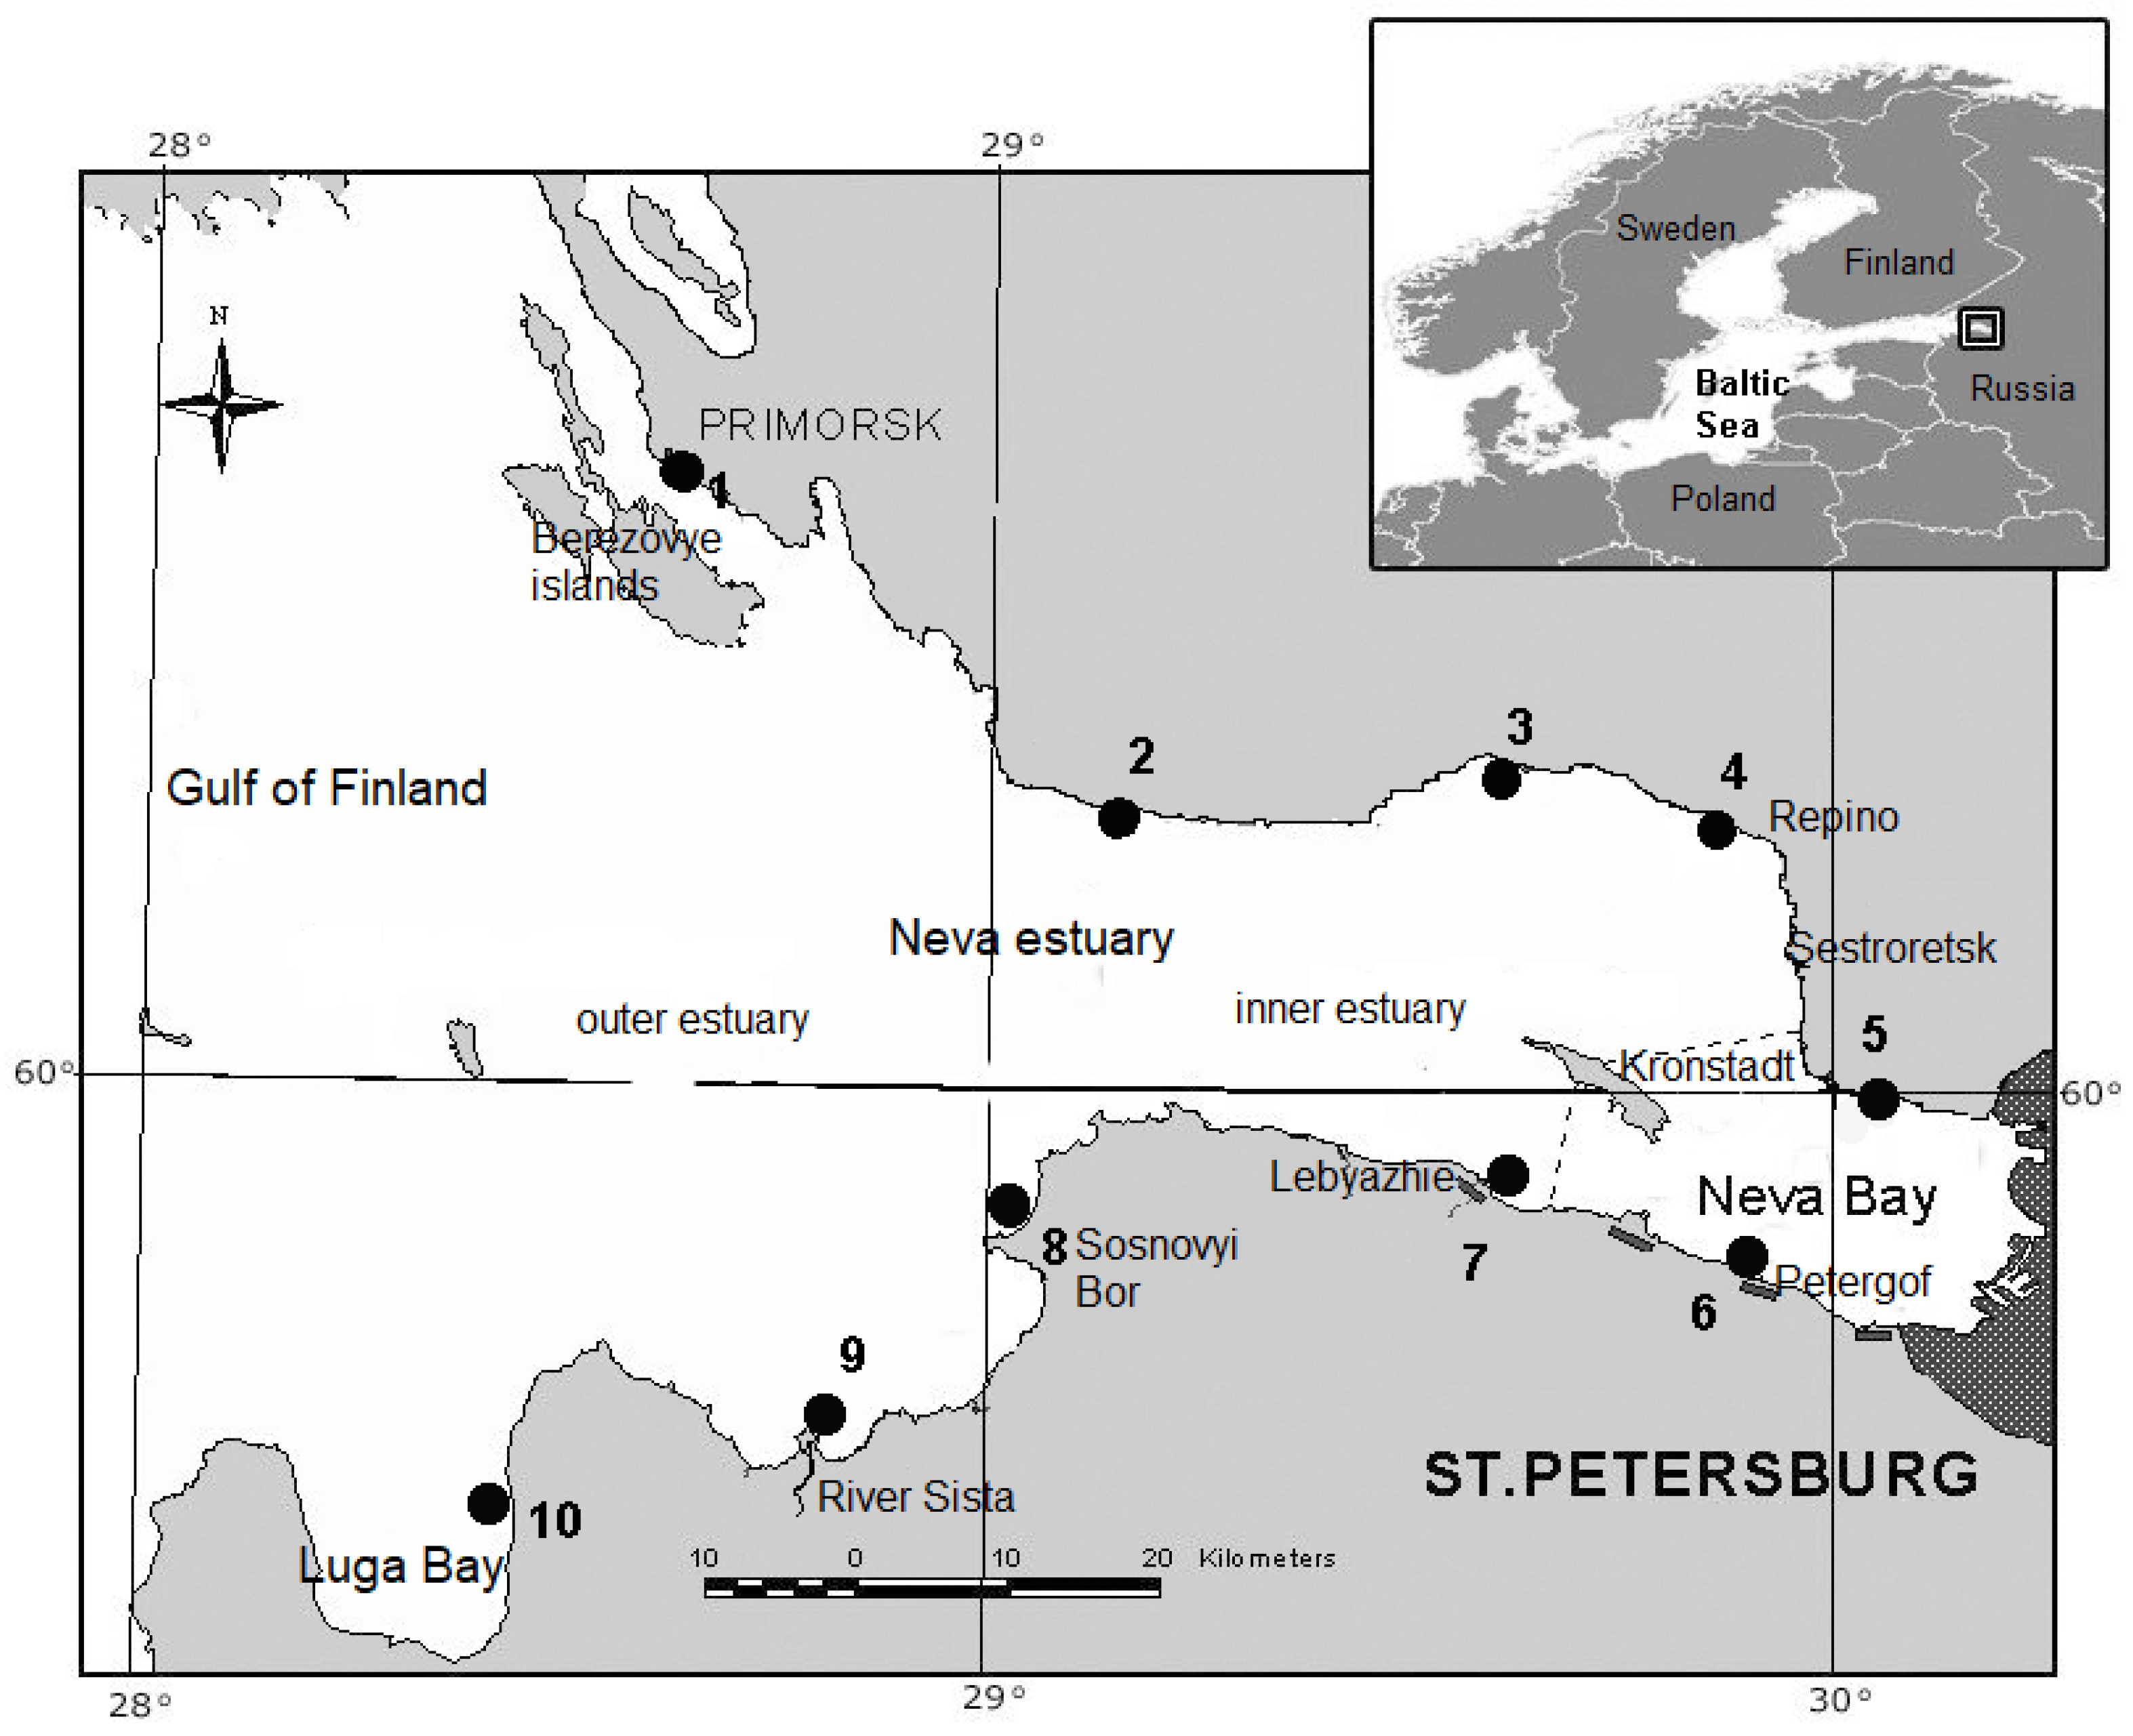
2.1. Study Sites and Sample Collection
2.2. Environmental State
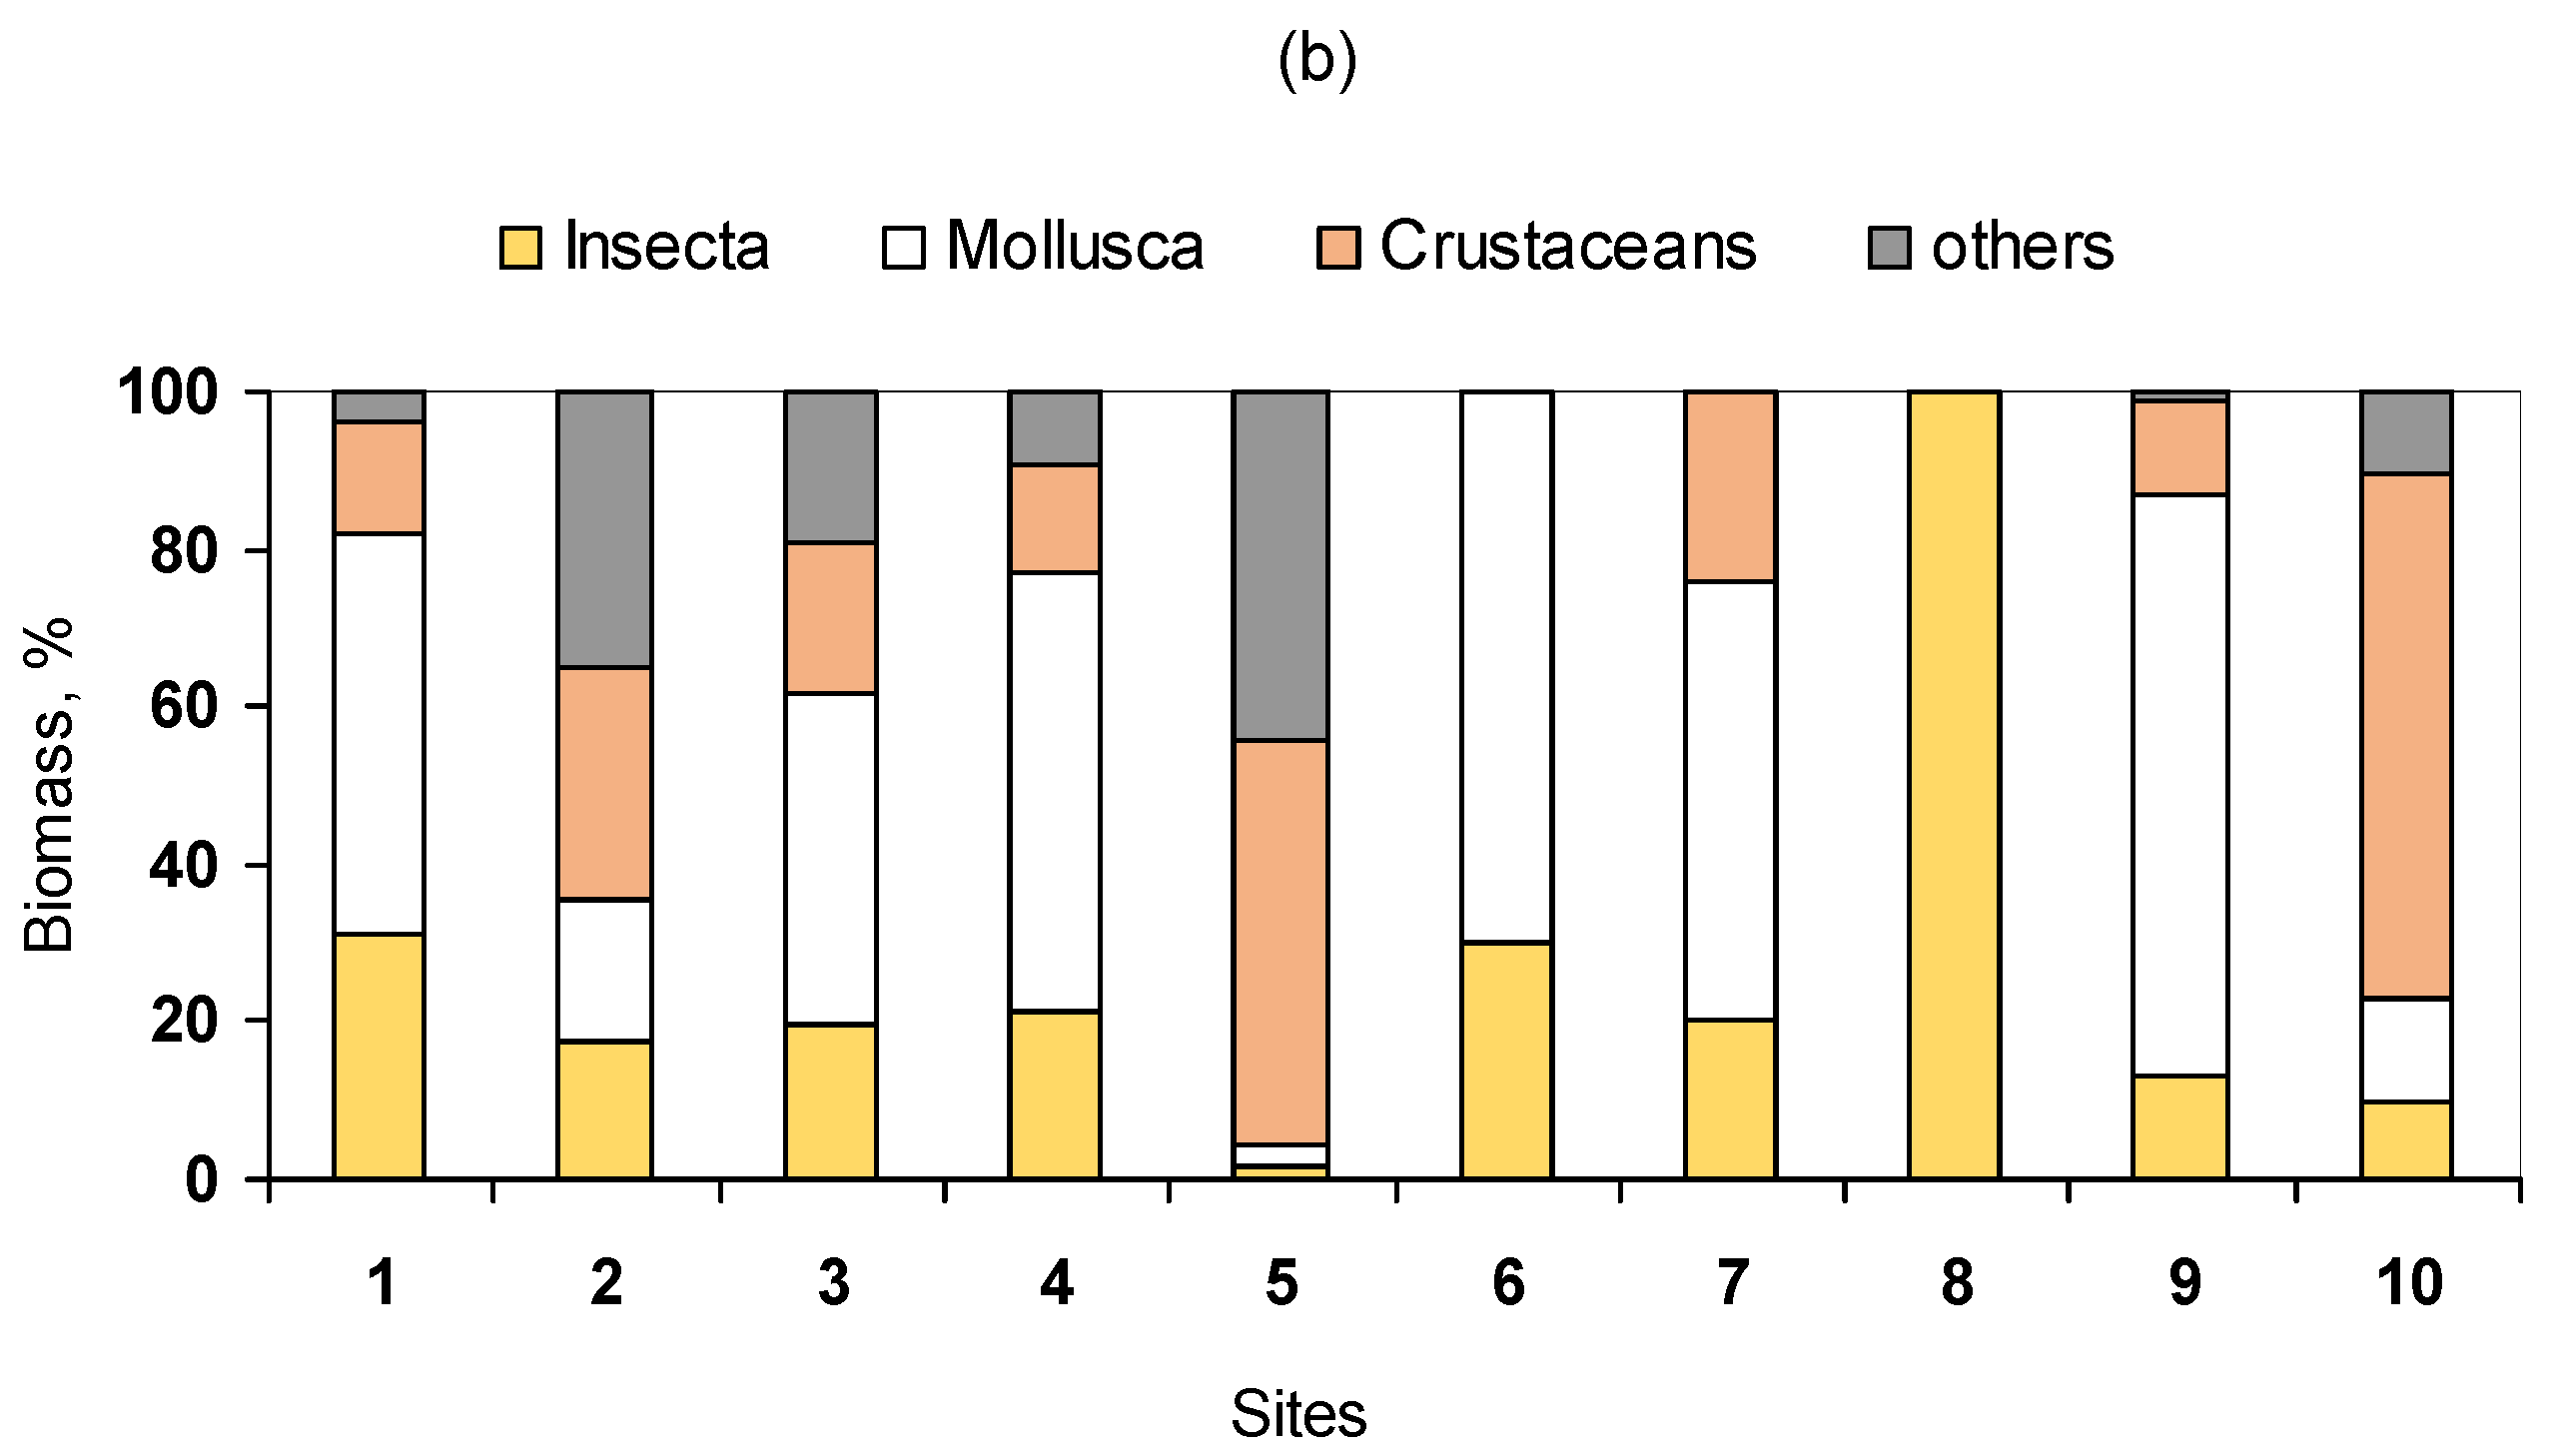
2.3. Stableisotope Analysis of the Coastal Food Web
2.4. Statistics
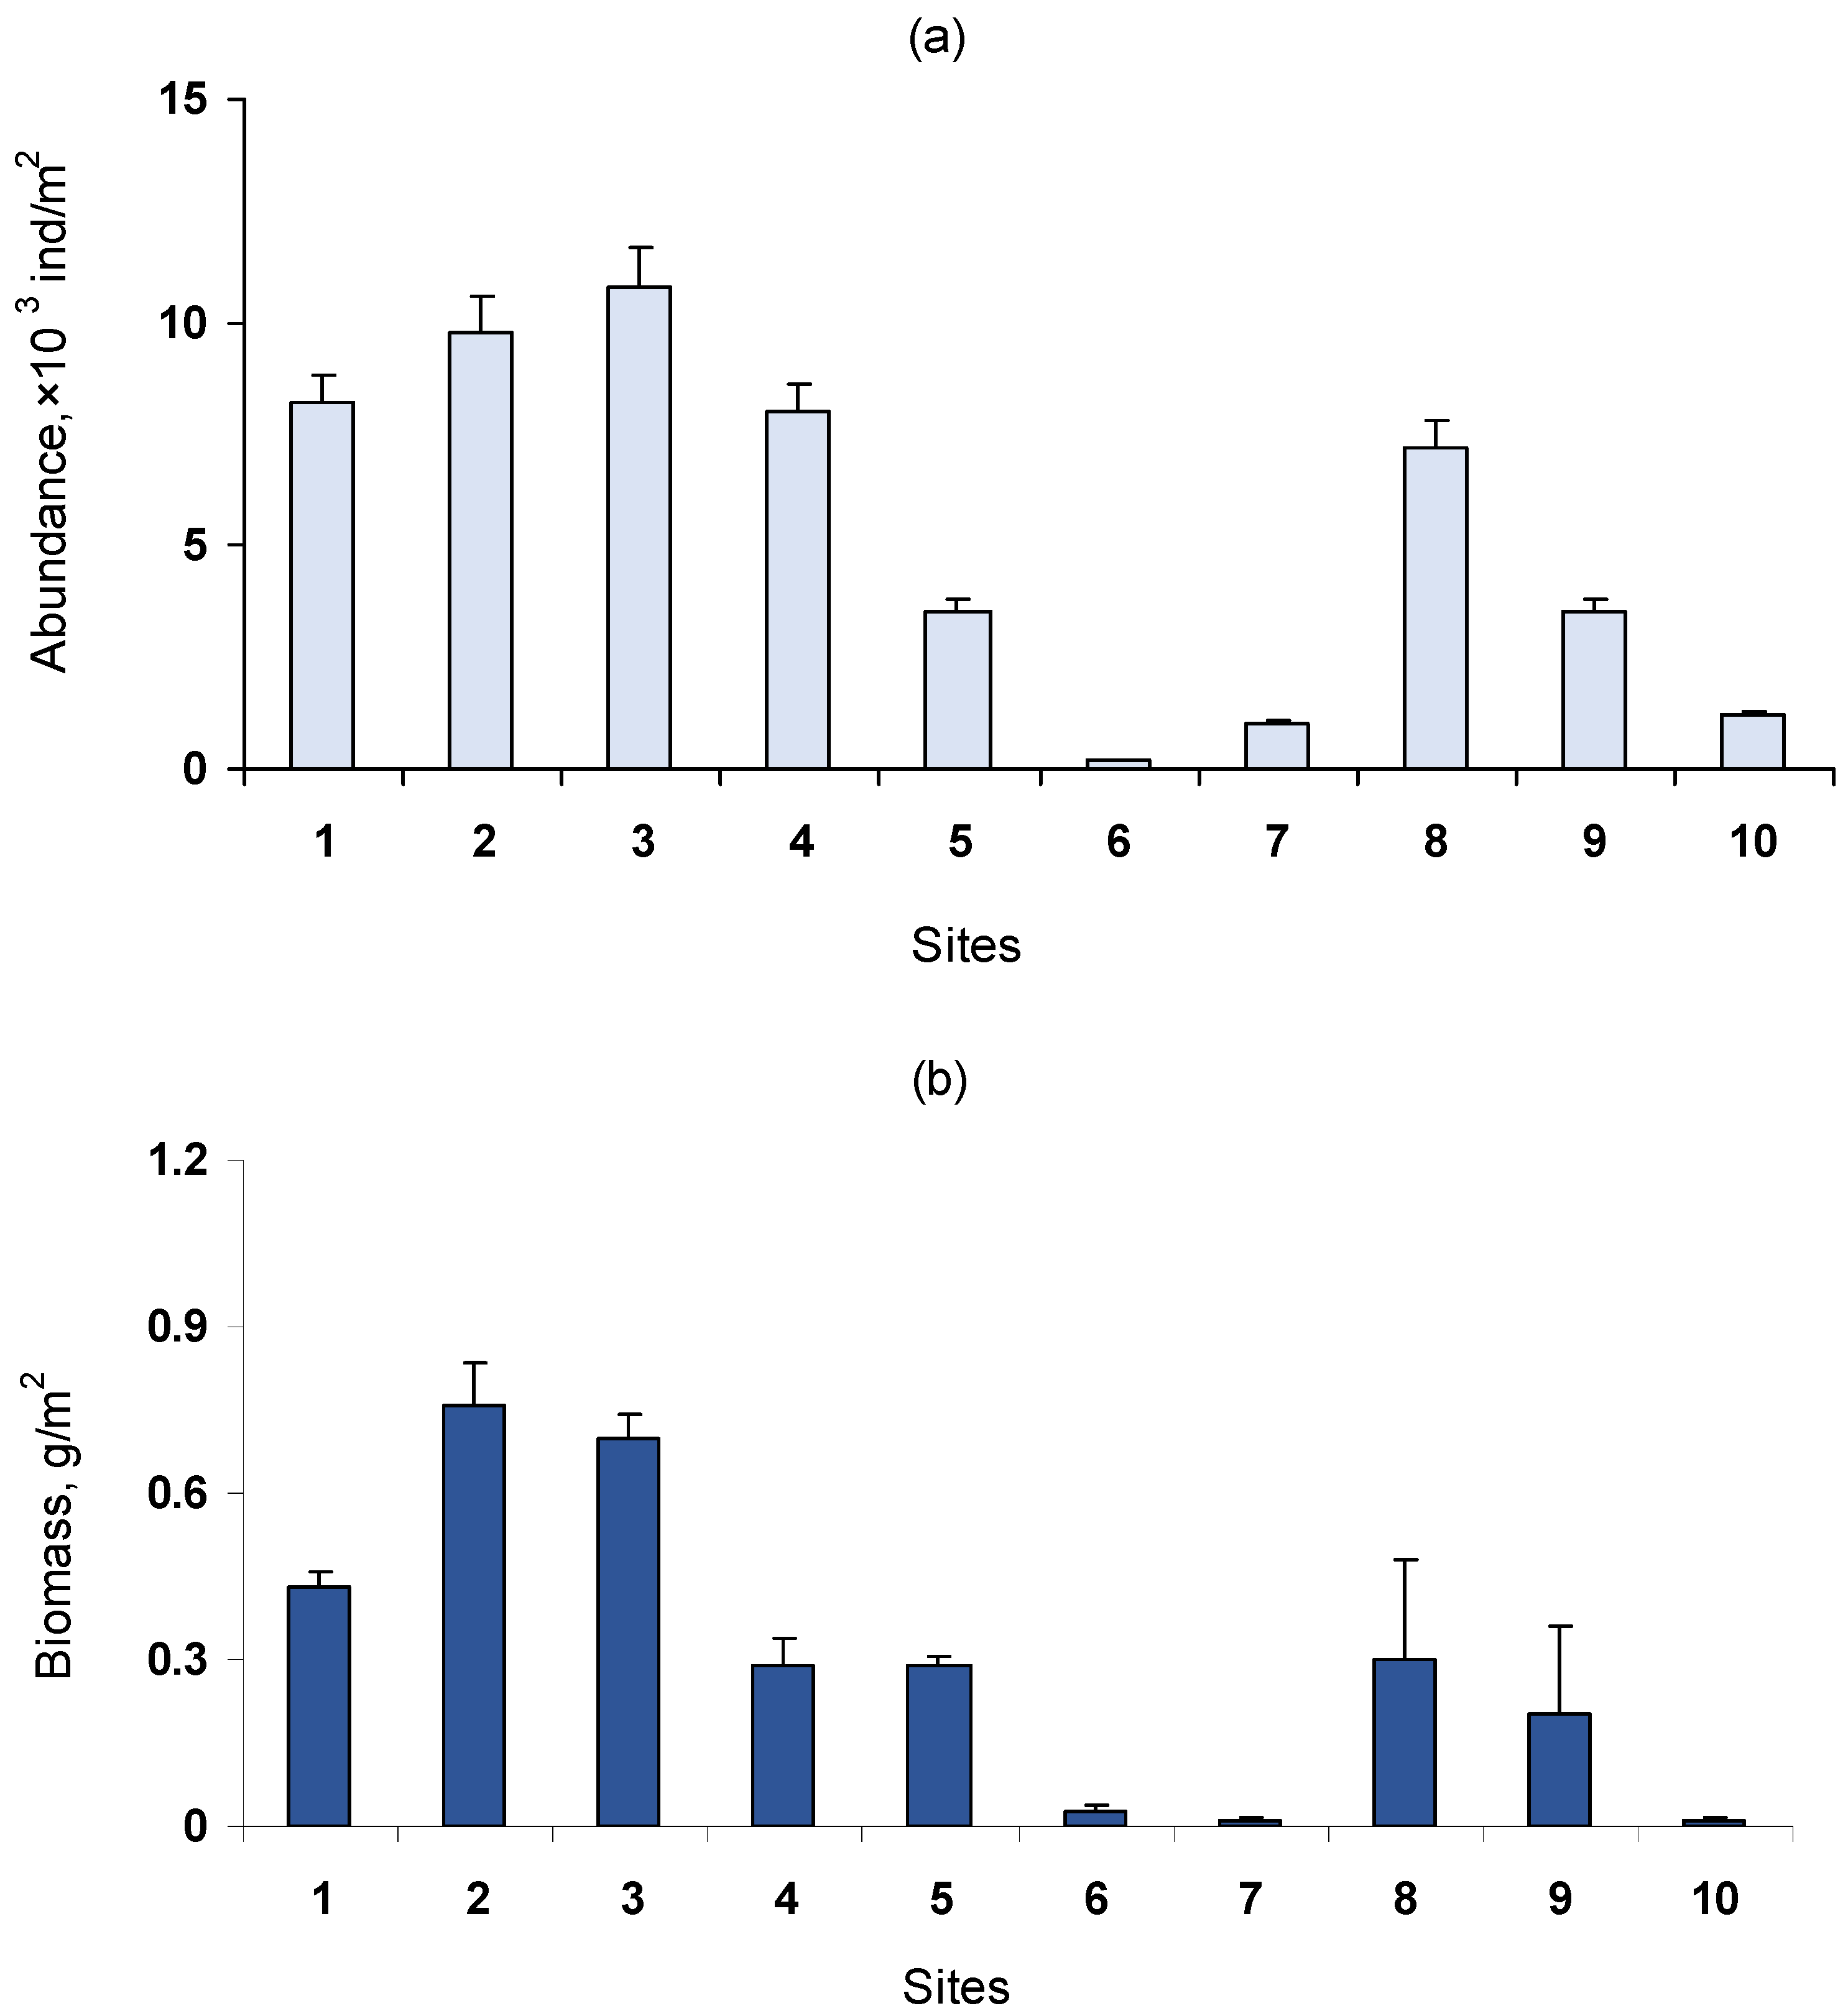
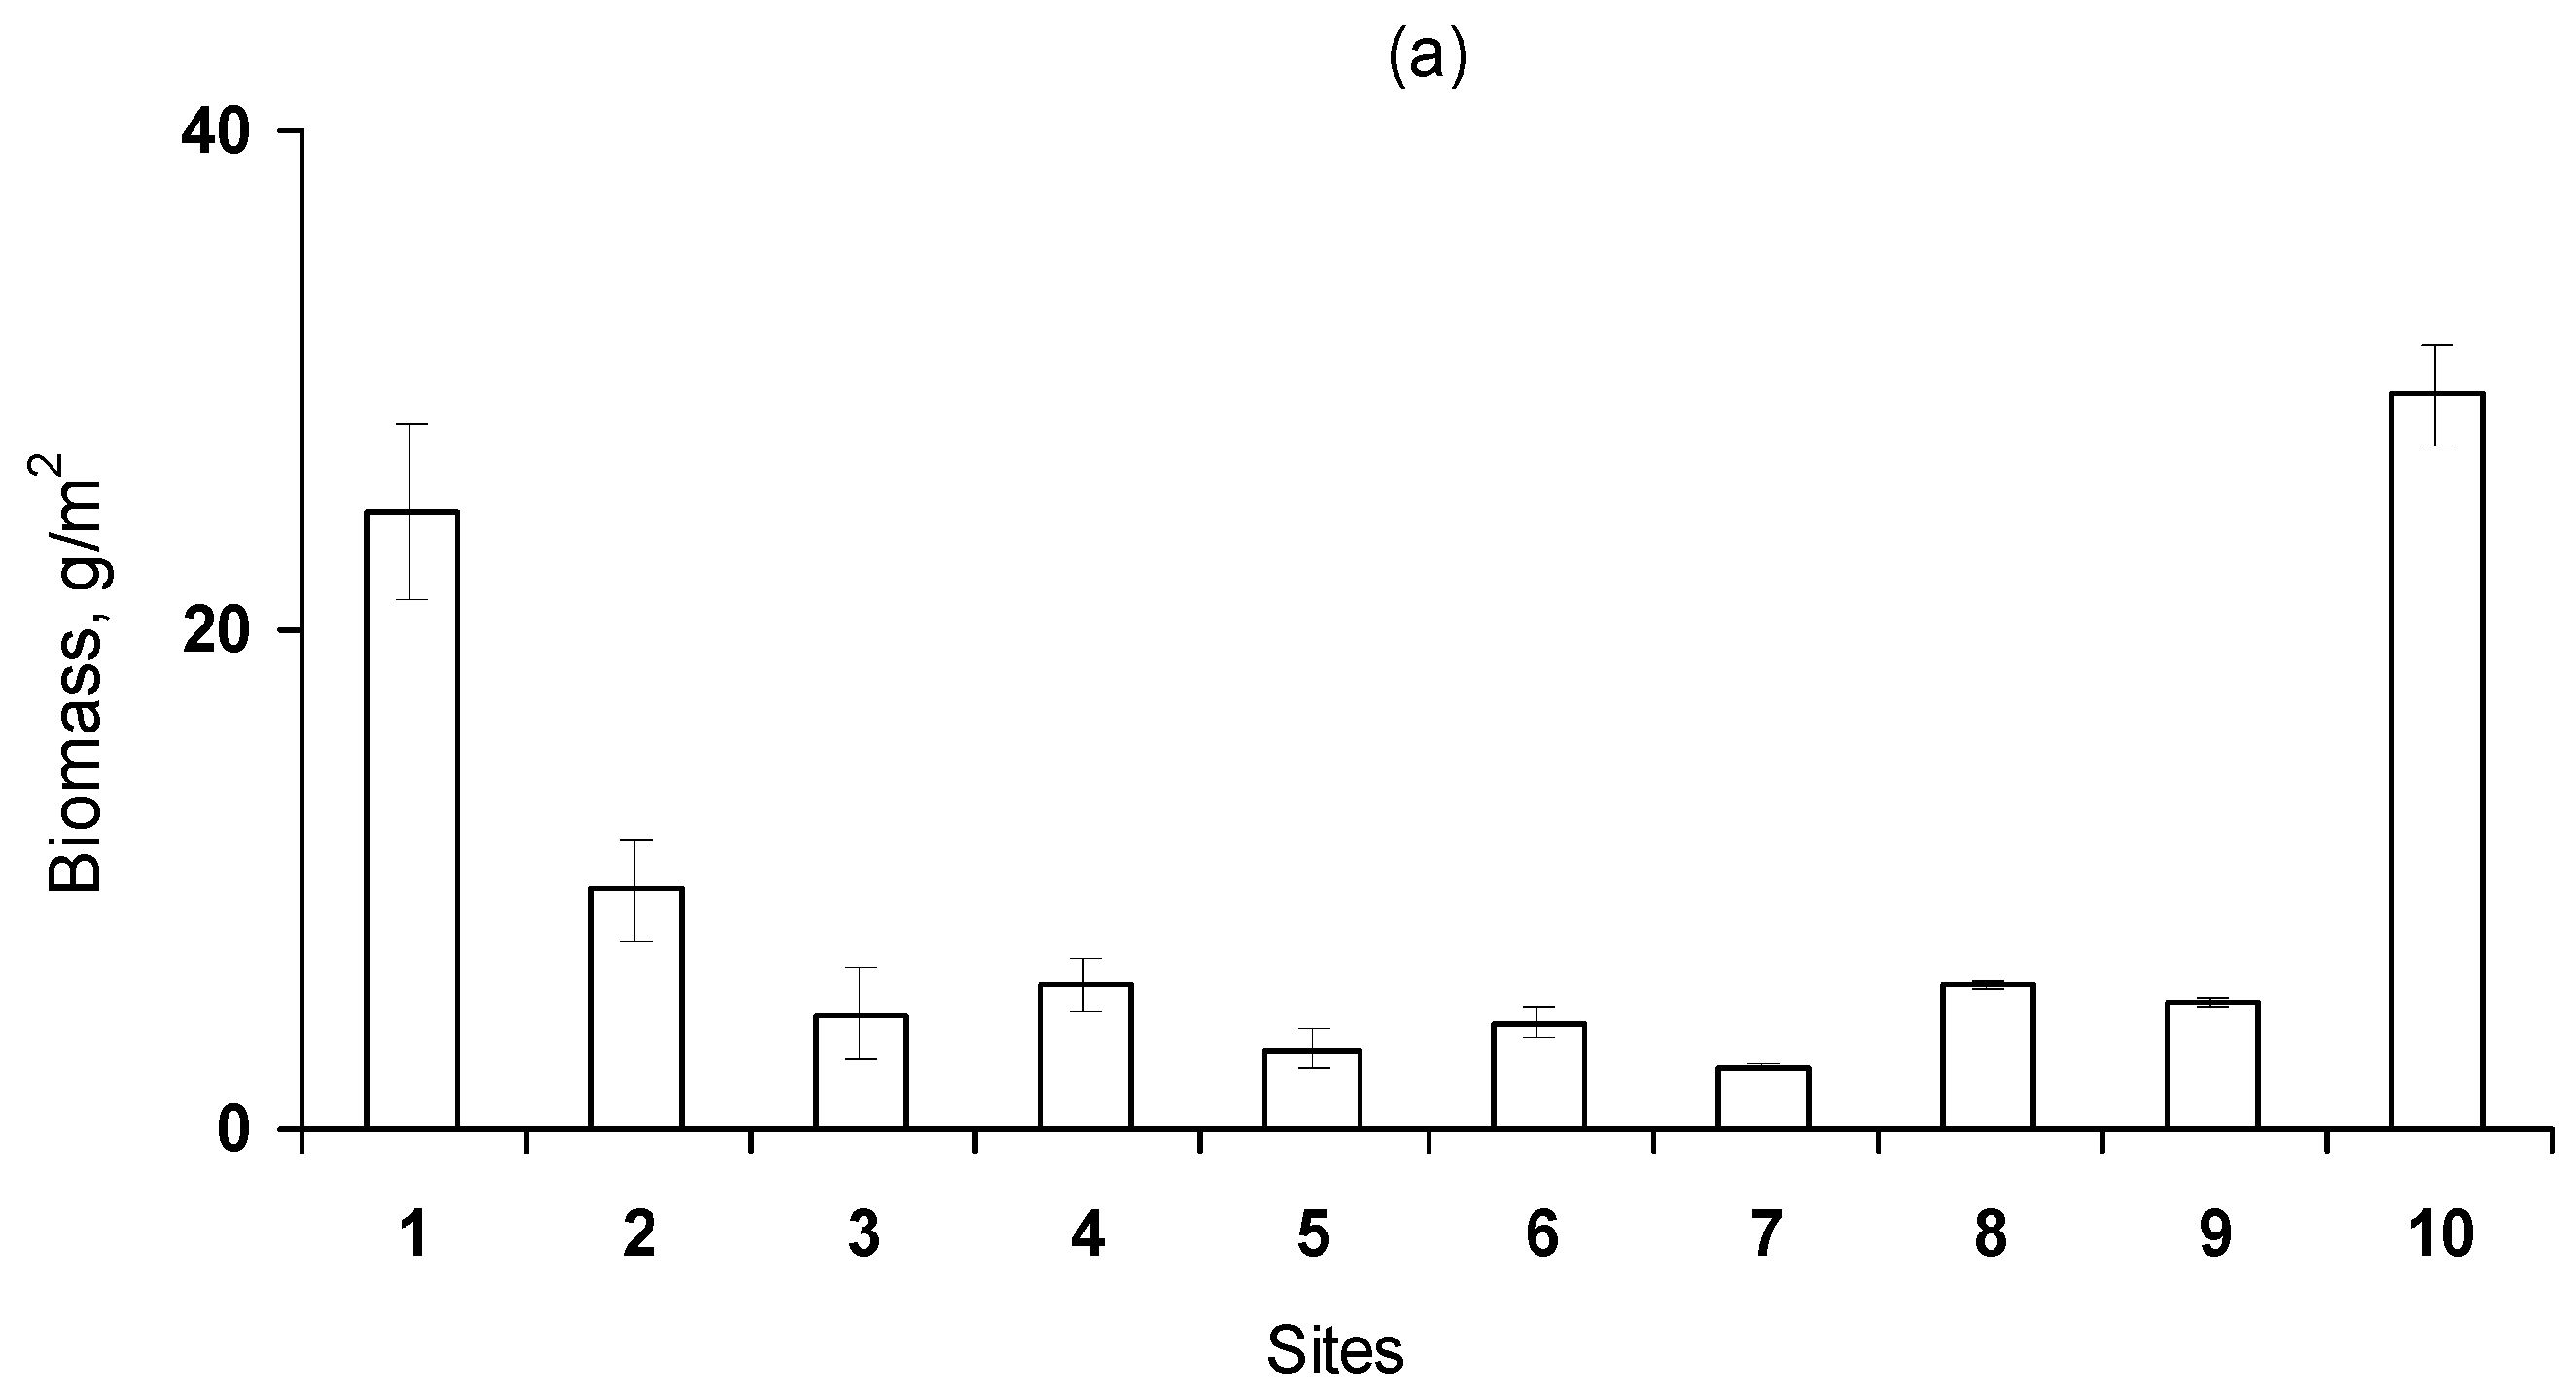
3. Results
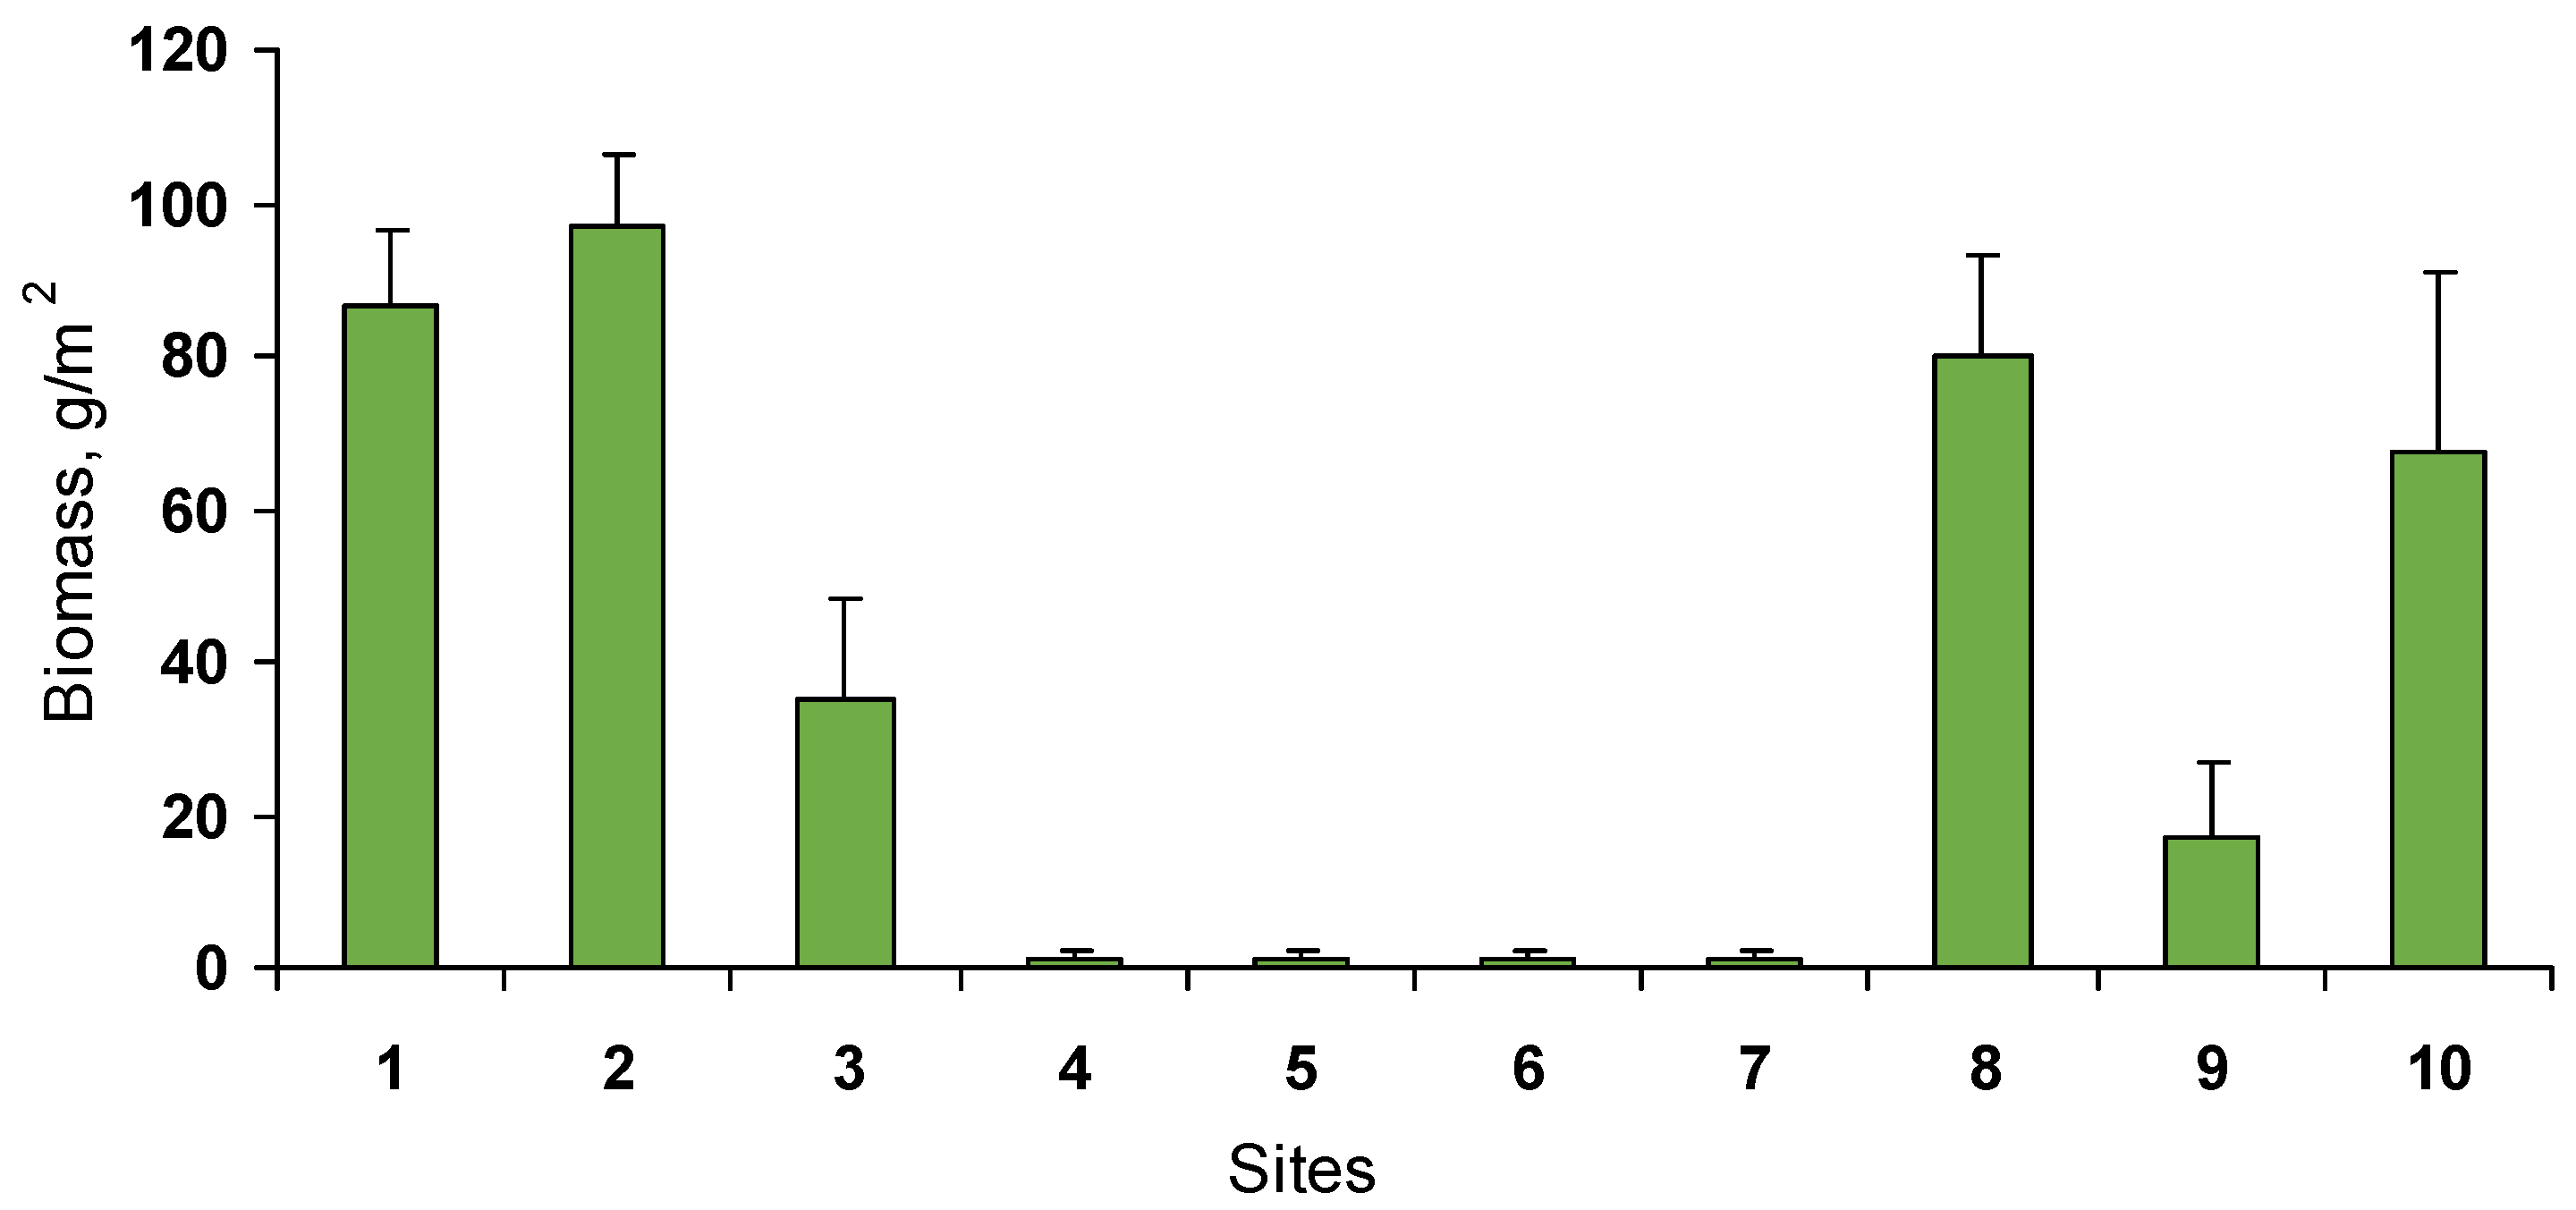
3.1. Macroalgae
3.2. Benthic Community
4. Discussion
5. Conclusions
Supplementary Materials
Author Contributions
Funding
Institutional Review Board Statement
Data Availability Statement
Acknowledgments
Conflicts of Interest
References
- Perrot, T.; Rossi, N.; Ménesguen, A.; Dumas, F. Modelling green macroalgal blooms on the coasts of Brittany, France to enhance water quality management. J. Mar. Syst. 2014, 132, 38–53. [Google Scholar] [CrossRef] [Green Version]
- Joniver, C.F.H.; Photiades, A.; Moore, P.J.; Winters, A.L.; Woolmer, A.; Adams, J.M.M. The global problem of nuisance macroalgal blooms and pathways to its use in the circular economy. Algal Res. 2021, 58, 102407. [Google Scholar] [CrossRef]
- Lyons, D.A.; Mant, R.C.; Bulleri, F.; Kotta, J.; Rilov, G.; Crowe, T.P. What are the effects of macroalgal blooms on the structure and functioning of marine ecosystems? A systematic review protocol. Environ. Evid. 2012, 1, 7. [Google Scholar] [CrossRef] [Green Version]
- Duarte, C.M. Submerged aquatic vegetation in relation to different nutrient regimes. Ophelia 1995, 41, 87–112. [Google Scholar] [CrossRef]
- Golubkov, M.S. Phytoplankton primary production in the Neva Estuary at the turn of the 21st century. Inland Water Biol. 2009, 2, 312–318. [Google Scholar] [CrossRef]
- Gubelit, Y.I.; Kovalchuk, N.A. Macroalgal blooms and species diversity in the Transition Zone of the eastern Gulf of Finland. Hydrobiologia 2010, 656, 83–86. [Google Scholar] [CrossRef]
- Stepanyan, O.V. Distribution of macroalgae and sea grasses of the Sea of Azov, the Kerch Strait and the Taman Bay. Oceanology 2009, 49, 393–399. [Google Scholar]
- Gubelit, Y.I.; Berezina, N.A. The causes and consequences of algal blooms: The Cladophora glomerata bloom and the Neva estuary (eastern Baltic Sea). Mar. Pollut. Bull. 2010, 61, 183–188. [Google Scholar] [CrossRef]
- Prazukin, A.; Shadrin, N.; Balycheva, D.; Firsov, Y.; Lee, R.; Anufriieva, E. Cladophora spp. (Chlorophyta) modulate environment and create a habitat for microalgae in hypersaline waters. Eur. J. Phycol. 2021, 56, 231–243. [Google Scholar] [CrossRef]
- Gorbunova, Y.A.; Esyukova, E.E. Emissions of macroalgae and sea grasses in the Russian part of the South-Eastern coast of the Baltic Sea. Izv. Kaliningr. State Tech. Univ. 2020, 59, 24–34. (In Russian) [Google Scholar] [CrossRef]
- Ebadi, A.G.; Hisoriev, H. The prevalence of heavy metals in Cladophora glomerata L. from Farahabad Region of Caspian Sea–Iran. Toxicol. Environ. Chem. 2017, 99, 883–891. [Google Scholar] [CrossRef]
- Franzen, D.; Infantes, E.; Grondahl, F. Beach-cast as biofertiliser in the Baltic Sea region-potential limitations due to cadmium-content. Ocean Coast. Manag. 2019, 169, 20–26. [Google Scholar] [CrossRef]
- Gubelit, Y.; Polyak, Y.; Dembska, G.; Pazikowska-Sapota, G.; Zegarowski, L.; Kochura, D.; Krivorotov, D.; Podgornaya, E.; Burova, O.; Maazouzi, C. Nutrient and metal pollution of the eastern Gulf of Finland coastline: Sediments, macroalgae, microbiota. Sci. Total Environ. 2016, 550, 806–819. [Google Scholar] [CrossRef]
- Bonsdorff, E. Drifting algae and zoobenthos—Effects on settling and community structure. Neth. J. Sea Res. 1992, 30, 57–62. [Google Scholar] [CrossRef]
- Hou, J.Z.; Wei, Q.; Gao, L.; Sun, W.M. Influence of decomposition of Cladophora sp. on phosphorus concentrations and forms in the overlying water. Huan Jing Ke Xue 2013, 34, 2184–2190. (In Chinese) [Google Scholar]
- Kononenko, G.P.; Burkin, A.A.; Georgiev, A.A.; Georgieva, M.L. Mycotoxins in macroalgae from the Velikaya Salma Strait of the Kandalaksha Bay of the White Sea. Biol. Morya 2022, 48, 53–61. (In Russian) [Google Scholar] [CrossRef]
- Lenzi, M.; Cianchi, F. Summer dystrophic criticalities of non-tidal lagoons: The case study of a Mediterranean lagoon. Diversity 2022, 14, 771. [Google Scholar] [CrossRef]
- Stevenson, R.J.; Bennett, B.J.; Jordan, D.N.; French, R.D. Phosphorus regulate stream injury by filamentous green algae, DO, and pH with thresholds in responses. Hydrobiologia 2012, 695, 25–42. [Google Scholar] [CrossRef]
- Valiela, I.; McClelland, J.; Hauxwell, J.; Behr, P.; Hersh, D.; Foreman, K. Macroalgal blooms in shallow estuaries: Controls and ecophysiological and ecosystem consequences. Limnol. Oceanogr. 1997, 42, 1105–1118. [Google Scholar] [CrossRef] [Green Version]
- Jones, M.; Pinn, E. The impact of a macroalgal mat on benthic biodiversity in Poole Harbour. Mar. Poll. Bull. 2006, 53, 63–71. [Google Scholar] [CrossRef] [PubMed]
- Rivers, J.S.; Peckol, P. Interactive Effects of nitrogen and dissolved inorganic carbon on photosynthesis, growth, and ammonium uptake of the macroalgae Cladophora vagabunda and Gracilaria tikvahiae. Mar. Biol. 1995, 121, 747–753. [Google Scholar] [CrossRef]
- Wan, A.H.; Wilkes, R.; Heesch, S.; Bermejo, R.; Johnson, M.; Morrison, L. Assessment and characterisation of Ireland’s green tides (Ulva species). PLoS ONE 2017, 12, e0169049. [Google Scholar] [CrossRef] [PubMed]
- Umanzor, S.; Ladah, L.; Calderon-Aguilera, L.E.; Zertuche-González, J.A. Intertidal macroalgae influence macroinvertebrate distribution across stress scenarios. Mar. Ecol. Prog. Ser. 2017, 584, 67–77. [Google Scholar] [CrossRef]
- Dolbeth, M.; Pardal, M.A.; Lillebo, A.I.; Azeiteiro, U.; Marques, J.C. Short- and long-term effects of eutrophication on the secondary production of an intertidal macrobenthic community. Mar. Biol. 2003, 143, 1229–1238. [Google Scholar] [CrossRef]
- Berezina, N.A. Spatial distribution of macrofauna in a littoral zone with drifting macroalgae in the Neva estuary. Est. J. Ecol. 2008, 57, 198–213. [Google Scholar] [CrossRef] [Green Version]
- Page, M.; Goldhammer, T.; Hilt, S.; Tolentino, S.; Brothers, S. Filamentous algae blooms in a large, clear-water lake: Potential Drivers and Reduced Benthic Primary Production. Water 2022, 14, 2136. [Google Scholar] [CrossRef]
- Golubkov, S.M.; Berezina, N.A.; Gubelit, Y.I.; Demchuk, A.S.; Golubkov, M.S.; Tiunov, A.V. A relative contribution of carbon from green tide algae Cladophora glomerata and Ulva intestinalis in the coastal food webs in the Neva Estuary (Baltic Sea). Mar. Pollut. Bull. 2018, 126, 43–50. [Google Scholar] [CrossRef]
- Lauringson, V.; Kotta, J. Influence of the thin drift algal mats on the distribution of macrozoobenthos in Koiguste Bay, NE Baltic Sea. Hydrobiologia 2006, 554, 97–105. [Google Scholar] [CrossRef]
- Tomczak, M.T.; Müller-Karulis, B.; Järv, L.; Kotta, J.; Martin, G.; Minde, A.; Põllumäe, A.; Razinkovas, A.; Strake, S.; Bucas, M.; et al. Analysis of trophic networks and carbon flows in south-eastern Baltic coastal ecosystems. Prog. Oceanogr. 2009, 1–4, 111–131. [Google Scholar] [CrossRef]
- Razinkovas-Baziukas, A.; Morkūnė, R.; Bacevičius, E.; Gasiūnaitė, Z.R. Trophic network model of exposed sandy coast: Linking continental and marine water ecosystems. Estuar. Coast. Shelf Sci. 2017, 195, 110–123. [Google Scholar] [CrossRef]
- Golterman, H.L. (Ed.) Methods for Chemical Analysis of Freshwaters. IBP Handbook 8; Blackwell Scientific Publ.: Oxford, UK; Edinburgh, UK, 1969; 172p. [Google Scholar]
- Berezina, N.; Strode, E.; Lehtonen, K.; Balode, M.; Golubkov, S. Sediment quality assessment using Gmelinoides fasciatus and Monoporeia affinis (Amphipoda, Gammaridea) in the northeastern Baltic Sea. Crustaceana 2013, 86, 780–801. [Google Scholar] [CrossRef]
- Berezina, N.A.; Gubelit, Y.I.; Polyak, Y.M.; Sharov, A.N.; Kudryavtseva, V.A.; Lubimtsev, V.A.; Petukhov, V.A.; Shigaeva, T.D. An integrated approach to the assessment of the eastern Gulf of Finland health: A case study of coastal habitats. J. Mar. Syst. 2017, 171, 159–171. [Google Scholar] [CrossRef]
- Phillips, D.L.; Cregg, J.W. Source Partitioning Using Stable Isotopes: Coping with Too Many Sources. Oecologia 2003, 136, 261–269. [Google Scholar] [CrossRef]
- Moore, J.W.; Semmens, B.X. Incorporating uncertainty and prior information into stable isotope mixing models. Ecol. Lett. 2008, 11, 470–480. [Google Scholar] [CrossRef]
- Parnell, A.C.; Phillips, D.L.; Bearhop, S.; Semmens, B.X.; Ward, E.J.; Moore, J.W.; Jackson, A.L.; Grey, J.; Kelly, D.J.; Inger, R. Bayesian stable isotope mixing models. Environmetrics 2013, 24, 387–399. [Google Scholar] [CrossRef] [Green Version]
- Stock, B.C.; Jackson, A.L.; Ward, E.J.; Parnell, A.C.; Phillips, D.L.; Semmens, B.X. Analyzing mixing systems using a new generation of Bayesian tracer mixing models. PeerJ 2018, 6, e5096. [Google Scholar] [CrossRef] [PubMed]
- Fong, J.M.; Lai, S.; Yaakub, S.M.; Ow, Y.X.; Todd, P.A. The diet and feeding rates of gastropod grazers in Singapore’s seagrass meadows. Bot. Mar. 2018, 61, 181–192. [Google Scholar] [CrossRef]
- Mordukhovich, V.; Fadeeva, N.; Kiyashko, S. Use of analysis of stable isotope ratios and fatty acid composition in trophoecological studies of marine free-living nematodes. In Studies of Marine Organisms in the Far East: Biodiversty, Monitoring, and Rational Management of Resources; Malakhov, V.V., Chernyshev, A.V., Eds.; Far Eastern Federal University Press: Vladivostok, Russia, 2020; pp. 307–346. [Google Scholar]
- Berezina, N.A.; Golubkov, S.M.; Gubelit, J.I. Grazing effects of alien amphipods on macroalgae in the littoral zone of the Neva Estuary (Eastern Gulf of Finland, Baltic Sea). Oceanol. Hydrobiol. Stud. 2005, 34 (Suppl. S1), 63–82. [Google Scholar]
- Best, R.; Chaudoin, A.L.; Bracken, M.E.S.; Graham, M.H.; Stachowicz, J.J. Plant-animal diversity relationships in a rocky intertidal system depend on invertebrate body size and algal cover. Ecology 2014, 95, 1308–1322. [Google Scholar] [CrossRef] [PubMed] [Green Version]
- Dean, R.L.; Connell, J.H. Marine invertebrates in an algal succession. I. Variations in abundance and diversity with succession. J. Exp. Mar. Biol. Ecol. 1987, 109, 195–215. [Google Scholar] [CrossRef]
- Duffy, J.E.; Hay, M.E. Strong impacts of grazing amphipods on the organization of a benthic community. Ecol. Monogr. 2000, 70, 237–263. [Google Scholar] [CrossRef]
- Lotze, H.K.; Schramm, W.; Schories, D.; Worm, B. Control of macroalgal blooms at early developmental stages: Pilayella littoralis versus Enteromorpha spp. Oecologia 1999, 119, 46–54. [Google Scholar] [CrossRef]
- Menge, B.A.; Daley, B.A.; Wheeler, P.A.; Strub, P.T. Rocky intertidal oceanography: An association between community structure and nearshore phytoplankton concentration. Limnol. Oceanogr. 1997, 42, 57–66. [Google Scholar] [CrossRef]
- Kharlamenko, V.I.; Kiyashko, S.L.; Imbs, A.B.; Vyshkvartzev, D.I. Identification of food sources of invertebrates from the seagrass Zostera marina community using carbon and sulfur stable isotope ratio and fatty acid analyses. Mar. Ecol. Progr. Ser. 2001, 220, 103–117. [Google Scholar] [CrossRef] [Green Version]
- Ponsard, S.; Arditi, R. What can stable isotopes (δ15N and δ 13C) tell about the food web of soil macro-invertebrates? Ecology 2000, 81, 852–864. [Google Scholar] [CrossRef]
- Peterson, B.J.; Fry, B. Stable Isotopes in Ecosystem Studies. Annu. Rev. Ecol. Syst. 1987, 18, 293–320. [Google Scholar] [CrossRef]
- Hemminga, M.A.; Mateo, M.A. Stable carbon isotopes in seagrasses: Variability in ratios and use in ecological studies. Mar. Ecol. Prog. Ser. 1996, 140, 285–298. [Google Scholar] [CrossRef] [Green Version]
- Gladyshev, M.I. Stable isotope analyses in aquatic ecology (a review). J. Sib. Fed. University. Biol. 2009, 2, 381–402. [Google Scholar]
- Fry, B.; Arnold, C. Rapid 13C/12C turnover during growth of brown shrimp (Penaeus aztecus). Oecologia 1982, 5, 200–204. [Google Scholar] [CrossRef]
- Stephenson, R.L.; Tan, F.C.; Mann, K.H. Stable carbon isotope variability in marine macrophytes and its implications for food web studies. Mar. Biol. 1984, 81, 223–230. [Google Scholar] [CrossRef]
- McMillan, C.; Smith, B.N. Comparison of δ13C values for seagrasses in experimental cultures and in natural habitats. Aquat. Bot. 1982, 14, 381–387. [Google Scholar] [CrossRef]
- Fry, B.; Sherr, E.B. δ13C measurements as indicators of carbon flow in marine and freshwater ecosystems. Contrib. Mar. Sci. 1984, 27, 13–47. [Google Scholar]
- Mercado, J.M.; de los Santos, C.B.; Lucas Pérez-Lloréns, J.; Vergara, J.J. Carbon isotopic fractionation in macroalgae from Cádiz Bay (Southern Spain): Comparison with other bio-geographic regions. Estuar. Coast. Shelf Sci. 2009, 85, 449–458. [Google Scholar] [CrossRef]
- Michener, R.H.; Schell, D.M. Stable isotope ratios as tracers in marine aquatic food webs. In Stable Isotopes in Ecology and Environmental Science; Lajtha, K., Michener, R.H., Eds.; Blackwell Science: Oxford, UK, 1994; pp. 138–157. [Google Scholar]
- Hardison, A.K.; Canuel, E.A.; Anderson, I.C.; Veuger, B. Fate of macroalgae in benthic systems: Carbon and nitrogen cycling within the microbial community. Mar. Ecol. Prog. Ser. 2010, 414, 41–55. [Google Scholar] [CrossRef] [Green Version]
- Shafique, S.; Siddiqui, P.; Aziz, R.; Shoaib, N. Variations in carbon and nitrogen contents during decomposition of three macroalgae inhabiting sandspit backwater, Karachi. Pak. J. Bot. 2013, 45, 1115–1118. [Google Scholar]
- Veuger, B.; Eyre, B.D.; Maher, D.; Middelburg, J.J. Nitrogen incorporation and retention by bacteria, algae, and fauna in a subtropical intertidal sediment: An in situ 15N labeling study. Limnol. Oceanogr. 2007, 52, 1930–1942. [Google Scholar] [CrossRef]
- Choo, K.S.; Pedersén, M.; Snoeijs, P. Uptake of inorganic carbon by Cladophora glomerata (Chlorophyta) from the Baltic Sea. J. Phycol. 2002, 38, 493–502. [Google Scholar] [CrossRef]
- Paalme, T.; Kukk, H.; Kotta, J.; Orav, H. “In vitro” and “in situ” decomposition of nuisance macroalgal Cladophora glomerata and Pilayella littoralis. Hydrobiologia 2002, 475, 469–476. [Google Scholar] [CrossRef]
- Sand-Jensen, K.; Borum, J. Interactions among phytoplankton, periphyton, and macrophytes in temperate freshwaters and estuaries. Aquatic Botany 1991, 41, 137–175. [Google Scholar] [CrossRef]
- Gubelit, Y.I.; Makhutova, O.N.; Sushchik, N.N.; Kolmakova, A.A.; Kalachova, G.S.; Gladyshev, M.I. Fatty acid and elemental composition of littoral “green tide” algae from the Gulf of Finland, the Baltic Sea. J. Appl. Phycol. 2015, 27, 375–386. [Google Scholar] [CrossRef]


| Site | Name | N; E | Salinity, g/L | Oxygen, mg/L | P Total, mkg/L | Substrate | C org % | AS % | State | ||
|---|---|---|---|---|---|---|---|---|---|---|---|
| Surface | Bottom | Surface | Bottom | ||||||||
| 1 | Primorsk | 60.36; 28.61 | 2.1 | 2.2 | 7.2 | 7.1 | 125 | Silty sand, stones | 0.4 | 60 | Sub-GES |
| 2 | Flotsky | 60.16; 29.16 | 1.5 | 1.6 | 7.1 | 7.0 | 60 | The same | 0.3 | 94 | GES |
| 3 | Serovo | 60.20; 29.57 | 1.0 | 1.1 | 7.2 | 7.1 | 50 | The same | 0.5 | 90 | GES |
| 4 | Repino | 60.16; 29.85 | 0.5 | 0.6 | 7.2 | 7.1 | 102 | The same | 0.5 | 70 | Sub-GES |
| 5 | Olgino | 59.99; 30.10 | 0.1 | 0.2 | 7.0 | 7.0 | 66 | The same | 0.5 | 55 | Sub-GES |
| 6 | Petergof | 59.89; 29.90 | 0.1 | 0.2 | 7.2 | 7.0 | 88 | The same | 0.5 | 65 | Sub-GES |
| 7 | B. Izhora | 59.96; 29.50 | 1.6 | 1.7 | 7.3 | 7.2 | 45 | Sand | 0.1 | 100 | GES |
| 8 | Grafskaya | 59.98; 29.20 | 2.2 | 2.3 | 7.3 | 7.2 | 148 | Silty Sand | 0.5 | 40 | BES |
| 9 | Sista-Palkino | 59.81; 28.91 | 2.0 | 2.1 | 7.3 | 7.2 | 50 | Silty Sand | 0.5 | 75 | GES |
| 10 | Luga Bay | 59.83; 28.50 | 2.8 | 2.9 | 7.3 | 7.2 | 42 | Sand, stones | 0.1 | 90 | GES |
| Group/Variable | Site 2 | Site 4 | |||||||||
|---|---|---|---|---|---|---|---|---|---|---|---|
| δ13C | δ15N | %C | %N | C/N | δ13C | δ15N | %C | %N | C/N | ||
| Seston | Mean | −22.9 | 4.8 | - | - | - | - | - | - | - | - |
| SD | 1.7 | 0.6 | - | - | - | - | - | - | - | - | |
| Cladophora | Mean | −15.8 | 7.1 | 40.7 | 3.3 | 12.2 | −12.6 | 5.8 | 35.8 | 3.8 | 9.5 |
| SD | 0.6 | 0.1 | 0.7 | 0.1 | 0.1 | 0.2 | 0.2 | 1.0 | 0.1 | 0.2 | |
| Drifting mats | mean | −15.6 | 7.2 | 36.0 | 3.0 | 12.0 | −11.5 | 6.8 | 35.2 | 3.3 | 10.6 |
| SD | 0.5 | 0.1 | 1.1 | 0.1 | 0.0 | 0.4 | 0.1 | 0.1 | 0.2 | 0.6 | |
| Algae-derived detritus | mean | −10.9 | 6.3 | 38.3 | 2.9 | 13.3 | −10.8 | 6.3 | 38.8 | 2.9 | 13.5 |
| SD | 0.1 | 0.1 | 0.5 | 0.1 | 0.1 | 0.0 | 0.1 | 1.3 | 0.1 | 0.1 | |
| Ulva | mean | −12.4 | 9.4 | 36.1 | 3.4 | 10.7 | - | - | - | - | - |
| SD | 0.4 | 0.5 | 6.1 | 0.4 | 0.8 | - | - | - | - | - | |
| Potamogeton | mean | −16.4 | 8.0 | 41.4 | 3.7 | 11.4 | −14.5 | 9.0 | 41.9 | 3.4 | 12.3 |
| SD | 0.7 | 0.5 | 5.4 | 0.4 | 1.4 | 0.1 | 0.8 | 4.4 | 0.3 | 1.8 | |
| Bivalvia | mean | −21.6 | 7.9 | 49.4 | 11.5 | 4.3 | −22.9 | 7.8 | 45.0 | 10.5 | 4.3 |
| SD | 0.2 | 0.6 | 1.6 | 0.3 | 0.2 | 0.7 | 0.9 | 8.5 | 2.3 | 0.5 | |
| Gastropoda | mean | −14.7 | 7.1 | 30.7 | 8.8 | 3.5 | −21.3 | 5.3 | 37.9 | 8.3 | 4.6 |
| SD | 1.4 | 0.1 | 1.6 | 0.9 | 0.5 | 0.5 | 0.3 | 6.7 | 1.9 | 0.3 | |
| Trichoptera | mean | −19.3 | 9.3 | 49.2 | 9.8 | 5.1 | −14.8 | 6.8 | 43.8 | 8.9 | 4.9 |
| SD | 0.6 | 0.1 | 2.3 | 1.2 | 0.7 | 0.4 | 0.2 | 0.1 | 0.5 | 0.3 | |
| Diptera | mean | −17.9 | 9.1 | 47.3 | 11.2 | 4.2 | −18.4 | 8.5 | 47.4 | 9.4 | 5.1 |
| SD | 0.3 | 0.0 | 0.3 | 0.3 | 0.1 | 0.0 | 0.3 | 0.1 | 0.5 | 0.2 | |
| Ephemeroptera | mean | −17.4 | 9.2 | 47.5 | 10.3 | 4.6 | −18.8 | 9.3 | 45.4 | 10.8 | 4.2 |
| SD | 0.7 | 0.6 | 3.5 | 0.4 | 0.2 | 0.6 | 0.4 | 3.6 | 1.4 | 0.3 | |
| Hirudinea | mean | −16.8 | 11.0 | 50.3 | 11.2 | 4.5 | −19.5 | 12.2 | 39.3 | 9.7 | 4.1 |
| SD | 0.4 | 0.4 | 1.2 | 0.4 | 0.3 | 0.0 | 0.0 | 5.6 | 1.3 | 0.0 | |
| Gammaridae | mean | −16.6 | 8.7 | 36.9 | 8.2 | 4.5 | −18.7 | 9.1 | 27.1 | 5.7 | 4.7 |
| SD | 0.7 | 0.2 | 2.5 | 0.6 | 0.3 | 0.8 | 0.4 | 6.7 | 1.2 | 0.3 | |
| Fish | mean | −17.5 | 12.1 | 41.3 | 11.4 | 3.6 | −20.5 | 14.1 | 42.0 | 12.5 | 3.4 |
| SD | 0.0 | 0.4 | 4.3 | 1.8 | 0.2 | 0.2 | 0.2 | 2.7 | 1.1 | 0.1 | |
| Sources | Eph | Gam | Theo | |||
|---|---|---|---|---|---|---|
| Cladophora | <0.01–0.89 | 0.36 | <0.01–0.46 | 0.16 | 0.46–0.48 | 0.47 |
| Potamogeton | <0.01–0.95 | 0.54 | 0.42–0.96 | 0.74 | 0.26–0.28 | 0.27 |
| Ulva | <0.01–0.2 | 0.06 | <0.01–0.18 | 0.06 | <0.001–0.01 | <0.001 |
| Detritus | <0.01–0.15 | 0.04 | <0.01–0.03 | 0.03 | 0.25–0.26 | 0.26 |
Publisher’s Note: MDPI stays neutral with regard to jurisdictional claims in published maps and institutional affiliations. |
© 2022 by the authors. Licensee MDPI, Basel, Switzerland. This article is an open access article distributed under the terms and conditions of the Creative Commons Attribution (CC BY) license (https://creativecommons.org/licenses/by/4.0/).
Share and Cite
Berezina, N.A.; Tiunov, A.V.; Petukhov, V.A.; Gubelit, Y.I. Benthic Invertebrates Abundance and Trophic Links in the Coastal Zone during Cladophora Blooms. Diversity 2022, 14, 1053. https://doi.org/10.3390/d14121053
Berezina NA, Tiunov AV, Petukhov VA, Gubelit YI. Benthic Invertebrates Abundance and Trophic Links in the Coastal Zone during Cladophora Blooms. Diversity. 2022; 14(12):1053. https://doi.org/10.3390/d14121053
Chicago/Turabian StyleBerezina, Nadezhda A., Alexei V. Tiunov, Vasily A. Petukhov, and Yulia I. Gubelit. 2022. "Benthic Invertebrates Abundance and Trophic Links in the Coastal Zone during Cladophora Blooms" Diversity 14, no. 12: 1053. https://doi.org/10.3390/d14121053