Article

Effects of Land Use Changes on the Plant Community Characteristics in the Wetlands of the Semi-Arid Regions

1
Northeast Institute of Geography and Agroecology, Chinese Academy of Sciences, Changchun 130102, China
2
College of Geographical Sciences, Changchun Normal University, Changchun 130032, China
*
Author to whom correspondence should be addressed.
Diversity 2022, 14(12), 1049; https://doi.org/10.3390/d14121049
Submission received: 25 October 2022 / Revised: 23 November 2022 / Accepted: 26 November 2022 / Published: 30 November 2022
(This article belongs to the Special Issue Changes and Evolution of Flora and Vegetation under Human Impacts)

Abstract

:
Human disturbance is the main driving factor of wetland vegetation degradation, and plant community changes can directly characterize the process of wetland degradation. The wetlands in semi-arid region of Songnen Plain perform the important ecological functions, especially the habitat of waterbirds. Recently, the succession of wetland plant community has been accelerated by land use changes. In this study, we investigated the variations of plant community in wetlands undergoing land use changes (natural, mowing, light grazing + mowing, moderate grazing and heavy grazing wetlands) in the western Songnen Plain. The results showed that the plant communities were significantly affected by land use changes. The typical wetland plant Calamagrostis angustifolia was the dominant species in natural wetlands, and its dominance was gradually decreased in mowing or grazing wetlands in where Carex spp. or Artemisia selengensis acting as the dominant species. The height, density, and biomass in natural wetlands were significantly higher than those in other wetlands, whereas the species diversity and richness in natural wetlands were significantly lower. The similarity index of plant community in wetlands undergoing land use changes to natural wetlands ranged from 17.7–45.1%, being the highest in mowed wetlands and the lowest in heavily grazed wetlands. The linear regression further indicated that the plant diversity index was negatively correlated with the aboveground biomass of grasses and positively correlated with the aboveground biomass of forbs. Therefore, the land use changes in wetlands drove the replacement of dominant species of wetland vegetation and changed plant community characteristics and the species diversity, and the maintenance of species diversity is linked with the variability in plant functional strategies. The results of community variations and their relationships with functional changes can be used for assessing the effects of degradation and ecological function in response of land use changes in wetlands.

1. Introduction

Wetlands are precious natural resources on the earth, performing important ecological functions, such as climate regulation, water storage and drought prevention, soil erosion prevention and environmental pollution degradation, and have an important impact on the living environment of human beings [1,2]. Wetland plants are an integral part of wetland ecosystem, which can purify water environment and sequestering carbon [3,4,5]. In addition, wetland plants can also promote the exchange of material and energy in wetlands. The formation and evolution process of wetlands can be inferred by analyzing the survival, growth and reproduction characteristics of wetland plants [6]. The wetland vegetation can also provide habitat for the survival and reproduction of wild animals [7].
With the disturbance of human activities, such as land use changes, wetlands are undergoing the unprecedented pressures. The richness and diversity of wetland plants, as well as the habitats of endangered waterfowls are seriously threatened [8,9]. Plant species diversity can characterize the structural complexity of biological communities and reflect the structure type, development stage, stability degree and habitat differences in communities [10]. It is also the basis for plant communities to maintain the structure and function of ecosystems [11]. The composition and diversity of plant communities depend on evolutionary, geospatial and ecological factors, as well as land use changes and other driving factors [12]. As an important part of terrestrial ecosystems, wetlands could be disturbed by human activities such as grazing [13]. Livestock eat and tread vegetation, thus directly or indirectly changing the original characteristics of plant communities [14]. Grazing practice has an important impact on the species richness and abundance of wetland plant communities [15]. The increase in livestock amount and expansion of pasture area can destroy the self-repair ability of wetland ecosystem, inhibiting the development of marsh soils and facilitating the evolution into meadow soils [16].
In addition to grazing, mowing can also affect vegetation growth and succession in wetlands. For example, the increase in mowing frequency significantly changed the biomass allocation among leaves, stems, and roots [17]. High mowing frequency can reduce the canopy density of wetland vegetation and easily lead to the high temperature of soil surface under sunlight, which affect the growth of plants and even cause them to wither or die. It was also reported that low frequency of mowing after wetland plants gone dormant does not effectively stimulate the secondary emergence of plant [18]. Unreasonable land uses can damage wetland vegetation, and then bring a series of ecological problems such as wetland ecosystem degradation, biodiversity loss and carbon and nitrogen storage reduction [19]. Thus, the response of wetland vegetation to land use changes can be used to characterize the process of plant community succession.
Changes in wetland vegetation affect the circulation of nutrients and organic matter, and subsequently change wetland ecosystem functions such as biomass production [20], and plant functional groups change accordingly. Relevant studies have shown that human disturbance can lead to a reduction in biodiversity. For example, there is a unimodal response between human disturbance and grassland biodiversity [21]. Grazing practices may inhibit the growth of forbs species [22]. The intensive agricultural activities alter the quality and quantity of wetland biomes, leading to a loss of biodiversity and thus a degradation of ecological integrity [23]. The increased ecological niche differentiation caused by nitrogen input could result in a loss of species and diversity of low competitive advantage [24]. The variations of species diversity mentioned above are usually non-random, mainly due to the various responses of species to disturbances. Fertilizer application is also a very important determinant of changes in plant community characteristics. Grazing is associated with inputs of nitrogen- and phosphorus-rich excreta and other nutrients, which can have a significant impact on the composition and diversity of flora [25], promoting the emergence of stronger competitors and reducing the number of vulnerable wetland species that often lack competitiveness. In addition, changes in hydrological conditions due to land reclamation can also have a significant impact on community characteristics [26]. The resulting changes in species diversity have a significant impact on community productivity, which mainly depend on community composition or functional groups [27]. Studies on elucidating the response mechanisms of wetland vegetation functional groups to land use changes are needed for giving insight into the degradation or restoration processes of wetland ecosystems.
The wetlands of the western Songnen Plain, located on the migratory route of water birds from the East Asia to Australia, not only carry the important ecological function of the habitat of rare water birds, but also play a crucial role in preventing land salinization and desertification [28]. Under the disturbance of human activities, such as over-exploitation of resources, grazing and reclamation of wetlands, combining with the influence of natural factors including precipitation decrease and evaporation increase, the area of wetlands in the Songnen Plain has been decreased by 38.8% at the beginning of the 21st century [29]. The degradation of wetland vegetation caused by human activities has become increasingly prominent and is receiving increasing national and local attention. It is urgent to explore the response of wetland plant communities to land use changes, and the driving mechanisms of community succession. The objectives of this study were to (1) elucidate the turnover of wetland plant types under the influence of land use changes, (2) determine the composition of plant communities in different wetlands, (3) and reveal the relationship between resource allocation among different functional groups and plant diversity. This study could provide a theoretical basis for the restoration and protection of degraded wetlands in this area.

2. Materials and Methods

2.1. Research Area

The Momoge wetlands on the west bank of Nenjiang River in the western Songnen Plain were selected as research area in this study. The area is located on Zhenlai County, Baicheng City, Jilin Province (45°28′ N–46°18′ N, 122°47′ E–124°43′ E), with an altitude of 130 m–150 m, a total area of 1440 km2 and 243 lakes, and rich biological resources [29]. The climate type is continental monsoon climate, with an average annual precipitation of 380 mm (about 70.0–80.0% occurs from June to August), an average annual evaporation of 1472 mm, and an average annual temperature of 4.4 °C. The water source of marshes in the area were fed by tributaries of the Nenjiang River, surface water, and precipitation. There were Calamagrostis angustifolia-Carex spp. wetlands, Scirpus triqueter wetlands, Phragmites australis wetlands, and Suaeda salsa wet meadows, etc. The sampling wetlands were located on the floodplain along the Nenjiang River. The soil here belongs to meadow swamp soil.

2.2. Experimental Methods

Four wetlands undergoing land use changes were selected within the study area. They were mowing (mowed twice a year; TM), mowing + light grazing (2–3 sheep/ha; MSG), moderate grazing (7–8 sheep/ha; MG), and heavy grazing (15–18 sheep/ha; HG) wetlands. The grazing intensity was determined through field surveys. The natural wetlands without human disturbance were selected as the reference systems (RS). Due to the proximity of the study area to the Nenjiang River, the transects were set perpendicular to the Nenjiang River from east to west in order to eliminate the disturbance caused by hydrological gradient [30]. According to the methodology of Wassens et al. and the area of the study sites [31], three transects (100 m × 20 m) were set in each wetland. Within each transect, 3 quadrats (1 m × 1 m) were randomly set, with a total of 9 quadrats in each wetland. The plant species within the quadrat was recorded, and the plant species and their nomenclature were identified via the Flora of China [32]. The plant height was measured as the average height of 10 randomly selected plants. Plant density was determined by counting the number of individuals within each quadrat. Plant coverage is determined by visual inspection. All plants within each quadrat were removed at the ground level, and then collected. Plant functional groups are species or taxa that have similar responses to specific environmental factors. The plant species in five wetlands were divided into three functional groups, namely, grasses, sedges and forbs [33]. To determine root biomass, a small subquadrat (30 cm × 30 cm) within each quadrat was randomly selected, and 20 cm deep soil was dug out, dried and passed through a 2 mm sieve to separate the vast majority of roots in each sample. Fine roots remaining in the soil sample were further separated by spreading the sample on a shallow dish and filling the dish with distilled water, and allowing the outflow from the trays to pass through a 0.5 mm mesh sieve. Dry weights of all aboveground parts and isolated roots were measured after drying to constant weight at 65 °C [34].

2.3. Data Analyses

SPSS 20 software was used for data analyses. One-way analysis of variance, and multiple comparisons (LSD) were performed between treatments at p < 0.05 level. Linear regression analysis was performed on biomass and plant species diversity of the three plant functional groups, and correlation coefficients R2 and p < 0.05 were used to measure significant relationships.
The importance value (IV) of each species in the plant community was calculated by the following formula:
IV = (RC + RH + RD)/3
where RC is the relative coverage, RH is the relative height, and RD is the relative density
Plant diversity indices including Shannon–Wiener diversity index (H), Margalef richness index (R), and Pielou evenness index (E) were calculated by the following formulas:
( H ) = i = 1 s P i l n P i
( R ) = ( S 1 ) / ln N
( E ) = H / ln S
where Pi is the important value of i species, S is the total number of species observed in the wetland community, and N is the total number of individuals of the species.
Community similarity (I) is commonly used to assess the similarity between the wetlands undergoing land use changes and reference systems (the natural wetlands without human disturbance, RS) [33]. Community similarity index (I) was calculated using Sorenson’s index:
( I ) = 2 c / ( a + b ) × 100
where a is the number of species in wetlands undergoing land use changes, b is the number of species in reference systems, and c is the number of species in wetlands undergoing land use changes and reference systems.

3. Results

3.1. Species Composition Characteristics of Plant Communities in Wetlands

In RS wetlands, C. angustifolia was the dominant species with IV of 0.80, and the main associated species were Carex appendiculata and Polygonum persicaria with IV of 0.15 and 0.08, respectively (Table 1). The TM wetlands were dominated by C. appendiculata and C. angustifolia, and IV were 0.45 and 0.33, respectively. Artemisia selengensis was the main associated species with IV of 0.07 in these wetlands. The MSG wetlands was dominated by Carex humida with IV of 0.45, and the main associated species were C. angustifolia and P. persicaria with IV of 0.20 and 0.06, respectively. A. selengensis was the dominant species in MG and HG wetlands, and C. appendiculata and C. angustifolia were the associated plants in MG wetlands, with IV of 0.25 and 0.20. With the increase in grazing intensity, the associated species of HG wetlands were changed to C. humida and C. angustifolia.

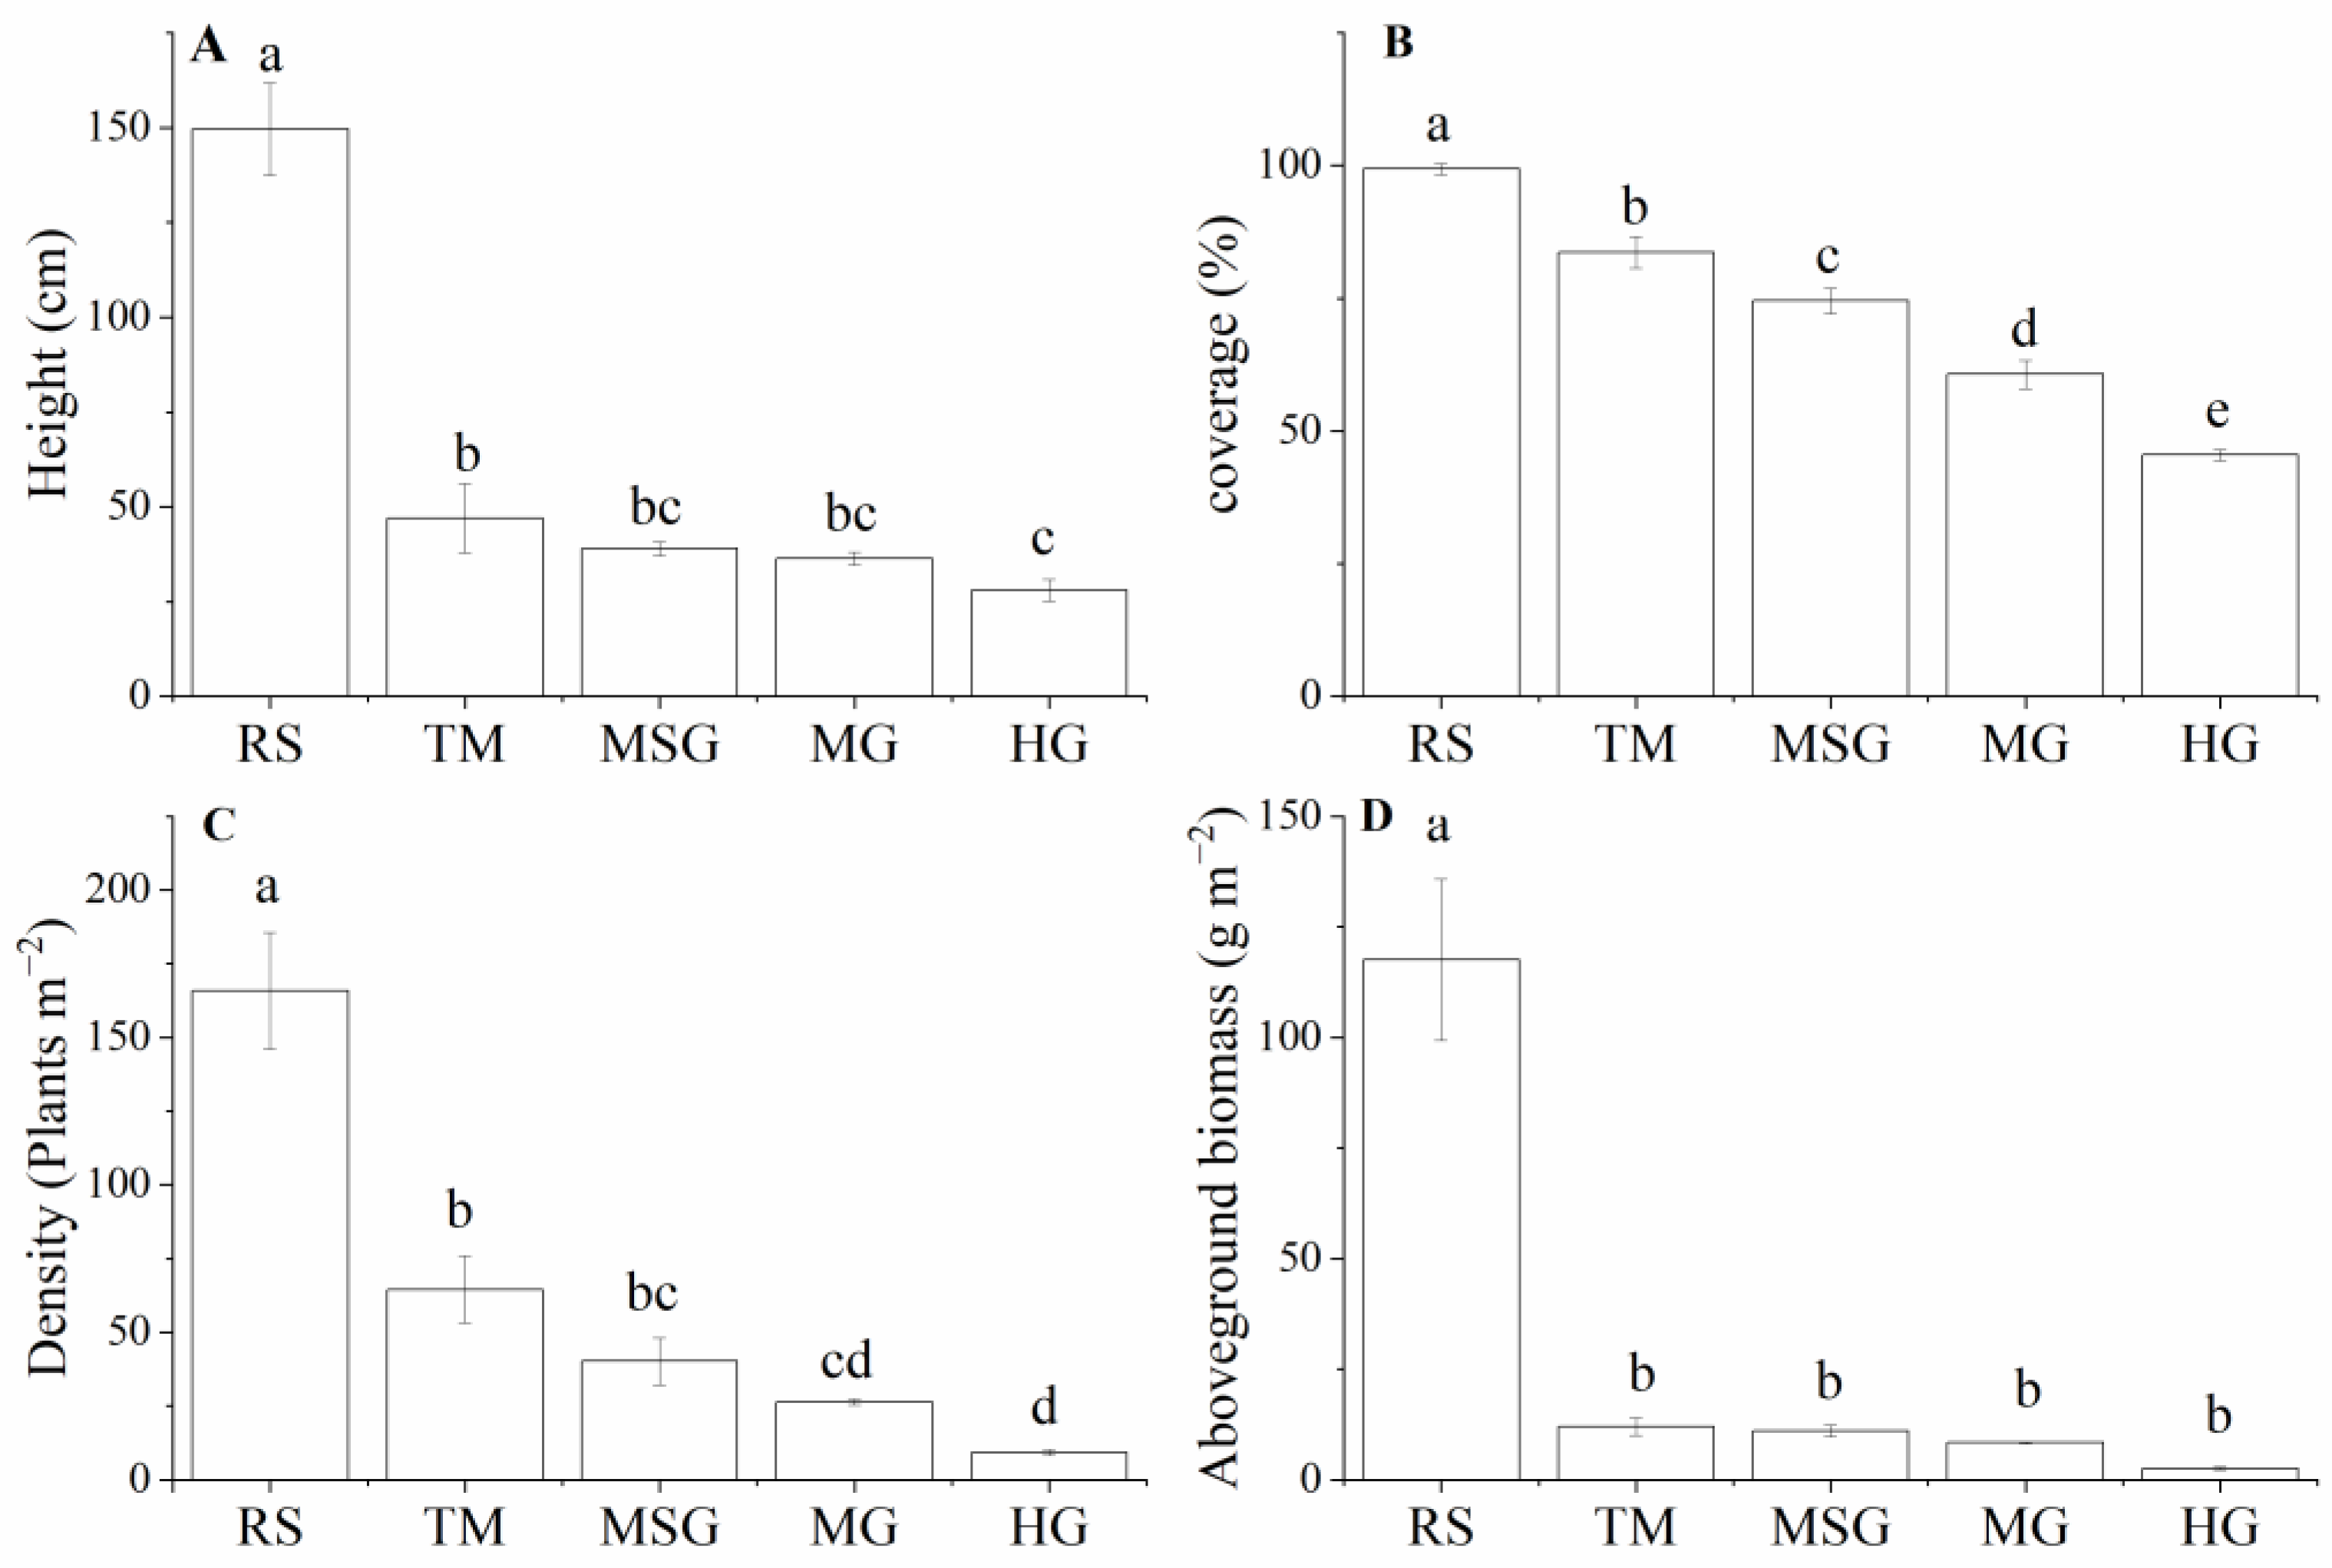
3.2. Variations of Plant Community Characteristics in Wetlands under Different Land Uses

The plant community characteristics in wetlands are significantly affected by land use changes (Figure 1). The plant height was 149.6 cm in the natural wetlands which was much higher than that in other wetlands (Figure 1A). In HG wetlands, the height of plant community was 28.0 cm, which was the lowest among these wetlands. The plant coverage in RS wetlands was the highest (99.3%), while the plant coverage in HG wetlands was the lowest (45.4%) (Figure 1B). The RS wetlands had the highest plant density of 165.8 plants m−2, while HG wetlands had the lowest density of 9.3 plants m−2 (Figure 1C). The aboveground biomass of plant community in RS wetlands was 117.5 g m−2, being the highest among these wetlands. Compared with RS wetlands, the aboveground biomass of TM, MSG, MG, and HG wetlands decreased by 90.3%, 91.6%, 93.8%, and 98.3%, respectively (Figure 1D).
For the root biomass, there were significant differences among the wetlands under different land uses (Figure 2). The root biomass of MSG wetlands was the highest (57.2 g m−2), whereas the lowest was observed in HG wetlands (p < 0.05). There was no significant difference in root biomass between TM and RS wetlands, which were 50.7 g m−2 and 50.9 g m−2, respectively (p > 0.05). In addition, the root biomass in MG wetlands was higher than that in HG wetlands (p < 0.05).

3.3. Plant Diversity in Wetlands under Different Land Uses

The diversity index of HG wetlands was 2.84, being the highest among the five wetlands (p < 0.05), while diversity index was the lowest in RS wetlands (Table 2). Similar with diversity index, the plant species richness of was significantly different among these wetlands (p < 0.05). The species richness of HG wetlands was the highest (3.27) (p < 0.05), followed by MG, MSG, and TM wetlands, with values of 1.77, 1.74, and 1.15, respectively. The species richness of RS wetlands was the lowest. In terms of evenness index, MG wetlands had the highest (p < 0.05), followed by TM, MSG, and MG wetlands, and RS wetlands had the lowest evenness index.

3.4. Similarity of Plant Communities to Reference System

The similarity index of plant communities in wetlands under different land use to natural wetlands showed that the community in TM wetlands had the highest similarity index of 45.1% (Figure 3), followed by the MSG and MG wetlands (p < 0.05). The community similarity index of HG wetlands was the lowest (17.7%). The community similarity index of MG wetlands was 36.8%, which was similar with that of MSG wetlands (p < 0.05).

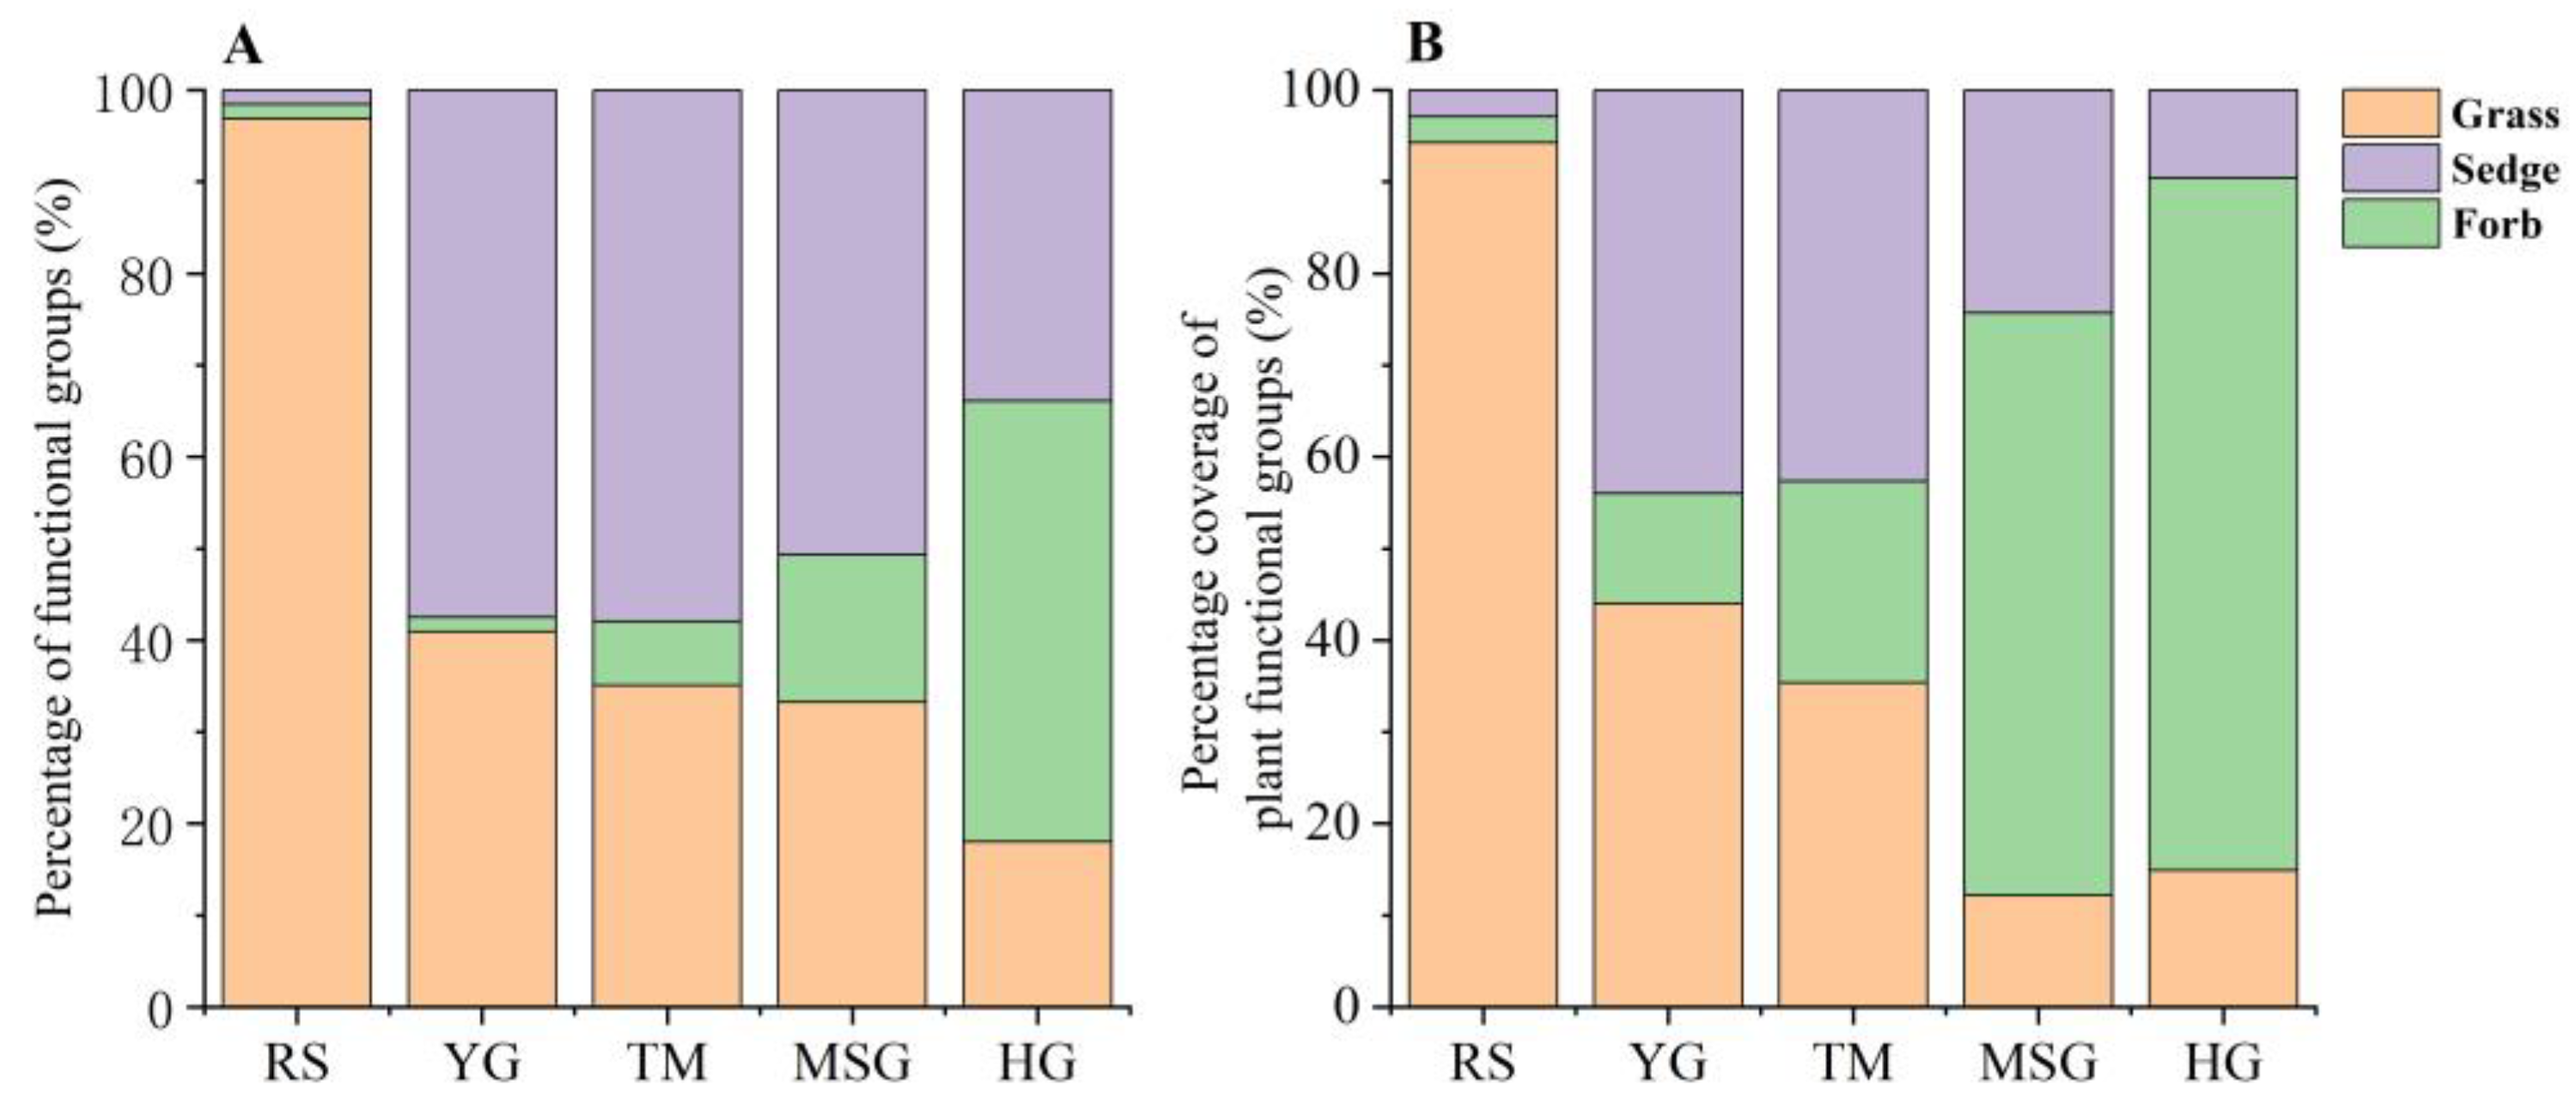
3.5. Composition Characteristics of Three Plant Functional Groups

The percentages of functional group and coverage of grasses in RS wetlands were 96.9% and 94.2%, respectively, which were higher than those of sedges and forbs (Figure 4). The percentages of functional group of forbs species were the lowest in RS wetlands (Figure 4A). The coverage percentages of sedges and grasses in TM wetlands were similar (Figure 4B). The highest percentages of functional group and coverage of sedge in MSG wetlands were 58.0% and 42.7%, respectively. In MG wetlands, the coverage percentage of forbs was the highest (63.5%), but the percentage of functional group coverage was the lowest (16.1%). The highest percentages of functional group and coverage of sedge in HG wetlands were 75.5% and 48.0%, respectively (Figure 4).

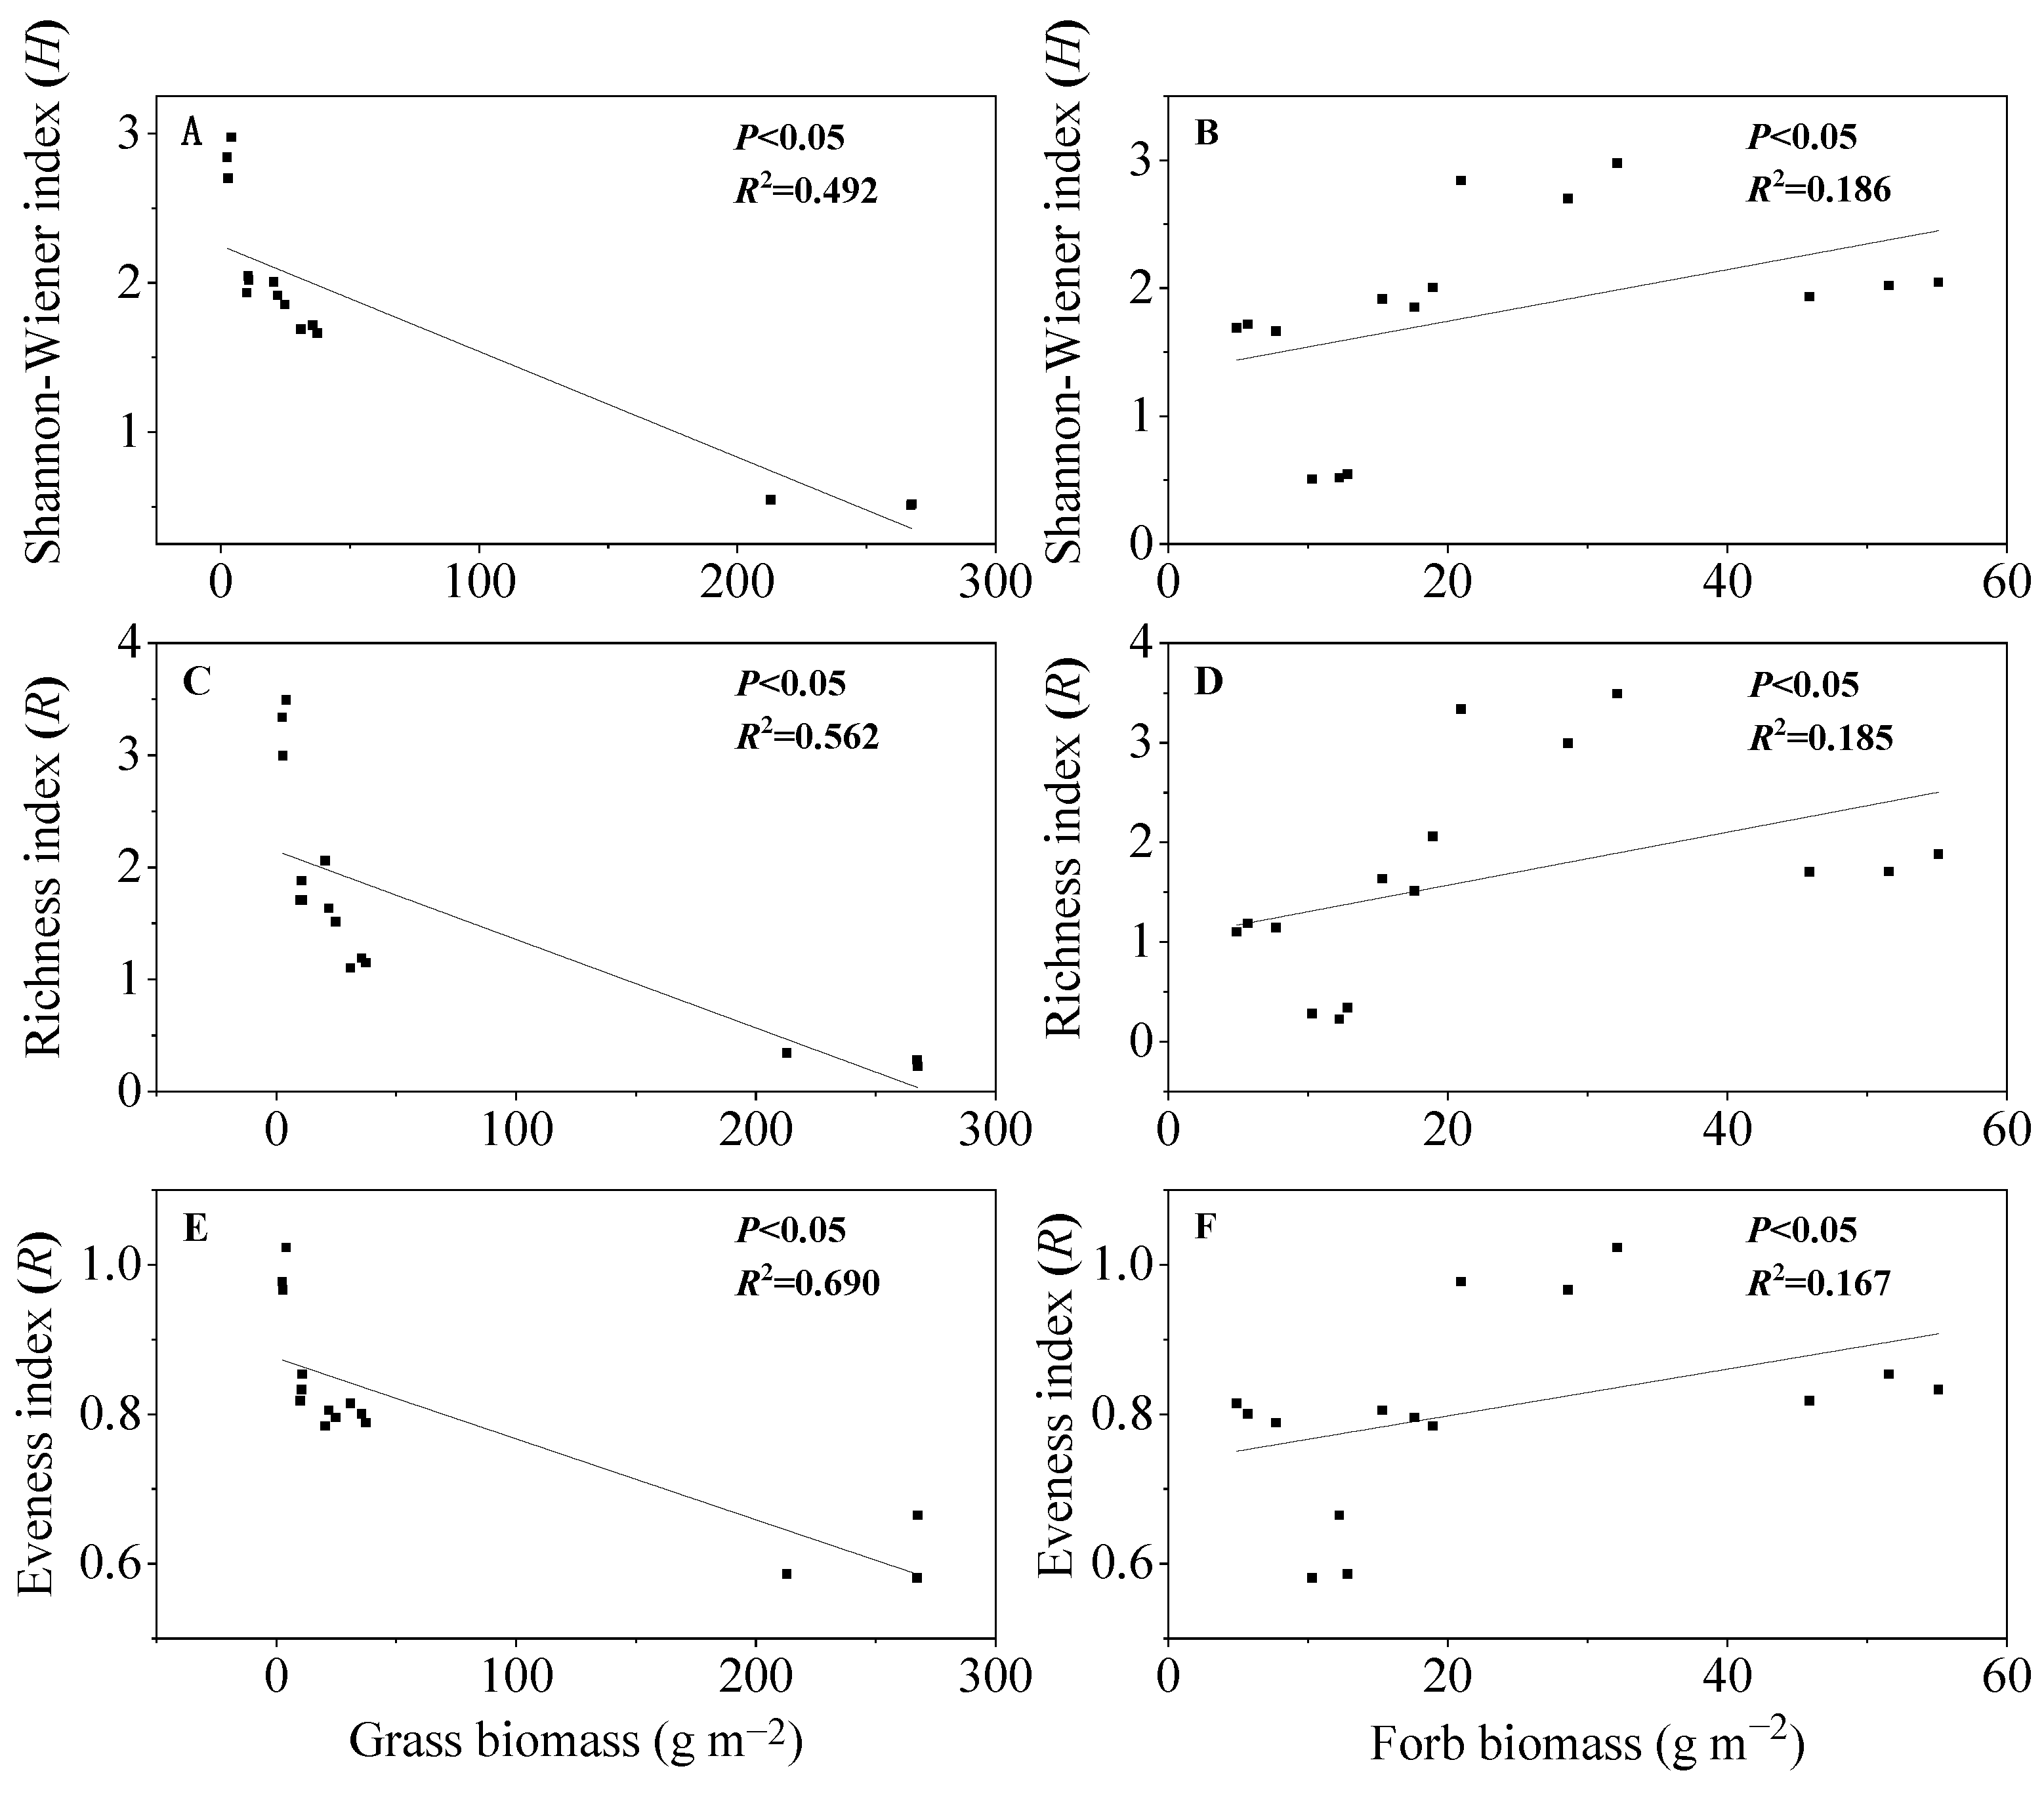
3.6. Relationships between Plant Functional Group Biomass and Species Diversity

According to the correlation analysis in Figure 5, Shannon–Wiener diversity index, richness index and evenness index had a significant regression relationship with the biomass of functional groups of grasses and forbs (p < 0.05). However, they had no significant relationship with the biomass of functional groups of sedges (data not shown in Figure 5). Shannon–Wiener diversity index, richness index, and evenness index were negatively correlated with grass biomass (Figure 5A,C,E), and positively correlated with the biomass of forbs (Figure 5B,D,F).

4. Discussion

Wetland plants play an irreplaceable role in the stability of wetland systems, and the degradation of wetland vegetation can give other species the chance to successfully invade, which directly leads to the degradation of wetlands [19]. This study found that with the intervention of land use changes, the vegetation types of the wetlands in the Songnen Plain were substantially alerted. In the reference systems, the dominant vegetation of C. angustifolia community was mainly formed. However, with the impacts of land use changes, such as mowing or grazing practices, the dominance of C. angustifolia was consequently decreased, and gradually became the associated species, while Carex spp. and A. selengensis gradually dominated the communities. In grazed wetlands, livestock activities negatively affect vegetation and soil environment, thus changing its species composition [35]. Under the influence of mowing and grazing, the dominance of A. selengensis increased, and it became the dominant species in heavily grazed wetlands instead of C. angustifolia and Carex spp. It is well known that A. selengensis usually grows in meadows and wet meadows, indicating that moderately and heavily grazed wetlands are being degraded to typical meadows or wet meadows. Grazing disturbance not only affects the growth of vegetation, but also provides space for other plant species to invade the original plant communities, and then change the dominant and associated species in wetlands. In addition, plant growth and reproduction have different response and adaptation strategies to the changed environment, which determine the replacement of vegetation types and dominant species, thus forming an intrinsic maintenance mechanism of plant community succession [36]. Therefore, the environmental changes and plant ecological adaptation jointly drive the changes in wetland vegetation types.
Management practices have influenced not only plant species composition and structure [37], but also plant characteristics [32]. The results of this study showed that characteristics of the wetland plant community responded differently to various land uses. In comparison to natural wetlands, mowing and grazing disturbances significantly reduced the height, coverage, and aboveground biomass of plant communities. Under the disturbance of grazing practice, the stems and leaves of plants are eaten by livestock, resulting in a reduction in plant leaf area and plant photosynthesis, which in turn affects plant growth and development [13]. Therefore, community characteristics such as plant density, height, coverage and aboveground biomass were significantly lower in heavily grazed wetlands than in other wetlands. It was reported that the moderate grazing intensity significantly increased root biomass allocation compared with aboveground parts [13]. In addition to increasing the proportion of root biomass allocated [38], grazing accelerates the nutrient circulation of plants, improves canopy radiation, enhances plant photosynthetic capacity, promotes resource redistribution, and provides fertilizer for plant growth by means of appropriate animal excreta added to the soil surface [39]. This also explained why the mowed and lightly grazed wetland had the highest root biomass among the five wetlands in this study.
Plant species diversity plays an important role in the ecosystem functioning [40], and is an important indicator reflecting the stability of the ecosystem [41]. Natural conditions and human disturbance, as well as their interactions affect the richness and diversity of plant species in wetland ecosystems [42]. The results of this study showed that the richness, diversity, and evenness of plant communities in the wetland were profoundly affected by land use changes. The plant diversity of human-managed wetland was generally higher than that of natural wetland, and with the intensification of management practices, the similarity of plant communities to natural wetland communities decreased gradually. The natural C. angustifolia wetlands have evolved for a long time without human activities, and the species composition tends to be dominated by a single species and the community tends to be stable [43]. Due to the outstanding dominance of C. angustifolia in natural wetlands, and its strong inhibitory effect on the competition of other associated species, are likely the key factors for the low plant diversity and richness. Under the influence of unreasonable human activities, wetland habitats for plants are degraded, and the number of typical wetland plants is reduced. Simultaneously, the emergence of mesophytes is accelerated. During this process, the habitats of plants tended to be complex and diverse. The typical marsh plants, wet meadow pants, or meadow plants were widely distributed, and the species diversity and richness increased accordingly [44]. This also explained the reason of the higher diversity in heavily grazed wetlands and lower similarity with natural wetlands in this study. In addition, another factor affecting species diversity in extensively grazed wetlands may be that the low similarity in community composition of wetlands under land use changes is determined by the variability of habitats and disturbance patterns [45].
Plant functional groups are species assemblies those have similar effects on major ecosystem processes [15], which can reflect the dynamics of plants to the changed environment [46]. The results of this study showed that the composition and structure of plant functional groups in human-managed wetland communities were significantly different to those in natural wetlands which is dominated by grasses. Different land uses have altered the plant growing environment, resulting in variations in the composition of plant functional groups. The number and coverage of sedge plants were increased in mowed and lightly grazed wetlands, while the degradation of grass plants was intensified. In the heavily grazed wetlands, forbs species began to dominate the community and competitively inhibited the growth of other functional groups, which may be because the grasses were more sensitive to human activities, or the ability to resist external disturbance was weak and degraded. This study further showed that the proportion of functional groups of sedges and grasses decreased in severely degraded wetlands caused by human activities, while forbs species became dominated. A related study also demonstrated that grazing intensity would directly affect the combination proportion of plant functional community characteristics, and then lead to the changes in plant community [47].
The height, coverage, density, biomass and evenness of plant communities were decreased with the disturbance intensified [13,35,44,48]. In mowed wetlands, vegetation growth and reproduction are significantly affected after removing plant aboveground parts, and the biomass production of plant communities was decreased [49]. In heavily grazed wetlands, plant height and coverage were significantly reduced, causing soil to become exposed, evaporation to increase, and soil water to be reduced [50]. Simultaneously, it was conducive to the growth and development of xerophytes in forbs species. Therefore, the biomass of forbs species showed an increasing trend in this study. In addition, grazing practice is one of the main factors affecting the distribution pattern of plant resources [51]. In grazed wetlands, the growth of grasses is inhibited by selective grazing by livestock [52]. As a result, the biomass of grass species was increased in this study.
The relationship between plant productivity and diversity is usually controlled by the functional groups of plants in a community [53]. Environmental changes due to human activities (e.g., mowing, grazing) may degrade specific functional traits (e.g., higher plant or leaf nitrogen concentrations), altering species and functional group composition and significantly affecting ecosystem functions [54,55]. In this study, under the influence of grazing and mowing practices, the functional groups of wetland plants changed correspondingly, and the functional groups of grass significantly degraded. Environmental change has led to a decrease in the biomass of functional groups of grasses and an increase in the diversity of plant species, partly due to the decrease in soil moisture [56], resulting in a decrease in the number of plant species adapted to wet environments and an increase in the number of plant species adapted to dried environments. It also explains why the plant community structure changed from hygrophyte to xerophytic with the degradation of wetlands in this study. It was reported that dense distribution of one plant species can reduce light exposure to seedlings of other species, thereby limiting plant density and species number [57], resulting in lower species diversity than in long-term disturbed wetlands. In this study, plant functional groups were changed under the influence of human activities. The more grasses established in the community, the more resources are used, while other less competitive plants acquired less resources, limiting the development of other species and resulting in a reduction in species diversity [58]. In addition, due to the influence of human disturbance, the available space in the herb layer of the community increased, leading to the invasion of some forb species [59]. The biomass of the dominant forbs, which determines a large proportion of the community biomass [60]. Grasses and forbs functional group are the key factors affecting community structure, and regulating species diversity [61]. These existing results can explain why the plant diversity index was significantly correlated with grass and forb biomasses in this study. Therefore, the biomass distribution among functional groups can be used as a predictor for variation in species diversity. The plant functional strategies are likely an important internal mechanism for diversity maintenance.

5. Conclusions

In summary, the land use changes in wetlands in the semi-arid regions have led to variations in vegetation types, community characteristics and diversity. The natural wetlands without disturbance of human activities are dominated by C. angustifolia with the lower species diversity. Under the changes in land use, the vegetation types have been changed, and the dominant species evolved from C. angustifolia to Carex app. and A. selengensis. The plant diversity was highest in heavily grazed wetlands. The similarity of plant communities to the natural wetlands was highest in mowed wetlands and lowest in heavily grazed wetlands. In addition, the diversity index was negatively correlated with the functional group of grasses, and positively correlated with the forb biomass. Therefore, plant communities respond to land use changes through changes in resource allocation and adjustment of functional strategies.

Author Contributions

Conceptualization, Y.A.; methodology, X.W. (Xiaodong Wang); software, L.W.; validation, Y.A.; formal analysis, X.W. (Xiaodong Wang); investigation, X.W. (Xuan Wang); resources, T.S.; data curation, L.W.; writing—original draft preparation, L.W.; writing—review and editing, Y.A.; visualization, X.W. (Xuan Wang); supervision, S.T.; project administration, Y.A.; funding acquisition, Y.A. All authors have read and agreed to the published version of the manuscript.

Funding

This work was supported by the National Key Research and Development Program (2022YFF1300900), National Science & Technology Fundamental Resources Investigation Program of China (2019FY100600), National Natural Science Foundation of China (41871102), Key Research and Development Program of Ningxia Hui Autonomous Region, China (2021BEG02013), and Jilin Provincial Science and Technology Development Program, China (20200201016JC).

Institutional Review Board Statement

Not applicable.

Informed Consent Statement

Not applicable.

Data Availability Statement

Not applicable.

Conflicts of Interest

The authors declare no conflict of interest.

References

  1. Adams, C.R.; Hovick, S.M.; Anderson, N.O.; Kettenring, K.M. We can better manage ecosystems by connecting solutions to constraints: Learning from wetland plant invasions. Front. Environ. Sci. 2021, 9, 715350. [Google Scholar] [CrossRef]
  2. Åhlén, I.; Thorslund, J.; Hambäck, P.; Destouni, G.; Jarsjö, J. Wetland position in the landscape: Impact on water storage and flood buffering. Ecohydrology 2022, 15, 2458. [Google Scholar] [CrossRef]
  3. Villa, J.A.; Mitsch, W.J. Carbon sequestration in different wetland plant communities in the Big Cypress Swamp region of southwest Florida. Int. J. Biodivers. Sci. Ecosyst. Serv. Manag. 2014, 11, 17–28. [Google Scholar] [CrossRef]
  4. Bannister, J.W.; Clairmont, L.K.; Stevens, K.J.; Slawson, R.M. Exposure to elevated nutrient load results in structural and functional changes to microbial communities associated with riparian wetland plants Phalaris arundinaceae and Veronica anagallis-aquatica. Rhizosphere 2021, 18, 100350. [Google Scholar] [CrossRef]
  5. Brunhoferova, H.; Venditti, S.; Schlienz, M.; Hansen, J. Removal of 27 micropollutants by selected wetland macrophytes in hydroponic conditions. Chemosphere 2021, 281, 130980. [Google Scholar] [CrossRef]
  6. Colmer, T.D.; Pedersen, O. Underwater photosynthesis and respiration in leaves of submerged wetland plants: Gas films improve CO2 and O2 exchange. New Phytol. 2007, 177, 918–926. [Google Scholar] [CrossRef]
  7. Yao, S.Y.; Chen, C.; Chen, Q.W.; Cui, Z.; Zhang, J.Y.; Zeng, Y.H. Impact of short-term hydrological components on landscape pattern of waterbird habitat in floodplain wetlands. Water Resour. Res. 2022, 58, 031822. [Google Scholar] [CrossRef]
  8. Carney, K.M.; Sydeman, W.J. A review of human disturbance effects on nesting colonial waterbirds. Waterbirds 1999, 2222, 68–79. [Google Scholar] [CrossRef]
  9. Goodwillie, C.; McCoy, M.W.; Peralta, A.L. Long-term nutrient enrichment, mowing, and ditch drainage interact in the dynamics of a wetland plant community. Ecosphere 2020, 11, e03252. [Google Scholar] [CrossRef]
  10. Nagaraja, B.C.; Somashekar, R.K.; Bunty, R.M. Tree species diversity and composition in logged and unlogged rainforest of Kudremukh National Park, South India. J. Environ. Biol. 2005, 26, 627–634. [Google Scholar]
  11. He, Y.Z.; Huang, W.D.; Zhao, X.; Lv, P.; Wang, H.H. Review on the impact of climate changes on plant diversity. J. Desert Res. 2021, 41, 59–66. [Google Scholar]
  12. Möls, T.; Vellak, K.; Vellak, A.; Ingerpuu, N. Global gradients in moss and vascular plant diversity. Biodivers. Conserv. 2013, 22, 1537–1551. [Google Scholar] [CrossRef]
  13. Gu, C.; Chen, W.J.; Du, Y.F.; Wang, Y.T.; Zhao, T.Q.; Zhao, M.L. Stocking rates affect the resource allocation pattern of Artemisia frigidain the inner mongolia desert steppe. Acta Ecol. Sin. 2017, 37, 2237–2243. (In Chinese) [Google Scholar]
  14. Tahmasebi, P.; Khedri, H.A.; Ebrahimi, A.A. Effect of livestock grazing on reproductive characteristics of plant communities in steppe rangelands. Iran. J. Range Desert Res. 2013, 20, 345–357. [Google Scholar]
  15. Diaz, S.; Cabido, M. Plant functional types and ecosystem function in relation to global change. J. Veg. Sci. 1997, 8, 463–474. [Google Scholar] [CrossRef]
  16. Davies, R.J.P.; Mackay, D.A.; Whalen, M.A.; Smyth, A.K. Vegetation and seed banks of arid ephemeral gilgai wetlands subject to contrasting grazing regimes. J. Arid. Environ. 2018, 154, 51–60. [Google Scholar] [CrossRef]
  17. Zhao, C.Z.; Li, G.D.; Li, Q.; Zhou, D.W. Effects of mowing frequency on biomass allocation and yield of Leymus chinensis. Rangel. Ecol. Manag. 2022, 83, 102–111. [Google Scholar] [CrossRef]
  18. Zheng, Y.C.; Wang, X.C.; Ge, Y.; Mawuli, D.; Zhao, Y.Q.; Xiong, J.Q. Effects of annual harvesting on plants growth and nutrients removal in surface-flow constructed wetlands in northwestern China. Ecol. Eng. 2015, 83, 268–275. [Google Scholar] [CrossRef]
  19. Ford, H.; Garbutt, A.; Ladd, C.; Malarkey, J.; Skov, M.W. Soil stabilization linked to plant diversity and environmental context in coastal wetlands. J. Veg. Sci. Off. Organ Int. Assoc. Veg. Sci. 2016, 27, 259–268. [Google Scholar] [CrossRef] [Green Version]
  20. Fu, H.; Yuan, G.; Ge, D.; Li, W.; Jeppesen, E. Cascading effects of elevation, soil moisture and soil nutrients on plant traits and ecosystem multi-functioning in Poyang Lake wetland, China. Aquat. Sci. 2020, 82, 34. [Google Scholar] [CrossRef]
  21. Grime, J.P. Competitive exclusion in herbaceous vegetation. Nature 1973, 242, 344–347. [Google Scholar] [CrossRef]
  22. Wu, G.L.; Du, G.Z.; Liu, Z.H.; Simon, T. Effect of fencing and grazing on a Kobresia-dominated meadow in the Qinghai-Tibetan Plateau. Plant Soil 2009, 319, 115–126. [Google Scholar] [CrossRef]
  23. Masasi, A.; Gobolo, A.; Rwiza, I. Impacts of human activities on biodiversity of the Simiyu wetland, Tanzania. Afr. J. Trop. Hydrobiol. Fish. 2018, 16, 108–114. [Google Scholar]
  24. Niu, K.C.; Philippe, C.; Francesco, D.B.; Nicholas, M.; Du, G.Z.; Sun, S.C. Fertilization decreases species diversity but increases functional diversity: A three-year experiment in a Tibetan alpine meadow. Agric. Ecosyst. Environ. 2014, 182, 106–112. [Google Scholar] [CrossRef]
  25. Zelnik, I.; Čarni, A. Plant species diversity and composition of wet grasslands in relation to environmental factors. Biodivers. Conserv. 2013, 22, 2179–2192. [Google Scholar] [CrossRef]
  26. Gaberščik, A.; Krek, J.L.; Zelnik, I. Habitat diversity along a hydrological gradient in a complex wetland results in high plant species diversity. Ecol. Eng. 2018, 118, 84–92. [Google Scholar] [CrossRef]
  27. Smith, M.D.; Knapp, A.K. Dominant species maintain ecosystem function with non-random species loss. Ecol. Lett. 2003, 6, 509–517. [Google Scholar] [CrossRef] [Green Version]
  28. Wei, J.; Gao, J.; Wang, N.; Liu, Y.; Wang, Y.W.; Bai, Z.H.; Zhuang, X.L.; Zhuang, G.Q. Differences in soil microbial response to anthropogenic disturbances in Sanjiang and Momoge Wetlands, China. FEMS Microbiol. Ecol. 2019, 95, fiz110. [Google Scholar] [CrossRef]
  29. Liu, Q.; Ma, H.W.; Tian, H.; An, Z.X. Analysis on the distribution change and influencing factors of the wetlands in Songnen Plain. Geol. Resour. 2010, 19, 76–80. (In Chinese) [Google Scholar]
  30. An, Y.; Song, T.J.; Zhang, Y.; Tong, S.Z.; Liu, B. Optimum water depth for restoration of Bolboschoenus planiculmis in wetlands in semi-arid regions. Hydrobiologia 2021, 849, 13–28. [Google Scholar] [CrossRef]
  31. Wassens, S.; Ning, N.; Hardwick, L.; Bino, G.; Maguire, J. Long-term changes in freshwater aquatic plant communities following extreme drought. Hydrobiologia 2017, 799, 233–247. [Google Scholar] [CrossRef]
  32. Editorial Committee of Flora of China. Flora of China; Science Press: Beijing, China, 2004. [Google Scholar]
  33. An, Y.; Gao, Y.; Tong, S.Z.; Lu, X.G.; Wang, X.; Wang, G.; Liu, X.H.; Zhang, D.J. Variations in vegetative characteristics of Deyeuxia angustifolia wetlands following natural restoration in the Sanjiang Plain, China. Ecol. Eng. 2018, 112, 34–40. [Google Scholar] [CrossRef]
  34. Hillhouse, H.L.; Tunnell, S.J.; Stubbendieck, J. Spring grazing impacts on the vegetation of reed canarygrass-invaded wetlands. Rangel. Ecol. Manag. 2010, 63, 581–587. [Google Scholar] [CrossRef] [Green Version]
  35. BiróM, M.Z.; Öllerer, K.; Lengyel, A.; Ulicsni, V.; Szabados, K.; Kiš, A.; Perić, R.; Demeter, L.; Babai, D. Conservation and herding co-benefit from traditional extensive wetland grazing. Agric. Ecosyst. Environ. 2020, 300, 106983. [Google Scholar] [CrossRef]
  36. Ren, G.H.; Deng, B.; Shang, Z.H.; Hou, Y.; Long, R.J. Plant communities and soil variations along a successional gradient in an alpine wetland on the Qinghai-Tibetan Plateau. Ecol. Eng. 2013, 61, 110–116. [Google Scholar] [CrossRef]
  37. Seimandi, G.; Mesa, L.; María, L.S.Z.; Saigo, M.; Gutiérrez, H. Effect of rotational grazing management on vegetation of floodplain wetlands. Wetl. Ecol. Manag. 2021, 29, 565–580. [Google Scholar]
  38. Poorter, H.; Niklas, K.J.; Reich, P.B.; Oleksyn, J.; Poot, P.; Mommer, L. Biomass allocation to leaves, stems and roots: Meta-analyses of interspecific variation and environmental control. New Phytol. 2012, 193, 30–50. [Google Scholar] [CrossRef] [PubMed]
  39. Zhang, Z.H.; Gong, J.R.; Wang, B.; Li, X.B.; Ding, Y.; Yang, B.; Zhu, C.C.; Liu, M.; Zhang, W. Regrowth strategies of Leymus chinensis in response to different grazing intensities. Ecol. Appl. 2020, 30, e02113. [Google Scholar] [CrossRef] [PubMed]
  40. Loreau, M.; Naeem, S.; Inchausti, P.; Bengtsson, J.; Grime, J.P.; Hector, A.; Hooper, D.U.; Huston, M.A.; Raffaelli, D.; Schmid, B.; et al. Biodiversity and ecosystem functioning: Current knowledge and future challenges. Science 2001, 294, 804–808. [Google Scholar] [CrossRef] [Green Version]
  41. Hautier, Y.; Tilman, D.; Isbell, F.; Seabloom, E.W.; Borer, E.T.; Reich, P.B. Anthropogenic environmental changes affect ecosystem stability via biodiversity. Science 2015, 348, 336–340. [Google Scholar] [CrossRef] [Green Version]
  42. Zotos, A.; Kosma, C.; Triantafyllidis, V.; Kakabouki, I.; Kehayias, G.; Roussis, I.; Mavroeidis, A.; Tataridas, A.; Bilalis, D. Plant species diversity of the wet meadows under natural and anthropogenic interventions: The case of the Lakes Amvrakia and Ozeros (W. Greece). Not. Bot. Horti Agrobot. Cluj-Napoca 2021, 49, 1–21. [Google Scholar] [CrossRef]
  43. May, R.M. Will a large complex system be stable? Nature 1972, 238, 413–414. [Google Scholar] [CrossRef] [PubMed]
  44. Tousignant, M.; Pellerin, S.; Brisson, J. The relative impact of human disturbances on the vegetation of a large wetland complex. Wetlands 2010, 30, 333–344. [Google Scholar] [CrossRef]
  45. Liu, T.T.; Wang, X.F.; Yuan, X.Z.; Gong, X.J.; Hou, C.L. Species composition and diversity of riparian vegetation in the river network of Xinjin county, Chengdu. Chin. J. Hydroecol. 2021, 42, 24–33. (In Chinese) [Google Scholar]
  46. Steinaker, D.F.; Jobbágy, E.G.; Martini, J.P.; Arroyo, D.N.; Pacheco, J.L.; Marchesini, V.A. Vegetation composition and structure changes following roller-chopping deforestation in central Argentina woodlands. J. Arid. Environ. 2016, 133, 19–24. [Google Scholar] [CrossRef] [Green Version]
  47. Zhang, Y.; Su, J.H.; Jing, G.H.; Cheng, J.M. Forbs dominate plant nutrient resorption of plant community along a 34-year grazing exclusion gradient in a semiarid grassland. Ecol. Eng. 2022, 175, 106497. [Google Scholar] [CrossRef]
  48. Díaz, S.; Lavorel, S.; Mcintyre, S.; Falczuk, V.; Casanoves, F.; Milchunas, D.G.; Skarpe, C.; Rusch, G.; Sternberg, M.; Noy-Meir, I. Plant trait responses to grazing-a global synthesis. Glob. Chang. Biol. 2007, 13, 313–341. [Google Scholar] [CrossRef]
  49. Moinardeau, C.; Mesléard, F.; Ramone, H.; Dutoit, T. Short-term effects on diversity and biomass on grasslands from artificial dykes under grazing and mowing treatments. Environ. Conserv. 2018, 46, 132–139. [Google Scholar] [CrossRef]
  50. Golluscio, R.A.; Martínez, G.G.; Cavagnaro, F.P. How does grazing affect soil water availability in the Patagonian steppe? J. Arid. Environ. 2022, 205, 104800. [Google Scholar] [CrossRef]
  51. Quezada, I.M.; Gianoli, E. Counteractive biomass allocation responses to drought and damage in the perennial herb Convolvulus demissus. Austral Ecol. 2010, 35, 544–548. [Google Scholar] [CrossRef]
  52. Ye, R.H.; Liu, G.F.; Chang, H.; Shan, Y.M.; Mu, L.; Wen, C.; Te, R.; Wu, N.T.; Shi, L.; Liu, Y.H.; et al. Response of plant traits of Stipa breviflora to grazing intensity and fluctuation in annual precipitation in a desert steppe, northern China. Glob. Ecol. Conserv. 2020, 24, e01237. [Google Scholar] [CrossRef]
  53. Hooper, D.U.; Adair, E.C.; Cardinale, B.J.; Byrnes, J.E.K.; Hungate, B.A.; Matulich, K.L.; Gonzalez, A.; Duffy, J.E.; Gamfeldt, L.; O’Connor, M. A global synthesis reveals biodiversity loss as a major driver of ecosystem change. Nature 2012, 486, 105–108. [Google Scholar] [CrossRef] [PubMed]
  54. Bernhardt-Römermann, M.; Römermann, C.; Sperlich, S.; Schmidt, W. Explaining grassland biomass—The contribution of climate, species and functional diversity depends on fertilization and mowing frequency. J. Appl. Ecol. 2011, 48, 1088–1097. [Google Scholar] [CrossRef] [Green Version]
  55. Busch, V.; Klaus, V.H.; Penone, C.; Schäfer, D.; Boch, S.; Prati, D.; Müller, J.; Socher, S.A.; Niinemets, Ü.; Peñuelas, J. Nutrient stoichiometry and land use rather than species richness determine plant functional diversity. Ecol. Evol. 2018, 8, 601–616. [Google Scholar] [CrossRef]
  56. Fidalski, J.; Bordin, I.; Alves, S.J.; de Cesare Barbosa, G.M. Grazing heights, stocking rate, soil structure, and water infiltration in a crop-livestock integration. Semin. Cienc. Agrar. 2021, 42, 123–135. [Google Scholar] [CrossRef]
  57. Ungar, I. Are biotic factors significant in influencing the distribution of halophytes in saline habitats? Bot. Rev. 1998, 64, 176–199. [Google Scholar] [CrossRef]
  58. Yan, R.R.; Zhang, Y.; Xin, X.P.; Wei, Z.J.; Wu, R.Q.; Guo, M.L. Effects of mowing disturbance on plant functional groups and diversity of leymus chinensis steppe. Sci. Agric. Sin. 2020, 53, 2573–2583. (In Chinese) [Google Scholar]
  59. Helm, N.; Essl, F.; Mirtl, M.; Dirnböck, T. Multiple environmental changes drive forest floor vegetation in a temperate mountain forest. Ecol. Evol. 2017, 7, 2155–2168. [Google Scholar] [CrossRef]
  60. Poggio, S.L.; Ghersa, C.M. Species richness and evenness as a function of biomass in arable plant communities. Weed Res. 2011, 51, 241–249. [Google Scholar] [CrossRef]
  61. Zhao, L.P.; Cui, Z.; Yu, L.; Chang, X.F.; Wu, G.L. Grazing exclusion erodes the forbs functional group without altering offspring recruitment composition in a typical steppe. Land Degrad. Dev. 2020, 31, 710–720. [Google Scholar] [CrossRef]
Figure 1. Plant height (A), coverage (B), density (C), and aboveground biomass (D) in the wetlands under different land uses. The bars represent the standard errors of the mean values. Different lowercase letters indicate significant differences among five wetlands (p < 0.05).
Diversity 14 01049 g001
Figure 2. Root biomass of plants in wetlands under different land uses. Different letters indicate significant differences among five wetlands (p < 0.05).
Diversity 14 01049 g002
Figure 3. Community similarity of wetlands under different land uses. Different letters indicate significant differences among the four wetlands (p < 0.05).
Diversity 14 01049 g003
Figure 4. Percentage of functional groups (A) and percentage of coverage of three plant functional groups (B) under different land uses.
Diversity 14 01049 g004
Figure 5. Linear regressions of biomasses of two functional groups (grasses and forbs) and plant diversity (Shannon–Wiener index, Richness index, and Evenness index). (A,C,E), linear regressions between grass biomass and indices of diversity, richness and evenness, respectively; (B,D,F), linear regressions between forb biomass and indices of diversity, richness and evenness, respectively. Lines represent significant regressions model at p < 0.05 level.
Diversity 14 01049 g005
Table 1. Three major plants in wetlands under five land uses and their important values (IV).
WetlandsSpeciesImportant Value (IV)
RSC. angustifolia0.80 ± 0.05 a
P. persicaria0.15 ± 0.02 b
C. appendiculata0.08 ± 0.01 b
TMC. appendiculata0.45 ± 0.01 a
C. angustifolia0.31 ± 0.01 b
A. selengensis0.07 ± 0.01 c
MSGC. humida0.45 ± 0.03 a
C. angustifolia0.20 ± 0.01 b
P. persicaria0.06 ± 0.01 c
MGA.selengensis0.30 ± 0.02 a
C. appendiculata0.25 ± 0.09 a
C. angustifolia0.20 ± 0.05 a
HGA. selengensis0.38 ± 0.02 a
C. humida0.20 ± 0.01 b
C. angustifolia0.16 ± 0.04 b
Notes: Different letters indicate significant difference among different species in the same wetlands (p < 0.05). RS, reference system, TM, mowing wetlands, MSG, mowing + light grazing wetlands, MG, moderate grazing wetlands, HG, heavy grazing wetlands. These are the same as below.
Table 2. Diversity index of wetland plant community under different land uses.
WetlandsDiversity Index (H)Richness Index (R)Evenness Index (E)
RS0.52 ± 0.02 d0.28 ± 0.05 d0.61 ± 0.01 d
TM1.69 ± 0.02 c1.15 ± 0.04 c0.80 ± 0.01 c
MSG1.92 ± 0.06 b1.74 ± 0.23 b0.79 ± 0.23 c
MG2.00 ± 0.05 b1.77 ± 0.08 b0.83 ± 0.01 b
HG2.84 ± 0.11 a3.27 ± 0.21 a0.99 ± 0.02 a
Notes: the values are the means ± SE. The lowercase letters followed indicate the significant differences among five wetlands at p < 0.05 level.
Publisher’s Note: MDPI stays neutral with regard to jurisdictional claims in published maps and institutional affiliations.

