Article

Population Structure of White Sturgeon (Acipenser transmontanus) in the Columbia River Inferred from Single-Nucleotide Polymorphisms

1
Hagerman Genetics Lab, Columbia River Inter-Tribal Fish Commission, Hagerman, ID 83332, USA
2
Department of Fisheries Management, Columbia River Inter-Tribal Fish Commission, Hagerman, OR 97232, USA
3
Genomic Variation Lab, Department of Animal Sciences, University of California-Davis, Davis, CA 95616, USA
4
Fish Science Solutions, Oregon City, OR 97045, USA
5
Yakama Nation Fisheries, Confederated Tribes and Bands of the Yakama Nation, Toppenish, WA 98948, USA
6
Fish and Wildlife Department, Kootenai Tribe of Idaho, Bonners Ferry, ID 83805, USA
*
Author to whom correspondence should be addressed.
Diversity 2022, 14(12), 1045; https://doi.org/10.3390/d14121045
Submission received: 31 October 2022 / Revised: 23 November 2022 / Accepted: 26 November 2022 / Published: 29 November 2022
(This article belongs to the Special Issue Conservation Genetics of Sturgeons)

Abstract

:
White sturgeon (Acipenser transmontanus) are the largest freshwater fish in North America, with reproducing populations in the Sacramento-San Joaquin, Fraser, and Columbia River Basins. Of these, the Columbia River is the largest, but it is also highly fragmented by hydroelectric dams, and many segments are characterized by declining abundance and persistent recruitment failure. Efforts to conserve and supplement these fish requires an understanding of their spatial genetic structure. Here, we assembled a large set of samples from throughout the Columbia River Basin, along with representative collections from adjacent basins, and genotyped them using a panel of 325 single-nucleotide markers. Results from individual- and group-based analyses of these data indicate that white sturgeon in the uppermost Columbia River Basin, in the Kootenai and upper Snake Rivers, are the most distinct, while the remaining populations downstream in the basin can be described as a genetic gradient consistent with an isolation-by-distance effect. Notably, the population in the lowest reaches of the Columbia River is more distinct from the middle or upper reaches than from outside basins, and suggests historically a higher or more recent gene exchange through coastal routes than with populations in the interior Columbia Basin. Nonetheless, proximal reaches were generally only marginally or non-significantly divergent, suggesting that transplanting larvae or juveniles from nearby sources poses relatively little risk of outbreeding depression. Indeed, we inferred examples of dispersal between reaches via close-kin mark-recapture and genetic mark-recapture that indicate movement between nearby reaches is not unusual. Samples from the Kootenai and upper Snake Rivers exhibited notably lower genetic diversity than the remaining samples as a result of population bottlenecks, genetic drift, and/or historical divergence. Conservation actions, such as supplementation, are underway to maintain population viability and will require balanced efforts to increase demographic abundance while maintaining genetic diversity.

1. Introduction

The Pacific Northwest of North America has seen a dramatic transformation over the last two centuries, including human population growth, urbanization, landscape modification from agriculture, forestry, mineral extraction, and intense wildfires, and alteration of riverscapes and flow regimes for irrigation, barge transport, and hydroelectric power. While of great benefit to some, these changes have come at tremendous cost for the indigenous peoples and organisms that inhabited this region before European colonization. Among the riverine organisms impacted by these changes, much focus has been placed on anadromous salmonids because of the iconic nature of their life history and the sheer abundance and biomass that their utilization of marine-derived resources supports. Much less attention has been paid to other native fishes that inhabit these rivers, including the largest freshwater fish in North America, the white sturgeon (Acipenser transmontanus), despite it sustaining an important ancestral and historical fishery.
Aside from their large size, with adults commonly reaching lengths >3 m, white sturgeon are notable for their longevity and fecundity: adults live for decades (up to 104 yrs [1,2]) and females release hundreds of thousands to millions of moderately sized eggs of 2–4 mm [2]. White sturgeon are “periodic” reproductive strategists [3]: after achieving sexual maturity at 15–30 years of age, females migrate every few years in spring to spawn in reaches with high velocity and turbulent flows, while males, which mature at slightly younger ages of 12–25, appear to spawn more often. After spawning, the negatively buoyant and adhesive eggs drift in the current until they attach to the substrate [4,5]. Recruitment in white sturgeon populations is positively correlated with strong spring flow regimes and likely naturally fluctuated historically as annual conditions varied [6]. Moreover, white sturgeon are amphidromous or at least euryhaline, with adults and sub-adults able to traverse along coastlines between river basins, and likely seek out different habitats within large river systems optimal for different life history stages [2,7,8]. Thus, while the longevity and fecundity of adults buffers populations through low-recruitment periods, long-term viability of white sturgeon depends on regularly favorable climate and flow conditions, as well as access to appropriate spawning and rearing habitat [2,6,9].
Despite this reliance on moving among river sections with life stage-appropriate conditions, the largest of the three remaining spawning populations of white sturgeon in the Pacific Northwest, in the Columbia River Basin (the others being the Fraser and Sacramento-San Joaquin River Basin populations), has been segmented and restricted for decades by the construction of hydroelectric dams, which preclude almost all migration of adult sturgeon [10] (Figure 1). The restriction of adults from appropriate spawning and rearing habitat as well as management of river flows for other purposes has restricted recruitment in many places and, combined with historical overfishing, has imperiled white sturgeon in many of the impounded and/or free-flowing river segments between dams, herein called “reaches” [6,11,12]. An additional population within the Columbia Basin, in the Kootenai River, is notable because it is listed under the Endangered Species Act due to declines in abundance of this unique population, which was isolated from the remaining Columbia Basin by glacial and anthropogenic barriers [13]. Like other sturgeon, white sturgeon are valued for their meat and caviar, and aquaculture of these species is not uncommon [2]. However, while there have been some efforts to supplement the river reaches with diminished abundance or recruitment through aquaculture and other means, these are largely still in the early or experimental phases e.g., [14], with only two long-term programs, in the Kootenai River and Canada/USA transboundary regions, implementing supplementation utilizing exclusively in situ origin broodstock or larvae [15,16].
Fundamental to plans to ensure conservation and fisheries for white sturgeon in the Columbia River Basin is an understanding of the genetic population structure among individuals in these reaches. Previous efforts using a handful of tandem-repeat (microsatellite) DNA markers have suggested an isolation-by-distance pattern of genetic structure within the Columbia River Basin, but were complicated by challenges establishing allelic dosage in this polyploid species, e.g., [17]. Here, we utilize a recently presented set of 325 single-nucleotide markers (SNPs) and samples from all the reaches of the Columbia Basin in which white sturgeon are consistently encountered, including the Kootenai and upper Snake River reaches, to address the following questions: (1) How does genetic structure within the Columbia Basin compare to divergences between Columbia River fish and those from other river basins (Sacramento, Fraser)? (2) Are collections of white sturgeon within reaches of the Columbia River distinct from one another; of what magnitude is the distinction, and across what distance? (3) Is dispersal evident between different reaches based on genetic data? (4) Is there evidence of a gradient of genetic diversity that is consistent with primarily downstream dispersal?

2. Methods

DNA was extracted from fin clips using non-denatured Chelex with manufacturer protocols (Sigma-Aldrich, St. Louis, MO, USA). A panel of 325 SNP markers was genotyped using a modified version of genotyping-in-thousands by sequencing (GT-seq) [18] which incorporates a utility that estimates ploidy for each individual based on read ratios from Illumina short-read sequencing [19]. Genotyping was repeated if genotypes were less than 80% complete, and only 4N ploidy (ancestrally 8N) individuals were included for further analyses (white sturgeon occasionally exhibit ploidy variation resulting from second polar body retention and autopolyploidization, e.g., [20]). SNP markers were assessed for completeness across individuals, and markers were omitted from further analysis if completeness was less than 80%.
Samples utilized herein derive from heterogeneous sources, including multiple tribal, federal, state, and utility organizations, years (1997–2019), life stages, collection methods, sampling strategies, and demographic histories (e.g., bottlenecks, stocking). Metadata were closely inspected to ensure that heterogeneity in sample origin would not affect results, but we also proactively filtered the dataset to remove potential sampling bias and utilized individual-based analyses to ensure that analysis units employed in group-based analyses were appropriate. Two datasets were arranged for statistical analyses. The first contained all individuals, including close relatives, to be utilized in identification of direct and transgenerational dispersal. A second dataset, for analysis of population structure, was filtered to remove first-degree relatives within a reach as well as any stocked but unmarked individuals, by reasoning that these would show a higher frequency of close relatives in the same reach. To do so, we calculated a maximum likelihood (ML) estimator of relatedness [21] in the program Polygene [22]. To identify appropriate cutoffs to distinguish first-degree, second-degree, and unrelated individuals, we estimated ML relatedness for a 5 male × 6 female known cross (334 offspring) of natural origin parents and ~700 other adults from the John Day reach (Supplemental Figure S1). Using the inferred cutoff for first-degree relatives (parent–offspring, full siblings), we identified related individuals in each reach, and removed individuals in order of those with the most relationships until no such relationships remained. We did not attempt to remove individuals with second-degree relationships (half-sibling, grandparent, aunt/uncle) because of the difficulty of reliably distinguishing these from unrelated individuals, in particular in more genetically depauperate reaches, as well as the unresolved debate over including related individuals in population genetic analyses when family groups may be unevenly distributed in space and time [23,24]. All filtering and datafile preparation were made using custom code (Supplemental File S1) in R (R Core Team; https://cran.r-project.org/, accessed on 31 October 2022).

2.1. Individual-Based Analyses

The dataset without first-degree relatives within each reach was used in several individual-based analyses to assess population genetic structure without a priori groupings. We analyzed this dataset in Structure v2.3.4 [25] using the location prior (r) and admixture model, running 100 k steps of burn-in followed by 100 k recorded steps, from which we plotted likelihood and r parameter values across each run to ensure convergence of the chain. We made 20 runs for each of one to sixteen clusters (k), and applied the ∆k statistic [26] in R (Supplemental File S1) after excluding outlier runs using the Grubbs test for outliers [27]. After determining the optimal clustering for the full dataset, we analyzed subsets of data, removing the most divergent clusters to identify further divisions within hierarchical structure [26,28]. We also performed principal component analysis (PCA) and discriminate analysis of principal components (DAPC) in the Adegenet package in R [29]. For DAPC, we implemented cross-validation for k-means clustering from two to fifteen clusters, optimizing the number of PC axes retained for each number of clusters. This allowed us to look at the amount of variance retained and proportional success of individual assignment to cluster as well as the Bayesian information criterion to choose the optimal number of clusters for each data arrangement. Two data arrangements were utilized with both PCA and DAPC: the full dataset, as well as a subset with only Columbia River Basin samples that excluded the upper Snake or Kootenai Rivers. Finally, we used the population assignment utility [30] in Genodive 3.06 [31,32], applying a significance value adjusted for the number of comparisons (p < 0.05/16 ≈ 0.003) to each population, and executing 1000 simulations. The populations to which individuals from each reach were assigned were tallied using R (Supplemental File S1).

2.2. Group-Based Analyses

Using reaches as putative populations, we estimated genetic divergence as G’’ST [33] using Genodive and tested whether these values were significantly different than zero using 1000 permutations and BH-FDR correction for multiple tests [34]. To examine additional evidence of isolation-by-distance, we plotted genetic distance (as raw G’’ST) against linear river and coastal distance for all populations and for only the central Columbia River Basin populations (without upper Snake or Kootenai Rivers). We calculated rarefied allelic richness, expected heterozygosity (genic diversity), and observed heterozygosity for each reach using the packages Adegenet and PopGenReport [35] in R, jackknifing across loci with 100 replicates of 50% data subset to reduce sensitivity to potential outlier loci (Supplemental File S1). We also calculated maximum likelihood estimates of individual inbreeding values using Adegenet, using both global and population-specific allele frequencies.

2.3. Dispersal

We estimated direct dispersal within the Columbia River Basin as genetic mark-recapture by identifying samples collected in different reaches with ML relatedness values, calculated with global allele frequencies, that were consistent with self-identity, indicating they were the same individual fish (Supplemental Figure S1). We also estimated transgenerational dispersal within the Columbia River Basin as close-kin mark-recapture by identifying samples in different reaches with ML relatedness that exceeded values reflecting first-degree relationships. Because these values had to be calculated using global allele frequencies, which may provide upwardly biased estimates of relatedness in genetically depauperate populations, we excluded the upper Snake and Kootenai reaches in this survey. We also applied a slightly higher cutoff for ML relatedness indicating first-degree relationship than in our filtering of the population structure dataset. We then corroborated the identification of first-degree siblings in the remaining reaches using the program Colony [36], applying an “all-vs-all” comparison and retaining those full or half-sibling pairs (dyads) which had a sufficient ML relatedness value and a pairwise dyad probability of sibship from Colony of ≥0.9. In order to utilize Colony, which is designed for diploid organisms, we re-coded the tetraploid genotype data as pseudo-dominant loci (a presence-absence pseudo-locus for each allele for each polyploid locus; [37]). We ran Colony with three medium chains, specifying dioecious reproduction and promiscuous mating. We tallied the number of dyads passing these criteria for each pair of reaches using custom R code (Supplemental File S1).

3. Results

We genotyped 3468 individuals, and retained 300 of 325 markers with sufficient genotyping completeness (Table 1; Supplemental Table S1). We were not able to obtain samples in the Snake River between Swan Falls Dam and Hells Canyon Dam, nor between Grand Coulee Dam and Wells Dam in the upper Columbia River, which are regions of very low sturgeon abundance (Figure 1). Due to low sample sizes in certain reaches, we pooled samples in the reaches of the upper Snake River (Swan Falls Dam to Shoshone Falls) and mid-upper Columbia River (Priest Rapids Dam to Wells Dam), also regions of low sturgeon abundance, but tested the appropriateness of this pooling with individual-based analyses. Filtering of first-degree relatives within each reach using a relatedness cutoff of 0.35 resulted in a dataset of 3078 individuals (Table 1). This value was the 1.5% quantile for first-degree and 99.1% quantile for second-degree relatives in the John Day known-cross set using population-specific allele frequencies, indicating relatively robust discrimination (Supplemental Figure S1). We observed that using global allele frequencies to calculate ML relatedness reduced a modest downward bias in expected relatedness values in the known-cross set, but this resulted in noticeably higher and putatively erroneous identifications of relatives in the more genetically depauperate reaches (Supplemental Figure S1).

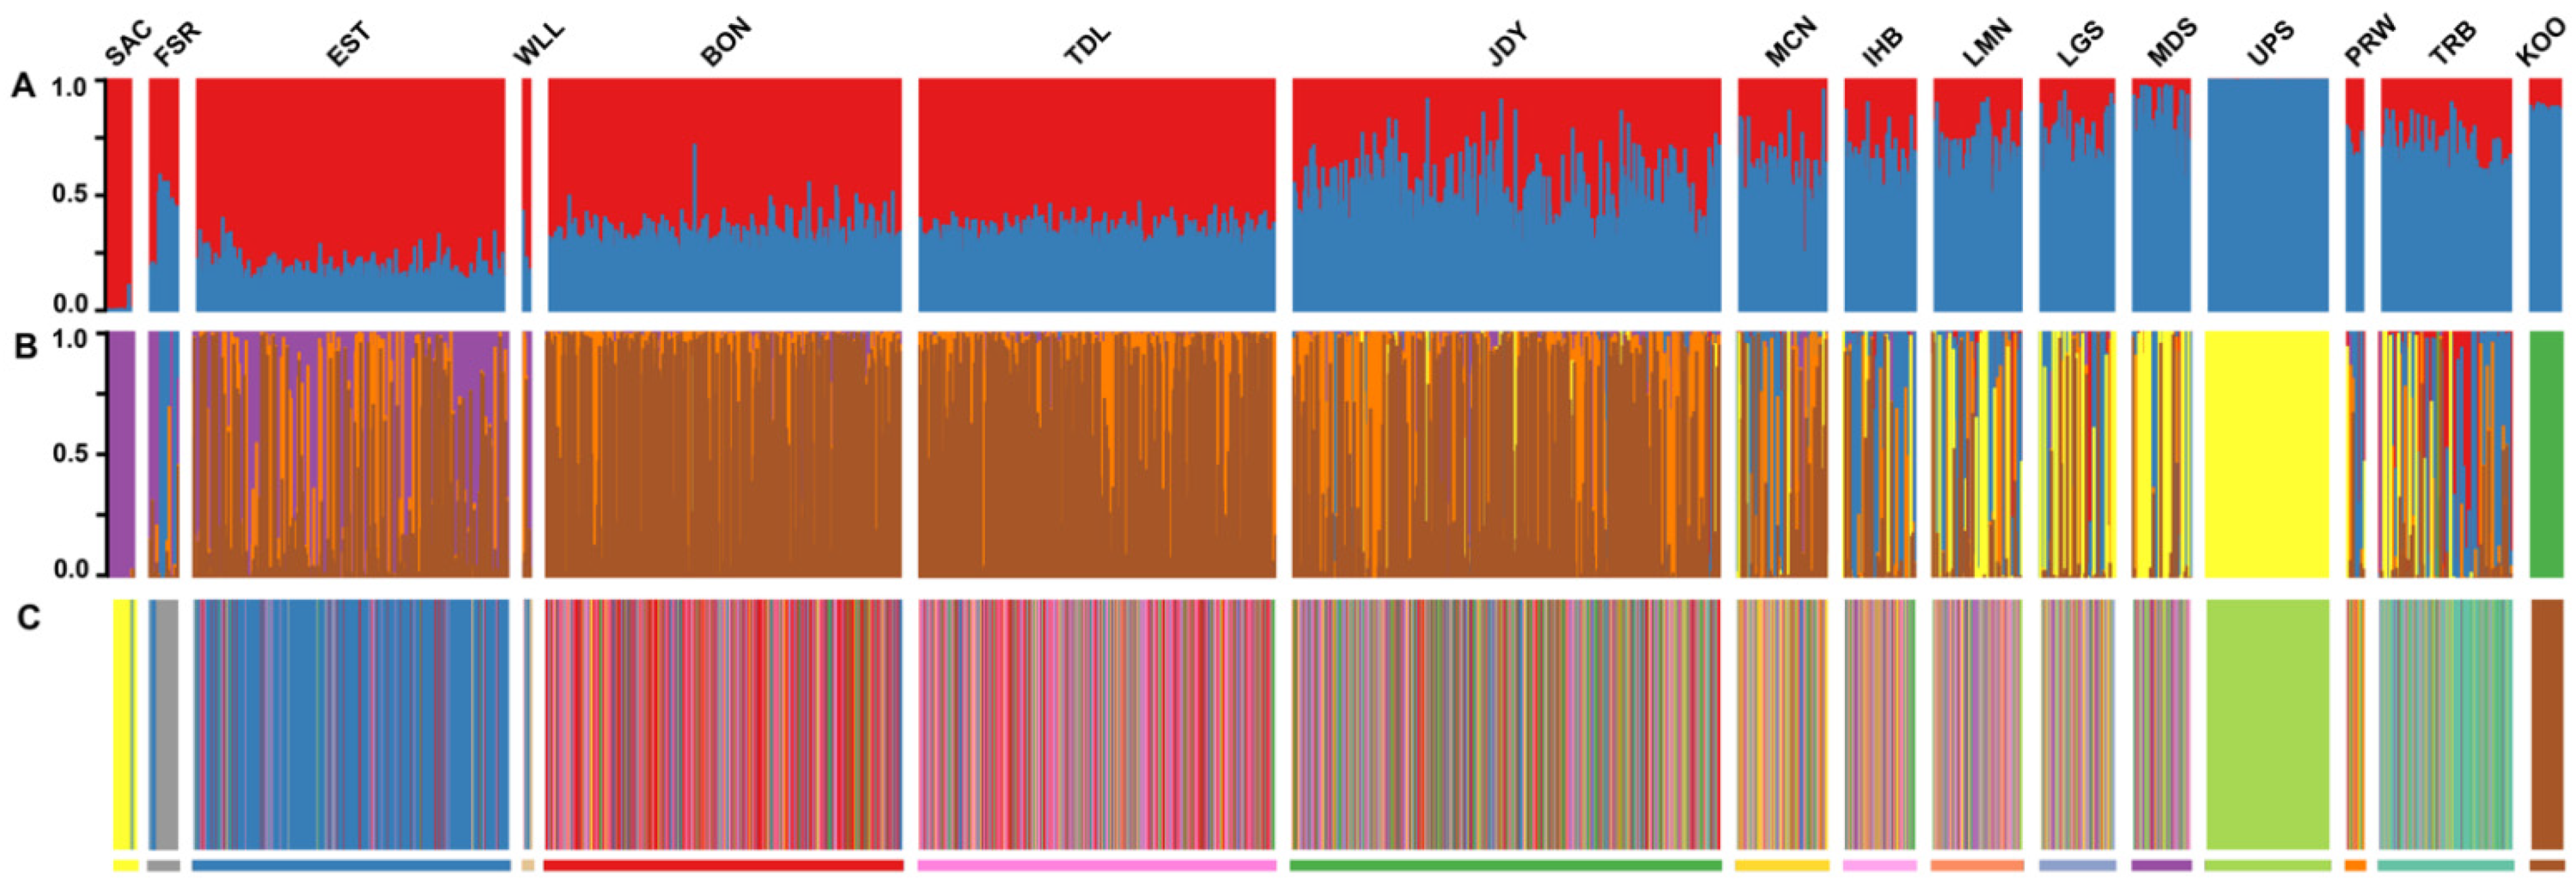
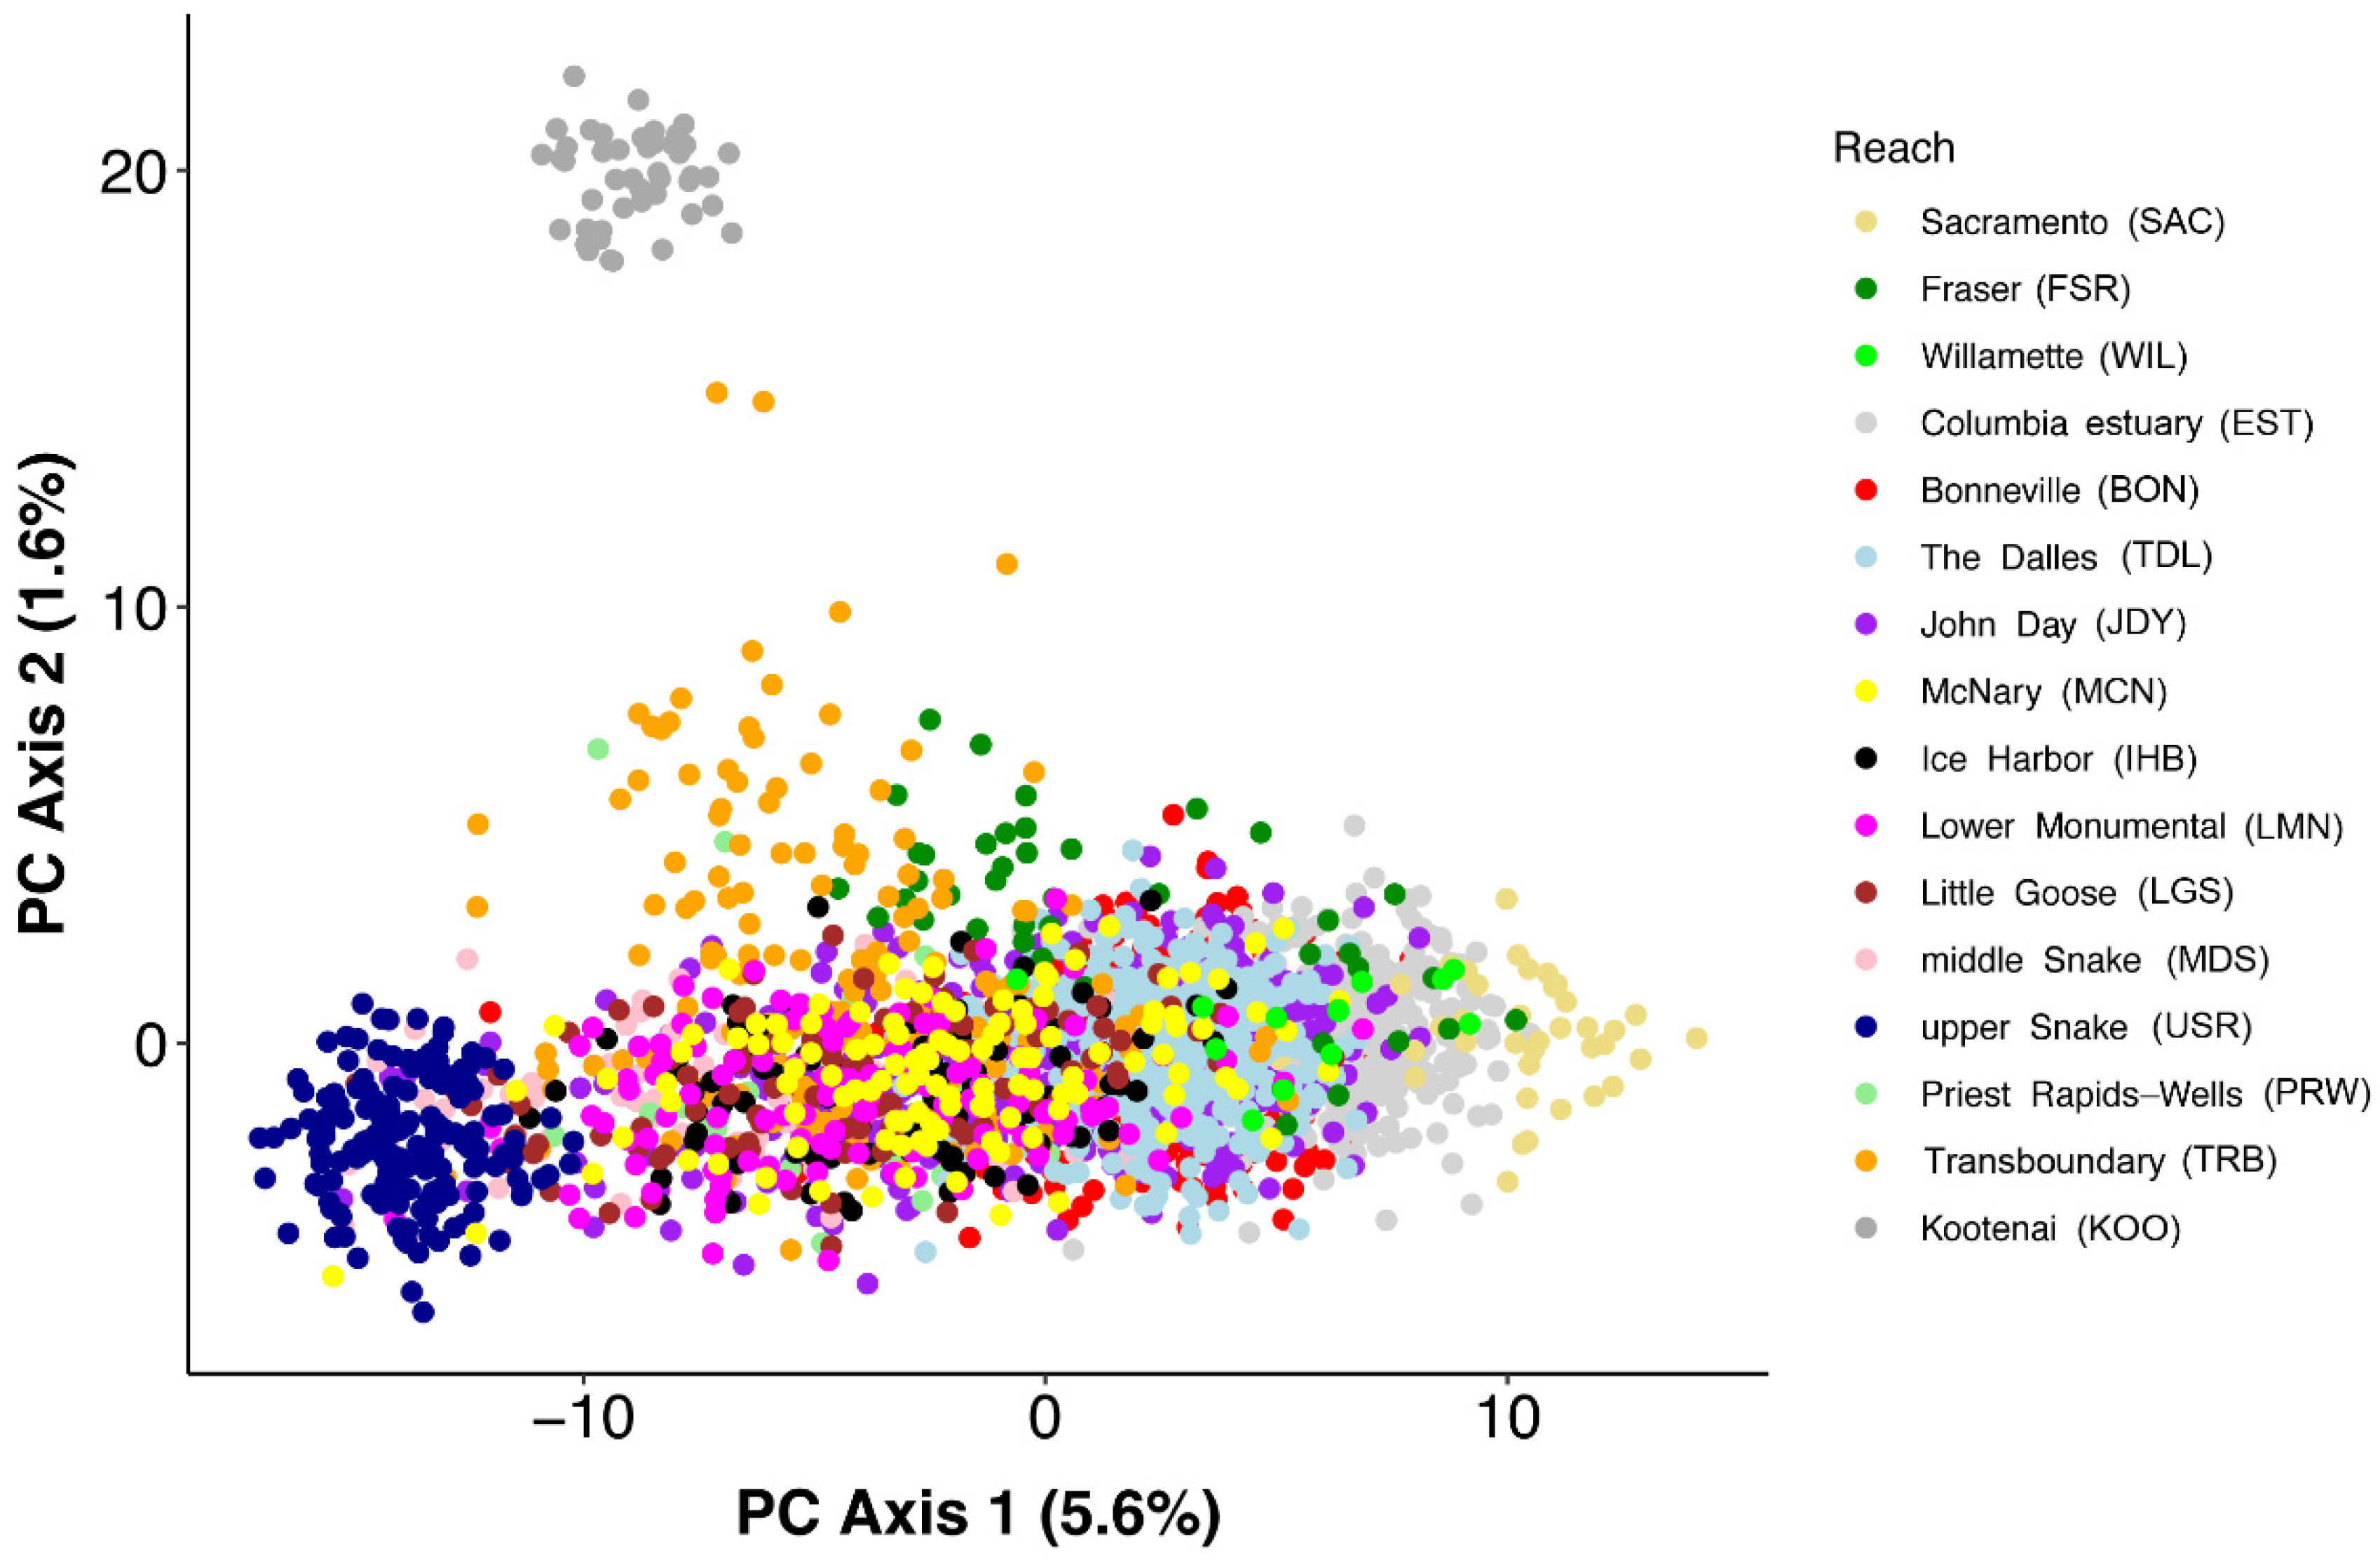
3.1. Individual-Based Analyses

Analysis of the relatedness-filtered dataset of 3078 individuals with Structure, with an optimized k = 2 clusters, revealed a gradient of divergence between the upper reaches of the Columbia River and the Fraser and Sacramento River basins (Figure 2, Supplemental Figure S2). In this gradient, white sturgeon from the lowest reaches of the Columbia were most similar to those in these outside basins. At k = 2, individuals from the upper Snake River exhibited the strongest divergence (representing the upriver end of the gradient). Notably, at k = 3, the Kootenai River formed a separate cluster and the Transboundary reach exhibited some affinity for this Kootenai cluster. At higher k values, artificial clusters formed which did not distinguish any homogenous groups of individuals (Supplemental Figure S2). This gradient pattern remained true after the other river basins were removed, and when the upper Snake and Kootenai River reaches were removed, the gradient was also still apparent, but only a single homogenous endpoint was apparent at the lower end (Supplemental Figure S2).
Principal component analysis recovered a similar pattern to Structure, with the first PC axis reflecting a gradient from the upper reaches to the lower reaches plus outside river basins, while the second axis distinguished the Kootenai River fish. Along the first axis, there was considerable overlap among fish from reaches distributed between the upper and lower ends (Figure 3). While the cross-validation procedure of the discriminant analysis of principal components (DAPC) produced evidence that k = 7 clusters were optimal, the first discriminate axis arrayed the clusters consisting of the upper Snake River and the lower reaches plus outside rivers on opposite ends of the axis, with clusters containing the other reaches distributed in between (Supplemental Figure S3). Like the PCA, there was considerable overlap of these other five clusters on the first axis, while the cluster containing the Kootenai River fish was distinguished on the second discriminate axis. Not surprisingly, while assignment success was high for the upper Snake, Kootenai, and outside-Columbia samples, it was strongly mixed for the other Columbia River reaches (Figure 2). When PCA and DAPC were repeated without the samples from the upper Snake, Kootenai, or outside river basins, the structure was consistent with the gradient on the first axis from previous analyses, but less distinct (Supplemental Figure S4). DAPC cross-validation indicated five clusters, but none of these clusters indicated homogenous groups of individuals, and assignment success to these clusters generally only reflected the same linear gradient, with the John Day reach strongly intermediate.
Population assignment with Genodive also indicated similar patterns of relative distinctness among reaches: the upper Snake and Kootenai populations had high assignment success, as did the Sacramento River Basin samples (Table 2, Figure 2), while fish from the Fraser River and Transboundary reach had moderately high self-assignment. Samples from other reaches had lower assignment-to-home proportions, although the reaches to which samples were assigned other than home reflected patterns familiar from the Structure and PCA results: samples in the lower reaches assigned largely to other lower reaches, while samples in the middle and lower Snake River assigned largely to those reaches. Notably, samples from John Day reach assigned more often to reaches down river from it (Bonneville, The Dalles) than to reaches above (McNary, lower Snake), while samples in the Priest Rapids-Wells Dam stretch assigned at similar rates to mid-lower reaches (John Day, McNary) and lower Snake River or upper Columbia reaches. Cumulatively, these results indicated that no reach within the Columbia Basin contained multiple distinct stocks such that utilizing reaches as group-wise analysis units would produce misleading inferences (e.g., a Wahlund effect).

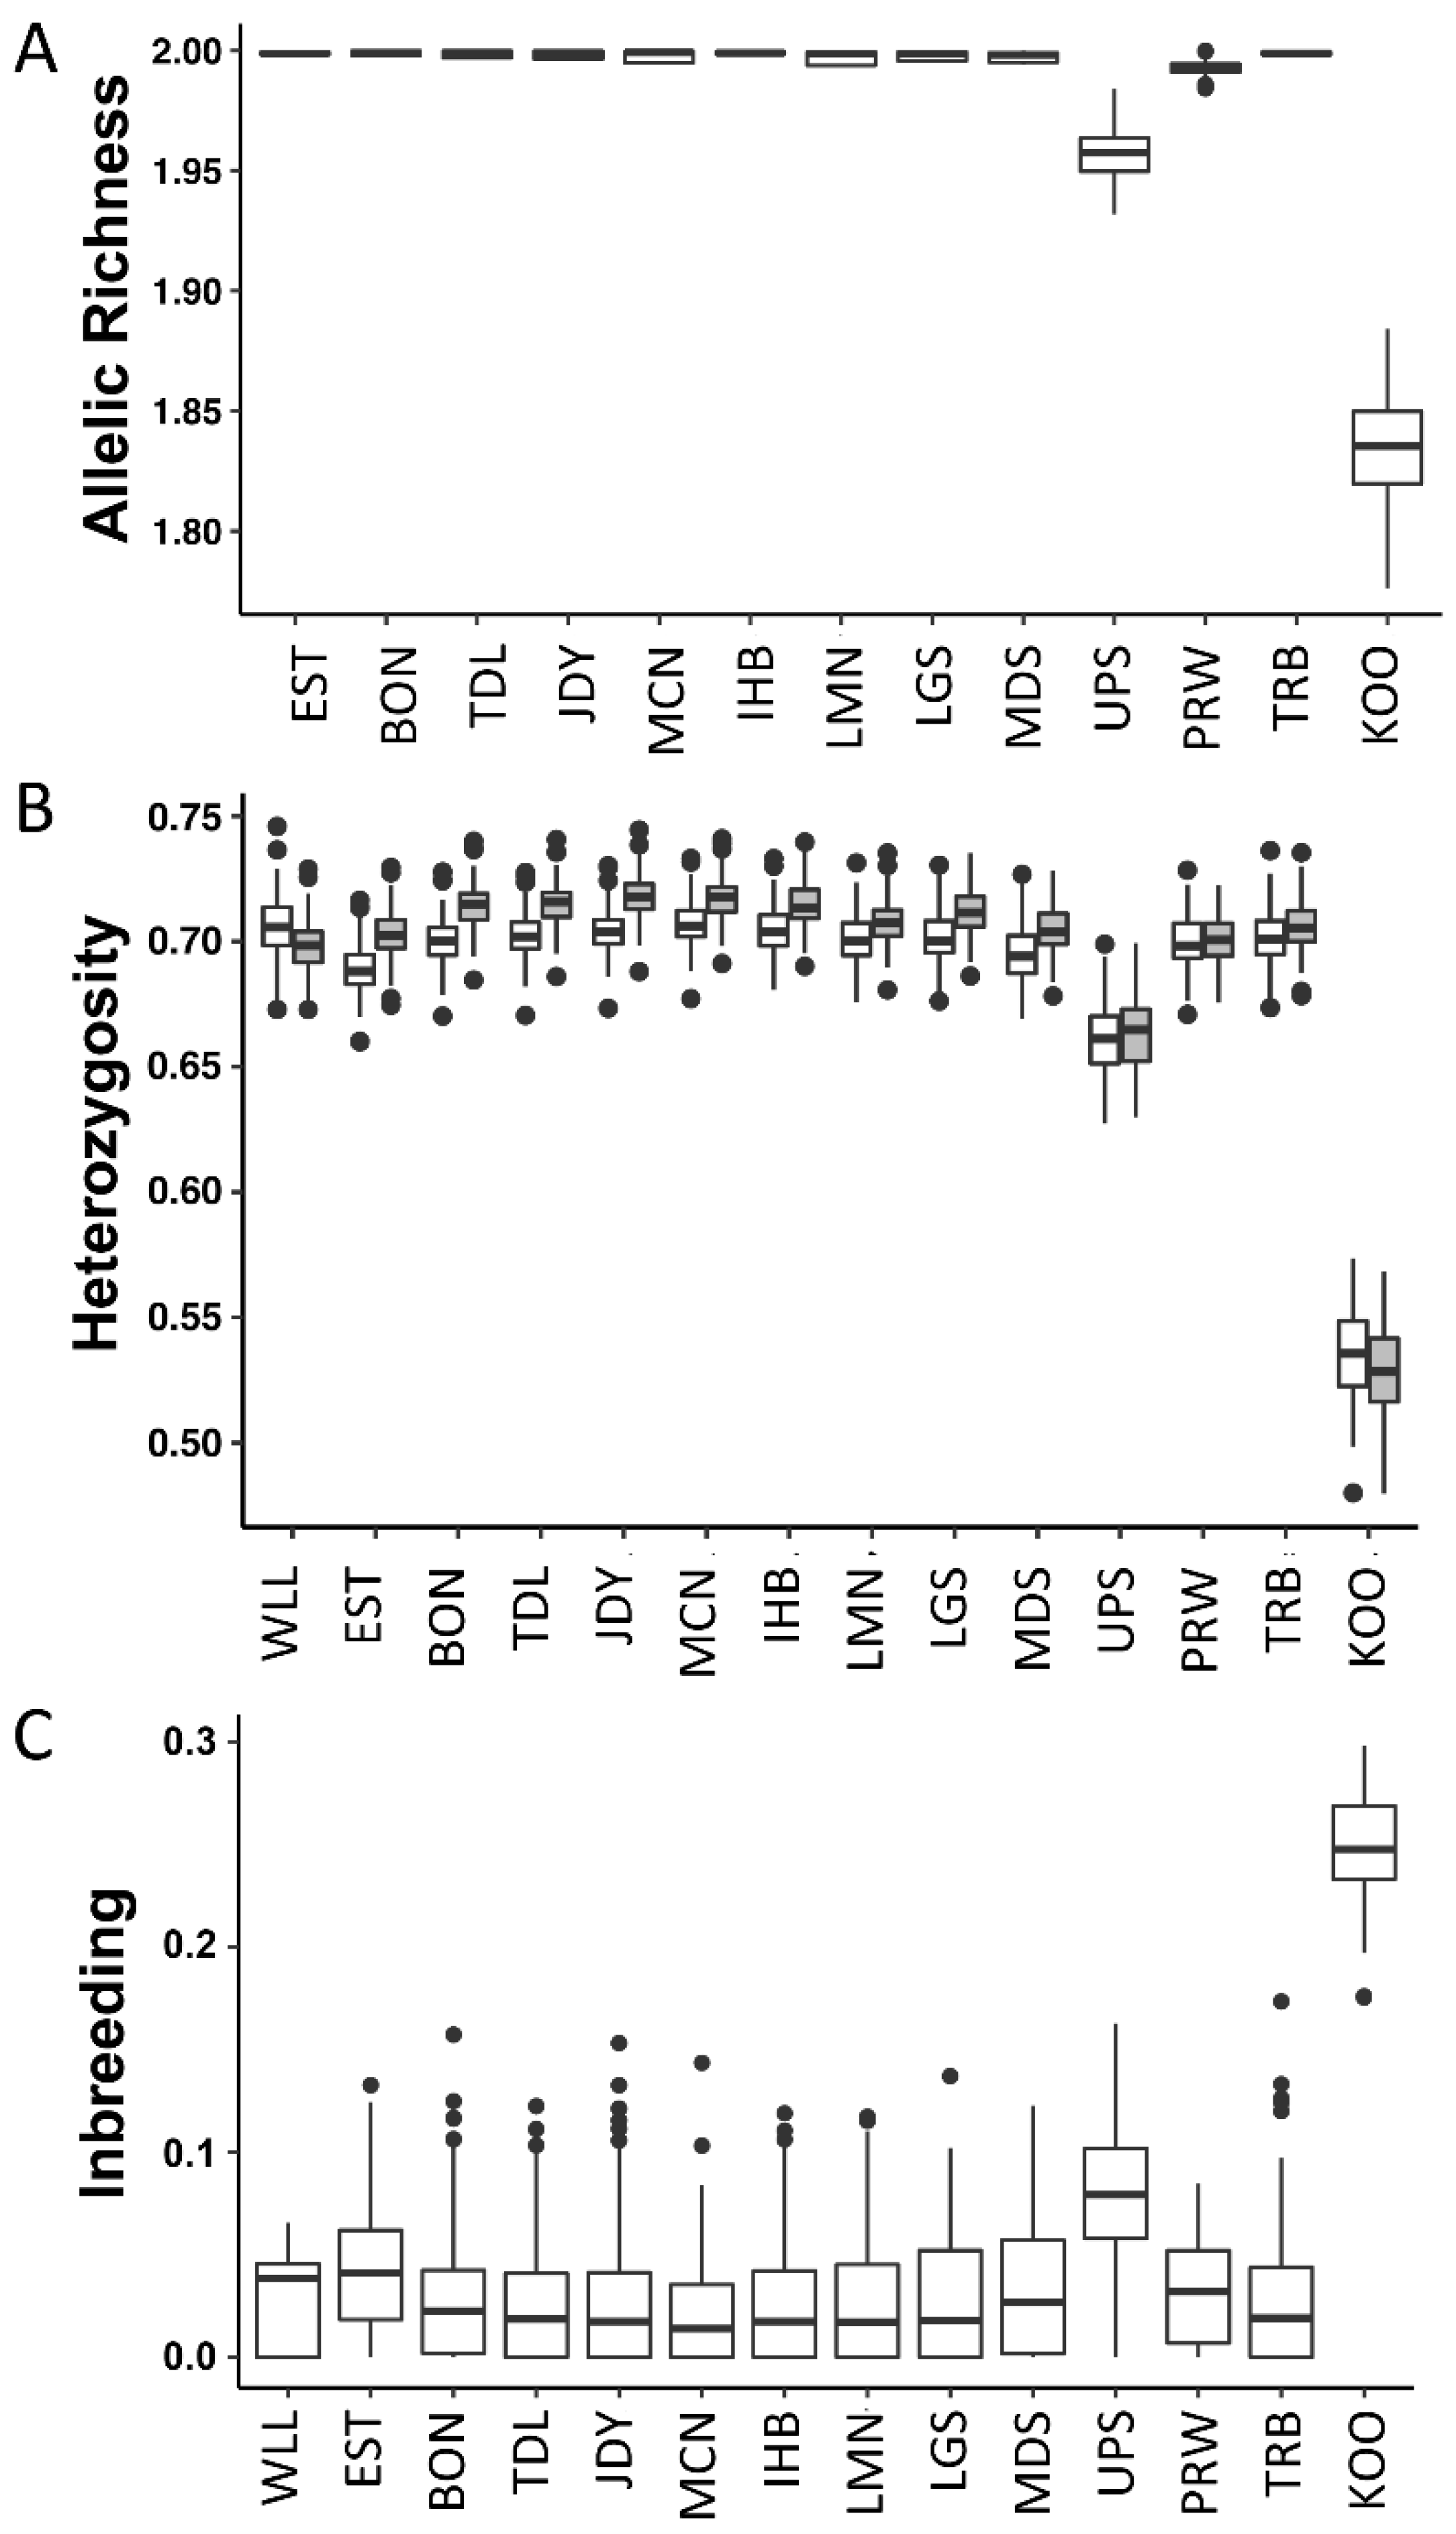
3.2. Group-Based Analyses

Quantification of genetic divergence among reaches reflected a wide range, with the highest divergences of G’’ST > 0.15 (e.g., upper Snake vs. lower Columbia or Sacramento; Kootenai vs. all) as well as marginal (G’’ST < 0.01, e.g., John Day vs. Bonneville or McNary) and non-significant divergence (lower Snake reaches) (Table 3). Within the Columbia River Basin, the pattern of divergence largely reflected an isolation-by-distance pattern, with some exceptions: the sample from the Kootenai reach exhibited divergence from others that was higher than that predicted by distance, while collections from the lower and middle Snake reaches exhibited a level of divergence from the Transboundary reach and the Priest Rapids-Wells Dam reach that were lower than expected by distance (Supplemental Figure S5).
The collections from the upper Snake and Kootenai reaches, which both have a history of population reduction or bottleneck, exhibited rarefied allelic richness and heterozygosity that were notably lower than the remaining reaches (Figure 4), followed by samples from the Priest Rapids-Wells Dam reach. Apart from these collections, there was some variation in richness and heterozygosity among reaches, albeit in a much smaller range, and it was not clearly correlated with stream order, i.e., greater downstream (Supplemental Figure S6). In examining the variation in maximum likelihood inbreeding estimates among individuals based on global allele frequencies, inbreeding reflected similar patterns to richness and heterozygosity (i.e., greater in Kootenai and upper Snake individuals). However, allowing for reach-specific frequencies, these reaches did not appear as outliers, and some of the highest values of inbreeding were in fish from the reaches with the highest population abundances (Supplemental Figure S6).

3.3. Identification of Dispersal

We observed a single pair of samples from different reaches that had ML relatedness consistent with deriving from the same fish (0.980), and the metadata for these samples were consistent with repeated capture as well: sampled first in the lower Snake River above Little Goose Dam in 2012, at which point it was 111 cm long, and again above Ice Harbor Dam in 2014, at which point it was 121 cm long. There was a strong but complex relationship between the probability of sibship from Colony and the ML relatedness estimates for the same pairs: individuals with the highest relatedness generally exhibited the highest probability of sibship, although there were some exceptions, particularly within reaches (Supplemental Figure S7). In identifying transgenerational dispersal from close-kin mark-recapture, we utilized a conservative relatedness cutoff of 0.45 based on global allele frequencies, with a 90% probability of sibship from Colony to confirm first-degree relatives among reaches. This higher relatedness cutoff reflected the 24.2% quantile of first-degree relatives for the John Day known-cross families based on global allele frequencies, indicating a loss of some probable true first-degree relatives in order to avoid falsely identifying others. Relatives identified with this method reflected dispersals among nearby reservoirs, crossing between one and three hydroelectric facilities (Table 4). Individuals from different reaches with high relatedness but probability of sibship below threshold, or vice versa, reflected the same dispersal patterns, except for three additional pairs of individuals between the Transboundary and Priest Rapids-Wells Dam reaches with Colony probability >0.9 but relatedness between 0.28 and 0.38, on par with full or half-siblings. We were not able to ascertain from metadata whether the inferred relationships represented parent–offspring, full sibling, or above average half-sibling, grandparent, etc., relationships, which makes the direction of dispersal difficult to ascertain, but these relationships are consistent with primarily downstream dispersal.

4. Discussion

4.1. Spatial Population Structure

The contemporary genetic structure of white sturgeon in the Columbia River Basin can adequately be described as a gradient of genetic divergence from upstream to lower reaches, consistent with a dispersal-limited (isolation-by-distance) effect observed by previous studies, e.g., [17]. This result was evident from both the individual- and group-based analyses we conducted. This gradient includes collections in the reaches from the middle Snake River and Transboundary reach to the Columbia below Bonneville Dam, and may include the upper Snake River as well, though the unavailability of samples from between Hells Canyon and Swan Falls Dams creates some uncertainty (but see [17]). Nonetheless, reaches in proximity generally only exhibit marginal or non-significant divergence, as measured by FST-analog or population assignment methods, suggesting that dispersal over short distances has historically been relatively unrestricted. The Kootenai River population, on the other hand, exhibits divergence beyond that predicted by this isolation-by-distance effect, consistent with previous analyses and the history of glacial barriers in this region [13]. Notably, the lower-mid Snake River and mid-upper Columbia River (Priest Rapids-Wells Dam and Transboundary reaches) showed divergence lower than expected by distance. Having not shared any stocking sources to our knowledge, we speculate that this could reflect a historically primarily resident (non-amphidromous) population subject to less admixture with coastal immigrants. Moreover, collections from the mid-upper and upper reaches of the Columbia River Basin are more different from the lowest reaches than the latter are from samples from outside the basin. This pattern of divergence may be due to natural constraints to dispersal between lower and upper reaches, such as Celilo Falls (submerged by The Dalles Dam in 1957), which historically limited migration to the interior basin, as is observed in multiple other native fishes in the Columbia River, e.g., [38,39,40]. However, we cannot rule out drift in allele frequencies following segmentation of the basin by hydroelectric development beginning in 1901, increased in the depression era 1930s and post-war 1950s and 1960s, and culminated with Lower Granite Dam in 1975 (Northwest Power Council).
While the current segmentation of the Columbia River Basin due to hydroelectric infrastructure may reinforce the existing spatial genetic structure of white sturgeon, these contemporary patterns are more likely a reflection of historical gene flow rather than anthropogenic causes, with the possible exception of the upper Snake River. Two observations suggest that contemporary structure reflects historical dispersal and gene flow dynamics. First, sturgeon are long-lived (70 or more years), with adults only maturing after one or more decades, and have few natural predators, meaning the turnover in the adult population is quite slow and that there have been relatively few generations since major changes have occurred in the Pacific Northwest (estimating generation time as, e.g., median age of females at sexual maturity, or ~25 years). Two, while dispersal between reaches is almost invariably more restricted than prior to segmentation, it is not zero [41], and downstream dispersal still occurs at some life stages. Further, population genetic theory predicts that it takes relatively few effective migrants to prevent populations from diverging due to genetic drift, especially for polyploids [42]. Thus, there has been relatively little evolutionary time by which segmentation could drive genetic divergence among reaches. We note, however, that the population in the upper Snake River has been segmented due to construction of impassable dams starting in 1901 (i.e., Swan Falls Dam), allowing for a longer influence of anthropogenic isolating factors.
While segmentation may not be producing significant effects on these reach-bound populations through genetic divergence, the restriction from contiguity with appropriate spawning and rearing habitats does appear to have reduced recruitment in many areas [6,12,43]. In other reaches, the remaining adult population is too small to provide adequate population growth to ensure viability or sustainable fishery harvest [10,44]. As a result, a number of programs are underway to supplement regions where population size and/or recruitment are significantly below estimated carrying capacities [45]. Regardless of the relative merits of various supplementation techniques such as translocation, repatriation, or hatchery-spawning of natural origin broodstock, a key component for each strategy is sourcing supplemental fish from areas that are sufficiently genetically similar to the destination population as to avoid outbreeding depression (i.e., importation of gene variants less adapted to local conditions). While in most cases it is difficult to assess if loci with significant effects on phenotype reflect local adaptation among sub-populations, it is common practice to use genetic divergence at putatively neutral loci from across the genome, which indicates rates of gene exchange, as a proxy for the scope for local adaptation to occur, i.e., higher background divergence means less gene flow, allowing more local adaptation, or vice versa, e.g., [46]. It appears likely from the current results that most upstream reaches (i.e., Kootenai, upper Snake, and Transboundary) are sufficiently distinct from all others that utilization of in situ sources only could be justified, though the likelihood of outbreeding depression versus genetic rescue could be worth examining to determine if increased diversity would be expected to improve fitness and reduce homozygosity of deleterious alleles e.g., [47]. For other reaches which are potential localities for supplementation (e.g., John Day, Priest Rapids to Grand Coulee), fish from proximal reaches (e.g., Bonneville) would be only marginally divergent from the contemporary residents, would likely have interbred with them historically, and probably reflect insubstantially different patterns of adaptation, suggesting little if any outbreeding depression from translocation, repatriation, etc., from these reaches.

4.2. Genetic Diversity

For most of the white sturgeon segmented into reaches in the Columbia River Basin by hydroelectric dams, there was no evidence of diminished contemporary genetic diversity or high rates of inbreeding (e.g., low expected heterozygosity; high individual inbreeding values, or substantial differences in observed vs. expected heterozygosity), though we have no historical samples with which to compare. This may be a reflection of how genetic diversity is naturally buffered from temporary drops in recruitment by long-lived adults [6]. Further, as polyploid organisms, each individual can carry a proportionately higher complement of allelic variants, slowing the rates of genetic drift and preserving a greater amount of genetic diversity in fewer individuals than a comparable diploid population [42,48]. Both of these characteristics may help buffer white sturgeon populations through natural variation in recruitment across more or less favorable climate conditions [6], although we note that the largest contemporary sturgeon populations are also those associated with the most consistent annual recruitment in favorable habitat [9] and extreme population bottlenecks would lead to rapid loss of diversity. However, given the marginal or non-significant genetic divergence among most reaches relative to contemporary rates of recruitment, it is likely that sturgeon abundance in several or most reaches was historically sustained by unrestricted dispersal from reaches with the highest recruitment rates rather than completely reliant on in situ recruitment. Moreover, while longevity and ploidy may preserve genetic diversity in these populations longer than comparable diploid animals, this effect will not last indefinitely, and persistent reduced recruitment will eventually erode genetic diversity.
In contrast to collections from most reaches of the Columbia River Basin, the upper Snake and Kootenai reach samples showed substantially lower genetic diversity. The upper Snake River population consists of one stronghold population between C.J. Strike and Bliss Dams, and several others that are imperiled and not considered to be self-sustaining [49]. While population bottleneck and isolation as early as 1901 have likely played a role in producing contemporary genetic patterns, it is also possible that limited habitat availability in this narrow section of river resulted in a naturally smaller population with proportionately smaller genetic diversity, and some historically limited gene exchange also cannot be precluded [17]. However, we note that the values presented reflect genetic diversity and structure after filtering out a substantial number of first-degree relatives from the upper Snake River sample, and much of the abundance remaining in the non-stronghold reaches of the upper Snake River appears to result from previous stocking of excess commercial hatchery-spawned offspring or ongoing translocation of offspring from the Bliss-C.J. Strike reach [2,49], implying that balancing genetic diversity with population viability will continue to be challenging. Fortunately, current supplementation efforts for the upper Snake River are tailored to preserve in situ genetic diversity [14].
The Kootenai River population exhibited the lowest genetic diversity among samples from the Columbia River Basin. In addition to putative glacial-age divergence from the remaining Columbia Basin, this population also experienced habitat restriction and degradation resulting in persistent recruitment failure since the mid-20th century, and is now federally protected [13]. The result is reflected in the contemporary signal of genetic diversity, and supplementation programs in the Kootenai are carefully monitored to assess success in maintaining genetic diversity relative to the potential from natural origin broodstock [13]. It is also important to note that the divergence of the Kootenai River white sturgeon from other reaches reflects an unknown combination of genetic bottleneck (accelerated genetic drift due to population decline) as well as limited gene exchange with other reaches due to putative glacial-age barriers (but otherwise in drift–mutation equilibrium), both of which cause populations to appear distinct in ahistorical analyses of the kind applied here. Teasing these apart would require the use of coalescent-based population models that parameterize both gene flow and population size dynamics, e.g., [50]. While our genetic diversity estimates reflect this combined history, we also acknowledge that the set of individuals from which the current SNP panel was developed contained no Kootenai River individuals [19], making it subject to potential ascertainment bias or null alleles (alleles which are not observed and create a false appearance of homozygosity). However, results from previous investigations of genetic diversity in this population [13,15] and observation that Kootenai River individuals did not fail genotyping at higher rates than other samples, which might indicate significant null alleles, suggests that our SNP markers exhibit segregation and richness patterns consistent with other marker types.

4.3. Dispersal

One of the most pressing questions regarding the contemporary segmentation of white sturgeon in the Columbia River Basin is to understand the extent of disruption to natural dispersal and gene flow. White sturgeon are usually fairly sedentary, making relatively small diel movements and somewhat larger seasonal movements for reproduction and returning to the same river reach [2]. While it is likely that hydroelectric dams restrict passage considerably relative to pre-impoundment, neither downstream nor upstream passage is completely prevented at those dams with ladders for anadromous fishes. Moreover, downstream passage appears to largely occur via open spillways and is thus possible even at those dams without fish ladders [41]. How these two observations combine to produce contemporary demographic and genetic connectivity between reaches remains unclear, since the frequency of life stages, survivorship, and reproductive success of migrants is not well resolved.
One constraint to estimating connectivity of fish among reaches is that identification of dispersal has been constrained by several factors. Estimates of dispersal via mark-recapture, PIT array pings, or radio telemetry, are limited to life stages that can be effectively tagged and exhibit high catch-and-release survivorship or are hatchery-produced, whereas in many species, dispersal is limited to only certain life stages. In white sturgeon, most tagging of natural-origin fish occurs on juvenile and adult specimens. While these data have suggested that the largest fish are often those that make the largest migrations, and it is notable that the only genetic mark-recapture in our dataset was a fish over 1 m long, this may also represent tracking effort. For example, fish stocked in 2003 included ~20,600 marked, 9 mo- to 1 yr-old fish into Rock Island reservoir in the mid-upper Columbia, and by 2006, a significant number of these fish had dispersed as far down river as the Wanapum, Priest Rapids, McNary, and John Day reaches [45]. By 2011, an estimated 3500 of these fish inhabited the McNary reservoir. While it is difficult to say whether these stocked fish are representative of natural dispersal, it nonetheless indicates that younger as well as older life stages can be important contributors to dispersal among reaches.
Another constraint is that estimates of dispersal have been limited to direct observations, which requires that individual fish be tracked or recaptured. These efforts can be undermined by tag shedding, inadequate resampling, mortality, and other factors. Alternately, with routine collection of tissue samples during management surveys and the availability of adequate panels of genetic markers, estimation of vital rates such as dispersal and abundance can be made through the identification of related individuals, or close-kin mark-recapture [51,52]. This technique still requires careful planning and interpretation, but avoids several of the pitfalls of estimates via direct dispersal [52]. In the present study, we observed a single dispersal event through genetic mark-recapture, while we identified several dozen cross-reach relatives through close-kin mark-recapture, which indicated dispersal events across one to three hydroelectric dams and several hundred kilometers. This included some putative Rock Island stocked fish that were sampled in McNary and John Day reservoirs, while many other Rock Island fish sampled in Wanapum and Priest Rapids reaches were filtered as first-degree relatives within our combined mid-upper Columbia sample. While we decline to make estimates of dispersal rates because of heterogeneous sampling and an inability to clearly separate generations in our dataset, these data nonetheless make clear the potential to utilize close-kin mark-recapture to supplement direct (mark-recapture) estimates of dispersal rates.

5. Conclusions

Due to historical overharvest, habitat alternation, and segmentation, white sturgeon in many portions of the Columbia River Basin face an uncertain future. Efforts to conserve and supplement them are underway, and our results using genetic markers distributed throughout the genome of this polyploid species provide a critical context for that work. These results depicted the majority of collections from reaches in the Columbia River Basin as exhibiting an isolation-by-distance pattern, one whose origin likely preceded development of the contemporary hydroelectric infrastructure, though we cannot preclude that this pattern is reinforced by that segmentation. We observed that collections from the most proximal reaches were only marginally or non-significantly divergent from one another and experience some dispersal, suggesting that supplementation efforts for most reaches that utilize recruits from neighboring reaches are unlikely to promote outbreeding depression. In contrast, at the full basin scale, the upstream reaches were more distinct from the lowest reaches than the latter were from those outside the Columbia River Basin, reflecting recent gene exchange along coastal routes. While white sturgeon in most reaches in the Columbia River Basin exhibited relatively similar genetic diversity, fish in the highest reaches in the basin, in the Kootenai and upper Snake Rivers, have experienced population bottlenecks as well as historical factors that have resulted in notably lower genetic diversity than the remaining reaches. These reaches are sufficiently distinct as to justify supplementation from in situ sources, though a balance of boosting demographic abundance and preserving genetic diversity must continue to be a priority.

Supplementary Materials

The following supporting information can be downloaded at: https://www.mdpi.com/article/10.3390/d14121045/s1. Supplemental File S1. The R code utilized for data filtering and analysis. Supplemental Figure S1. Maximum likelihood estimation of relatedness in white sturgeon. A) Relatedness in known full- and half-sib families from broodstock collected in John Day reach, estimated with local (left) and global (right) allele frequencies. Dotted lines represented the expected relatedness values for first-degree and second-degree relatives, and the dashed lines represent cutoffs used for identifying repeat captures and filtering full siblings; Supplemental Figure S2. Bar blots from individual-based analyses of white sturgeon using Structure, with color of each bar reflecting admixture proportions, for all data at (A) k = 2, (B) k = 3, and (C) k = 4 clusters, and (D) for Columbia River Basin-only and without uppermost reaches, at k = 2; (E) Recorded values of the locale (r) parameter across runs for each of the subsets of data analyzed; (F) Mean posterior probability values post-burin-in for each replicate run for various k values; (G) Delta k values for each of the subsets of data analyzed; Supplemental Figure S3. Cross-validation of discriminant analysis of principal component of white sturgeon. (A) Cross-validation across numbers of clusters, with Bayesian Information Criterion (open diamond), percent assignment success to cluster (filled square), and percent variation explained (line), indicating seven clusters was optimal. (B) Membership of each reach to seven clusters. (C) Scatterplot of loadings on the first two discriminant axes, with cluster identity indicated by color: Supplemental Figure S4. Cross-validation of discriminant analysis of principal component of white sturgeon in the Columbia River Basin without the uppermost reaches, Kootenai or upper Snake Rivers. (A) Scatterplot of principal component analysis. (B) Cross-validation across numbers of clusters, with Bayesian Information Criterion (open diamond), percent assignment success to cluster (filled square), and percent variation explained (line), indicating five clusters was optimal. (C) Membership of each reach to five clusters. (D) Scatterplot of loadings on the first two discriminant axes, with cluster identity indicated by color; Supplemental Figure S5. Genetic distance (G’’ST) versus linear coastal and river distance. BH-FDR: significant after correction for multiple tests; NS: not significantly different from zero. (A) All samples, with the outside basin and most upriver samples indicated separately. (B) Columbia River Basin samples without the most upriver reaches. Comparisons of lower + middle Snake River reaches with the mid-upper Columbia reaches (Transboundary, Priest Rapids-Wells Tailrace) are indicated separately; Supplemental Figure S6. Genetic diversity of white sturgeon in the Columbia River Basin. (A) Jackknife estimates across loci of rarefied allelic richness; Willamette River and the most upriver reaches are omitted. (B) Maximum likelihood estimates of inbreeding across individuals, using local allele frequencies; Supplemental Figure S7. Scatterplot of probability of full sibship from Colony versus maximum likelihood estimate of relatedness. Dashed lines indicate cutoffs used for corroborating first-degree relatives (≥0.45 relatedness and ≥0.9 probability of sibship), while the dotted line indicates the cutoff for filtering first-degree relatives within reaches (≥0.35) for the population structure dataset. Supplemental Table S1. Genetic markers omitted from analysis due to missing data.

Author Contributions

S.C.W., B.P. and S.R.N. designed the study; S.C.W. performed the analysis and drafted the manuscript; S.C.W., B.P., A.D.S., R.B., D.M., S.Y. and S.R.N. contributed to interpretation and editing of the manuscript. All authors have read and agreed to the published version of the manuscript.

Funding

Funding for this project was contributed by Bonneville Power Administration (Grant no. 2008-907-00).

Institutional Review Board Statement

Not applicable.

Data Availability Statement

The genotyping pipeline utilized here is available as supplemental files from Delomas et al. (2021). The R code utilized for data filtering and analysis is available as supplemental files to this manuscript. Genotype data are available on Figshare (21632240).

Acknowledgments

The authors thank colleagues at the Columbia River Inter-Tribal Fish Commission (CRITFC) in Portland, OR, and Hagerman, ID, and Ken Lepla with Idaho Power Company for facilitating the current dataset. Genotype data were collected in the laboratory by Lori Maxwell. Funding for this project was contributed by Bonneville Power Administration (Grant no. 2008-907-00).

Conflicts of Interest

The authors declare no conflict of interest with the results of this manuscript.

References

  1. Rien, T.A.; Beamesderfer, R.C. Accuracy and Precision of White Sturgeon Age Estimates from Pectoral Fin Rays. Trans. Am. Fish. Soc. 1994, 123, 255–265. [Google Scholar] [CrossRef]
  2. Hildebrand, L.R.; Drauch Schreier, A.; Lepla, K.; McAdam, S.O.; McLellan, J.; Parsley, M.J.; Paragamian, V.L.; Young, S.P. Status of White Sturgeon (Acipenser transmontanus Richardson, 1863) throughout the species range, threats to survival, and prognosis for the future. J. Appl. Ichthyol. 2016, 32, 261–312. [Google Scholar] [CrossRef]
  3. Winemiller, K.O. Life history strategies, population regulation, and implications for fisheries management. Can. J. Fish. Aquat. Sci. 2005, 62, 872–885. [Google Scholar] [CrossRef]
  4. Galbreath, J.L. Status, life history, management of Columbia river white sturgeon, Acipenser transmontanus. Environ. Biol. Fishes 1985, 14. [Google Scholar]
  5. Doroshov, S.I.; Moberg, G.P.; van Eenennaam, J.P. Observations on the reproductive cycle of cultured white sturgeon, Acipenser transmontanus. Environ. Biol. Fishes 1997, 48, 265–278. [Google Scholar] [CrossRef]
  6. Parsley, M.J.; Beckman, L.G. White Sturgeon Spawning and Rearing Habitat in the Lower Columbia River. North Am. J. Fish. Manag. 1994, 14, 812–827. [Google Scholar] [CrossRef]
  7. Scott, W.; Crossman, E. Freshwater Fishes of Canada, Bulletin 184; Fisheries Research Board of Canada: Ottawa, Canada, 1973; p. 966. [Google Scholar]
  8. Lane, E.D. Status of the White Sturgeon, Acipenser-Transmontanus, in Canada. Can. Field-Nat. 1991, 105. [Google Scholar]
  9. McCabe, G.T.; Tracy, C.A. Spawning and early life history of white sturgeon, Acipenser transmontanus, in the lower Columbia River. Fish. Bull. 1994, 92, 760–772. [Google Scholar]
  10. Beamesderfer, R.C.P.; Rien, T.A.; Nigro, A.A. Differences in the Dynamics and Potential Production of Impounded and Unimpounded White Sturgeon Populations in the Lower Columbia River. Trans. Am. Fish. Soc. 1995, 124, 857–872. [Google Scholar] [CrossRef]
  11. Parsley, M.J.; Kappenman, K.M. White sturgeon spawning areas in the lower Snake River. Northwest Sci. 2000, 74, 192–201. [Google Scholar]
  12. Counihan, T.D.; Miller, A.I.; Parsley, M.J. Indexing the Relative Abundance of Age-0 White Sturgeons in an Impoundment of the Lower Columbia River from Highly Skewed Trawling Data. North Am. J. Fish. Manag. 1999, 19, 520–529. [Google Scholar] [CrossRef]
  13. Schreier, A.; Stephenson, S.; Rust, P.; Young, S. The case of the endangered Kootenai River white sturgeon (Acipenser transmontanus) highlights the importance of post-release genetic monitoring in captive and supportive breeding programs. Biol. Conserv. 2015, 192, 74–81. [Google Scholar] [CrossRef]
  14. Thorstensen, M.; Bates, P.; Lepla, K.; Schreier, A. To breed or not to breed? Maintaining genetic diversity in white sturgeon supplementation programs. Conserv. Genet. 2019, 20, 997–1007. [Google Scholar] [CrossRef]
  15. Schreier, A.D.; Rodzen, J.; Ireland, S.; May, B. Genetic techniques inform conservation aquaculture of the endangered Kootenai river white sturgeon Acipenser transmontanus. Endanger. Species Res. 2012, 16, 65–75. [Google Scholar] [CrossRef]
  16. Wood, C.C.; Sneep, D.; McAdam, S.; Korman, J.; Hatfield, T. Recovery Potential Assessment for White Sturgeon Populations Listed under the Species at Risk Act; Canadian Science Advisory Secretariat: Ottawa, Canada, 2007. [Google Scholar]
  17. Schreier, A.D.; Mahardja, B.; May, B. Patterns of population structure vary across the range of the white sturgeon. Trans. Am. Fish. Soc. 2013, 142, 1273–1286. [Google Scholar] [CrossRef]
  18. Campbell, N.R.; Harmon, S.A.; Narum, S.R. Genotyping-in-Thousands by sequencing (GT-seq): A cost effective SNP genotyping method based on custom amplicon sequencing. Mol. Ecol. Resour. 2015, 15, 855–867. [Google Scholar] [CrossRef]
  19. Delomas, T.A.; Willis, S.C.; Parker, B.L.; Miller, D.; Anders, P.; Schreier, A.; Narum, S. Genotyping single nucleotide polymorphisms and inferring ploidy by amplicon sequencing for polyploid, ploidy-variable organisms. Mol. Ecol. Resour. 2021, 21, 2288–2298. [Google Scholar] [CrossRef]
  20. Schreier, A.D.; Gille, D.; Mahardja, B.; May, B. Neutral markers confirm the octoploid origin and reveal spontaneous autopolyploidy in white sturgeon, Acipenser transmontanus. J. Appl. Ichthyol. 2011, 27, 24–33. [Google Scholar] [CrossRef]
  21. Huang, K.; Guo, S.T.; Shattuck, M.R.; Chen, S.T.; Qi, X.G.; Zhang, P.; Li, B.G. A maximum-likelihood estimation of pairwise relatedness for autopolyploids. Heredity 2015, 114, 133–142. [Google Scholar] [CrossRef] [PubMed] [Green Version]
  22. Huang, K.; Dunn, D.W.; Ritland, K.; Li, B. Polygene: Population genetics analyses for autopolyploids based on allelic phenotypes. Methods Ecol. E 2020, 11, 448–456. [Google Scholar] [CrossRef] [Green Version]
  23. Waples, R.S.; Anderson, E.C. Purging putative siblings from population genetic data sets: A cautionary view. Mol. Ecol. 2017, 26, 1211–1224. [Google Scholar] [CrossRef] [Green Version]
  24. Wang, J. Effects of sampling close relatives on some elementary population genetics analyses. Mol. Ecol. Resour. 2018, 18, 41–54. [Google Scholar] [CrossRef] [PubMed] [Green Version]
  25. Hubisz, M.J.; Falush, D.; Stephens, M.; Pritchard, J.K. Inferring weak population structure with the assistance of sample group information. Mol. Ecol. Resour. 2009, 9, 1322–1332. [Google Scholar] [CrossRef] [Green Version]
  26. Evanno, G.; Regnaut, S.; Goudet, J. Detecting the number of clusters of individuals using the software Structure: A simulation study. Mol. Ecol. 2005, 14, 2611–2620. [Google Scholar] [CrossRef]
  27. Grubbs, F.E. Procedures for Detecting Outlying Observations in Samples. Technometrics 1969, 11, 1–21. [Google Scholar] [CrossRef]
  28. Willis, S.C.; Macrander, J.; Farias, I.P.; Orti, G. Simultaneous delimitation of species and quantification of interspecific hybridization in Amazonian peacock cichlids (genus Cichla) using multi-locus data. BMC EBiol. 2012, 12, 1–24. [Google Scholar] [CrossRef] [PubMed] [Green Version]
  29. Jombart, T. Adegenet: A R package for the multivariate analysis of genetic markers. Bioinformatics 2008, 24, 1403–1405. [Google Scholar] [CrossRef] [PubMed] [Green Version]
  30. Paetkau, D.; Slade, R.; Burdens, M.; Estoup, A. Genetic assignment methods for the direct, real-time estimation of migration rate: A simulation-based exploration of accuracy and power. Mol. Ecol. 2004, 13, 55–65. [Google Scholar] [CrossRef] [PubMed]
  31. Meirmans, P.G. Genodive version 3.0: Easy-to-use software for the analysis of genetic data of diploids and polyploids. Mol. Ecol. Resour. 2020, 20, 1126–1131. [Google Scholar] [CrossRef] [Green Version]
  32. Meirmans, P.G.; Liu, S.; van Tienderen, P.H. The Analysis of Polyploid Genetic Data. J. Hered. 2018, 109, 283–296. [Google Scholar] [CrossRef] [Green Version]
  33. Meirmans, P.G.; Hedrick, P.W. Assessing population structure: FST and related measures. Mol. Ecol. Resour. 2011, 11, 5–18. [Google Scholar] [CrossRef] [PubMed]
  34. Benjamini, Y.; Hochberg, Y. Controlling the false discovery rate: A practical and powerful approach to multiple testing. J. R. Stat. Soc. Ser. B 1995, 57, 289–300. [Google Scholar] [CrossRef]
  35. Adamack, A.T.; Gruber, B. PopGenReport: Simplifying basic population genetic analyses in R. Methods Ecol. E 2014, 5, 384–387. [Google Scholar] [CrossRef]
  36. Jones, O.R.; Wang, J. COLONY: A program for parentage and sibship inference from multilocus genotype data. Mol. Ecol. Resour. 2010, 10, 551–555. [Google Scholar] [CrossRef] [PubMed]
  37. Rodzen, J.A.; Famula, T.R.; May, B. Estimation of parentage and relatedness in the polyploid white sturgeon (Acipenser transmontanus) using a dominant marker approach for duplicated microsatellite loci. Aquaculture 2004, 232, 165–182. [Google Scholar] [CrossRef]
  38. Waples, R.S.; Teel, D.J.; Myers, J.M.; Marshall, A.R. Life-history divergence in Chinook salmon: Historic contingency and parallel evolution. Evolution 2004, 58, 386–403. [Google Scholar] [CrossRef] [Green Version]
  39. Narum, S.R.; Hess, J.E.; Matala, A.P. Examining Genetic Lineages of Chinook Salmon in the Columbia River Basin. Trans. Am. Fish. Soc. 2010, 139, 1465–1477. [Google Scholar] [CrossRef]
  40. Collins, E.; Hargrove, J.; Delomas, T.; Narum, S.R. Distribution of genetic variation underlying adult migration timing in steelhead of the Columbia River basin. Ecol. E 2020, in press. [Google Scholar] [CrossRef]
  41. Parsley, M.J.; Wright, C.D.; van der Leeuw, B.K.; Kofoot, E.E.; Peery, C.A.; Moser, M.L. White sturgeon (Acipenser transmontanus) passage at the Dalles Dam, Columbia River, USA. J. Appl. Ichthyol. 2007, 23, 627–635. [Google Scholar] [CrossRef]
  42. Moody, M.E.; Mueller, L.D.; Soltis, D.E. Genetic variation and random drift in autotetraploid populations. Genetics 1993, 134, 649–657. [Google Scholar] [CrossRef]
  43. Parsley, M.J.; Anders, P.J.; Miller, A.I.; Beckman, L.G.; McCabe, G.T. Recovery of white sturgeon populations through natural production: Understanding the influence of abiotic and biotic factors on spawning and subsequent recruitment. Am. Fish. Soc. Symp. 2002, 2002, 55–66. [Google Scholar]
  44. Rieman, B.E.; Beamesderfer, R.C. White Sturgeon in the Lower Columbia River: Is the Stock Overexploited. North Am. J. Fish. Manag. 1990, 10, 388–396. [Google Scholar] [CrossRef]
  45. Parker, B.L.; Beamesderfer, R.C.; Powell, J.; Orton, E.; Miller, D. White Sturgeon Hatchery Step I Master Plan for Lower Columbia and Snake River Impoundments; U.S. Department of Energy Office of Scientific and Technical Information: Portland, OR, USA, 2015.
  46. Funk, W.C.; McKay, J.K.; Hohenlohe, P.A.; Allendorf, F.W. Harnessing genomics for delineating conservation units. Trends Ecol. E 2012, 27, 489–496. [Google Scholar] [CrossRef] [PubMed] [Green Version]
  47. Hedrick, P.W.; Adams, J.R.; Vucetich, J.A. Reevaluating and Broadening the Definition of Genetic Rescue. Conserv. Biol. 2011, 25, 1069–1070. [Google Scholar] [CrossRef] [PubMed]
  48. Soltis, D.E.; Visger, C.J.; Marchant, D.B.; Soltis, P.S. Polyploidy: Pitfalls and paths to a paradigm. Am. J. Bot. 2016, 103, 1146–1166. [Google Scholar] [CrossRef] [PubMed]
  49. Idaho Power Company. Snake River White Sturgeon Conservation Plan, 2015–2020 Planning and Implementation; Idaho Power Company: Boise, ID, USA, 2015. [Google Scholar]
  50. Chung, Y.; Hey, J. Bayesian analysis of evolutionary divergence with genomic data under diverse demographic models. Mol. Biol. E 2017, 34, 1517–1528. [Google Scholar] [CrossRef] [PubMed] [Green Version]
  51. Skaug, H.J. Allele-sharing methods for estimation of population size. Biometrics 2001, 57, 750–756. [Google Scholar] [CrossRef]
  52. Ruzzante, D.E.; McCracken, G.R.; Førland, B.; MacMillan, J.; Notte, D.; Buhariwalla, C.; Skaug, H.; Flemming, J.M. Validation of close-kin mark–recapture (CKMR) methods for estimating population abundance. Methods Ecol. E 2019, 10, 1445–1453. [Google Scholar] [CrossRef]
Figure 1. Reaches from which white sturgeon were collected for this study. Diamonds represent hydroelectric dams or water falls delineating reaches inhabited by white sturgeon analyzed in this study (labeled). Lines indicated reaches from which fish were pooled for group-wise analysis. Labels follow Table 1.
Diversity 14 01045 g001
Figure 2. Bar blots from individual-based analyses of white sturgeon. Labels follow Table 1. (A) Structure analysis with k = 2, with color of each bar reflecting admixture proportions. (B) Discriminant analysis of principal components made with Adegenet, k = 7, with the color of each bar reflecting proportional assignment success to cluster from cross-validation. (C) Population assignment, with color of each vertical bar representing assignment from likelihood ratio, made with Genodive. Bars below each block represent the color reflecting assignment to that reach, while the color of each bar reflects the reach to which each individual was assigned. The proportions of each color in each block are reflected by rows in Table 2.
Diversity 14 01045 g002
Figure 3. Scatterplot of loadings on the first two axes from principal component analysis of white sturgeon. For each axis, the percentage of genetic variance explained is indicated.
Diversity 14 01045 g003
Figure 4. Genetic diversity of white sturgeon collections in the Columbia River Basin. (A) Jackknife estimates across loci of rarefied allelic richness; Willamette River is omitted due to low sample size. (B) Jackknife estimates across loci of heterozygosity (unfilled: observed; filled: expected). (C) Maximum likelihood estimates of inbreeding across individuals. Labels follow Table 1.
Diversity 14 01045 g004
Table 1. Sample sizes of white sturgeon for each reach, before (N) and after (r) filtering first-degree relatives within each reach. * Columbia River below Bonneville Dam.
ReachCodeNr
Sacramento-San JoaquinSAC3737
Fraser RiverFSR4442
Columbia estuary *EST490432
WillametteWLL1313
BonnevilleBON504494
The DallesTDL505499
John DayJDY669599
McNaryMCN178125
Ice HarborIHB108101
Lower MonumentalLMN132124
Little GooseLGS112106
middle SnakeMDS9082
upper SnakeUPS264169
Priest Rapids-Wells TailracePRW4826
TransboundaryTRB225183
Kootenai RiverKOO4946
Table 2. Rates of population assignment of white sturgeon by reach, with source listed vertically and assigned reach horizontally. On-diagonal elements reflect the proportion of fish assign back to source reach. Off-diagonal elements reflect the proportion of fish that were assigned from the reach indicated by the row name to the reach indicated by the column heading. Sample size for each reach is indicated in the third column.
Assignment (Percentage)
SACFSRESTWLLBONTDLJDYMCNIHBLMNLGSMDSUPSPRWTRBKOO
SourceSacramentoSAC3791.90.08.10.00.00.00.00.00.00.00.00.00.00.00.00.0
FraserFSR420.069.028.62.40.00.00.00.00.00.00.00.00.00.00.00.0
Columbia estuaryEST4320.20.082.91.47.26.71.40.20.00.00.00.00.00.00.00.0
WillametteWLL130.00.061.523.10.07.77.70.00.00.00.00.00.00.00.00.0
BonnevilleBON4940.00.012.30.841.926.510.94.51.20.40.60.60.00.00.20.0
The DallesTDL4990.00.010.00.425.542.916.02.80.81.00.60.00.00.00.00.0
John DayJDY5990.00.09.50.716.518.225.97.03.03.25.76.81.20.71.70.0
McNaryMCN1250.00.03.20.08.07.212.825.67.211.210.48.83.20.81.60.0
Ice HarborIHB1010.00.01.01.02.03.014.97.922.815.88.914.94.02.02.00.0
Lower MonumentalLMN1240.00.01.60.02.43.211.38.110.529.09.717.74.00.81.60.0
Little GooseLGS1060.00.00.00.03.86.65.717.95.77.519.817.99.41.93.80.0
middle SnakeMDS820.00.00.00.01.21.214.64.98.511.09.828.019.51.20.00.0
upper SnakeUPS1690.00.00.00.00.00.00.00.00.00.00.00.0100.00.00.00.0
Priest Rapids-WellsPRW260.00.00.00.03.80.011.511.53.87.70.019.20.030.811.50.0
TransboundaryTRB1830.00.00.50.00.52.77.14.93.82.71.64.93.81.165.01.1
KootenaiKOO460.00.00.00.00.00.00.00.00.00.00.00.00.00.00.0100.0
Table 3. Values of G’’ST of white sturgeon with darker shades reflecting higher values. Values not significant after correction for multiple tests are indicated with “--".
SACFSRESTWLLBONTDLJDYMCNIHBLMNLGSMDSUPSPRWTRBKOO
SacramentoSAC--0.0730.0220.0230.0430.0450.0600.0830.0970.1060.1070.1290.2290.1090.1100.289
FraserFSR0.073--0.0340.0340.0290.0290.0290.0360.0420.0470.0450.0550.1230.0430.0450.180
Columbia estuaryEST0.0220.034--0.0020.0070.0080.0160.0310.0410.0480.0490.0660.1530.0500.0500.227
WillametteWLL0.0230.0340.002--0.0070.0090.0140.0280.0360.0460.0460.0630.1480.0460.0470.224
BonnevilleBON0.0430.0290.0070.007--0.0010.0030.0120.0180.0230.0230.0350.1090.0250.0270.202
The DallesTDL0.0450.0290.0080.0090.001--0.0030.0100.0170.0220.0220.0340.1060.0260.0260.200
John DayJDY0.0600.0290.0160.0140.0030.003--0.0040.0080.0120.0120.0200.0820.0130.0160.186
McNaryMCN0.0830.0360.0310.0280.0120.0100.004--0.0020.0040.0020.0090.0580.0080.0100.175
Ice HarborIHB0.0970.0420.0410.0360.0180.0170.0080.002------0.0050.0490.0070.0090.177
Lower MonumentalLMN0.1060.0470.0480.0460.0230.0220.0120.004------0.0030.0420.0060.0100.175
Little GooseLGS0.1070.0450.0490.0460.0230.0220.0120.002------0.0020.0410.0060.0090.169
middle SnakeMDS0.1290.0550.0660.0630.0350.0340.0200.0090.0050.0030.002--0.0260.0050.0110.170
upper SnakeUPS0.2290.1230.1530.1480.1090.1060.0820.0580.0490.0420.0410.026--0.0400.0480.189
Priest Rapids-WellsPRW0.1090.0430.0500.0460.0250.0260.0130.0080.0070.0060.0060.0050.040--0.0070.173
TransboundaryTRB0.1100.0450.0500.0470.0270.0260.0160.0100.0090.0100.0090.0110.0480.007--0.147
KootenaiKOO0.2890.1800.2270.2240.2020.2000.1860.1750.1770.1750.1690.1700.1890.1730.147--
Table 4. Transgenerational dispersals across reaches inferred from close-kin mark-recapture (CKMR), identified as the intersection of high ML relatedness and high probability of sibship.
ReachesCKMR
Columbia estuary (EST) and Willamette (WIL)1
Columbia estuary (EST) and The Dalles (TDL)1
Bonneville (BON) and John Day (JDY)3
John Day (JDY) and McNary (MCN)4
John Day (JDY) and Ice Harbor (IHB)1
John Day (JDY) and Lower Monumental (LMN)1
John Day (JDY) and Priest Rapids-Wells Tailrace (PRW)3
McNary (MCN) and Lower Monumental (LMN)1
McNary (MCN) and Little Goose (LGS)3
McNary (MCN) and Priest Rapids-Wells Tailrace (PRW)7
Ice Harbor (IHB) and Lower Monumental (LMN)3
Ice Harbor (IHB) and Little Goose (LGS)1
Ice Harbor (IHB) and middle Snake (MDS)2
Lower Monumental (LMN) and Little Goose (LGS)7
Lower Monumental (LMN) and middle Snake (MDS)4
Little Goose (LGS) and middle Snake (MDS)5
Publisher’s Note: MDPI stays neutral with regard to jurisdictional claims in published maps and institutional affiliations.

