Article

Introduced, Mixed, and Peripheral: Conservation of Mitochondrial-DNA Lineages in the Wild Boar (Sus scrofa L.) Population in the Urals

1
Institute of Plant and Animal Ecology, Ural Branch of Russian Academy of Sciences, 8 Marta 202a, 620142 Ekaterinburg, Russia
2
Precaspian Institute of Biological Resources, Dagestan Federal Research Center, Russian Academy of Sciences, Magomeda Gadzhieva 45, 367000 Makhachkala, Republic of Dagestan, Russia
3
Pacific Geographical Institute, Far Eastern Branch of Russian Academy of Sciences, Radio 7, 690041 Vladivostok, Russia
4
Deparment of International Affairs, Moscow International University, Leningradsky Prospect 17, 125040 Moscow, Russia
5
Institute of Zoology, Academy of Sciences of Republic of Uzbekistan, Bagishamol Str. 232b, Tashkent 100053, Uzbekistan
6
Department of Biodiversity and Bioresources, al-Farabi Kazakh National University, Prospect al-Farabi 71, Almaty 050040, Kazakhstan
7
Engelhardt Institute of Molecular Biology, Russian Academy of Sciences, Vavilova 32, 119991 Moscow, Russia
*
Author to whom correspondence should be addressed.
Diversity 2022, 14(11), 916; https://doi.org/10.3390/d14110916
Submission received: 5 October 2022 / Revised: 20 October 2022 / Accepted: 21 October 2022 / Published: 27 October 2022
(This article belongs to the Special Issue Genetic Diversity in Ungulate Populations)

Abstract

:
Translocations and introductions are important events that allow organisms to overcome natural barriers. The genetic background of colonization success and genetic consequences of the establishment of populations in new environments are of great interest for predicting species’ colonization success. The wild boar has been introduced into many parts of the world. We analyzed sequences of the mitochondrial-DNA control region in the wild boars introduced into the Ural region and compared them with sequences from founder populations (from Europe, the Caucasus, Central Asia, and the Far East). We found that the introduced population has high genetic diversity. Haplotypes from all the major phylogenetic clades were detected in the analyzed group of the animals from the Urals. In this group, no haplotypes identical to Far Eastern sequences were detectable despite a large number of founders from that region. The contribution of lineages originating from Eastern Europe was greater than expected from the proportions (%) of European and Asian animals in the founder populations. This is the first study on the genetic diversity and structure of a wild boar population of mixed origin at the northern periphery of this species’ geographical range.

1. Introduction

Translocations and introductions are important ecological and evolutionary events that allow organisms to overcome natural barriers and that disrupt the natural pace at which ecosystems have evolved through millennia [1]. As a consequence, the organisms introduced into a new environment may face difficulties with adaptation to novel habitats, and this problem may, in turn, reduce the success of species establishment. On the other hand, the introduction of organisms may often result in their rapid invasion of natural communities [2]. Given the evolutionary, ecological, and economic (in case of invasion) importance of animals’ translocations and introductions, it is worthwhile to understand the factors that mediate the establishment and expansion of a species’ population in a new region. Many studies have addressed the role of extrinsic factors (climate, habitat quality, and competitors) and intrinsic factors (propagule pressure, life history, and dispersal abilities) in organisms’ colonization success [3,4,5,6]. The most intriguing questions include the genetic background of colonization success and genetic consequences of the establishment of populations in new environments, which are often situated at the periphery of the species’ geographical ranges. The most important factors affecting the establishment success via founders’ genetic diversity are multiple introductions and intra- and interspecies hybridization [2,6,7]. Particularly, an intraspecific genetic admixture may benefit introduced populations via (1) an increase in genetic variation, which provides a larger pool of raw material for adaptive evolution; (2) the emergence of novel or transgressive phenotypes through previously unexplored allele and gene combinations [6,8,9]; (3) heterosis; and (4) the masking or purging of deleterious mutations; the latter process may reduce potentially negative effects of genetic bottlenecks and inbreeding [6,10,11]. The effect of multi-source introductions has been investigated for plants [12,13,14], mollusks [15,16], arthropods [17,18], and lizards [19,20,21]. Most of these studies indicate an increase in genetic diversity in introduced versus source populations, but some reports also show a decrease in genetic diversity in mixed populations resulting from the admixture of geographically distant populations [4,13,14]. In mammals, the genetics of introduced populations has been researched for some carnivores [22,23,24] and Mus musculus [25,26], but relatively few studies involved ungulates [27,28], even though many of these animals have been intentionally introduced into novel environments for hunting and conservation purposes [29]. Ungulates are of great economic and ecological importance [30,31,32,33] and understanding the genetic specific features of newly established populations could help with conservation of endangered species [34,35,36] and controlling species that could affect native ecosystems [37,38]. The latter issue is especially relevant for the wild boar, which is expanding in the areas of introduction [39,40,41] and is treated as a pest in a number of countries [42].
The wild boar is a species occurring across the whole Palearctic [43]. Despite its controversial role in ecosystems [44], it has been introduced for hunting purposes into the Americas [40,45,46,47] and Australia [48] and into many parts of North Eastern Europe and Northern Asia [49]. The taxonomy of the genus Sus is contradictory due to the variability of the species’ morphological and genetic traits. According to Keuling O. et al. [43], 16 wild boar subspecies are recognized based on morphological parameters, such as the shape of the skull, size and proportions of the body, and hair color. Despite these differences, laboratory experiments have not revealed any limitations of crossbreeding between wild boar subspecies and between the wild boar and various breeds of the domestic swine [50].
Subspecies of wild Sus scrofa are divided into European, Asian, and South Asian groups [43]. Molecular systematics confirms these clades [51] but also includes the Near Eastern (NE) clade, which in turn consists of two subclades (NE1 and NE2) [52]. The genetics of wild and domestic S. scrofa have been extensively investigated [53,54,55] and references therein), and most studies on wild populations come from Western Europe (e.g., [55,56,57,58,59]), the Far East [60,61,62,63], and a few areas of Southern and Central Asia [64]. The information on genetic diversity in recently introduced populations of the wild boar is scarce and represented by a few studies from New Zealand [65] and the South [45] and North [66,67] Americas. There are also several reports [68,69,70] based on a relatively small number of samples. Many wild boar releases have been well documented, and there are sufficient data about the genetics of founders of an introduced wild boar, which is a good model for analyzing changes in genetic diversity in admixed populations. This problem sounds especially interesting given that often, these animals have been released in northern areas beyond this species’ historical range. In particular, this is the case for the wild boar introduction into the Urals (Russia).
When the introduction of the wild boar into the Urals was organized, representatives of four subspecies (Sus s. scrofa, S. s. attila, S. s. nigripes, and S. s. ussuricus) were translocated from their natural habitats and released in the eastern part of the region (Sverdlovsk Oblast; Figure 1). These subspecies differ in morphology [71,72] and polymorphism of blood group antigens [50]. These subspecies are geographically isolated in nature (except S. s. attila and S. s. nigripes [49,71]), but under experimental conditions, they crossbreed with each other [50].
The European (S. s. scrofa and S. s. attila) and Asian subspecies (S. s. ussuricus) also differ substantially in their sequences of mitochondrial DNA (mtDNA) (the control region and cytochrome b gene) [51,74,75]. Additionally, wild boars have been translocated to the Urals from three regions of Central Russia, where the populations became established via natural expansion of European wild boars and via a few releases of the animals from Central Russia and the Caucasus [49]. The releases presumably took place between 1978 and 1984 [49,76,77] (Figure 1) and occasionally in the 2000s on private hunting grounds. At the beginning of the 1980s, the Ural region was at the north eastern periphery of the species’ range [49]. In the northern parts of the geographical range, wild boar populations are affected by food availability and the weather conditions of winter and autumn [77,78,79,80]. The strategy of multi-source introductions is aimed at improving the animals’ tolerance to the new harsh conditions via an increase in their genetic diversity [76].
In this study, we determined (1) whether all the genetic lineages present in founders were preserved in the current population; (2) whether the current genetic diversity in the Ural population is higher, lower, or the same as that in the founders’ populations; and (3) how the current proportions (%) of various mitochondrial lineages are related to the proportions of genetically distinct founders. We addressed these questions by analyzing the diversity of haplotypes of the mtDNA control region. This genetic marker is widely used in the research on wild boar phylogeography and intraspecies taxonomy [55,56,57,58,59,61,64,81,82,83,84] and for investigation into S. scrofa domestication [51,85]. We examined haplotypic variation in the wild boar population from the eastern part of the Urals and compared it with the data from the founder populations. In particular, we, for the first time, characterized the haplotype composition and diversity of previously unsampled Central Asian wild boars. We also investigated data from the Caucasus Region (Republic of Dagestan, Russia). Data from this territory have already been reported in the literature [64,81], but the tested groups of animals included only a few individuals. Here, we employed a larger sample size (more than 20 specimens) to obtain more reliable results. The third founder population that we analyzed is the Far Eastern one. Furthermore, we used published data on the European wild boar and focused on East European populations that are known to contribute to the restoration of wild boar populations in European Russia and in the Urals [49,76].
We tested the following hypotheses: (1) the genetic diversity in the Ural population is equal to or greater than that in the founder populations; (2) all the main genetic lineages present in the founder populations were preserved in the newly established population; and (3) the proportions (%) of various genetic lineages in the current Ural population are similar to those in the founder populations. The first hypothesis is based on research that has shown higher genetic diversity in populations resulting from multiple introductions and intraspecies hybridization [2,3,20]. The second hypothesis derives from numerous studies where introduction history has been determined by means of the composition of mtDNA haplotypes decades after the beginning of expansion [86]. The third hypothesis originates from the lack (to the best of our knowledge) of research on the proportions of different lineages in mixed populations. To avoid type I error, i.e., looking for a phenomenon that probably does not occur, we assumed the absence of differences between the initial and current proportions of genetic lineages. We also discuss how our results can be interpreted in terms of theoretical concepts of invasive biology and genetics.

2. Materials and Methods

2.1. Sample Collection

In total, we collected 196 samples of wild boar muscle tissue from four regions: the Ural, Eastern Caucasus (Dagestan), Central Asia (Uzbekistan and Kazakhstan), and Russian Far East (Primorsky Krai) (Table 1, Supplementary Table S1). Tissue samples from the Ural population of wild boars were collected in Sverdlovsk Oblast (Russia). Tissue samples from the Caucasus region population (supposedly S. s. attila) were collected in the Eastern Caucasus (Republic Dagestan) from hunters. Muscle tissue samples representing the Central Asian wild boars (supposedly S. s. nigripes) were collected in 2018 in the western part of Uzbekistan and in Southern Kazakhstan. These two sampling regions represent the Tian Shan Mountains near Kyrgyzstan, from where the animals were brought to the Urals. The Far Eastern subspecies S. s. ussuricus was represented by tissue samples from north eastern Primorsky Krai.
The experimental work was conducted with approval by the Institute of Plant and Animal Ecology, the Ural Branch of the Russian Academy of Sciences (UB RAS), where the wild boar DNA samples from this study were deposited. The Institute of Plant and Animal Ecology UB RAS does not have specific guidelines for wildlife sample collection but recommends following relevant laws about experiments involving wild animal specimens. The wild boar is classified as a game animal in all the countries and regions covered by the sampling in this study, and all the samples of wild boar muscle tissue were either donated by hunters holding a hunting license or collected from carcasses of accident-killed animals. Because no animals were killed specifically for the purpose of this research, we did not attempt to seek approval from ethical review boards in the participating countries. Nonetheless, the procedures involving tissue samples from wild boars were in compliance with the laws of the countries involved in this study.

2.2. DNA Extraction, Amplification, and Sequencing

Total DNA was isolated from the muscle tissue samples using the DNA-Extran-2 Kit (Syntol LLC, Moscow, Russia).
Primers pDF/pDR [61] were used to amplify the mtDNA control region (approximately 1250 to 1350 bp). The variation of the amplicon length results from the number of tandem repeats in the control region in S. scrofa [40]. All polymerase chain reactions (PCRs) were carried out in a 25 μL reaction mixture consisting of 2.0 mM MgCl2, 0.2 mM dNTPs, 0.27 μM each primer, 0.75 U i-StarTaqTM DNA Polymerase (Syntol LLC, Moscow, Russia), and 50–60 ng of template DNA. For DNA sequencing, PCR products were purified with the ExS-Pure™ Enzymatic PCR Cleanup Kit (NimaGen, Netherlands). DNA sequencing was carried out on an ABI PRISM 3500xL Genetic Analyzer with the BigDye Terminator Chemistry v.3.1 Kit (Applied Biosystems, Foster City, CA, USA).

2.3. Data Analysis

We analyzed the left domain of the D-loop, examining the fragment situated upstream of the locus of tandem repeats that are present in the mtDNA control region of wild boars [87]. In addition, 60 sequences representing the haplotypes of animals classified as wild S. scrofa from Europe (n = 13) and Asia (n = 47) (see Supplementary Table S2) were retrieved from GenBank. A 637-bp fragment of the control region was utilized for estimating the genetic diversity and for phylogenetic reconstructions. This fragment contains 74.3% of the variable sites and 73.3% of the parsimony informative sites previously reported for the wild boar mtDNA control region [36]. Among the rest of the polymorphic sites, only five have been reported as variable in the Eurasian wild boar while the other eleven sites are polymorphic only in animals from Indonesia. Accordingly, the 637-bp fragment under consideration could be regarded as representative for samples from most regions of Eurasia. The number of haplotypes (h), haplotype diversity (Hd), nucleotide diversity (π), and neutrality indices (Tajima’s D and Fu’s Fs) were calculated using DnaSP v6.12.03 software [88]. The most appropriate model of nucleotide change was selected in jModelTest 0.1.1 [89], with a sequence of Sus celebensis as an outgroup (GenBank accession number KY911746.1). The best model, according to both the Akaike information criterion (AIC) and the Bayesian information criterion (BIC), was the HKY model [90], with ¦Ã-distributed (G) rate variation across sites. Bayesian phylogenetic analyses were carried out in MrBayes 3.2 [91] using the HKY + G model of sequence evolution and two independent runs of four Markov chains (one cold and three heated) over 3,000,000 generations and sampling every 300 generations. The first 25% of the sampled trees and estimated parameters were discarded as burn-in.
The main aim of the phylogenetic analysis was not to present an exhaustive phylogeny of the wild boar but mostly to examine the position of the studied populations in the previously described main mtDNA lineages (European, Near Eastern, Pan-Asian, and South Eastern Asian). Therefore, we did not include in the phylogenetic analysis all available sequences of the wild boar control region but used the most recently published sets of data illustrating the above-mentioned clades. The main sources of data were the articles by Choi K.S. et al. [64] and Niedziałkowska M. et al. [59] presenting big sets of sequences from Asia and Europe, respectively. We also performed phylogenetic reconstructions based on a shorter fragment (548 bp), which enabled us to compare the data obtained in this study with published sequences from Iran [84]. Haplotypes downloaded from GenBank and identical to those sequenced in this study (Supplementary Table S2) were excluded from this analysis.

2.4. Collection of Data on Animals Released in the Urals

Information about the origin of wild boars released in the Urals was collected from available publications [49,76], the archives of local authorities responsible for game management, and interviews with their employees who participated in the releases during 1978–1984.

3. Results

3.1. Genetic Diversity and Haplotype Composition of the Introduced versus Founder Populations

A total of 21 haplotypes based on 637-bp fragments of the mtDNA control region were identified in 196 wild boars sampled across the Far East, Central Asia, Caucasus, and Urals (Table 1, Supplementary Table S1). Sixteen of the haplotypes are identical to previously published sequences (Supplementary Table S2) [59,64], whereas five are described for the first time. Among the new haplotypes, one (Ss4) was found only in the Ural population, two (Ss10 and Ss12) only in Central Asia, and one (Ss11) only in the Eastern Caucasus (Republic of Dagestan, Russia). One of the new haplotypes (Ss9) has been found in the Urals and Central Asia. One of the haplotypes detected in the Russian Far East (Ss17) appeared to be identical to the haplotypes described for the Duroc and Landrace breeds of domestic pigs [83]. Thus, we suspected that this haplotype represents a hybrid between a male wild boar and a female domestic pig.
The most numerous haplotypes in the Ural population were Ss1 and Ss2 (92 of 116 studied individuals). Six haplotypes (Ss1, Ss2, Ss3, Ss7, Ss8, and Ss14) proved to be shared between the Urals and Eastern Europe [28], and two haplotypes (Ss1 and Ss7) were found in the Ural and in the Caucasus. Animals from the Ural populations also share two haplotypes (Ss6 and Ss9) with Central Asian populations, but there are no common haplotypes between the Urals and Russian Far East. One haplotype of the 11 (9%) was found in the Ural population (Ss4 has not previously been deposited in GenBank). This unique haplotype was found in two individuals, and according to a BLAST search (Ref. ID GH3TT16E013), it is 99.69% similar to haplotype H8 detected by Alves P. et al. [92] in Southern Europe and in house pigs from Portugal. Two other haplotypes (Ss5 and Ss13) (Ref. IDs GH4FUWX1016 and GH4P2E97016, respectively) proved to be identical to the haplotypes of domestic pigs. Therefore, these animals are most probably hybrids between a wild boar male and a female domestic pig. Haplotype Ss8 was previously reported as H11 in [92].
The values of the haplotype diversity (Hd) (Table 2) turned out to be similar among most of the tested populations. The highest values were noted in the Russian Far East, Central and Eastern Europe, and the Urals, whereas the group of animals from the Caucasus showed the lowest Hd (Table 2). Nucleotide diversity (π) is the highest in the Caucasian group of wild boars, whereas this index in Central Asia is the lowest among the analyzed populations. The haplotype diversity is higher in the Ural population than in the founders’ populations from the Caucasus and Central Asia but similar to this parameter in Europe and the Russian Far East.
Both the Ural (Fu’s Fs) and the Caucasus (Tajima’s D and Fu’s Fs) populations demonstrate a statistically significant (p < 0.05) deviation from the neutral model in terms of an excess of rare alleles.

3.2. Phylogenetic Status of the Introduced versus Founder Populations

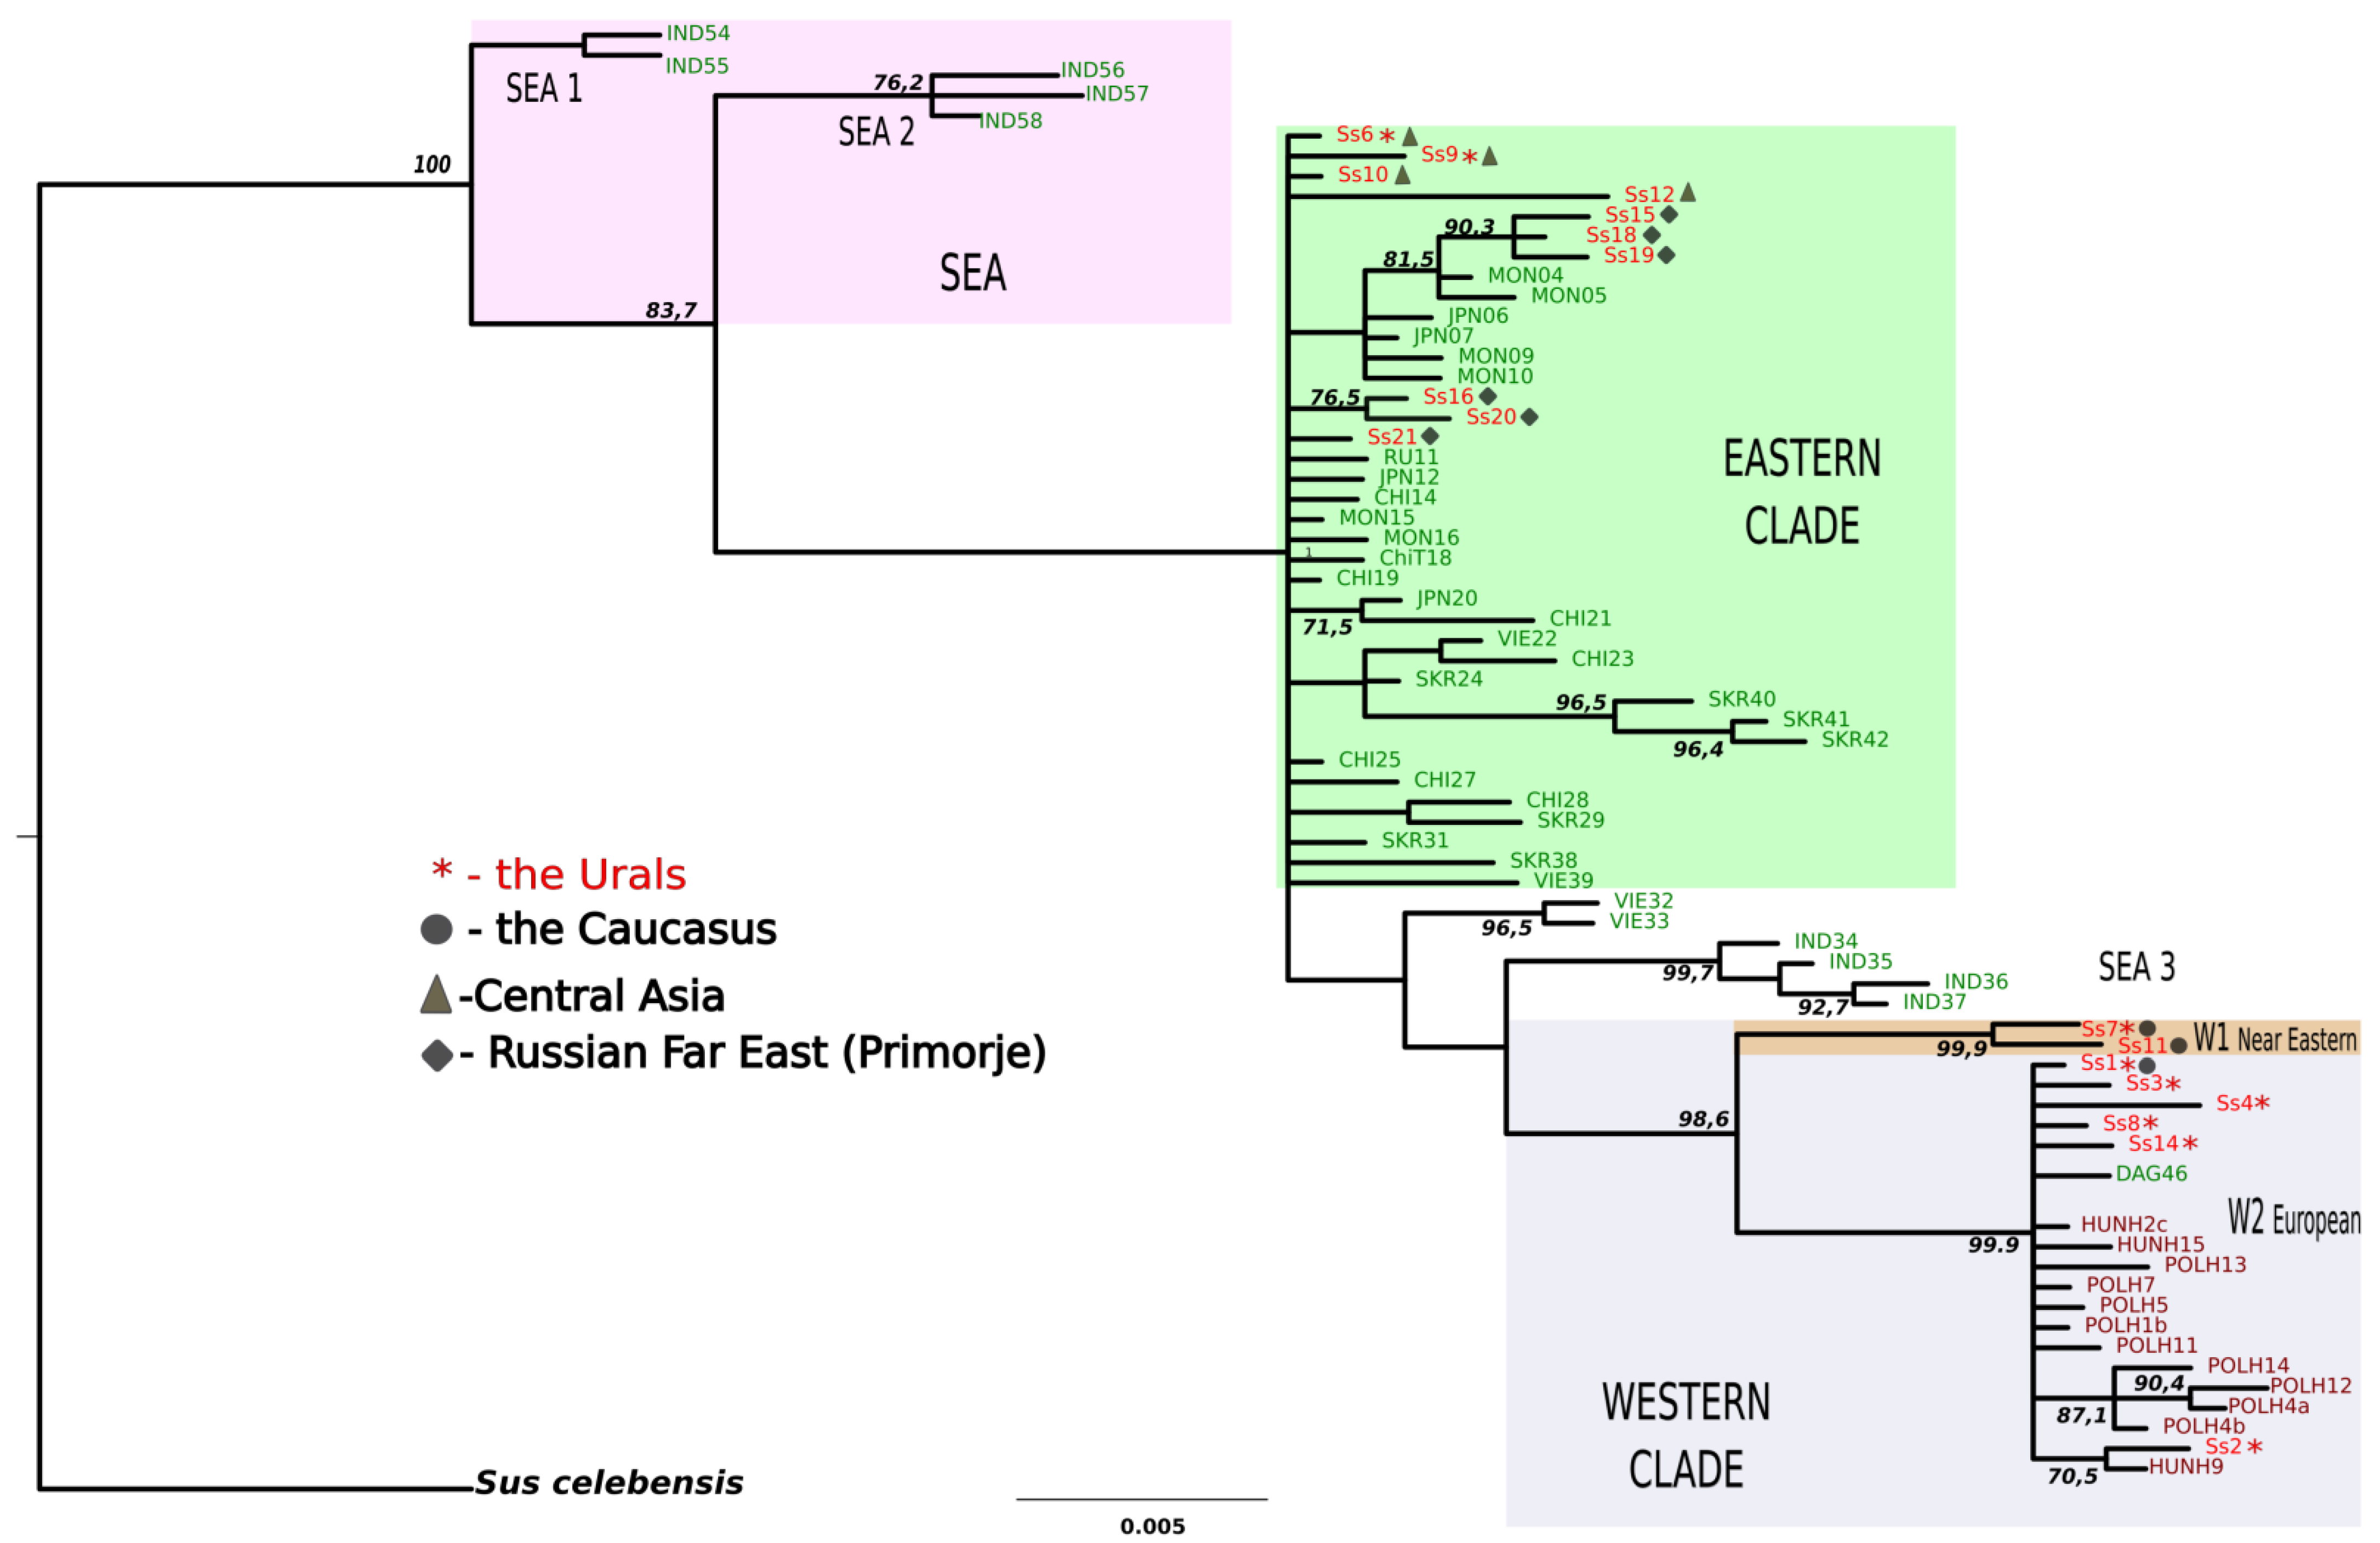
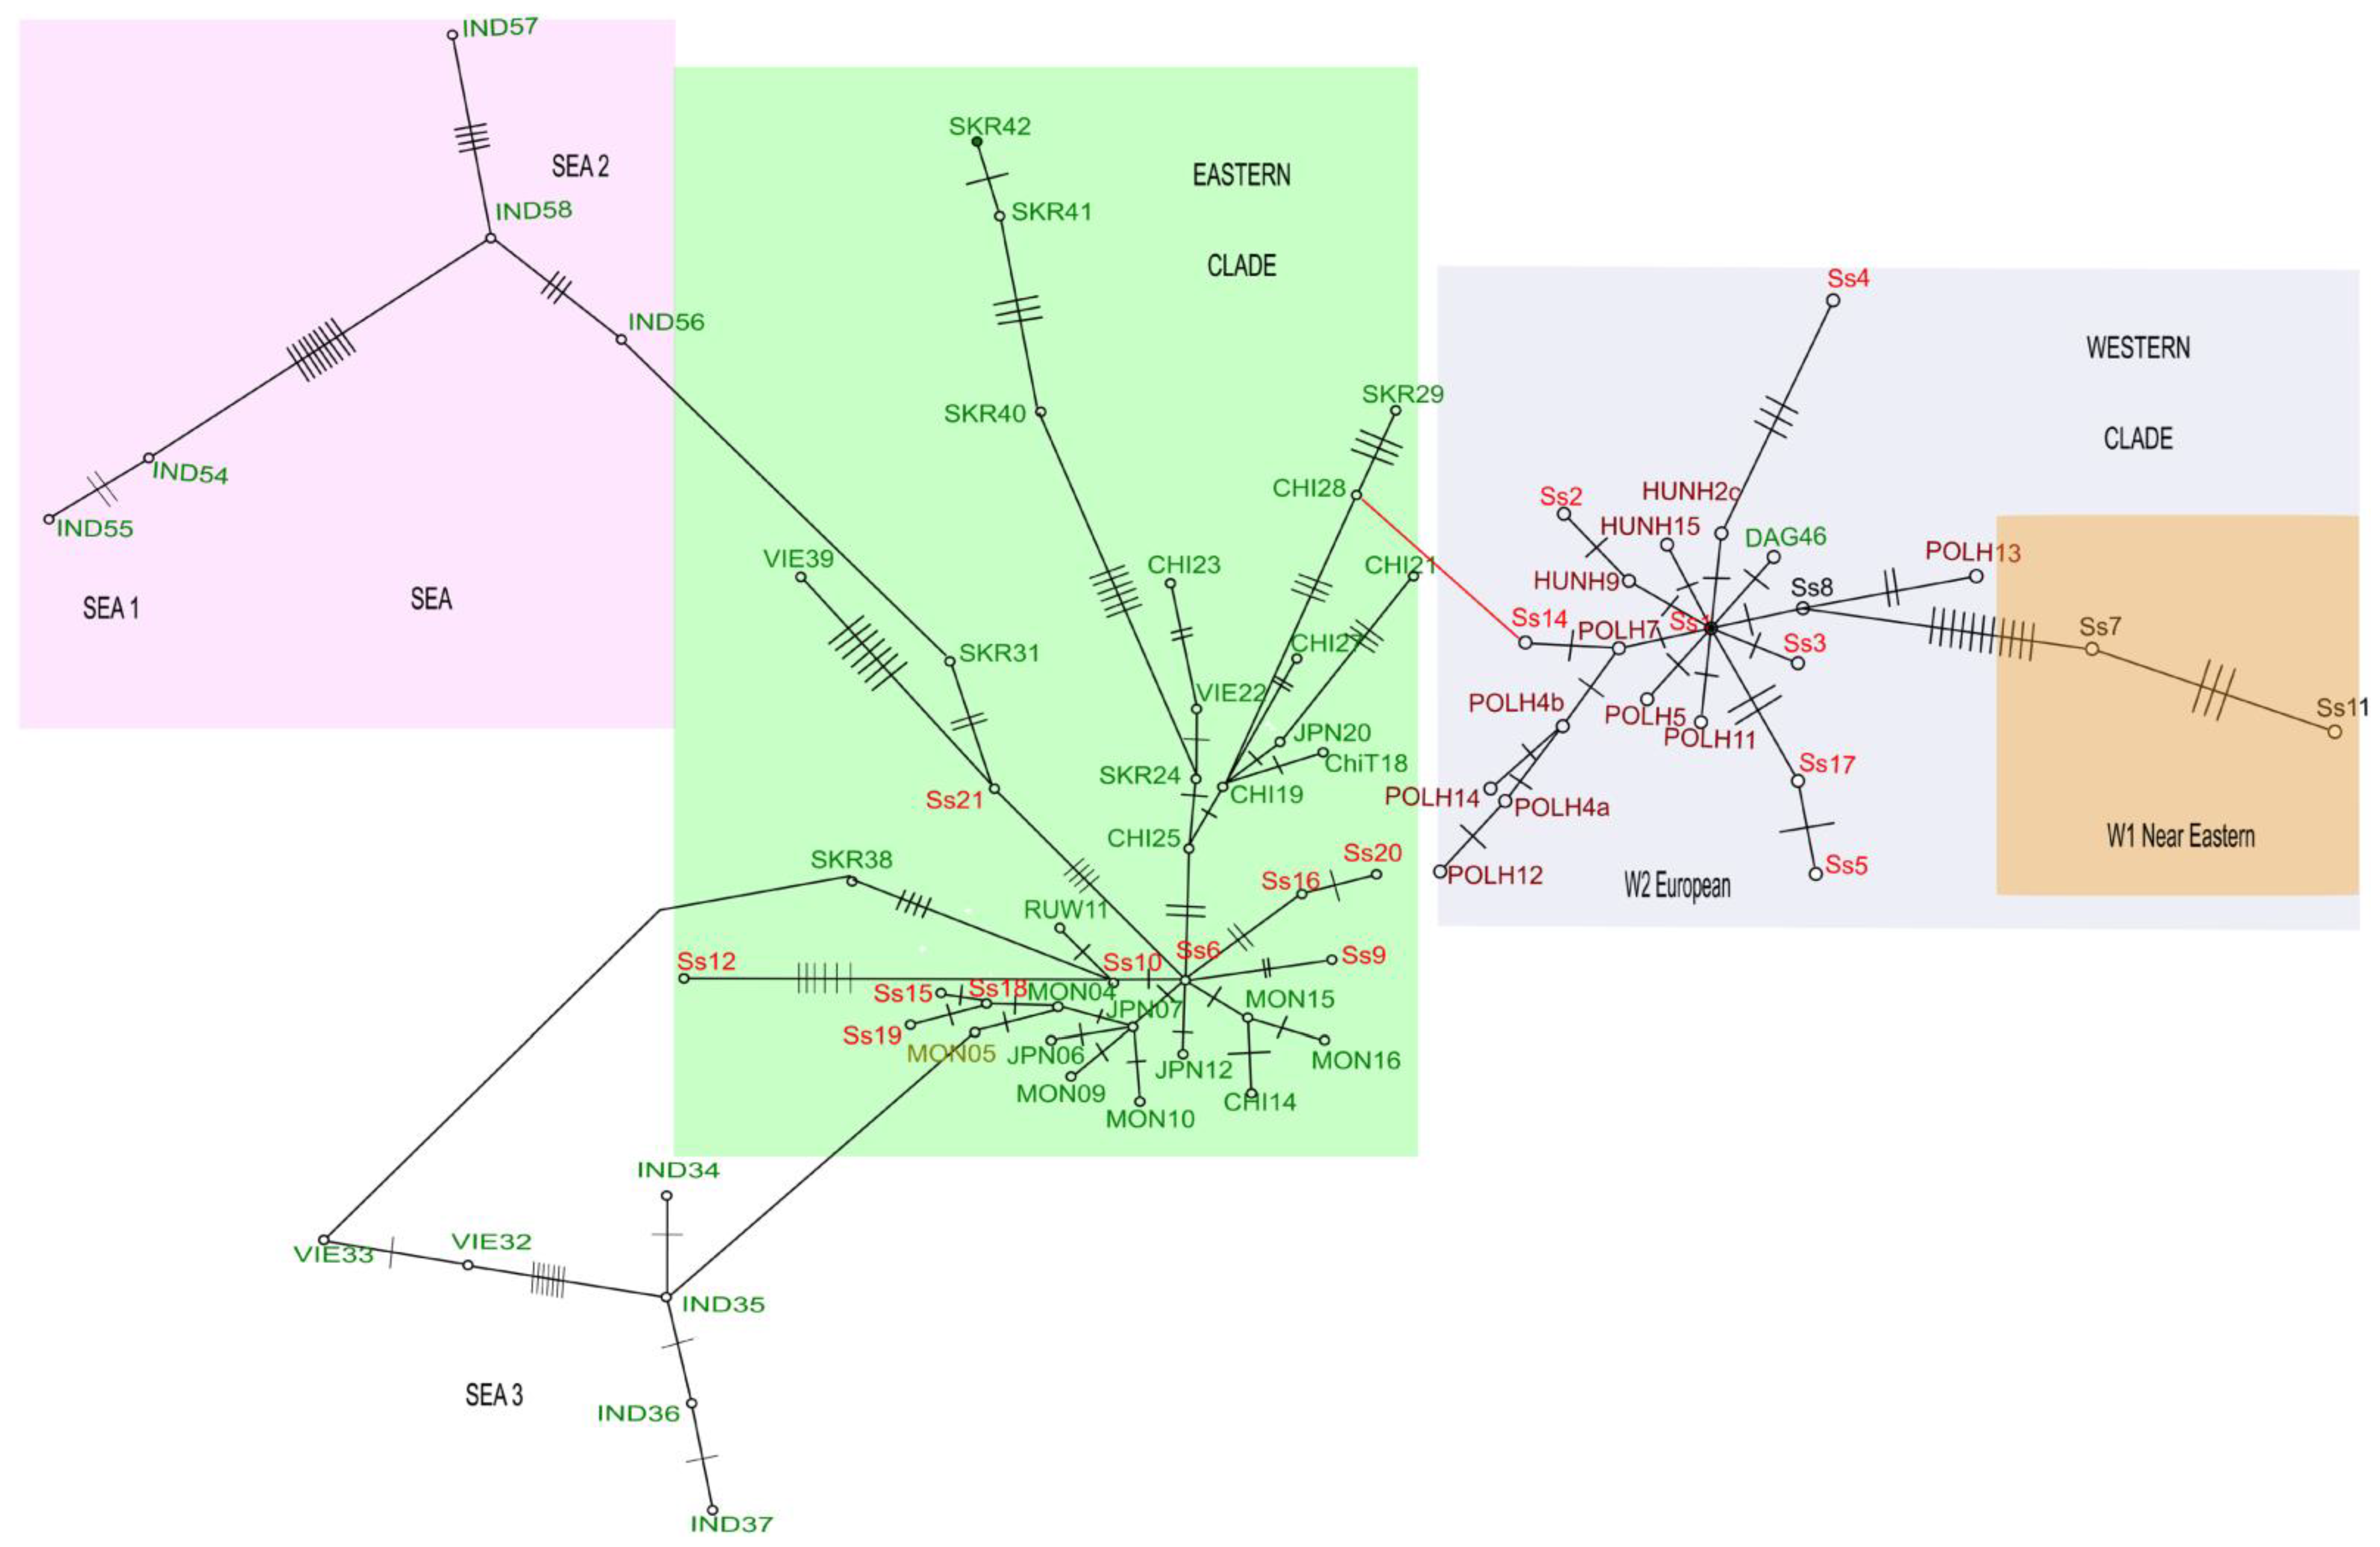
3.2.1. The Topology of Trees

We constructed phylogenetic trees based on the 637- and 547-bp fragments of the mtDNA control region. The phylogenetic tree based on the 637-bp fragment includes mtDNA samples (i.e., individuals) from Asia and the Eastern Caucasus (this study and [64]), Eastern and Central Europe [59], and the Ural region (this study). The phylogenetic tree based on the 547-bp fragment involves additional mtDNA samples from sequences from Iran [84]. The inclusion of mtDNA samples from Iran allowed assignment of our sequences to the Near Eastern clade described by Khalilzadeh P. et al. [84]. The topologies of both trees are the same. We then inspected the 637-bp-fragment-based tree (Figure 2). Interpretation of the Near Eastern cluster was performed in accordance with the 547-bp-fragment-based tree (Supplementary Figure S1).
All the mtDNA samples clustered into four big haplogroups (Figure 2): two clusters containing individuals from South Eastern Asia (SEA 1 and 2), one cluster with sequences from continental Asia (from the Far East to Caspian Sea) and Japan (hereafter, the Eastern clade), and the clade that could be tentatively named Western because the mtDNA samples in this group originate from the western part of the wild boar geographic range. The topology of the 637-bp tree supports some previously published phylogeographical reconstructions for the wild boar [51,61,64]. The SEA clade is basal to all the other groups, and the Eastern clade is basal to the Western clade. The Western clade, in its basal part, includes haplotypes from South Eastern Asia (Indonesia and Vietnam, SEA 3), but the connection of these haplotypes to the Western clade is poorly supported (53%). The haplotype network (Figure 3) unambiguously indicates that this group is related to the Eastern not the Western clade. The rest of the haplotypes within the Western clade split into two well-supported clusters. One exclusively contains mtDNA samples originating from the Urals and Caucasus region (W1). These sequences are similar to those from Iran [84] (see Supplementary Figure S1); thus, we interpreted this group as a Near Eastern clade. The second cluster in the Western clade (W2) includes individuals from the Urals, Caucasus, and Europe. These sequences group with mtDNA samples from Eastern Europe; therefore, we designated this group as the European clade. On the Bayes tree, W1 is a sister group to W2 (Figure 2) while the haplotype network (Figure 3) shows that W1 originates from W2. This result is in agreement with the network presented by Ashrafzadeh M. et al. [52].

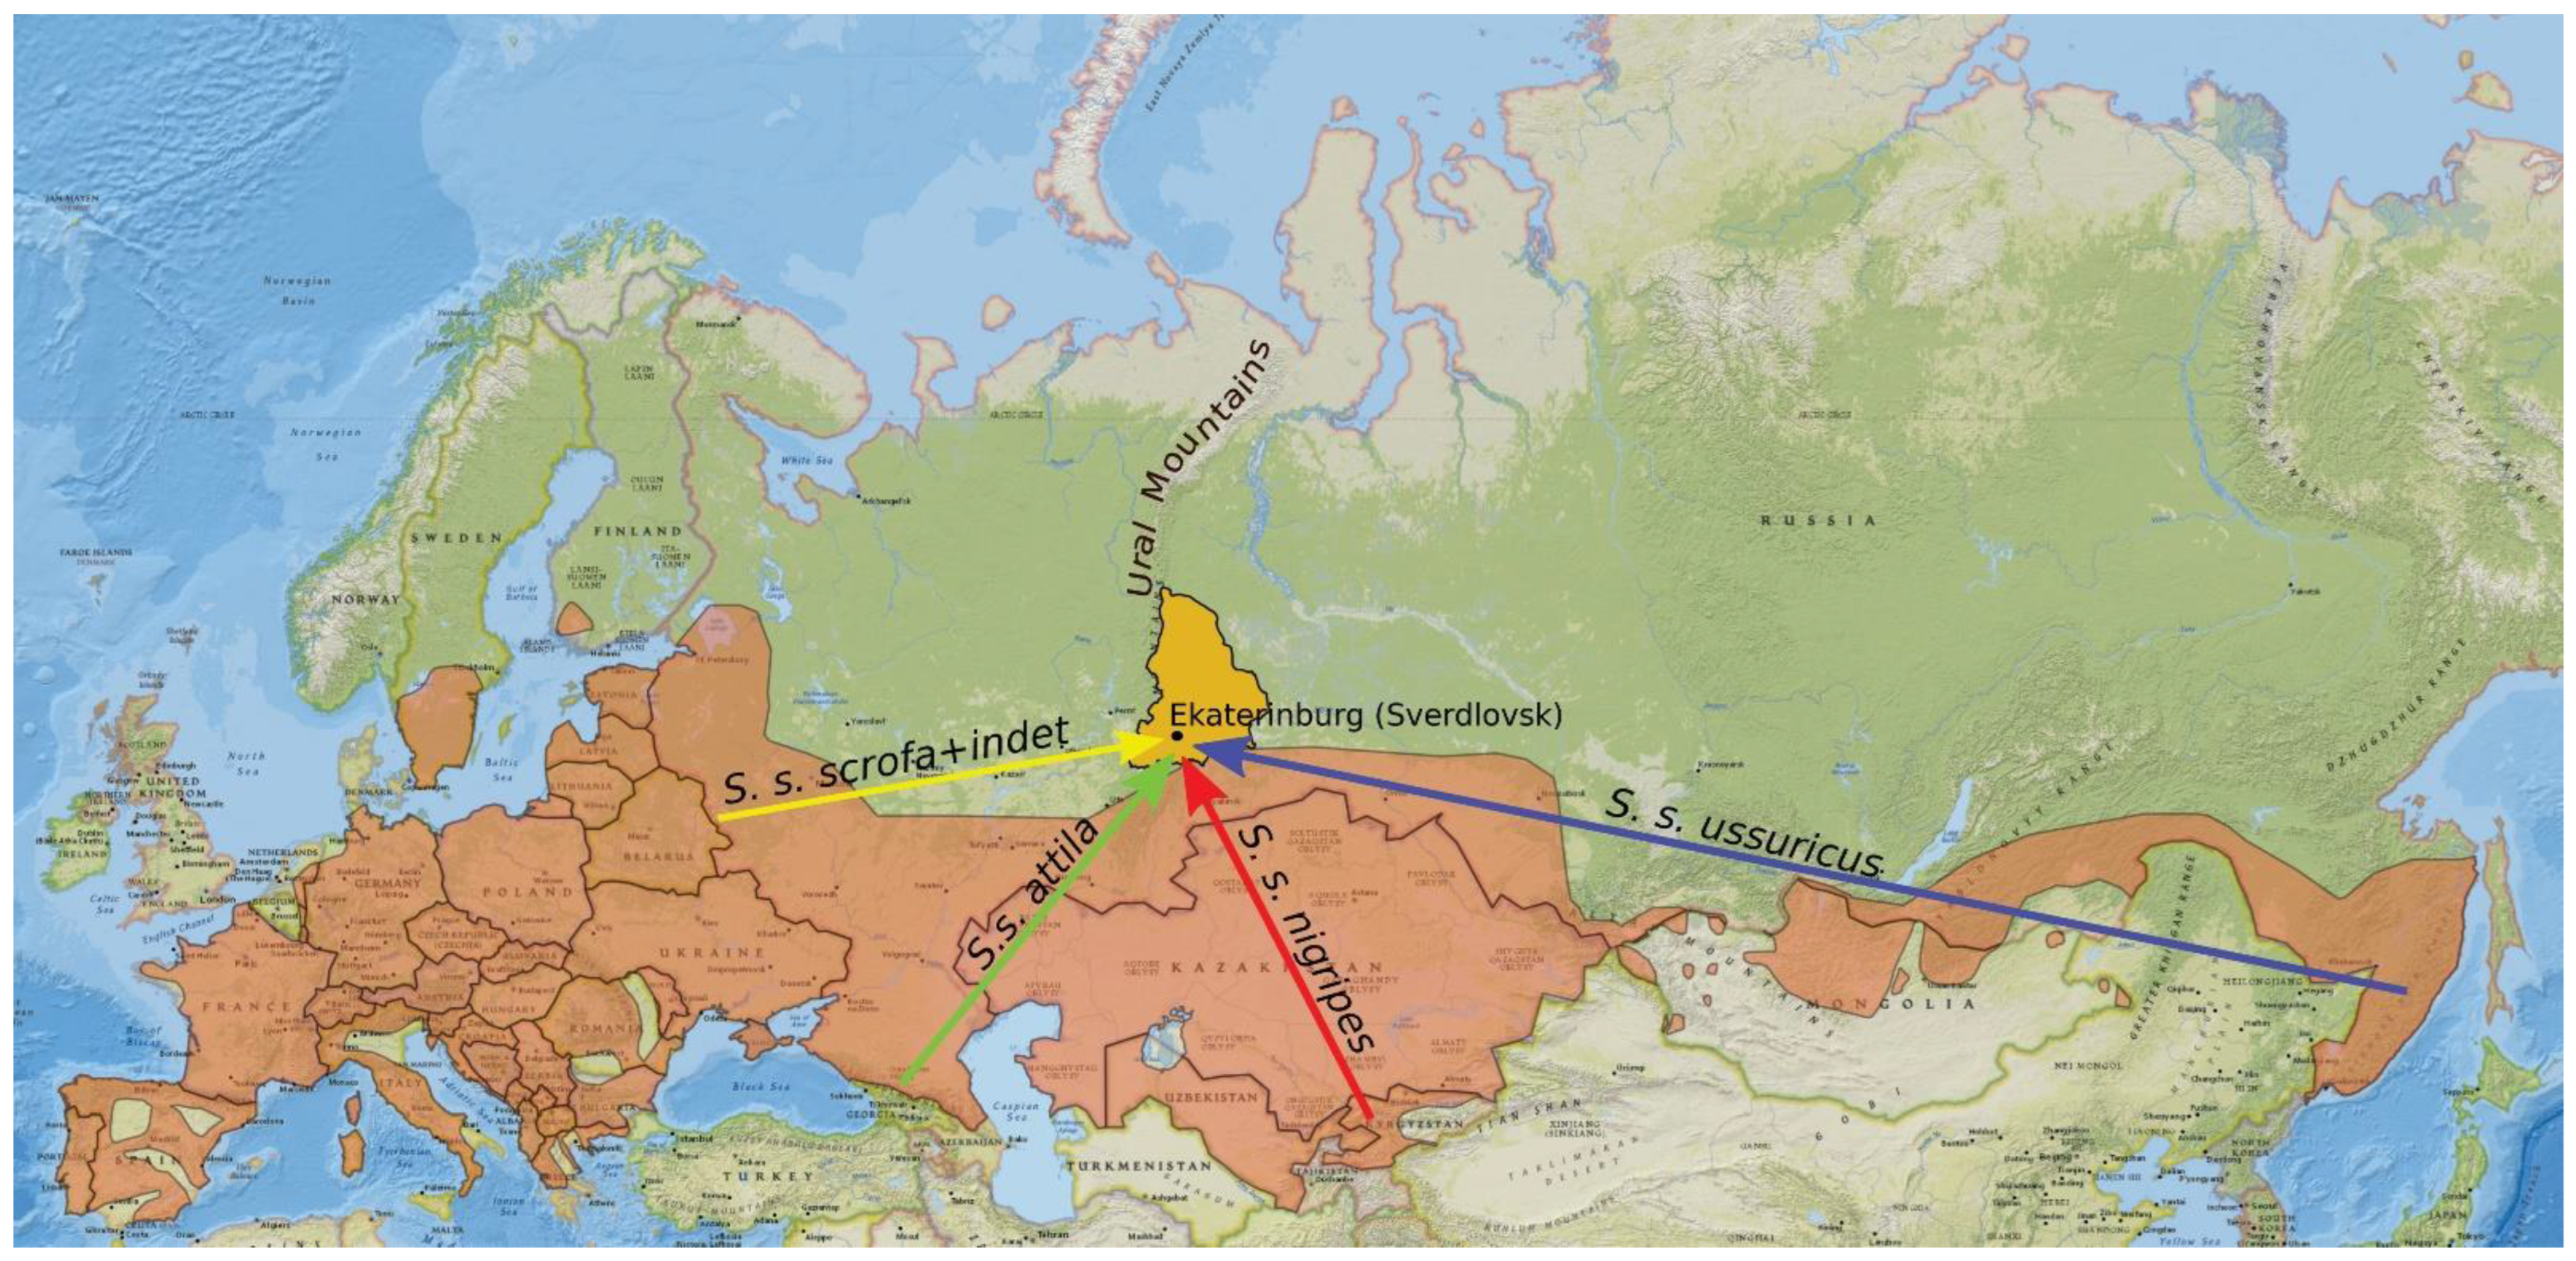
3.2.2. Positions of Founder Populations on the Phylogenetic Tree

The mtDNA samples from the Russian Far East (Primorsky Krai) ended up in the Eastern clade. Two haplotypes (Ss16 and Ss20) grouped into a highly supported cluster: The others clustered with individuals from Mongolia and Japan. All the mtDNA samples from Central Asia fall into the Eastern clade with no structure within it. The mtDNA samples from the Eastern Caucasus (Dagestan) ended up in the Western clade, with two haplotypes in the Near Eastern cluster and one in the European cluster.

3.2.3. Positions of Haplotypes from the Introduced Population on the Phylogenetic Tree

The haplotypes from the Ural population are affiliated with all clades except SEA (Figure 2). Two haplotypes (Ss6 and Ss9) fall into the Eastern clade. Both proved to be identical to haplotypes typical for Central Asia (Table 1). Nine haplotypes are unique to the Western clade. Two of them (Ss7 and Ss11) are identical to the haplotypes found in the Eastern Caucasus and are affiliated with the Near Eastern (W1) clade.

3.3. Proportions of MtDNA Lineages in the Current Wild Boar Population of the Urals in Comparison with the Proportions of Released Subspecies

Twenty-six percent of the animals released in the Ural region originate from the Caucasus (supposedly representing subspecies S. s. attila) or Eastern Europe (Belarus) (S. s. scrofa) (Table 3) and hence belong to the Western clade (Figure 2). The proportion of wild boars translocated from Asia (Central Asia: S. s. nigripes and Far East: S. s. ussuricus) was found to be 23%. The remaining 51% of the wild boars released in the Urals were taken from mixed populations [41]. The ratios of European, Near Eastern, and Asian haplotypes in Western Russia were borrowed from [69]. After recalculation of the data from mixed populations, the proportions of representatives of the Western and Eastern clades in the releases were 0.66 and 0.34, respectively. The proportions of Western (European and Near Eastern) and Eastern haplotypes in the current population turned out to be 0.92 and 0.08; therefore, the proportion of Western haplotypes is 1.41 times higher while that of Eastern haplotypes is 4.25 times lower as compared to the founder population.

4. Discussion

We, for the first time, analyzed the modern haplotypic composition of a wild boar population introduced at the northern edge of the species’ range and tested three hypotheses about the genetic consequences of establishing a population originating from numerous introductions of different subspecies. Below, we discuss each hypothesis and outline questions arising from our results.

4.1. Genetic Diversity in the Introduced Population

Dlugosch K.M. and Parker I.M. [2] reported that the loss of allele diversity in the populations of plants and animals established via multiple introductions is ~7.9% of that in the source populations. When their data were recalculated for mammals, the average loss was approximately −9.8% of allele richness. In our case, Hd of the Ural population equals the average haplotype diversity in the founder populations. It is obviously high in comparison with the Caucasus, where the diversity could be low due to a strong decline in the wild boar population in 2010–2011 resulting from an outbreak of African swine fever [96]. The recent bottleneck in the Caucasus is clearly supported by the obtained Tajima’s D and Fu’s Fs statistics (Table 2). The haplotype diversity in the Urals is 35% lower than that reported for Western Europe on the basis of a shorter fragment (0.902) [97] and 12% lower than the value (0.71) reported for Eastern and Central Europe on the basis of complete D-loop sequences [59]. Moreover, it is lower than the values reported for introduced populations in the USA (0.825) [67] and Argentina (0.827) [98]; these populations are mainly of European origin.
The reason for the relatively low values of Hd is the distribution of haplotype frequencies that is strongly biased toward haplotypes Ss1 and Ss2. These two haplotypes were detected in 79% of the Ural wild boars. They are shared between the Urals and Eastern Europe [59]. Of note, in the study population of Niedziałkowska M. et al. [59], Ss1 dominated over Ss2 (302 versus 90 individuals), whereas in our study population, the proportion of Ss2 is higher than that of Ss1 (57 versus 35 individuals). The current value of Hd indicates that most of the wild boar population in the Ural originates from a relatively small number of genetically similar founders with the European haplotypes. Multi-source introductions have not resulted in an increase in haplotype diversity as reported by other authors for plants and lizards [13,19,20]. The low haplotype diversity compared to the American population of introduced feral pigs could be explained by the high proportion of domestic swine haplotypes in the USA and a smaller sample size in comparison with both the USA and Argentina [67,98].

4.2. Phylogenetic Lineages in the Natural and Introduced Populations

Our phylogenetic tree is similar to other published phylogenies based on the mtDNA control region [51,64,84] in terms of the splitting of the whole dataset into South Eastern Asian, Eastern, and Western (including Near Eastern) clades. Our analysis was aimed at determining the positions of previously unsampled (or poorly sampled) populations within the reported clades. It yielded several interesting results. First, the Central Asian mtDNA samples are unambiguously positioned within the Eastern clade. Most of these haplotypes are situated on the basal branch and do not cluster together. Khalilzadeh P. et al. [84] found the Eastern haplotypes in eastern Iran while in Southern and Western Iran, the Western (therefore Near Eastern and European) haplotypes were predominant. After combining this finding with our data, we propose that the east coast of the Caspian Sea is the western boundary of the Eastern clade. Half of the haplotypes found in the Central Asian samples were the new haplotypes, which is no surprise given this region has never been sampled before. Far Eastern haplotypes are also (expectedly) in the Eastern clade, and three of them group into a highly supported cluster within this clade. The history of Far Eastern wild boar populations has been discussed previously in several articles [61,64]; for this reason, we did not focus on this topic in this work.
The MtDNA samples from the Eastern Caucasus ended up (in equal proportions of individuals) in the European and Near Eastern clades. Particularly, the newly described haplotype Ss11 is in the Near Eastern clade. Khederzadeh S. et al. [81] revealed that the Dagestanian haplotypes are distant from all other European individuals and suggested possible gene flow from the Caucasus to Southern Europe. Most likely, the haplotypes analyzed in that study belong to the Near Eastern clade because other haplotypes found in the Eastern Caucasus grouped well with the mtDNA samples found by Niedziałkowska M. et al. [59] in Central and Eastern Europe. The presence of highly distant haplotypes in the Eastern Caucasus may reflect both historical processes (hypothesized presence of S. s. attila in the northern and S. s. lybicus in the southern part of the Caucasian region, as reported by Groves (1981) [99]) and recent processes (an outbreak of African swine fever and decline in the wild boar population [96]) that shape this species’ genetic diversity. The Eastern Caucasus (like Central Asia) is characterized by a high proportion of the newly described haplotypes since only few sequences have been previously published for this region. The newly described haplotype Ss11 is closer to Near Eastern Ss7 than to European Ss1 (99% and 97.6% identity, respectively)
Finally, the haplotypes from the Urals (the introduced population) proved to be affiliated with the Eastern, Near Eastern, and European clades. The current haplotypes found in the Urals could have originated from representatives of different subspecies brought from the Caucasus, Central Asia, and Eastern Europe (Belarus and Western Russia) but also from mixed populations transferred to the Urals from Central Russia [48]. The Near Eastern haplotype found in the Urals is identical to that registered in the Eastern Caucasus. Two Asian haplotypes detected in the Ural region are identical to those found in Central Asia (Uzbekistan and Kazakhstan). Our results show that the Near Eastern and some Asian mtDNA haplotypes did not go extinct during colonization of the region that is situated at the north eastern periphery of the geographical range. Of note, in the Urals, we did not find haplotypes identical to those from the Far East, although 123 individuals were released there, and wild boars from the Central Russian populations could also possess these haplotypes. There may be two explanations. First, the Far Eastern animals could have migrated from the site of the release to the unsampled parts of the Urals. Second, they could have become locally extinct while expanding to new territories. Testing the first supposition would require wider sampling in the Ural region. The second supposition will be discussed in the subsection where we compare the proportions of Western and Eastern haplotypes among the released animals to those in the current population.
We detected three haplotypes (Ss5, Ss13, and Ss17) that appeared to be identical to sequences previously reported for the domestic pig [92,100,101]. These haplotypes were found in the Urals (Ss5 and Ss13) and in the Russian Far East (Ss17). We suspect these animals to be hybrids between a male wild boar and a female domestic pig. The proportion of these (possibly) hybrid haplotypes was 14.3% (3 of 21), which is similar to the average proportion of wild boar × domestic pig hybrids in European populations [102,103]. On the other hand, the proportion of individuals carrying these haplotypes did not exceed 2.5% in each population (the Urals and Russian Far East). It is quite possible that the level of introgression is much higher, but the mitochondrial DNA marker for identifying hybrid individuals can be a useful marker for identifying hybrid individuals, although it underestimates their frequency [104].

4.3. Predominance of the Western Clade and a Decline in Eastern Mitochondrial Lineages in the Introduced Population of Wild Boars

We demonstrated that in the Ural population, the proportions of Eastern and Western haplotypes changed in comparison with those at the time of the introduction. The strong increase in the proportion of European haplotypes and a respective decrease in Asian haplotypes could be explained in three ways:
  • Animals from Asia were not detected in the sampled region because they dispersed to some other territories. Validation of this explanation requires wider sampling across the whole Ural region.
  • The proportion of European haplotypes increased due to unofficial releases in the 2000s. Neither the number of individuals released during such unofficial introductions nor their origin are known. It is unlikely that wild boars were brought to the Urals from distant regions of Russia (such as the Russian Far East or Caucasus) or from Central Asia. Most probably, they were taken from local populations or brought from mixed populations of Central Russia, where the European lineage is more prevalent than the Asian one [69]. They could also be hybrids between wild boars and domestic pigs. All these factors could affect the genetic composition of the introduced population in some way. On the other hand, the current population of wild boars was established well before the 2000s. Thus, we believe that the haplotype frequencies in the current population are mainly a consequence of natural processes.
  • Our third explanation is that animals carrying Western mitochondrial haplotypes are better adapted for survival and expansion in a new environment than those from the Eastern haplogroup. The lower survival rate of Eastern (particularly Far Eastern) haplotypes could be caused by two processes. First, the animals from the Caucasus, Central Asia, and Russian Far East could disperse across long distances from the release site. A possible reason is a difference in the habitat composition between the Urals and the regions of the animals’ origin (natal habitat preference induction hypothesis [105]). More distant dispersal could lead to higher mortality [106] and hence to a decrease in the proportion of Asian haplotypes. The second process is related to the genetic diversity in the founder populations. Recently, Kostyunina O. et al. [70] showed lower genomic variation in Far Eastern wild boars than in European ones. It is possible that the low genetic variation could cause low adaptability of Far Eastern wild boars, which, in turn, leads to the elimination of their mitochondrial haplotypes. Moreover, Tsai T.S. et al. [107] demonstrated that domestic pigs with European mitochondrial haplotypes produce significantly larger litters, whereas the haplotypes that cluster with Asian mitochondrial haplotypes have the lowest reproductive efficiency rates. The higher proportion and adaptability of the European lineage could also be attributed to a relatively high level of hybridization with domestic pigs in many European populations [108].
The prevalence of European haplotypes in the mixed populations of wild boars in Western Russia has been reported by Davidova E.E. et al. [69], but their sample sizes in many regions did not exceed two individuals, and they did not compare data from mixed populations to those from the founder populations.

4.4. The Wild Boar in the Urals as a Model of Genetic Processes in Expanding (or Invading) Populations

The scenario of wild boar expansion in the eastern Urals appears to be similar to the scenarios of this species’ expansions after the Last Glacial Maximum. According to the contraction–expansion hypothesis [109,110], the postglacial expansion of the species proceeded from the few refugia that were typically characterized by high genetic diversity in comparison with the continent in general. In the case of the wild boar in the eastern Urals, the sites of releases could be compared to the refugia where many genetic lineages were present before the expansion. Expansion with one lineage dominating the others is similar to the scenarios of expansion of S. scrofa [55,58] and other mammalian species, e.g., the red deer Cervus elaphus and the European roe deer Capreolus capreolus [111,112], and is in agreement with the postglacial leading edge expansion hypothesis [113,114]. Consequently, the genetic processes in this population could be used for clarifying the temporal dynamics of expanding populations on a larger spatial and temporal scale. Especially interesting is the monitoring of the spatial and temporal variation of proportions of dominant and rare genetic lineages and investigation of the factors that could shape this variation.
In conclusion, in our analysis based on reliable mtDNA samples from both founders’ and introduced populations, we demonstrate that 38 years after the introductions of various subspecies of the wild boar into the eastern part of the Urals, the current population (1) has genetic diversity similar to or higher than that in the founders’ populations, thus supporting hypothesis 1; (2) retains haplotypes from all the major mtDNA lineages (European, Near Eastern, and Asian), thereby supporting hypothesis 2 that the main genetic lineages present in founder populations were preserved in the newly established population; and (3) the proportion of the European haplogroup increased while proportions of other haplogroups decreased in comparison with those suggested for the released individuals, thus refuting hypothesis 3. The last result allows us to theorize that the European genotypes are better adapted for expansion and survival in a new harsh environment in comparison with the Asian genotypes. In particular, this state of affairs could result from wild boar × domestic pig hybridization in many European populations. Additional studies using short-tandem-repeat and single-nucleotide-polymorphism markers are needed to test this hypothesis and reveal the proportion of hybrid individuals in the Ural population.

Supplementary Materials

The following supporting information can be downloaded at: https://www.mdpi.com/article/10.3390/d14110916/s1, Table S1: List of mtDNA control region sequences described in this study; Table S2: List of mtDNA control region haplotypes used for phylogenetic analysis. Figure S1: The Bayesian (MCMC) haplotype tree based on the partial sequences of the mtDNA control region (548 bp) from the Eurasian wild boar.

Author Contributions

Conceptualization, N.I.M.; investigation, N.I.M., M.N.R. and V.A.M.; formal analysis, N.I.M.; visualization, N.I.M. and V.A.M.; resources, N.I.M., E.A.B. (Elmar A. Babaev)., I.V.S., A.V.S., E.A.B. (Elena A. Bykova), A.V.E., O.S.P. and S.T.N.; writing—original draft preparation, N.I.M., O.S.P. and V.A.M. All authors have read and agreed to the published version of the manuscript.

Funding

This research was funded by the Russian Foundation for Basic Research, grant number 20-04-00234. V.A.M. was funded by the Program of Basic Research in the Russian Federation for the 2021–2030 period (project No. 121052600294-6).

Institutional Review Board Statement

The wild boar is classified as a game animal in all the countries and regions covered by the sampling in this study, and all the samples of wild boar muscle tissue were either donated by hunters holding a hunting license or collected from carcasses of accident-killed animals; alternatively, DNA was extracted from the animals’ feces. Because no animals were killed specifically for the purpose of this research, we did not attempt to seek approval from ethical review boards in the participating countries. Nonetheless, the procedures involving tissue samples from wild boars were in compliance with laws of the countries involved in this study.

Data Availability Statement

Sequence data that support the findings of this work were deposited in GenBank under accession numbers OP566396-OP566416.

Acknowledgments

N.I.M. was supported by the Russian Foundation for Basic Research (grant No. 20-04-00234). The authors thank the Department of Wildlife Protection of Sverdlovsk Oblast for help with organizing the collection of the wild boar tissue samples from hunters. We thank two anonymous reviewers for their valuable comments.

Conflicts of Interest

The authors declare no competing interest.

References

  1. Ehrenfeld, J.G. Ecosystem Consequences of Biological Invasions. Annu. Rev. Ecol. Evol. Syst. 2010, 41, 59–80. [Google Scholar] [CrossRef] [Green Version]
  2. Dlugosch, K.M.; Parker, I.M. Founding Events in Species Invasions: Genetic Variation, Adaptive Evolution, and the Role of Multiple Introductions. Mol. Ecol. 2008, 17, 431–449. [Google Scholar] [CrossRef] [PubMed]
  3. Roman, J.; Darling, J. Paradox Lost: Genetic Diversity and the Success of Aquatic Invasions. Trends Ecol. Evol. 2007, 22, 454–464. [Google Scholar] [CrossRef]
  4. Verhoeven, K.J.F.; Macel, M.; Wolfe, L.M.; Biere, A. Population Admixture, Biological Invasions and the Balance between Local Adaptation and Inbreeding Depression. Proc. R. Soc. B Biol. Sci. 2011, 278, 2–8. [Google Scholar] [CrossRef] [Green Version]
  5. Hovick, S.M.; Whitney, K.D. Hybridisation Is Associated with Increased Fecundity and Size in Invasive Taxa: Meta-Analytic Support for the Hybridisation-Invasion Hypothesis. Ecol. Lett. 2014, 17, 1464–1477. [Google Scholar] [CrossRef] [Green Version]
  6. Bock, D.G.; Caseys, C.; Cousens, R.D.; Hahn, M.A.; Heredia, S.M.; Huebner, S.; Turner, K.G.; Whitney, K.D.; Rieseberg, L.H. What We Still Don’t Know about Invasion Genetics. Mol. Ecol. 2015, 24, 2277–2297. [Google Scholar] [CrossRef]
  7. Heckwold, M.J.; Morim, T.; Riccioli, F.; Baltazar-Soares, M. Fresh Start after Rough Rides: Understanding Patterns of Genetic Differentiation upon Human-Mediated Translocations. Biol. Invasions 2021, 23, 3625–3639. [Google Scholar] [CrossRef]
  8. Stelkens, R.; Seehausen, O. Genetic Distance between Species Predicts Novel Trait Expression in Their Hybrids. Evolution 2009, 63, 884–897. [Google Scholar] [CrossRef] [Green Version]
  9. Nolte, A.W.; Tautz, D. Understanding the Onset of Hybrid Speciation. Trends Genet. 2010, 26, 54–58. [Google Scholar] [CrossRef]
  10. Salmenkova, E.A. Population Genetic Processes in Introduction of Fish. Russ. J. Genet. 2008, 44, 758–766. [Google Scholar] [CrossRef]
  11. Rius, M.; Darling, J.A. How Important Is Intraspecific Genetic Admixture to the Success of Colonising Populations? Trends Ecol. Evol. 2014, 29, 233–242. [Google Scholar] [CrossRef]
  12. Lavergne, S.; Molofsky, J. Increased Genetic Variation and Evolutionary Potential Drive the Success of an Invasive Grass. Proc. Natl. Acad. Sci. USA 2007, 104, 3883–3888. [Google Scholar] [CrossRef] [Green Version]
  13. Hathaway, L.; Andersson, S.; Prentice, H.C. Experimental Crosses within European Silene latifolia (Caryophyllaceae): Intraspecific Differentiation, Distance Effects, and Sex Ratio. Botany 2009, 87, 231–240. [Google Scholar] [CrossRef]
  14. Barker, B.S.; Cocio, J.E.; Anderson, S.R.; Braasch, J.E.; Cang, F.A.; Gillette, H.D.; Dlugosch, K.M. Potential Limits to the Benefits of Admixture during Biological Invasion. Mol. Ecol. 2019, 28, 100–113. [Google Scholar] [CrossRef] [Green Version]
  15. Facon, B.; Pointier, J.-P.; Jarne, P.; Sarda, V.; David, P. High Genetic Variance in Life-History Strategies within Invasive Populations by Way of Multiple Introductions. Curr. Biol. 2008, 18, 363–367. [Google Scholar] [CrossRef]
  16. Ebbs, E.T.; Loker, E.S.; Brant, S.V. Phylogeography and Genetics of the Globally Invasive Snail Physa acuta Draparnaud 1805, and Its Potential to Serve as an Intermediate Host to Larval Digenetic Trematodes. BMC Evol. Biol. 2018, 18, 103. [Google Scholar] [CrossRef] [PubMed] [Green Version]
  17. Usio, N.; Azuma, N.; Larson, E.R.; Abbott, C.L.; Olden, J.D.; Akanuma, H.; Takamura, K.; Takamura, N. Phylogeographic Insights into the Invasion History and Secondary Spread of the Signal Crayfish in Japan. Ecol. Evol. 2016, 6, 5366–5382. [Google Scholar] [CrossRef] [Green Version]
  18. Flucher, S.M.; Krapf, P.; Arthofer, W.; Suarez, A.V.; Crozier, R.H.; Steiner, F.M.; Schlick-Steiner, B.C. Effect of Social Structure and Introduction History on Genetic Diversity and Differentiation. Mol. Ecol. 2021, 30, 2511–2527. [Google Scholar] [CrossRef]
  19. Kolbe, J.J.; Glor, R.E.; Schettino, L.R.; Lara, A.C.; Larson, A.; Losos, J.B. Genetic Variation Increases duringbiological Invasion by a Cuban Lizard. Nature 2004, 431, 177–181. [Google Scholar] [CrossRef]
  20. Kolbe, J.J.; Larson, A.; Losos, J.B. Differential Admixture Shapes Morphological Variation among Invasive Populations of the Lizard Anolis sagrei. Mol. Ecol. 2007, 16, 1579–1591. [Google Scholar] [CrossRef]
  21. Schulte, U.; Veith, M.; Mingo, V.; Modica, C.; Hochkirch, A. Strong Genetic Differentiation Due to Multiple Founder Events during a Recent Range Expansion of an Introduced Wall Lizard Population. Biol. Invasions 2013, 15, 2639–2649. [Google Scholar] [CrossRef]
  22. Zalewski, A.; Michalska-Parda, A.; Ratkiewicz, M.; Kozakiewicz, M.; Bartoszewicz, M.; Brzeziński, M. High Mitochondrial DNA Diversity of an Introduced Alien Carnivore: Comparison of Feral and Ranch American Mink Neovison vison in Poland. Divers. Distrib. 2011, 17, 757–768. [Google Scholar] [CrossRef]
  23. Frantz, A.C.; Heddergott, M.; Lang, J.; Schulze, C.; Ansorge, H.; Runge, M.; Braune, S.; Michler, F.-U.; Wittstatt, U.; Hoffmann, L.; et al. Limited Mitochondrial DNA Diversity Is Indicative of a Small Number of Founders of the German Raccoon (Procyon lotor) Population. Eur. J. Wildl. Res. 2013, 59, 665–674. [Google Scholar] [CrossRef]
  24. Gaubert, P.; Del Cerro, I.; Centeno-Cuadros, A.; Palomares, F.; Fournier, P.; Fonseca, C.; Paillat, J.-P.; Godoy, J.A. Tracing Historical Introductions in the Mediterranean Basin: The Success Story of the Common Genet (Genetta genetta) in Europe. Biol. Invasions 2015, 17, 1897–1913. [Google Scholar] [CrossRef] [Green Version]
  25. Searle, J.B.; Jamieson, P.M.; Gündüz, İ.; Stevens, M.I.; Jones, E.P.; Gemmill, C.E.C.; King, C.M. The Diverse Origins of New Zealand House Mice. Proc. R. Soc. B Biol. Sci. 2009, 276, 209–217. [Google Scholar] [CrossRef] [Green Version]
  26. King, C.; Alexander, A.; Chubb, T.; Cursons, R.; MacKay, J.; McCormick, H.; Murphy, E.; Veale, A.; Zhang, H. What Can the Geographic Distribution of MtDNA Haplotypes Tell Us about the Invasion of New Zealand by House Mice Mus musculus? Biol. Invasions 2016, 18, 1551–1565. [Google Scholar] [CrossRef]
  27. Grossen, C.; Biebach, I.; Angelone-Alasaad, S.; Keller, L.F.; Croll, D. Population Genomics Analyses of European Ibex Species Show Lower Diversity and Higher Inbreeding in Reintroduced Populations. Evol. Appl. 2018, 11, 123–139. [Google Scholar] [CrossRef] [Green Version]
  28. Stipoljev, S.; Safner, T.; Gančević, P.; Galov, A.; Stuhne, T.; Svetličić, I.; Grignolio, S.; Cassinello, J.; Šprem, N. Population Structure and Genetic Diversity of Non-Native Aoudad Populations. Sci. Rep. 2021, 11, 12300. [Google Scholar] [CrossRef] [PubMed]
  29. Searle, J.B. The Genetics of Mammalian Invasions: A Review. Wildl. Res. 2008, 35, 185. [Google Scholar] [CrossRef]
  30. Gordon, I.J.; Hester, A.J.; Festa-Bianchet, M.; Gordon, I.J.; Hester, A.J.; Festa-Bianchet, M. Review: The Management of Wild Large Herbivores to Meet Economic, Conservation and Environmental Objectives. J. Appl. Ecol. 2004, 41, 1021–1031. [Google Scholar] [CrossRef]
  31. Murray, B.D.; Webster, C.R.; Bump, J.K. Broadening the Ecological Context of Ungulate–Ecosystem Interactions: The Importance of Space, Seasonality, and Nitrogen. Ecology 2013, 94, 1317–1326. [Google Scholar] [CrossRef]
  32. Gawel, A.M.; Rogers, H.S.; Miller, R.H.; Kerr, A.M. Contrasting Ecological Roles of Non-Native Ungulates in a Novel Ecosystem. R. Soc. Open Sci. 2018, 5, 170151. [Google Scholar] [CrossRef] [Green Version]
  33. Iacolina, L.; Corlatti, L.; Buzan, E.; Safner, T.; Šprem, N. Hybridisation in European Ungulates: An Overview of the Current Status, Causes, and Consequences. Mamm. Rev. 2019, 49, 45–59. [Google Scholar] [CrossRef] [Green Version]
  34. Hogg, J.T.; Forbes, S.H.; Steele, B.M.; Luikart, G. Genetic Rescue of an Insular Population of Large Mammals. Proc. R. Soc. B Biol. Sci. 2006, 273, 1491–1499. [Google Scholar] [CrossRef] [Green Version]
  35. Miller, J.M.; Poissant, J.; Hogg, J.T.; Coltman, D.W. Genomic Consequences of Genetic Rescue in an Insular Population of Bighorn Sheep (Ovis canadensis). Mol. Ecol. 2012, 21, 1583–1596. [Google Scholar] [CrossRef]
  36. Gompert, Z. Population Genomics as a New Tool for Wildlife Management. Mol. Ecol. 2012, 21, 1542–1544. [Google Scholar] [CrossRef]
  37. Giglio, R.M.; Ivy, J.A.; Jones, L.C.; Latch, E.K. Evaluation of Alternative Management Strategies for Maintenance of Genetic Variation in Wildlife Populations. Anim. Conserv. 2016, 19, 380–390. [Google Scholar] [CrossRef]
  38. Apollonio, M.; Belkin, V.V.; Borkowski, J.; Borodin, O.I.; Borowik, T.; Cagnacci, F.; Danilkin, A.A.; Danilov, P.I.; Faybich, A.; Ferretti, F.; et al. Challenges and Science-Based Implications for Modern Management and Conservation of European Ungulate Populations. Mammal Res. 2017, 62, 209–217. [Google Scholar] [CrossRef] [Green Version]
  39. Ballari, S.A.; Cuevas, M.F.; Cirignoli, S.; Valenzuela, A.E.J. Invasive Wild Boar in Argentina: Using Protected Areas as a Research Platform to Determine Distribution, Impacts and Management. Biol. Invasions 2015, 17, 1595–1602. [Google Scholar] [CrossRef]
  40. Aschim, R.A.; Brook, R.K. Evaluating Cost-Effective Methods for Rapid and Repeatable National Scale Detection and Mapping of Invasive Species Spread. Sci. Rep. 2019, 9, 7254. [Google Scholar] [CrossRef]
  41. Markov, N.; Economov, A.; Hjeljord, O.; Rolandsen, C.M.; Bergqvist, G.; Danilov, P.; Dolinin, V.; Kambalin, V.; Kondratov, A.; Krasnoshapka, N.; et al. The Wild Boar Sus scrofa in Northern Eurasia: A Review of Range Expansion History, Current Distribution, Factors Affecting the Northern Distributional Limit, and Management Strategies. Mamm. Rev. 2022, 52, 519–537. [Google Scholar] [CrossRef]
  42. Massei, G.; Kindberg, J.; Licoppe, A.; Gačić, D.; Šprem, N.; Kamler, J.J.; Baubet, E.; Hohmann, U.; Monaco, A.; Ozoliņš, J.; et al. Wild Boar Populations up, Numbers of Hunters down? A Review of Trends and Implications for Europe. Pest Manag. Sci. 2015, 71, 492–500. [Google Scholar] [CrossRef]
  43. Keuling, O.; Podgórski, T.; Monaco, A.; Meletti, M.; Merta, D.; Albrycht, M.; Genov, P.V.; Gethöffer, F.; Vetter, S.G.; Jori, F.; et al. Eurasian Wild Boar Sus scrofa (Linnaeus, 1758). In Ecology, Conservation and Management of Wild Pigs and Peccaries; Meletti, M., Meijaard, E., Eds.; Cambridge University Press: New York, NY, USA, 2018; pp. 202–233. [Google Scholar]
  44. Risch, D.R.; Ringma, J.; Price, M.R. The Global Impact of Wild Pigs (Sus scrofa) on Terrestrial Biodiversity. Sci. Rep. 2021, 11, 13256. [Google Scholar] [CrossRef]
  45. García, G.; Vergara, J.; Lombardi, R. Genetic Characterization and Phylogeography of the Wild Boar Sus scrofa Introduced into Uruguay. Genet. Mol. Biol. 2011, 34, 329–337. [Google Scholar] [CrossRef] [PubMed] [Green Version]
  46. Lewis, J.S.; Corn, J.L.; Mayer, J.J.; Jordan, T.R.; Farnsworth, M.L.; Burdett, C.L.; VerCauteren, K.C.; Sweeney, S.J.; Miller, R.S. Historical, Current, and Potential Population Size Estimates of Invasive Wild Pigs (Sus scrofa) in the United States. Biol. Invasions 2019, 21, 2373–2384. [Google Scholar] [CrossRef]
  47. Wehr, N.H. Historical Range Expansion and Biological Changes of Sus scrofa Corresponding to Domestication and Feralization. Mammal Res. 2021, 66, 1–12. [Google Scholar] [CrossRef]
  48. Bengsen, A.J.; West, P.; Krull, C.R. Feral Pigs in Australia and New Zealand: Range, Trend, Management and Impacts of an Invasive SpeciesTitle. In Ecology, Conservation and Management of Wild Pigs and Peccaries; Meletti, M., Meijaard, E., Eds.; Cambridge University Press: New York, NY, USA, 2018; pp. 325–338. ISBN 978-1-107-18731-3. [Google Scholar]
  49. Danilkin, A. Pigs (Suidae); GEOS: Moscow, Russia, 2002; ISBN 5-89118-228-09. [Google Scholar]
  50. Tikhonov, V.N.; Knyazev, S.P. Immunogenetic Traits in Some Forms of Wild Pigs of Europe, Asia, Africa and America. In Morphology and Genetics of Wild Boar; Davletova, L.V., Ed.; Nauka: Moscow, Russia, 1985; pp. 3–16. [Google Scholar]
  51. Larson, G.; Dobney, K.; Albarella, U.; Fang, M.; Matisoo-Smith, E.; Robins, J.; Lowden, S.; Finlayson, H.; Brand, T.; Willerslev, E.; et al. Worldwide Phylogeography of Wild Boar Reveals Multiple Centers of Pig Domestication. Science 2005, 307, 1618–1621. [Google Scholar] [CrossRef] [Green Version]
  52. Ashrafzadeh, M.R.; Rezaei, H.R.; Khalilipour, O.; Kusza, S. Genetic Relationships of Wild Boars Highlight the Importance of Southern Iran in Forming a Comprehensive Picture of the Species’ Phylogeography. Mamm. Biol. 2018, 92, 21–29. [Google Scholar] [CrossRef]
  53. Ruvinsky, A.; Rothschild, M.F.; Larson, G.; Gongora, J. Systematics and Evolution the Pig. In The Genetics of the Pig; Rothschild, M.F., Ruvinsky, A., Eds.; CAB International: Oxforshire, UK, 2011; pp. 1–13. [Google Scholar]
  54. Groenen, M.A.M.; Archibald, A.L.; Uenishi, H.; Tuggle, C.K.; Takeuchi, Y.; Rothschild, M.F.; Rogel-Gaillard, C.; Park, C.; Milan, D.; Megens, H.J.; et al. Analyses of Pig Genomes Provide Insight into Porcine Demography and Evolution. Nature 2012, 491, 393–398. [Google Scholar] [CrossRef] [Green Version]
  55. Alexandri, P.; Triantafyllidis, A.; Papakostas, S.; Chatzinikos, E.; Platis, P.; Papageorgiou, N.; Larson, G.; Abatzopoulos, T.J.; Triantaphyllidis, C. The Balkans and the Colonization of Europe: The Post-Glacial Range Expansion of the Wild Boar, Sus scrofa. J. Biogeogr. 2012, 39, 713–723. [Google Scholar] [CrossRef]
  56. Kusza, S.; Podgórski, T.; Scandura, M.; Borowik, T.; Jávor, A.; Sidorovich, V.E.; Bunevich, A.N.; Kolesnikov, M.; Jȩdrzejewska, B. Contemporary Genetic Structure, Phylogeography and Past Demographic Processes of Wild Boar Sus scrofa Population in Central and Eastern Europe. PLoS ONE 2014, 9, e91401. [Google Scholar] [CrossRef] [PubMed] [Green Version]
  57. Vilaça, S.T.; Biosa, D.; Zachos, F.; Iacolina, L.; Kirschning, J.; Alves, P.C.; Paule, L.; Gortazar, C.; Mamuris, Z.; Jędrzejewska, B.; et al. Mitochondrial Phylogeography of the European Wild Boar: The Effect of Climate on Genetic Diversity and Spatial Lineage Sorting across Europe. J. Biogeogr. 2014, 41, 987–998. [Google Scholar] [CrossRef]
  58. Veličković, N.; Djan, M.; Ferreira, E.; Stergar, M.; Obreht, D.; Maletić, V.; Fonseca, C. From North to South and Back: The Role of the Balkans and Other Southern Peninsulas in the Recolonization of Europe by Wild Boar. J. Biogeogr. 2015, 42, 716–728. [Google Scholar] [CrossRef]
  59. Niedziałkowska, M.; Tarnowska, E.; Ligmanowska, J.; Jędrzejewska, B.; Podgórski, T.; Radziszewska, A.; Ratajczyk, I.; Kusza, S.; Bunevich, A.N.; Danila, G.; et al. Clear Phylogeographic Pattern and Genetic Structure of Wild Boar Sus scrofa Population in Central and Eastern Europe. Sci. Rep. 2021, 11, 9680. [Google Scholar] [CrossRef]
  60. Watanobe, T.; Ishiguro, N.; Nakano, M. Phylogeography and Population Structure of the Japanese Wild Boar Sus scrofa Leucomystax: Mitochondrial DNA Variation. Zoolog. Sci. 2003, 20, 1477–1489. [Google Scholar] [CrossRef] [Green Version]
  61. Cho, I.C.; Han, S.H.; Fang, M.; Lee, S.S.; Ko, M.S.; Lee, H.; Lim, H.T.; Yoo, C.K.; Lee, J.H.; Jeon, J.T. The Robust Phylogeny of Korean Wild Boar (Sus scrofa soreanus) Using Partial D-Loop Sequence of MtDNA. Mol. Cells 2009, 28, 423–430. [Google Scholar] [CrossRef]
  62. Ramayo, Y.; Shemeret’eva, I.N.; Pérez-Enciso, M. Mitochondrial DNA Diversity in Wild Boar from the Primorsky Krai Region (East Russia). Anim. Genet. 2011, 42, 96–99. [Google Scholar] [CrossRef]
  63. Choi, S.K.; Lee, J.-E.; Kim, Y.-J.; Min, M.-S.; Voloshina, I.; Myslenkov, A.; Oh, J.G.; Kim, T.-H.; Markov, N.; Seryodkin, I.; et al. Genetic Structure of Wild Boar (Sus scrofa) Populations from East Asia Based on Microsatellite Loci Analyses. BMC Genet. 2014, 15, 85. [Google Scholar] [CrossRef] [Green Version]
  64. Choi, S.K.; Kim, K.S.; Ranyuk, M.; Babaev, E.; Voloshina, I.; Bayarlkhagva, D.; Chong, J.R.; Ishiguro, N.; Yu, L.; Min, M.S.; et al. Asia-Wide Phylogeography of Wild Boar (Sus scrofa) Based on Mitochondrial DNA and Y-Chromosome: Revising the Migration Routes of Wild Boar in Asia. PLoS ONE 2020, 15, e0238049. [Google Scholar] [CrossRef]
  65. Gongora, J.; Fleming, P.; Spencer, P.B.S.; Mason, R.; Garkavenko, O.; Meyer, J.-N.; Droegemueller, C.; Lee, J.H.; Moran, C. Phylogenetic Relationships of Australian and New Zealand Feral Pigs Assessed by Mitochondrial Control Region Sequence and Nuclear GPIP Genotype. Mol. Phylogenet. Evol. 2004, 33, 339–348. [Google Scholar] [CrossRef]
  66. Burgos-Paz, W.; Souza, C.A.; Megens, H.J.; Ramayo-Caldas, Y.; Melo, M.; Lemús-Flores, C.; Caal, E.; Soto, H.W.; Martínez, R.; Álvarez, L.A.; et al. Porcine Colonization of the Americas: A 60k SNP Story. Heredity 2013, 110, 321–330. [Google Scholar] [CrossRef] [PubMed] [Green Version]
  67. McCann, B.E.; Malek, M.J.; Newman, R.A.; Schmit, B.S.; Swafford, S.R.; Sweitzer, R.A.; Simmons, R.B. Mitochondrial Diversity Supports Multiple Origins for Invasive Pigs. J. Wildl. Manage. 2014, 78, 202–213. [Google Scholar] [CrossRef] [Green Version]
  68. Zinovieva, N.A.; Kostyunina, O.V.; Ekonomov, A.V.; Shevnina, M.S.; Domskij, I.A.; Gladyr’, E.A.; Brem, G. Polymorphism of genes assocciated with the quantitative trait loci in wild boar (Sus scrofa L., 1758) in Russia. Sel’skokhozyaistvennaya Biol. 2013, 100, 77–82. [Google Scholar] [CrossRef] [Green Version]
  69. Davidova, E.E.; Varnakov, A.P.; Dankvert, S.A.; Soltynskaya, I.V.; Seliverstova, A.S.; Ignatova, I.A.; Tsvetkov, I.A.; Pronyaev, A.V.; Davidov, A.V.; Vovchenko, V.E.; et al. The Molecular Genetic Differentiation of Subspecies and Other Forms of Wild Boar (Sus scrofa L.) in the Territory of Russia. Vestn. Okhotovedenia 2013, 4, 44–52. [Google Scholar]
  70. Kostyunina, O.; Traspov, A.; Economov, A.; Seryodkin, I.; Senchik, A.; Bakoev, N.; Prytkov, Y.; Bardukov, N.; Domsky, I.; Karpushkina, T. Genetic Diversity, Admixture and Analysis of Homozygous-by-Descent (HBD) Segments of Russian Wild Boar. Biology 2022, 11, 203. [Google Scholar] [CrossRef]
  71. Heptner, V.G.; Naumov, N.P.; Yurgenson, P.B.; Sludskii, A.A.; Chirkova, A.F.; Bannikov, A.G. Mammals of the Soviet Union. Vol.1—Artiodactyla and Perissodactyla; Vishaya Shkola: Moscow, Russia, 1961. [Google Scholar]
  72. Genov, P.; Nikolovg, H.; Massei, G.; Gerasimov, S. Craniometrical Analysis of Bulgarian Wild Boar (Sus scrofa) Populations. J. Zool. 1991, 225, 309–325. [Google Scholar] [CrossRef]
  73. Keuling, O.; Leus, K. Sus scrofa. The IUCN Red List of Threatened Species 2019: E.T41775A44141833. 2019. Available online: https://www.iucnredlist.org/species/41775/44141833 (accessed on 20 July 2021).
  74. Giuffra, E.; Kijas, J.M.H.; Amarger, V.; Calborg, O.; Jeon, J.-T.; Andersson, L. The Origin of the Domestic Pig: Independent Domestication and Subsequent Introgression. Genetics 2000, 154, 1785–1791. [Google Scholar] [CrossRef]
  75. Fernandez, A.I.; Alves, E.; Ovilo, C.; Rodriguez, M.C.; Silio, L. Divergence Time Estimates of East Asian and European Pigs Based on Multiple near Complete Mitochondrial DNA Sequences. Anim. Genet. 2010, 42, 86–88. [Google Scholar] [CrossRef]
  76. Kiselev, A.A. Wild Boar in the Middle Urals. Okhota i Okhotnichye Khoz-Vo 1986, 12–14. [Google Scholar]
  77. Markov, N.I. Population Dynamics of Wild Boar, Sus scrofa, in Sverdlovsk Oblast and Its Relation to Climatic Factors. Russ. J. Ecol. 1997, 28, 269–274. [Google Scholar]
  78. Melis, C.; Szafranska, P.A.; Jedrzejewska, B.; Barton, K. Biogeographical Variation in the Population Density of Wild Boar (Sus scrofa) in Western Eurasia. J. Biogeogr. 2006, 33, 803–811. [Google Scholar] [CrossRef]
  79. Vetter, S.G.; Ruf, T.; Bieber, C.; Arnold, W. What Is a Mild Winter? Regional Differences in within-Species Responses to Climate Change. PLoS ONE 2015, 10, e0132178. [Google Scholar] [CrossRef] [PubMed]
  80. Markov, N.; Pankova, N.; Morelle, K. Where Winter Rules: Modeling Wild Boar Distribution in Its North-Eastern Range. Sci. Total Environ. 2019, 687, 1055–1064. [Google Scholar] [CrossRef] [PubMed]
  81. Khederzadeh, S.; Kusza, S.; Huang, C.P.; Markov, N.; Scandura, M.; Babaev, E.; Šprem, N.; Seryodkin, I.V.; Paule, L.; Esmailizadeh, A.; et al. Maternal Genomic Variability of the Wild Boar (Sus scrofa) Reveals the Uniqueness of East-Caucasian and Central Italian Populations. Ecol. Evol. 2019, 9, 9467–9478. [Google Scholar] [CrossRef] [Green Version]
  82. Okumura, N.; Ishiguro, N.; Nakano, M.; Hirai, K.; Matsui, A.; Sahara, M. Geographic Population Structure and Sequence Divergence in the Mitochondrial DNA Control Region of the Japanese Wild Boar (Sus scrofa leucomystax), with Reference to Those of Domestic Pigs. Biochem. Genet. 1996, 34, 179–189. [Google Scholar] [CrossRef] [PubMed]
  83. Watanobe, T.; Ishiguro, N.; Okumura, N.; Nakano, M.; Matsui, A.; Hongo, H.; Ushiro, H. Ancient Mitochondrial DNA Reveals the Origin of Sus scrofa from Rebun Island, Japan. J. Mol. Evol. 2001, 52, 281–289. [Google Scholar] [CrossRef]
  84. Khalilzadeh, P.; Rezaei, H.R.; Fadakar, D.; Serati, M.; Aliabadian, M.; Haile, J.; Goshtasb, H. Contact Zone of Asian and European Wild Boar at North West of Iran. PLoS ONE 2016, 11, 5–15. [Google Scholar] [CrossRef] [Green Version]
  85. Kijas, J.M.H.; Andersson, L. A Phylogenetic Study of the Origin of the Domestic Pig Estimated from the Near-Complete MtDNA Genome. J. Mol. Evol. 2001, 52, 302–308. [Google Scholar] [CrossRef]
  86. Fitzpatrick, B.M.; Fordyce, J.A.; Niemiller, M.L.; Reynolds, R.G. What Can DNA Tell Us about Biological Invasions? Biol. Invasions 2012, 14, 245–253. [Google Scholar] [CrossRef]
  87. Lin, C.-S.; Sun, Y.-L.; Liu, C.-Y.; Yang, P.-C.; Chang, L.-C.; Cheng, I.-C.; Mao, S.J.T.; Huang, M.-C. Complete Nucleotide Sequence of Pig (Sus scrofa) Mitochondrial Genome and Dating Evolutionary Divergence within Artiodactyla. Gene 1999, 236, 107–114. [Google Scholar] [CrossRef]
  88. Librado, P.; Rozas, J. DnaSP v5: A Software for Comprehensive Analysis of DNA Polymorphism Data. Bioinformatics 2009, 25, 1451–1452. [Google Scholar] [CrossRef] [PubMed] [Green Version]
  89. Posada, D. JModelTest: Phylogenetic Model Averaging. Mol. Biol. Evol. 2008, 25, 1253–1256. [Google Scholar] [CrossRef] [PubMed]
  90. Hasegawa, M.; Kishino, H.; Yano, T.-A. Dating of the Human-Ape Splitting by a Molecular Clock of Mitochondrial DNA. J Mol. Evol 1985, 22, 160–174. [Google Scholar] [CrossRef]
  91. Ronquist, F.; Teslenko, M.; van der Mark, P.; Ayres, D.L.; Darling, A.; Hohna, S.; Larget, B.; Liu, L.; Suchard, M.A.; Huelsenbeck, J.P. MrBayes 3.2: Efficient Bayesian Phylogenetic Inference and Model Choice across a Large Model Space. Syst. Biol. 2012, 61, 539–542. [Google Scholar] [CrossRef] [PubMed] [Green Version]
  92. Alves, P.; Pinheiro, I.; Godinho, R.; Vicente, J.; Gortázar, C.; Scandura, M. Genetic Diversity of Wild Boar Populations and Domestic Pig Breeds (Sus scrofa) in South-Western Europe. Biol. J. Linn. Soc. 2010, 101, 797–822. [Google Scholar] [CrossRef] [Green Version]
  93. Rambaut, A. FigTree Version 1.3.1. Available online: http://tree.bio.ed.ac.uk/software/figtree (accessed on 16 January 2020).
  94. Paradis, E. Pegas: An R Package for Population Genetics with an Integrated-Modular Approach. Bioinformatics 2010, 26, 419–420. [Google Scholar] [CrossRef] [PubMed] [Green Version]
  95. Templeton, A.R.; Crandall, K.A.; Sing, C.F. A Cladistic Analysis of Phenotypic Associations with Haplotypes Inferred from Restriction Endonuclease Mapping and DNA Sequence Data. III. Cladogram Estimation. Genetics 1992, 132, 619–633. [Google Scholar] [CrossRef] [PubMed]
  96. Gogin, A.; Gerasimov, V.; Malogolovkin, A.; Kolbasov, D. African Swine Fever in the North Caucasus Region and the Russian Federation in Years 2007–2012. Virus Res. 2013, 173, 198–203. [Google Scholar] [CrossRef]
  97. Scandura, M.; Iacolina, L.; Crestanello, B.; Pecchioli, E.; Di Benedetto, M.F.; Russo, V.; Davoli, R.; Apollonio, M.; Bertorelle, G. Ancient vs. Recent Processes as Factors Shaping the Genetic Variation of the European Wild Boar: Are the Effects of the Last Glaciation Still Detectable? Mol. Ecol. 2008, 17, 1745–1762. [Google Scholar] [CrossRef]
  98. Sagua, M.I.; Figueroa, C.E.; Acosta, D.B.; Fernández, G.P.; Carpinetti, B.N.; Birochio, D.; Merino, M.L. Inferring the Origin and Genetic Diversity of the Introduced Wild Boar (Sus scrofa) Populations in Argentina: An Approach from Mitochondrial Markers. Mammal Res. 2018, 63, 467–476. [Google Scholar] [CrossRef]
  99. Albarella, U.; Dobney, K.; Rowley-Conwy, P. Size and Shape of the Eurasian Wild Boar ( Sus scrofa ), with a View to the Reconstruction of Its Holocene History. Environ. Archaeol. 2009, 14, 103–136. [Google Scholar] [CrossRef]
  100. Wu, C.Y.; Jiang, Y.N.; Chu, H.P.; Li, S.H.; Wang, Y.; Li, Y.H.; Chang, Y.; Ju, Y.T. The Type I Lanyu Pig Has a Maternal Genetic Lineage Distinct from Asian and European Pigs. Anim. Genet. 2007, 38, 499–505. [Google Scholar] [CrossRef] [PubMed]
  101. Cannon, M.V.; Brandebourg, T.D.; Kohn, M.C.; Đikić, D.; Irwin, M.H.; Pinkert, C.A. Mitochondrial DNA Sequence and Phylogenetic Evaluation of Geographically Disparate Sus Scrofa Breeds. Anim. Biotechnol. 2015, 26, 17–28. [Google Scholar] [CrossRef]
  102. Goedbloed, D.J.; Megens, H.J.; Van Hooft, P.; Herrero-Medrano, J.M.; Lutz, W.; Alexandri, P.; Crooijmans, R.P.M.A.; Groenen, M.; Van Wieren, S.E.; Ydenberg, R.C.; et al. Genome-Wide Single Nucleotide Polymorphism Analysis Reveals Recent Genetic Introgression from Domestic Pigs into Northwest European Wild Boar Populations. Mol. Ecol. 2013, 22, 856–866. [Google Scholar] [CrossRef] [PubMed]
  103. Iacolina, L.; Pertoldi, C.; Amills, M.; Kusza, S.; Megens, H.-J.; Bâlteanu, V.A.; Bakan, J.; Cubric-Curik, V.; Oja, R.; Saarma, U.; et al. Hotspots of Recent Hybridization between Pigs and Wild Boars in Europe. Sci. Rep. 2018, 8, 17372. [Google Scholar] [CrossRef] [Green Version]
  104. Frantz, A.C.; Zachos, F.E.; Kirschning, J.; Cellina, S.; Bertouille, S.; Mamuris, Z.; Koutsogiannouli, E.A.; Burke, T. Genetic Evidence for Introgression between Domestic Pigs and Wild Boars (Sus scrofa) in Belgium and Luxembourg: A Comparative Approach with Multiple Marker Systems. Biol. J. Linn. Soc. 2013, 110, 104–115. [Google Scholar] [CrossRef] [Green Version]
  105. Davis, J.M.; Stamps, J.A. The Effect of Natal Experience on Habitat Preferences. Trends Ecol. Evol. 2004, 19, 411–416. [Google Scholar] [CrossRef] [PubMed]
  106. Bonte, D.; Hovestadt, T.; Poethke, H. Evolution of Dispersal Polymorphism and Local Adaptation of Dispersal Distance in Spatially Structured Landscapes. Oikos 2010, 119, 560–566. [Google Scholar] [CrossRef] [Green Version]
  107. Tsai, T.-S.S.; Rajasekar, S.; St. John, J.C. The Relationship between Mitochondrial DNA Haplotype and the Reproductive Capacity of Domestic Pigs (Sus scrofa domesticus). BMC Genet. 2016, 17, 67. [Google Scholar] [CrossRef] [Green Version]
  108. Mary, N.; Iannuccelli, N.; Petit, G.; Bonnet, N.; Pinton, A.; Barasc, H.; Amélie, F.; Calgaro, A.; Grosbois, V.; Servin, B.; et al. Genome-wide Analysis of Hybridization in Wild Boar Populations Reveals Adaptive Introgression from Domestic Pig. Evol. Appl. 2022, 15, 1115–1128. [Google Scholar] [CrossRef]
  109. Hewitt, G.M. Post-Glacial Re-Colonization of European Biota. Biol. J. Linn. Soc. 1999, 68, 87–112. [Google Scholar] [CrossRef]
  110. Taberlet, P.; Fumagalli, L.; Wust-Saucy, A.; Cosson, J. Comparative Phylogeography and Postglacial Colonization Routes in Europe. Mol. Ecol. 1998, 7, 453–464. [Google Scholar] [CrossRef] [PubMed] [Green Version]
  111. Sommer, R.S.; Zachos, F.E. Fossil Evidence and Phylogeography of Temperate Species: ‘Glacial Refugia’ and Post-Glacial Recolonization. J. Biogeogr. 2009, 36, 2013–2020. [Google Scholar] [CrossRef]
  112. Meiri, M.; Huchon, D.; Bar-Oz, G.; Boaretto, E.; Horwitz, L.K.; Maeir, A.M.; Sapir-Hen, L.; Larson, G.; Weiner, S.; Finkelstein, I. Ancient DNA and Population Turnover in Southern Levantine Pigs—Signature of the Sea Peoples Migration? Sci. Rep. 2013, 3, 3035. [Google Scholar] [CrossRef] [PubMed] [Green Version]
  113. Ibrahim, K.M.; Nichols, R.A.; Hewitt, G.M. Spatial Patterns of Genetic Variation Generated by Different Forms of Dispersal during Range Expansion. Heredity 1996, 77, 282–291. [Google Scholar] [CrossRef]
  114. Hewitt, G. The Genetic Legacy of the Quaternary Ice Ages. Nature 2000, 405, 907–913. [Google Scholar] [CrossRef]
Figure 1. Origin and taxonomic status of the wild boars released in the Ural region. Arrows indicate the locations and taxonomic status of the animals released in the eastern part of the Ural region (orange polygon) in 1978–1984. The pink polygon denotes the wild boar’s geographical range in Northern Eurasia in the middle of the 20th century [49,73]. The map was constructed by means of Natural Earth (free vector and raster map data @ naturalearthdata.com) using QGIS 3.8.
Diversity 14 00916 g001
Figure 2. Positions of the studied populations (Urals, Caucasus, Central Asia, and Russian Far East) on the phylogenetic tree of the main wild boar mtDNA lineages. The Bayesian (MCMC) haplotype tree is constructed from the partial sequences of the mtDNA control region (637 bp) from the Eurasian wild boar. The tree reconstruction is based on the 18 haplotypes of wild boars sequenced in this work (haplotypes suspected to originate from hybrids between a wild boar and domestic pig—Ss5, Ss13, and Ss17—were excluded from the analysis) and 51 sequences (representing the haplotypes of animals classified as wild S. scrofa from Europe (n = 13) and Asia (n = 38)) downloaded from GenBank. The haplotypes sequenced in this study begin with Ss and are shown in red. The haplotypes reported by Choi K.S. et al. [64] are shown in green. The haplotypes presented by Niedziałkowska M. et al. [59] are shown in a brown color. The haplotypes retrieved from GenBank and identical to those sequenced in this study were excluded from this analysis. The HKY + G model was implemented. The Bayesian posterior probability is shown for branches with over 70% support. Major clades are indicated with different colors. Cluster W1 was named NE (Near Eastern) because on the tree based on 547-bp fragments, these sequences grouped with mtDNA samples from Iran (Supplementary Figure S1). The phylogeny was calculated in MrBayes 3.4 [44] with the default values of priors. See Table 1, Supplementary Table S1, and Figure S1 for details. The illustration was created in FigTree 1.4.4 [93].
Diversity 14 00916 g002
Figure 3. The haplotype network based on the 21 haplotypes of wild boars sequenced in this work and 51 sequences (representing the haplotypes of animals classified as wild S. scrofa from Europe (n = 13) and Asia (n = 38)) downloaded from GenBank. The network was created in R package pegas Paradis E [94] via an infinite site model (i.e., uncorrected or Hamming distance) of DNA sequences [95]. The haplotypes sequenced in this study begin with Ss and are highlighted in red. The haplotypes reported by Choi K.S. et al. [64] are shown in green. The haplotypes presented by Niedziałkowska M. et al. [59] are highlighted in brown. The haplotypes downloaded from GenBank that were identical to those sequenced in this study were excluded from the analysis.
Diversity 14 00916 g003
Table 1. Sampling locations and haplotype distributions of wild boars (S. scrofa).
Geographical RegionnHD-loop Haplotypes 637-bp
(Number of Individuals) *
Private Haplotypes **
Urals11611Ss1(35), Ss2(57), Ss3(6), Ss4(2), Ss5(1), Ss6(3), Ss7(4), Ss8(1), Ss9(4), Ss13(2), Ss14(1)Ss4, Ss5, Ss8, Ss13
Caucasus (Republic of Dagestan)263Ss1(11), Ss7 (14), Ss11(1)Ss11
Central Asia (Kazakhstan and Uzbekistan)164Ss6 (8), Ss9 (1), Ss10(6), Ss12 (1), Ss10, Ss12
Russian Far East387Ss15(4), Ss16(20), Ss17(1), Ss18(4), Ss19(4), Ss20(2), Ss21(3)Ss15-21
Total196
* Some of these haplotypes have been described by other authors; see comments in the text and Supplementary Table S1. ** Haplotypes detected in only one of the regions in this study. Some of these haplotypes have been described by other authors; see comments in the text and Supplementary Table S1.
Table 2. Genetic diversity in the introduced (the Urals) and founding (the Caucasus, Central Asia, the Russian Far East, and Eastern Europe) wild boar populations, Hd: haplotype diversity, π: nucleotide diversity, Tajima’s D and Fu’s Fs are neutrality tests.
LocationHdπ (%)Tajima’s DFu’s FsSource
Urals0.667 ± 0.033
(0.649 ± 0.034) a
0.00657 ± 0.0011
(0.0059 ± 0.0015) a
−0.78 (−0.77 a) n. s.2.21 * (3.061 a**)This study
Caucasus (Republic of Dagestan)0.551 ± 0.0480.0099 ± 0.00092.42 ***10.65 ***This study
Central Asia (Kazakhstan and Uzbekistan)0.642 ± 0.0810.0024 ± 0.001−1.6*0.718n. s.This study
Russian Far East0.698 ± 0.072
(0.682 ± 0.074 a)
0.0061 ± 0.001
(0.00514 ± 0.001 a)
−0.77(0.72 a) n. s.2.36 (2.53) *.This study
Central and Eastern Europe0.65 b0.00570 ± 0.0015 b−1.503 c, n. s.−5.051 c, n. s.Niedziałkowska et al. 2021
a Excluding haplotypes identical to domestic pig breeds Ss5, Ss13, and Ss17; b data of Niedziałkowska M. et al. [59] adjusted for the analyzed 637-bp fragment; c from [59]; n. s.: p > 0.1; * statistically significant at p < 0.1; ** statistically significant at p < 0.05 (p = 0.048); *** statistically significant at p < 0.01.
Table 3. Affiliation of animals released in the Urals with the mtDNA clades.
Year of ReleaseNumber of IndividualsOriginClade
197830Central Asia (Kyrgyzstan)Eastern
1979171Belarus (Brest region) and Caucasus (Kabardino-Balkaria)Western
1981123Far East of Russia (Primorsky Krai)Eastern
198294Western Russia (Smolensk Oblast)Mixed (67% Western, 33% Eastern) *
1983101Western Russia (Smolensk Oblast)Mixed (67% Western, 33% Eastern) *
198497Western Russia (Kaluga Oblast)Mixed (89% Western, 11% Eastern) *
198450Western Russia (Vladimir Oblast)European*
* According to [69].
Publisher’s Note: MDPI stays neutral with regard to jurisdictional claims in published maps and institutional affiliations.

