1. Introduction
More than 50% of the territory of the Russian Federation is located in the regions of the Far North, where traditional nature management forms the basis for the lives of indigenous ethnic groups. The traditional occupation of these indigenous peoples is reindeer herding, which is closely interrelated with their survival in their native land [
1].
The Republic of Tuva is the southernmost habitat of reindeer populations and is divided into 16 districts. It borders the Republics of Buryatia and Khakassia, and it includes the territories of Irkutsk, Krasnoyarsk, and Altai as well as Mongolia. The well-being of Tuvans, Tofalars, and other peoples of Southern Siberia has historically strictly depended on hunting, which required the means of proper transportation. Thus, the reindeer proved to be the only animal that would allow indigenous people to explore the vast expanses of the taiga. As a result, the local Tuva–Tofalar group of reindeer was created (reindeer of the Todzhinsky District of the Republic of Tuva and the Nizhneudinsky District of the Irkutsk Region) [
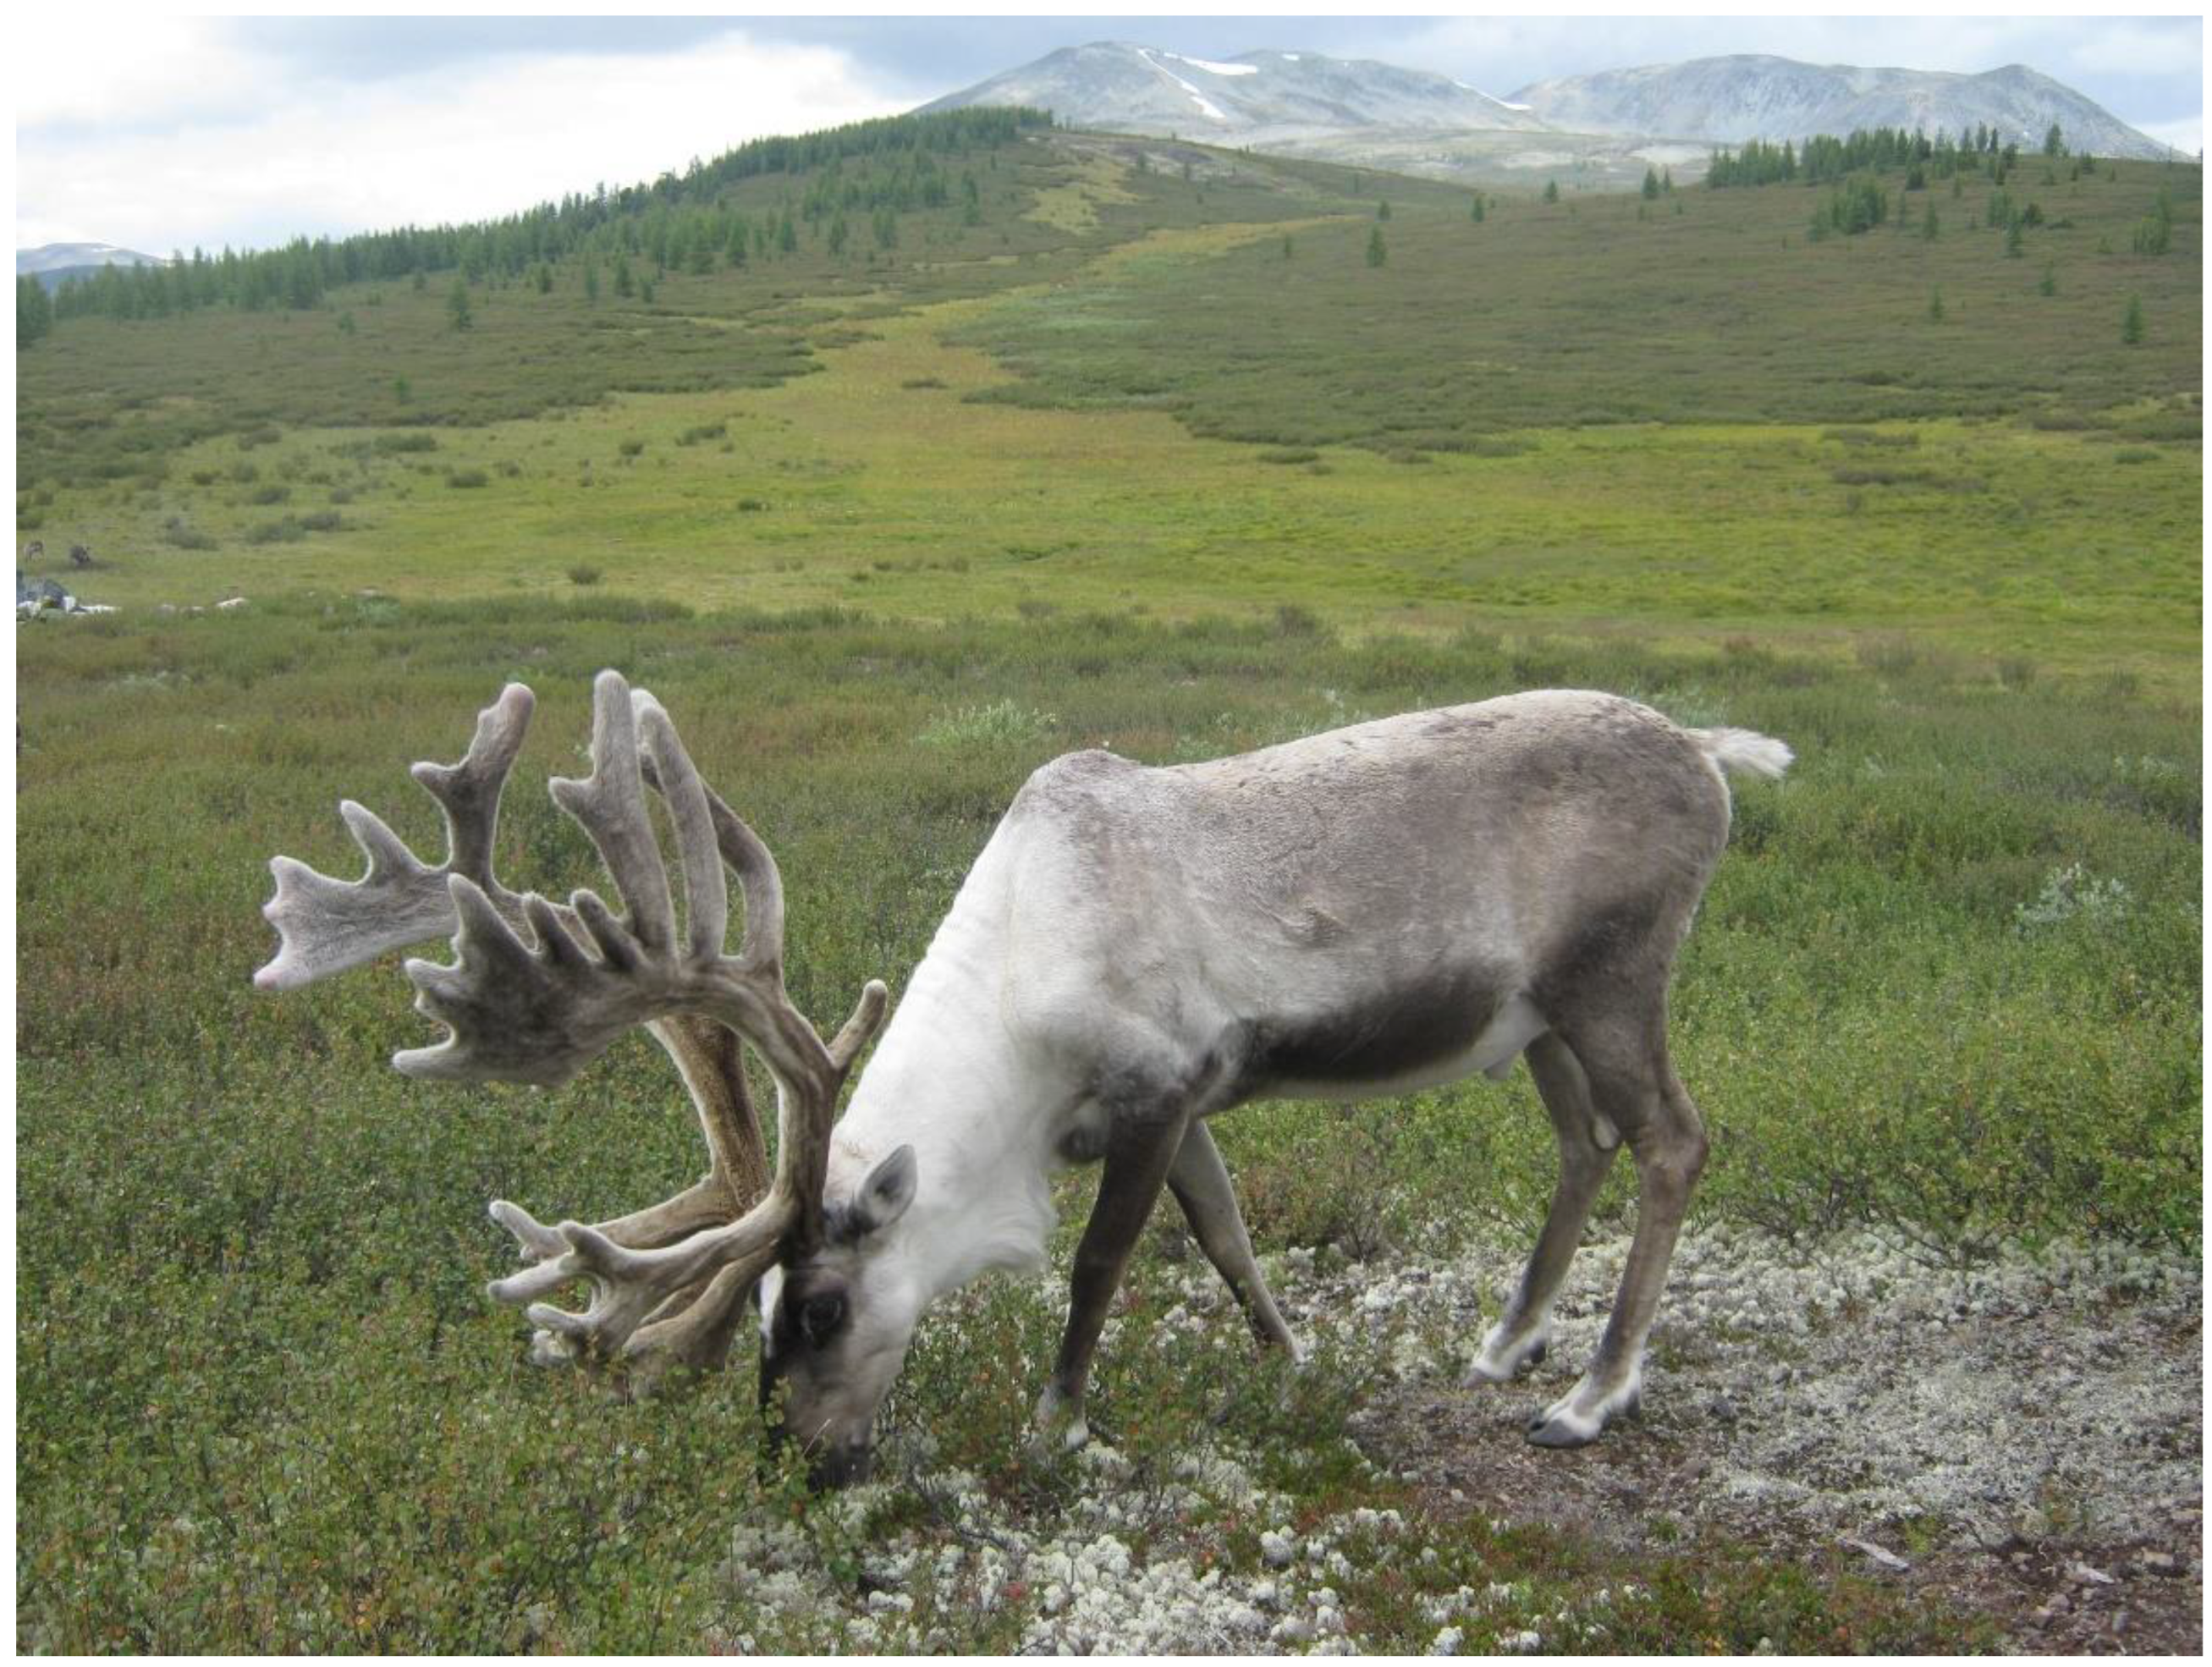
2]. Reindeer of the Tuva–Tofalar population are tall with rather long bodies, deep chests, well-developed muscles, and are light in color (
Figure 1).
Currently, 77% of the total number of domestic reindeer in the Republic of Tuva is in the Todzhinsky District, where reindeer herding is the traditional occupation of the small northern community of Tuvans-Todzhans. This district is included in the Eastern Sayan Mountain Region and borders the territories inhabited by small ethnic groups, such as the Tofa (Tofalars, in the Irkutsk Region), the Soyots (the Republic of Buryatia), and the Dukha (also known as Tsaatan, the Khubsugul Province of Mongolia), who are also engaged in reindeer herding. These unique and endangered reindeer-herding cultures of Inner Asia represent some of the oldest cultures who maintain the northern reindeer as their totem animal.
Unlike the large-scale reindeer and caribou ranchers of Scandinavia, northern Siberia, Alaska, and Canada, who live in tundra areas and raise large herds of reindeer primarily for meat, these cultures practice a peculiar form of reindeer husbandry, raising small herds of reindeer in mountainous forest areas (taiga) for their milk and to be used as a means of transport, while wild game is the principal source of food. Moreover, it is important to note that the four representative cultures in question developed based on reindeer domestication in the remote, fragile, and ecologically diverse transition belt between the Siberian boreal forest and the Inner Asia steppes. Given this fact, they can be considered “cultures of reindeer habitat”, in other words, peoples directly related to the high mountain reindeer habitats, where they have lived under the conditions dictated by the natural ebb and flow of the ecology of their region [
2,
3,
4,
5].
Despite the fact that the local Tuva–Tofalar population of reindeer still occupies an important place in the social and cultural activities of the indigenous peoples and is characterized by distinctive morphological features, this population has not been selected as an officially recognized breed, unlike the other four reindeer populations [
6].
The census determined population size of domestic reindeer in Russia’s Far North, as of 1 September 2021, was confirmed to be 1,900,000 individuals [
7]. However, recent attention has been drawn to a reduction in the Tuva reindeer population from 15,000 in 1990 to 1400 individual animals in 2019. It is believed that intense global factors, such as climate change and habitat degradation, may have led to the decline in the Tuvan reindeer population. The current higher winter temperatures cause snow to melt and refreeze or to fall as rain, which also refreezes. This causes an icy sheet to encase the lichen on the ground, which is the reindeers’ main winter food supply. The reindeer simply cannot dig through the ice, and often the ice freezes over such a large area that they starve while wandering, trying to reach the plants that they can smell right beneath them. Thus, reindeer have less and less to eat, and their migration routes are being broken apart by roads, fences, and railway lines. The effects of climate change in addition to all this make an already difficult situation worse. Many reindeer herders now need to purchase feed for their reindeer during winter, an extra cost that may be difficult for owners of smaller herds to afford.
An additional explanation of the domestic Tuvan reindeer decline may lie in the classifying of this population as a peripheral one. According to Kesić et al. [
8], the peripheral populations are defined as populations on the edge of species distribution that usually represent reservoirs of biodiversity. Growing under stronger selection pressures than core populations, rear-edge populations are frequently subjected to various biotic and abiotic stress factors, which negatively affect their reproductive success and survival.
Considering the assumption that a decreasing population size increases the threat of loss of genetic diversity by reducing the ability of a population to adapt to environmental changes [
9], this implies the increasing importance of gaining insights into the nuclear genetic diversity of the Tuva population.
Molecular genetic techniques have revolutionized our ability to characterize genetic variation [
10]. The employment of nuclear markers is one of the most powerful means for studying the genetic diversity, the calculation of genetic distances, the detection of bottlenecks and admixture due to a high degree of polymorphism, random distribution across the genome, codominance, and neutrality with respect to selection [
11]. The power provided by single nucleotide polymorphism (SNP) markers detected using genome-wide sequencing approaches led to their increased use in genetic conservation studies [
12]. SNPs are popular for investigating levels of genetic differentiation among remnant populations and for comparing levels and patterns of genetic variation within populations [
13,
14], which provide information on the adaptive potential of populations [
15], as well as patterns of inbreeding and relatedness [
16]. Results from SNP studies are being interpreted for use in management decisions that include genetic rescue, genetic mixing, and founder selection in threatened species programs [
17,
18].
The successful application of SNP genotyping arrays to study the genetic biodiversity of members of the Cervidae family has already been proven and is evidenced by an abundance of scientific papers [
19,
20,
21,
22] on the matter. In fact, we have previously presented data on the current genetic composition and population structure of domestic and wild populations inhabiting the Russian Far North using SNP array [
23,
24]. Despite the relevance of the previous articles, the Tuvan population has not been covered, leaving questions regarding its genetic structure and diversity wide open. In this regard, the current study was undertaken in order to answer the above issues under question.
In the current research, on the basis of the genotypes generated by the Bovine HD BeadChip, we sought to achieve two goals: first, to shed light on the current state of genetic diversity and population structure of domestic Tuva reindeer; and second, to establish the population genetic relationship with four officially recognized breeds and wild populations inhabiting the Russian Far North and domestic reindeer inhabiting Mongolia. Moreover, by studying the Tuva–Tofalar reindeer and their potential, our core intention was to draw attention to the vulnerability of global genetic resources and the necessity of taking timely action to protect these resources, something that will enhance humankind’s capability to adapt to future climate changes.
2. Experiments
2.1. Ethics Statement
The current study does not involve any endangered or protected animals and all procedures were conducted according to the ethical guidelines of the L.K. Ernst Federal Science Center for Animal Husbandry. The protocol for the study, No. 2 (28 April 2022), was approved by the Commission on the Ethics of Animal Experiments of the L.K. Ernst Federal Science Center for Animal Husbandry.
The tissue samples of domestic reindeer were collected by trained personnel under strict veterinary rules in accordance with the rules for conducting laboratory research (tests) in the implementation of the veterinary control (supervision) approved by a Council Decision of the Eurasian Economic Commission No. 80 (10 November 2017) during the corral work on the herd. The muscle tissue samples of the wild reindeer were collected during scientific expeditions after obtaining collection permits granted by the Department of Hunting of the Republic of Sakha and by the Ministry of Ecology and Rational Nature Management of the Krasnoyarsk Territory in compliance with Russian Federation Law No. 209-FZ of 24 July 2009.
SNP genotypes of all domestic breeds, domestic Mongolian population, and wild reindeer samples involved in this study were taken from the Bioresource collection of the L.K. Ernst Federal Research Center for Animal Husbandry.
2.2. Sample Collection, DNA Extraction, and Dataset Generation
The biomaterial of the Tuva–Tofalar population of reindeer (TUVA, n = 28) was taken from a herd bred in the northeast of the Tuva Republic (Todzhinsky District) during the corral work and was stored at –20 °C until DNA extraction. Genomic DNA was extracted with commercial DNA-Extran-2 kits (JSC Syntol, Russia) following the manufacturer’s instructions. The DNA samples were quantified using a method of visualization in bands by 1% agarose gel electrophoresis. The concentration of the dsDNA was measured on a Qubit 3.0 fluorimeter (Thermo Fisher Scientific (formerly Life Technologies Waltham, MA, USA), Wilmington, DE, USA). DNA purity was determined by evaluating the absorption ratio of A260/A280 on a NanoDrop2000 spectrophotometer (Thermo Fisher Scientific, Wilmington, DE, USA). The concentration of DNA, on average, was 67.15 ng/μL.
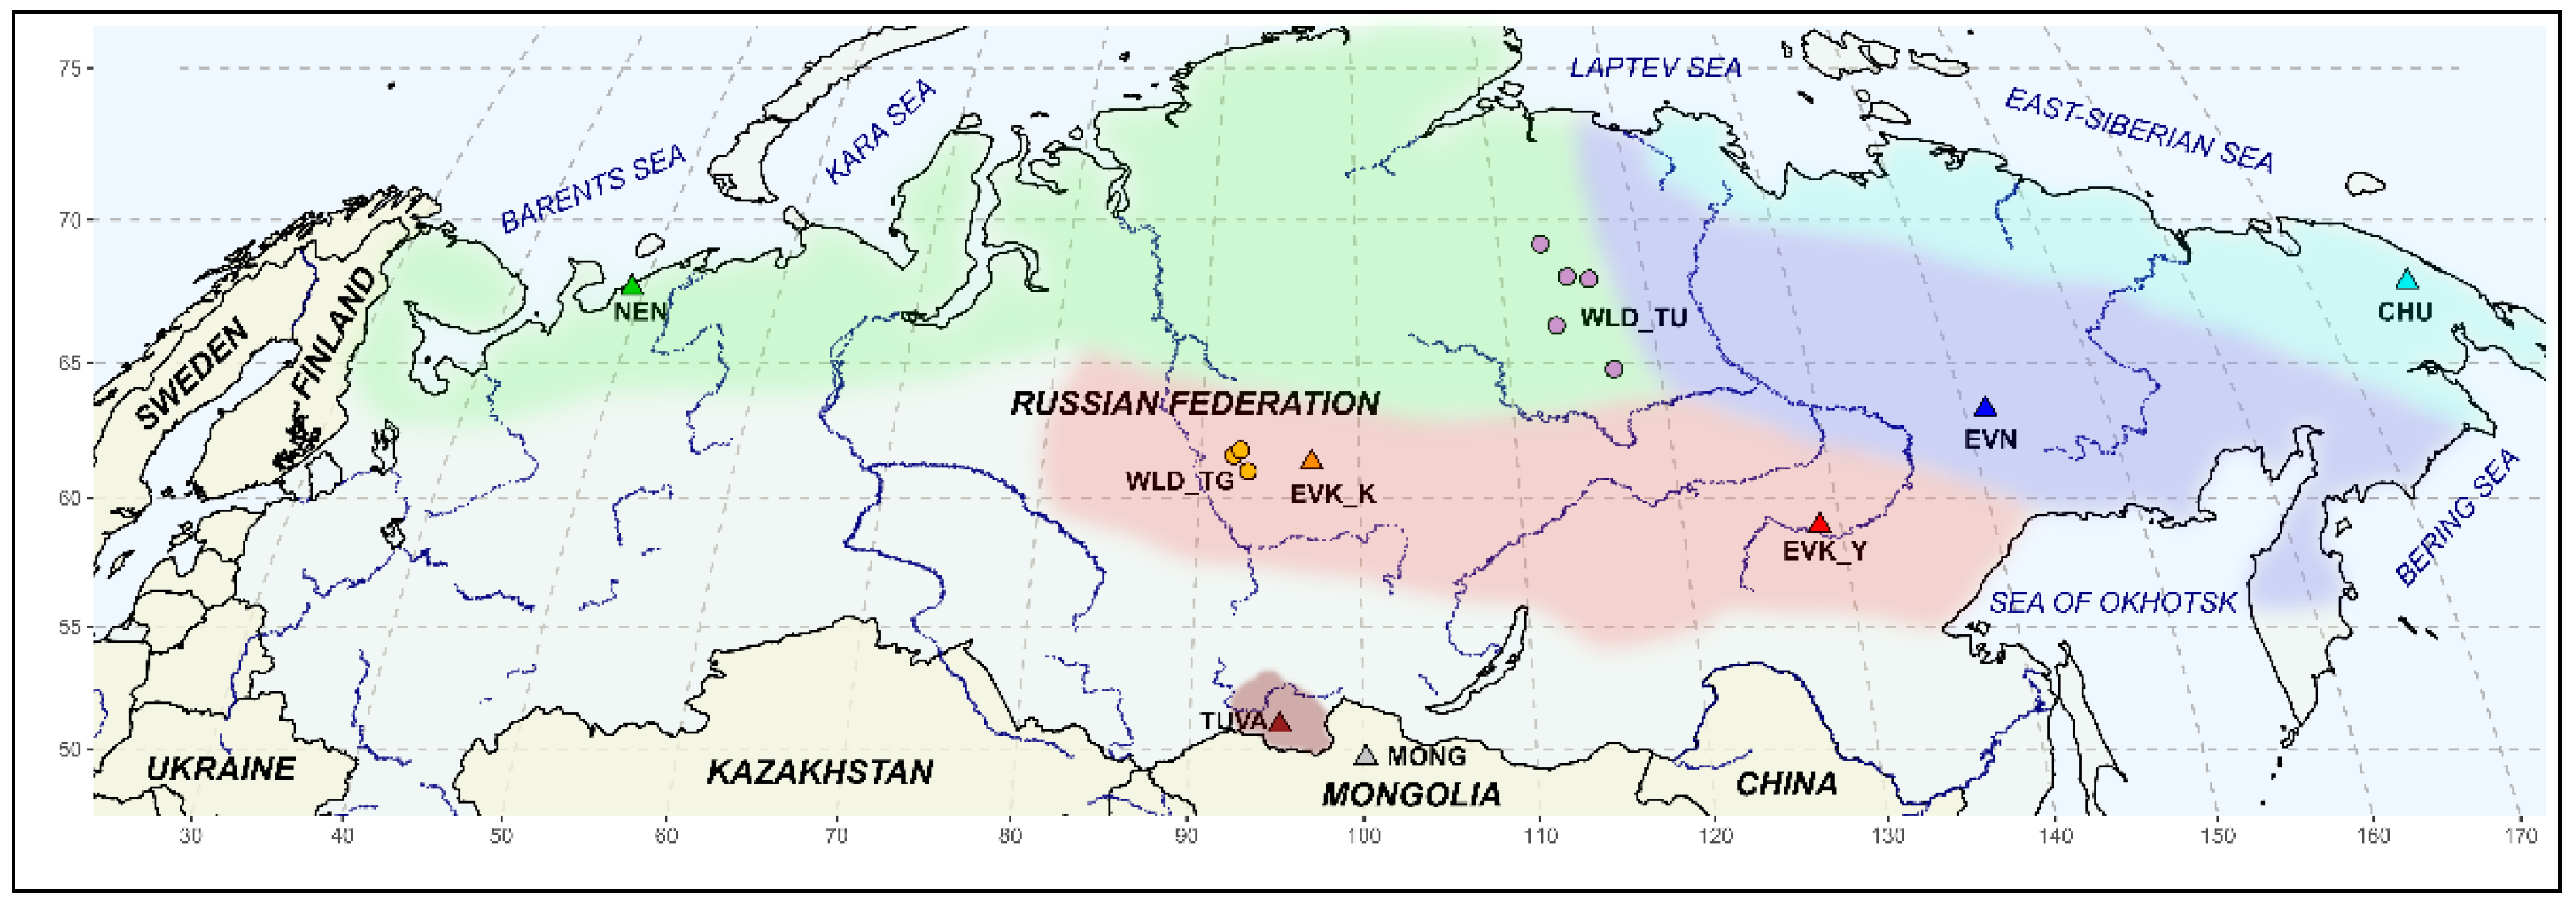
To determine the possible genetic contribution to the Tuva reindeer population’s structure, we employed the SNP genotypes dataset of all officially recognized breeds in Russia: the Nenets breed from the Nenets Autonomous District (NEN, n = 33); the Even breed from the Republic of Sakha (Yakutia) (EVN, n = 19); the Evenk breed from both breeding regions, the Republic of Sakha (Yakutia) (EVK_Y, n = 20) and the Krasnoyarsk Territory (EVK_K, n = 20); and the Chukotka breed from the Chukotka Autonomous District (CHU, n = 25). Since the Tuva Republic borders Mongolia in the south, the SNP genotypes of domestic Mongolian population samples (MONG, n = 11) were included in the dataset.
Additionally, the genotypes of wild reindeer of the taiga (TG,
n = 16) and tundra (TU,
n = 11) populations inhabiting the territory of the Krasnoyarsk Territory and Yakutia, respectively, were included in our dataset as an outgroup. The coordinate range of the covered area in the Krasnoyarsk Territory was from 64 to 69° N and from 113 to 117° E and in Yakutia from 64 to 69° N and from 113 to 117° E. A map of breeding zones of domestic reindeer and the sampling sites where specimens used in this study were collected is presented in
Figure 2.
The R packages maps and mapdata [
25] were applied for plotting the geographic map of the reindeer sampling areas.
2.3. SNP Genotyping and Data Processing
A total of 183 DNA samples were genotyped using the Illumina BovineHD Genotyping BeadChip. The quality control of the SNP-genome sequencing of the reindeer samples was performed by setting a cutoff of 0.5 for the GenCall and GenTrain scores [
26] using PLINK v1.90 [
27]. The SNP dataset was filtered to remove loci located on the sex chromosomes of the UMD 3.1 assembly [
28], as well as loci genotyped in <90% of individuals and rare alleles with geno 0.1—mind 0.1—maf 0.05 plink commands. SNPs with a value of linkage disequilibrium (LD) between a pair of single-nucleotide polymorphisms equal to r2 > 0.05 were also excluded from further analyses. After conducting all filtering steps, the final dataset included 183 individuals and comprised 6786 SNPs.
Calculation of diversity statistics, including the observed heterozygosity (H
O), the unbiased expected heterozygosity (
UH
E) [
29], the inbreeding coefficient (F
IS) based on the unbiased expected heterozygosity, the rarefied allelic richness (A
R), and pairwise genetic differentiation values (F
ST) [
30], was conducted using the R package “diveRsity” [
31].
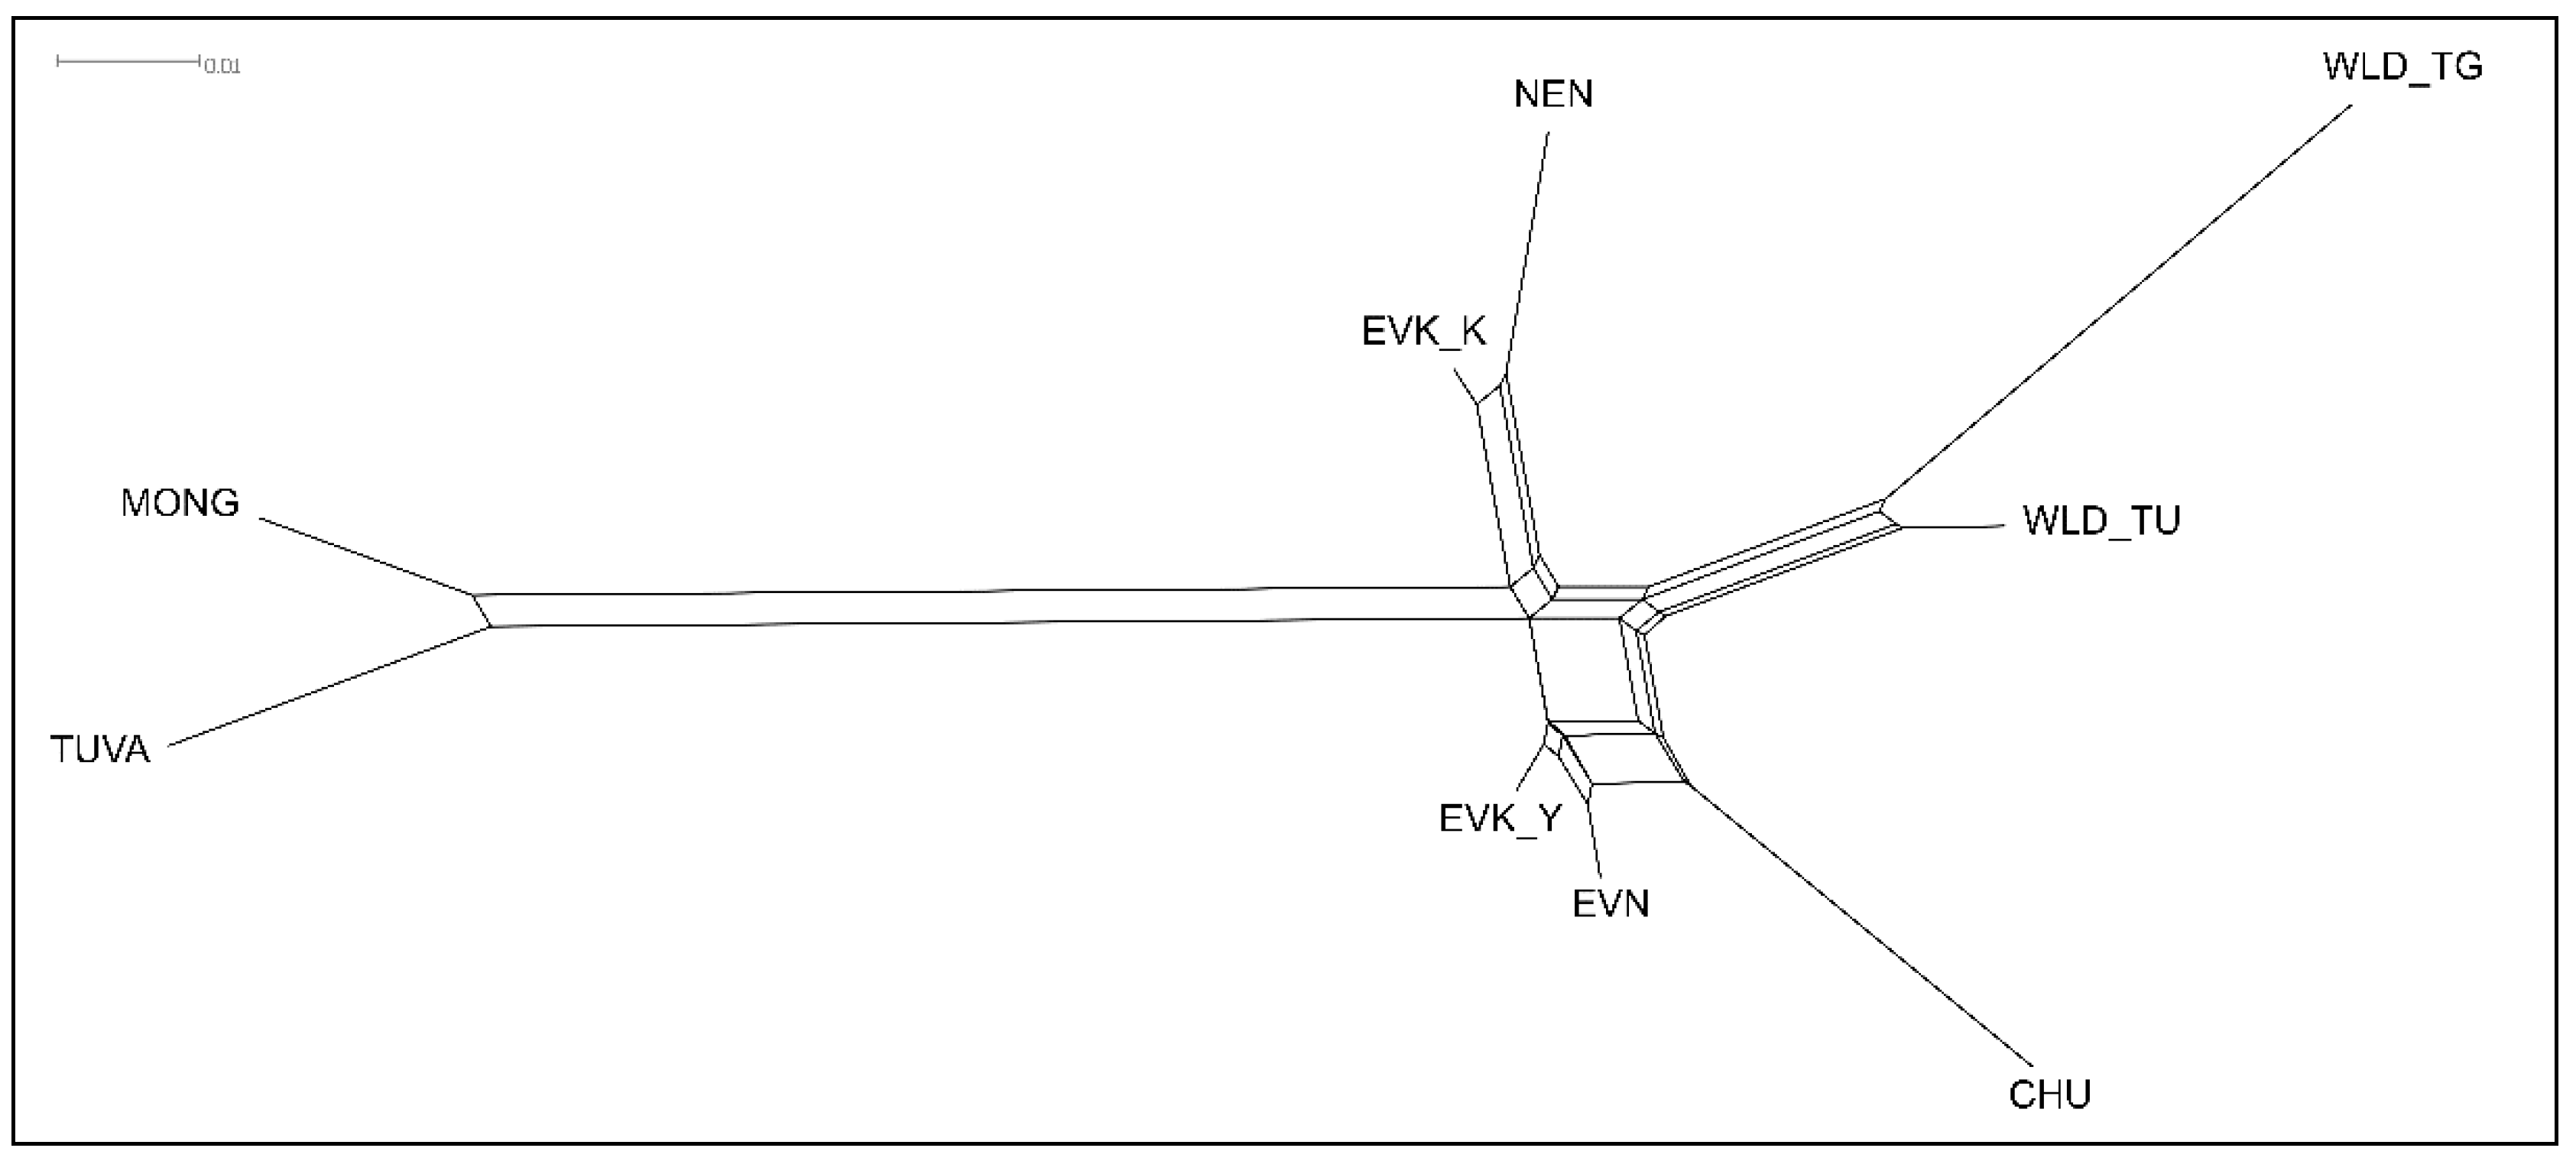
The resulting relationships obtained based on the pairwise distance matrix of F
ST measures were graphical represented by the Neighbor Net network using the SplitsTree 4.14.5 software [
32].
The genetic population structure of the reindeer was analyzed using principal component analysis (PCA) in PLINK v1.90 and depicted with the R package “ggplot2” [
33].
The estimation of individual ancestry derived from our genetic data was performed using the ADMIXTURE v1.3 software [
34], while proposing a number of K values ranging from 1 to 10 and visualized using the R package “pophelper” [
35]. The optimal value of K value was set as the one having the lowest cross-validation (CV) error.
All input files were created in R version 3.3.2 [
36].
3. Results
An assessment of the genetic diversity parameters of the Tuvan reindeer in comparison with domestic breeds, domestic Mongolian, and wild reindeer populations is shown in
Table 1.
As per the data in
Table 1, the reindeer of TUVA as well as MONG and WLD_TG had the lowest values of allelic richness (A
R): 1.507, 1.516, and 1.582, respectively, while the highest values were distributed among the tundra population of the wild reindeer (1.684) and in the Yakut Evenk breed of domestic reindeer (1.679). The observed heterozygosity (H
O) ranged between 0.150 in TUVA and 0.185 in EVK_Y. The lowest values of unbiased heterozygosity (
UH
E) were found in the MONG (0.154) and the TUVA (0.155) as compared with the EVK_Y, the EVN and the WLD_TU, which had practically equal and, in fact, the highest values of the index: 0.189, 0.187, and 0.187, respectively. For almost all the reindeer groups studied, the expected unbiased heterozygosity was higher than the observed heterozygosity with exception of the Mongolian population. Consequently, domestic Mongolian reindeer alone were found to possess excessive heterozygotes as evidenced by the
UF
IS values: −0.006 [−0.014; 0.002]. The remaining groups of reindeer had a positive
UF
IS value, but then NEN and EVK_K maintained a 95% confidence interval very close to zero: 0.006 [0.001; 0.011] and 0.012 [0.006; 0.018], respectively.
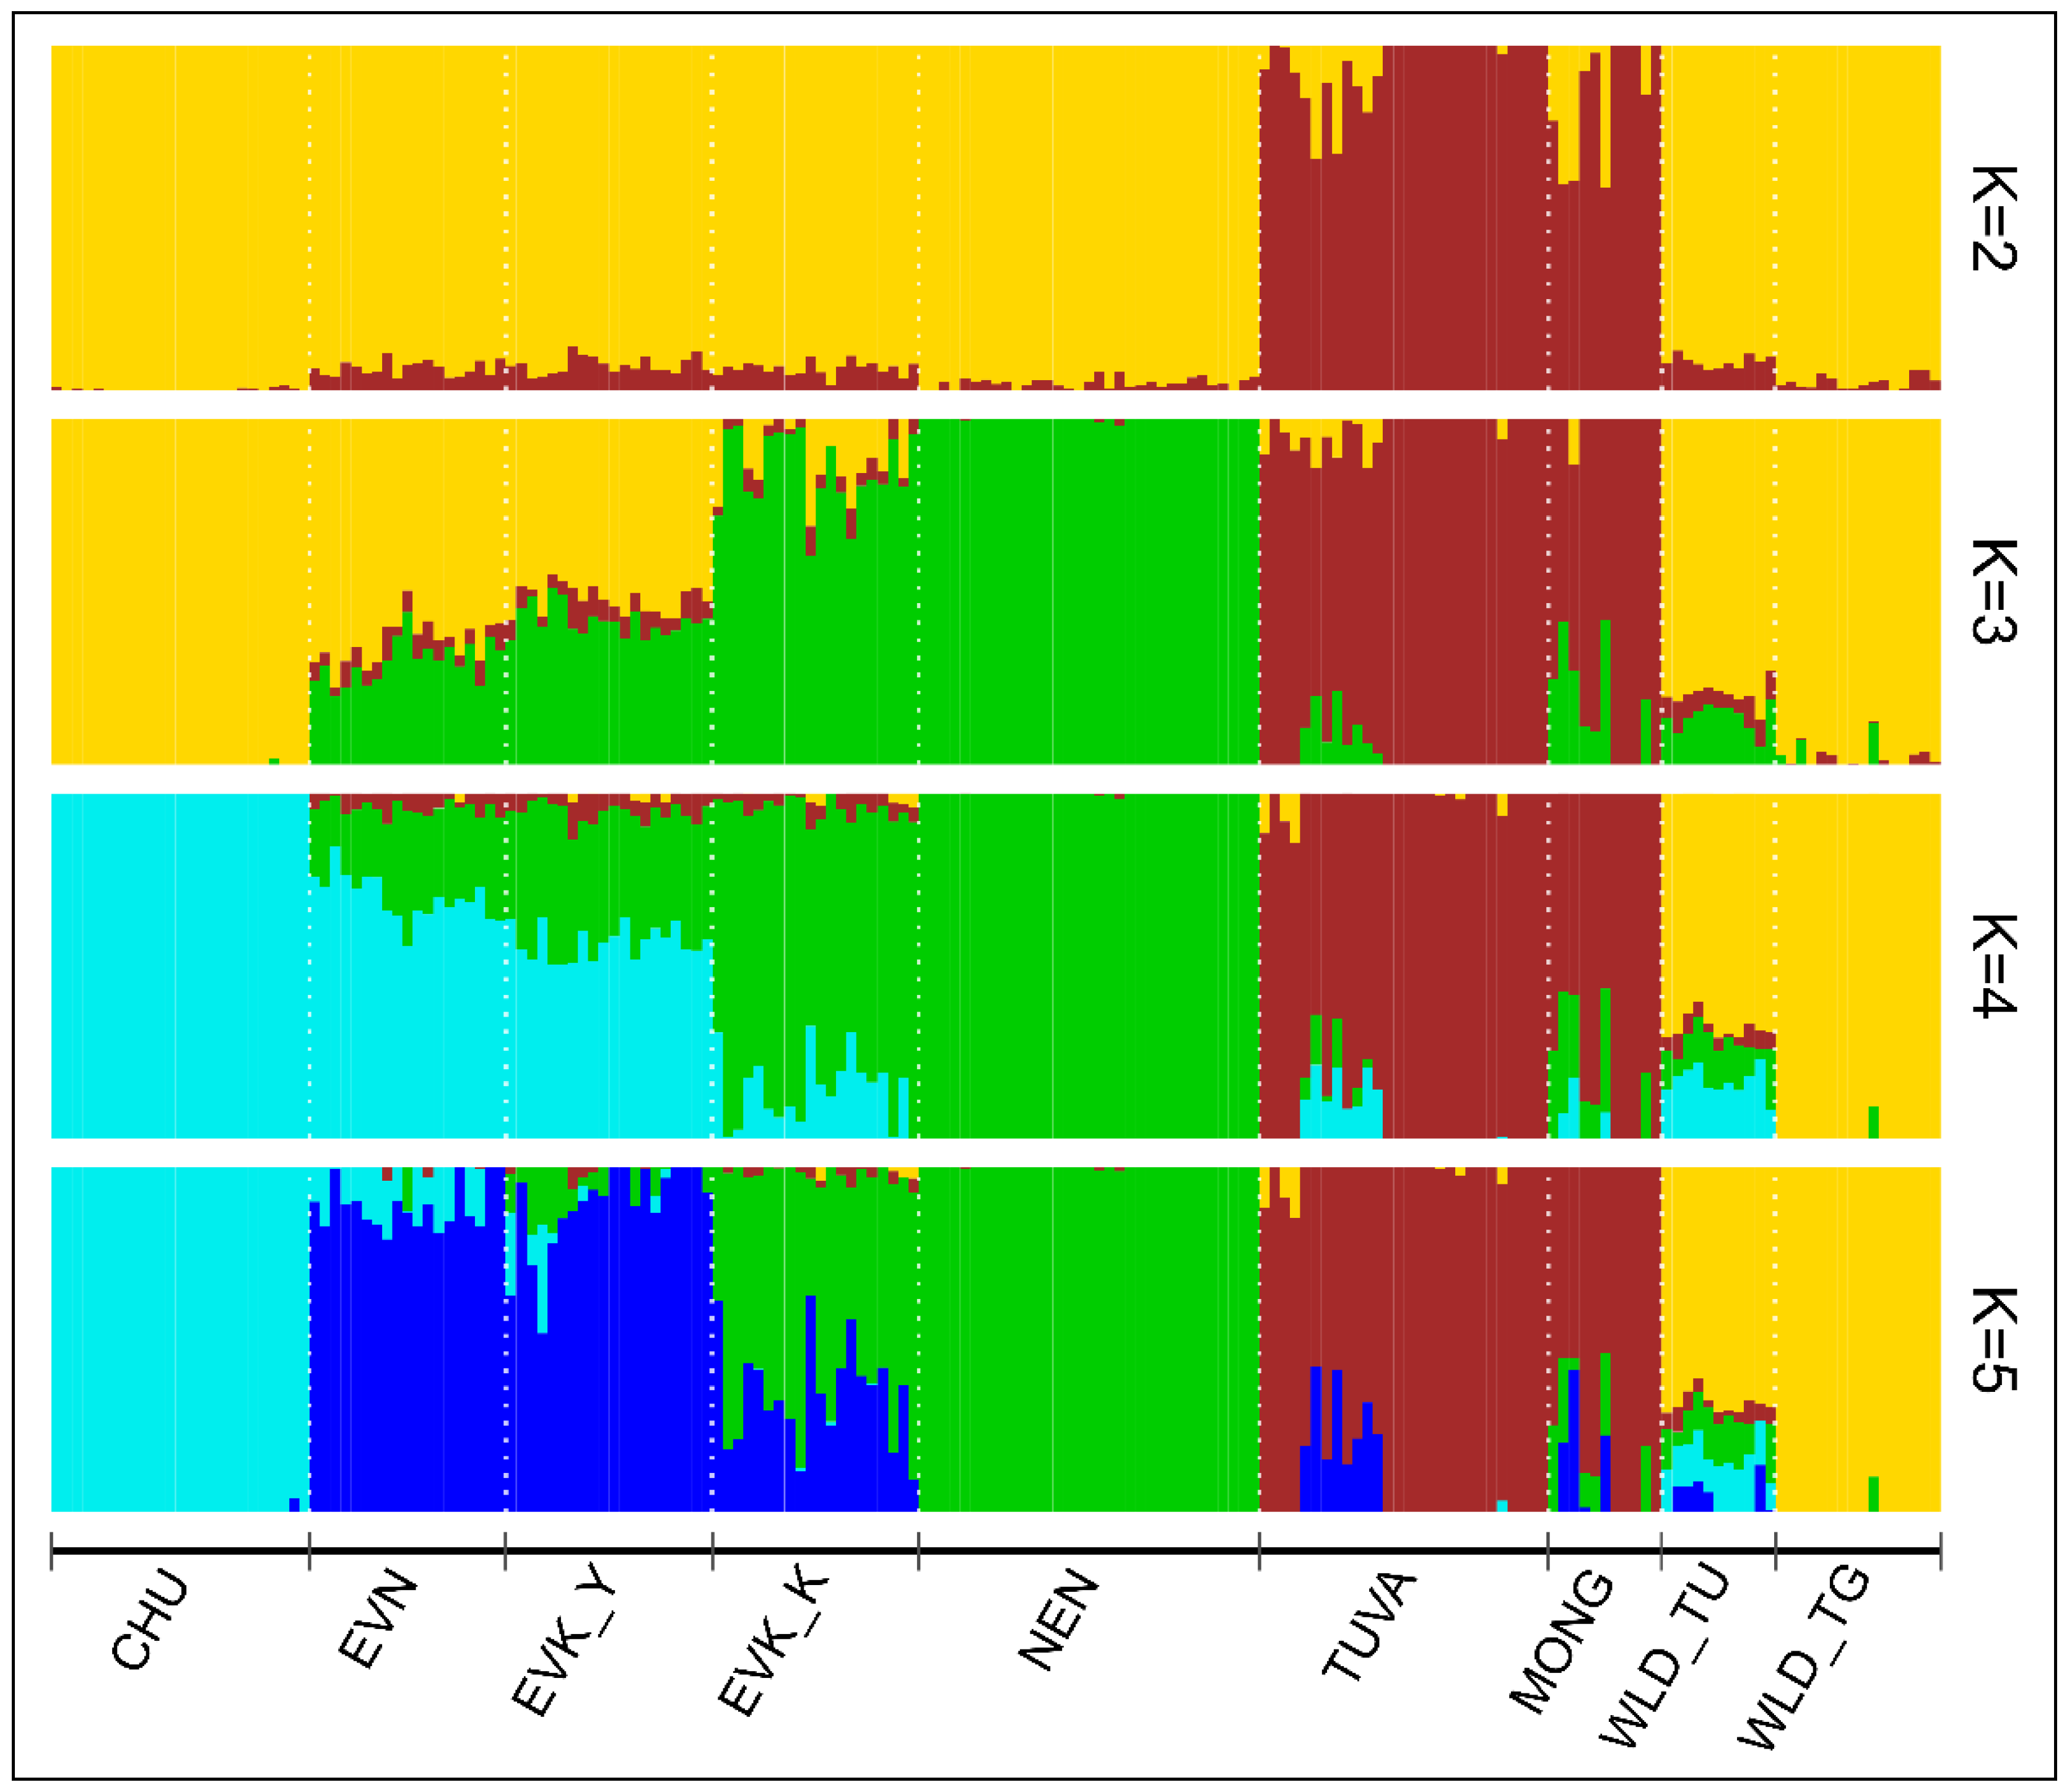
The ADMIXTURE analysis estimated K = 4 as the best number of ancestors with the lowest cross-validation value (CV, 0.358) (
Supplementary Materials, Figure S1). Despite this, we ran ADMIXTURE for value of K = 5, which showed more detailed results (
Figure 3).
We found that as K was increased to K = 5, the Tuvan reindeer showed a common genetic background with the Mongolian population. Meanwhile, at K = 3, in the Tuva population admixed individuals appeared to carry genetic components of two clusters: CHU/WLD_TU/WLD_TG and EVN/EVK_Y/EVK_K/NEN. Furthermore, the proportion of the wild component decreased (K = 4 and K = 5), while admixed individuals with the domestic reindeer cluster retained ancestral background only with EVN/EVK_Y. Among officially recognized breeds, CHU and NEN were revealed to be the most genetically structured, while two breeds inhabiting the Yakutia Region (EVN and EVK_Y) demonstrated a common genetic background. The Evenk breed of the Krasnoyarsk Region disclosed no independent structure representing an admixed genetic component composed of those of reindeer breeds from neighboring geographic regions: the Republic of Sakha (Yakutia) and the Nenets Autonomous District. Wild tundra population revealed a low proportion of admixture from the domestic reindeer, as opposed to the taiga population in which all but one individual showed a total genetic similarity to their assigned cluster.
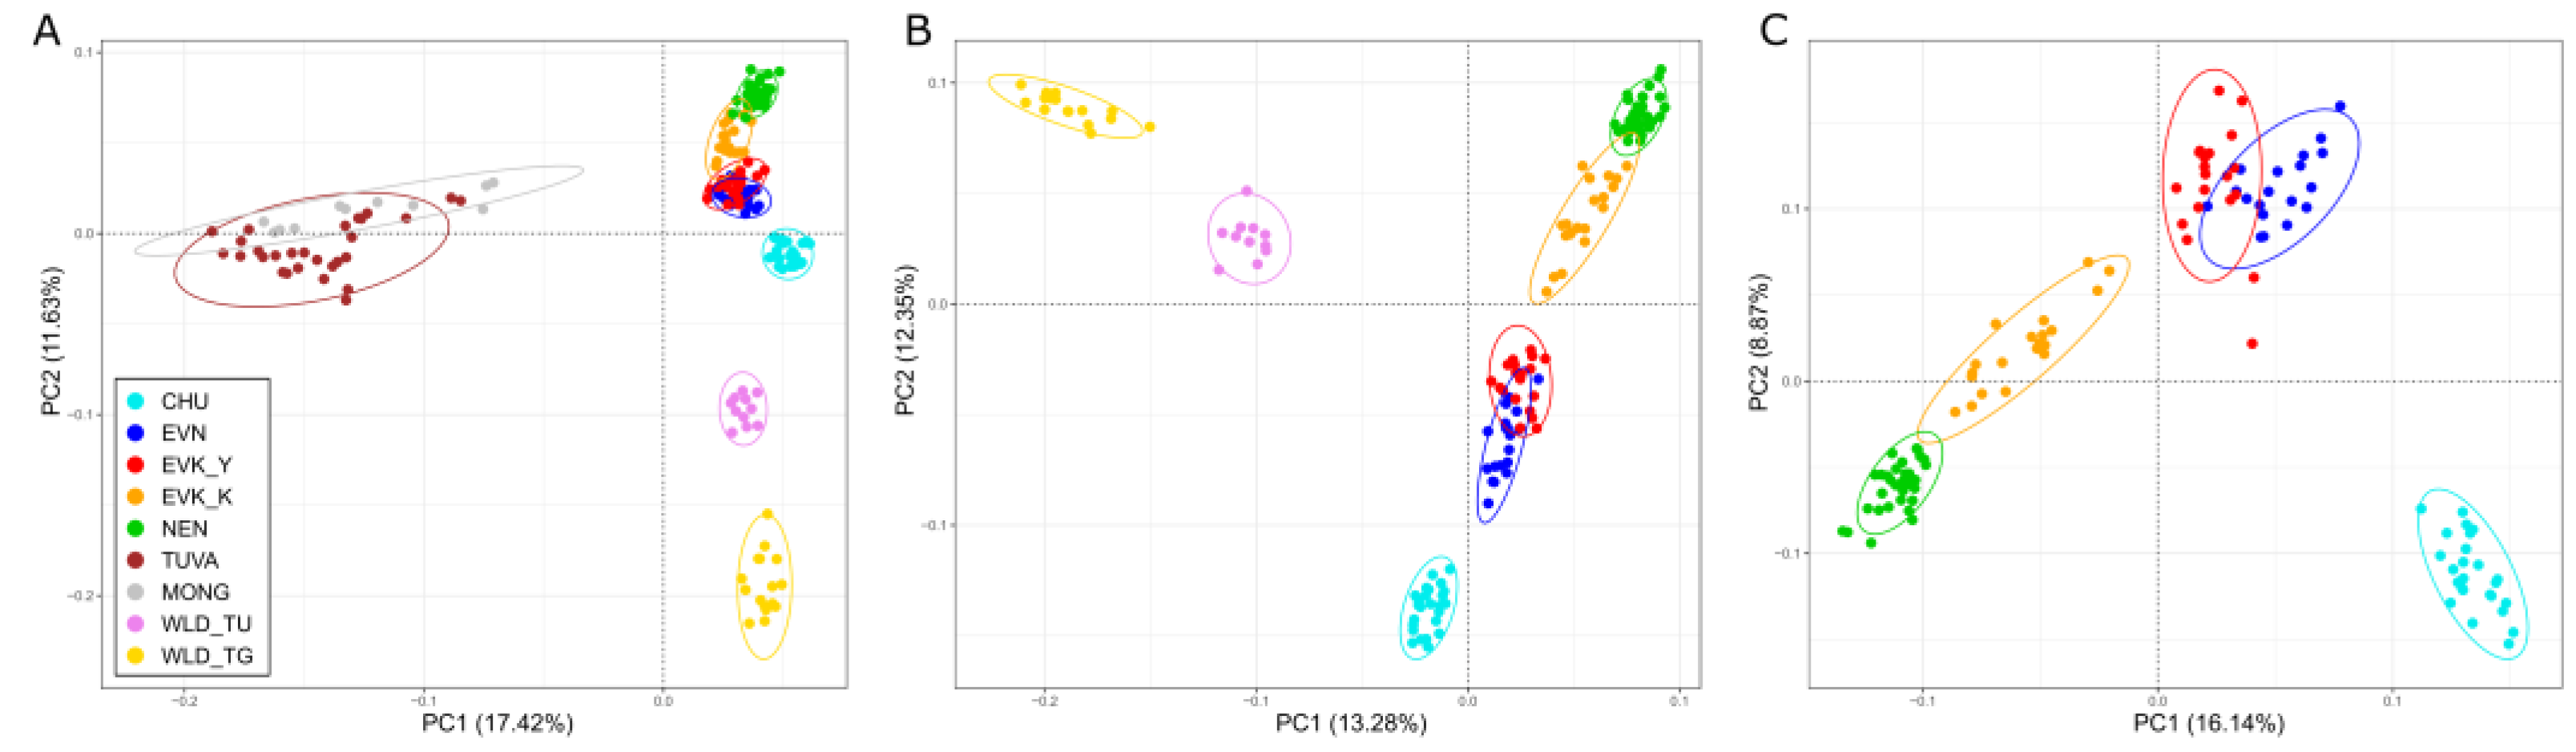
Further, the genetic structure of Tuva–Tofalar population of reindeer was investigated by the principal component analysis with the results presented in
Figure 4.
Initially, we extracted PCA for all of the studied reindeer groups (
Figure 4A). PC1 explained the greatest possible variance in the data between two axes (17.42%), detaching the cluster formed by the Tuvan and Mongolian populations from the remaining reindeer. Meanwhile, at PC2 (11.63% of the variance), the location of the TUVA and MONG clusters were intermediate between the two domestic and wild populations. Interestingly, PC2 also placed the Chukotka breed on the same plane as wild populations. To learn more about this finding, we excluded the Tuvan and Mongolian samples from further analysis (
Figure 4B,C), as well as that of the wild individuals (
Figure 4C). In
Figure 4B, PC1 (13.28% of the variance) united all breeds with the exception of those of the Chukotka, separating it along with the independent clusters of the wild populations. The PC2 (12.35% of the variance) distinguished cluster formed by the two breeds of the Yakutia Region (EVN and EVK_Y) and the Chukotka breed from the remaining reindeer groups. The genetic relationship between reindeer breeds is more accurately visualized in
Figure 4C. The first principal component (16.14% of the variance) placed in a quadrant is the distinct cluster of the Chukotka breed, while a mixing cluster formed by the Even and the Evenk reindeer of the Yakutia Region fell into a different quadrant. Likewise, the genetic detachment of the Chukotka individuals was reflected by the second principal component (8.87% of the variance) which also revealed a distinct cluster in the Nenets breed in close proximity to the cluster of the Evenk breed inhabiting the Krasnoyarsk Region, placing it on the axis.
The Tuvan population showed the closest relationship with the Mongolian population, being located at one node (FST = 0.042), while all other domestic and wild reindeer occupied the opposite node on the tree. Among the reindeer breeds, EVN and EVK_Y revealed the lowest genetic distance (FST = 0.014), forming one cluster from which the Chukotka breed branched out. The second cluster consisted of the breeds from the Nenets and Krasnoyarsk Regions (NEN/EVK_K, FST = 0.023). The third cluster is composed of a branch of the tundra and taiga wild populations, which was positioned between the two clusters of the reindeer breeds.
4. Discussion
The last few decades have been marked by comprehensive studies on genetic resources of natural populations of various species in order to conserve and rationally exploit them. This is due to the fact that species may have, or are, experiencing declines in population sizes [
37]. Increasing arctic temperatures, precipitation, and an anthropogenic landscape change have affected the decrease in number of caribou and reindeer herds across their circumpolar range. Despite the widespread occurrence of the domestic reindeer in the regions of the Far North Russia, the population census size over the last few decades shifted dramatically from a maximum of 2.5 million heads to a minimum of 1.9 [
24,
38]. Among all domestic reindeer, the domestic population inhabiting the indigenous Tofalar lands of southern Siberia is considered the smallest one. A sharp reduction of the Tuva reindeer population occurred after the Soviet Union collapse. Then, it kept declining gradually and, as of 2019, it was confirmed to consist of 1400 individuals. Operating under the assumption that the decrease in population size increases the threat of loss of genetic diversity, our research in this study aimed to identify the level of genetic diversity of the Tuva–Tofalar population of reindeer. Furthermore, we intended to find out which niche this domestic population occupies among the reindeer of all officially recognized breeds, including wild populations as well as the domestic reindeer of the Mongolian population. In order to efficiently address these research targets, we used the Illumina BovineHD Genotyping BeadChip to estimate both genetic diversity parameters and the population structure of the Tuva population based on 6786 SNPs. As we had assumed, the Tuva reindeer showed a low level of genetic diversity, as evidenced by the values of both allelic and genetic diversity (
Table 1). The pattern revealed was consistent with previous results reported by Stolpovsky et al. [
6] based on STR markers. The authors explained the identified patterns in the Tuva population as being based on low migratory activity, which is indicated by its relatively isolated habitat and the process of domestication. A rather high level of genetic diversity in the Tuva population was found by this research through the examination of the mtDNA control region, conducted in 2006 by Kol et al. [
39]. Incongruence between our data and that mentioned above may indicate a decrease in the genetic diversity of this reindeer population over the course of time. However, the fact that those results were obtained using a different methodological approach should be noted. As referred to by Petit-Marty et al. [
37] a mitochondrial genome evolution has different characteristics than one which is nuclear-genomic in nature, such as haploidy, lack of recombination, and uniparental inheritance.
The low level of genetic diversity of the Tuva population revealed in this study could also be caused by the geographical features of the population organization of this group of reindeer, with reference to the peripheral population, as we assumed and stated in the introduction. The expectation that peripheral populations have little genetic diversity was supported by several ensuing findings. For example, Lewontin [
40] reported that small populations are likely to maintain little genetic diversity because of genetic drift. Some authors stated that strong selective forces at the edge of the species’ distribution could erode the genetic diversity of peripheral populations [
40,
41]. Nevertheless, as referred to by Channell [
42], while these expectations of low genetic diversity in peripheral populations are reasonable, they rely on patterns or assumptions that have been accepted uncritically. A closer examination of these patterns or assumptions is, therefore, necessary.
In our findings, the low genetic diversity of the Tuvan reindeer was relatively predictable, whereas the population–genetic relationships of this group with the other domestic and wild reindeer populations turned out to be unforeseen.
With the ADMIXTURE analysis, the common ancestral origin of the genomes of the Tuvan and Mongolian reindeer was seen from K = 2, and this structure did not break down when the number of K was raised (
Figure 2). One alternative possibility for the observed pattern might have been caused by both the origin of reindeer herding and the historical events of the two countries. The ethnic composition of the population of modern Mongolia consists of various ethnic groups, including the Tsaatans or Tuvans (or Dukha as they call themselves) who live along the border region of Tuva and Mongolia (the Khubsugul Province) [
43]. According to researchers, the term “Tsaatan” appeared in official documents in the 1920s. They were named Tsaatans because they were engaged in reindeer herding [
2]. It should be noted that “Tsaa” in Mongolian means: “reindeer”, while “Tsaatan” is “owning a reindeer”. This ethnic group has been seen as being a part of Mongolia at different times in history. In 1926–1927, a border between Mongolia and Tuva was formally established, dividing the pasture territories where the Dukha roamed into two parts. Nevertheless, a strict division of the people occurred only in 1947, when Tuva became a part of the Soviet Union. The state border totally separated the Dukha leaving them on the Soviet side. According to historical data, at that time, many of the older generation of this ethnic group moved with their reindeer from Tuva to Mongolia and settled down there. According to ethnographers, the Dukha and the Tozhu-Tuvan still carry out fully nomadic and semi-nomadic lifestyles in the taiga with their reindeer, subsisting almost entirely on hunting, gathering, and fishing [
2,
4,
44].
Despite the fact that the two ethnic groups have been separated since the Russia–Mongolia border formed in the Eastern Sayan Mountains, a genetic heterogeneity of the Tuvan and Mongolian reindeer population has not been revealed in our study. Furthermore, we noted that the close relationship of the two populations was reflected in both the PCA plot (
Figure 4A) and the NeighborNet network (
Figure 5).
Nevertheless, our special attention was drawn to the intermediate location of the Tuva and Mongolia reindeer groups with regard to the second principal component of PCA (
Figure 4A). As referred to by McVean [
45], with PCA, a projection of non-admixed individuals can lead to their placement (location) being intermediate and between two original populations. For example, samples from a third population that either diverged from population A after a split from population B, or one that come from a population that diverged before the A/B split, will (in both cases) be projected between the locations of samples from populations A and B.
A statement that was discovered indirectly points to the possibility of the independent domestication origins of the reindeer groups studied in the current research. This assumption was additionally supported by a distinctive genetic structure manifested by independent clusters composed of an admixed cluster of Tuvan and Mongolian populations, a cluster of domestic reindeer breeds and a cluster of wild populations (
Figure 3 and
Figure 5).
Our results are, in fact, complementary to previous work with regard to revealing the independent origin of domestic reindeer in Russia and Fennoscandia based on mitochondrial sequences and nuclear microsatellites [
46]. The authors have also concluded that some wild reindeer populations have not contributed to the domestic gene pool, suggesting variation in the domestication potential among populations. Moreover, Weldenegodguad et al. [
47] applying population genomics analysis, suggested at least two independent reindeer domestication events with genetic lineages originating from different refugial regions after the Last Glacial Maximum.
An explanation of admixed individuals with the genetic component of the domestic reindeer in the cluster of Tuvan and Mongolian populations (
Figure 3) has no documented evidence. However, one possible explanation for the observed pattern might be the reindeer exchanges between regions, which are well known.
In the present study, although we used SNPs genotypes that were not included in our previous work [
24], the pattern of distribution of the genetic diversity values (the Evenk and Even breeds of Yakutia Region), as well as independent ancestry (the Nenets, the Even and the Chukotka breeds) and the clear admixture proportions between breeds (the EVK_YAK and EVK_KRA), did not change. Moreover, all statistical approaches used in our study more considerably divided domestic and wild populations, which was consistent with previously published results obtained on a different sample set of animals [
23]. Additionally, PCA and NeighborNet analysis (
Figure 4 and
Figure 5) revealed a different genetic structure of the taiga reindeer from their counterparts inhabiting the tundra. In the present study, these differences were more evident than those previously described [
23]. Behavioral differences and restrictions in seasonal migration patterns apparently caused divergence in genetic structure between tundra and taiga reindeer.
5. Conclusions
In this study, using a high-density SNP genotypes analysis, we first attempted to fill in missing information with regard to the status of the population genetics of the domestic Tuva–Tofalar local group of reindeer inhabiting the south of Eastern Siberia, along with its genetic relationship to all officially recognized breeds, including the domestic reindeer of the Mongolian population and wild reindeer.
The low level of genetic diversity that was revealed in the Tuvan population was our main concern, since its further loss may lead to a decrease in the adaptive capabilities of the species, as long as genetic diversity is the raw material for natural selection allowing species to adapt to new environmental conditions. Moreover, we observed that the Tuva population shared genetic background with reindeer inhabiting Mongolia implying their common origin, while a singular structure of Tuvan reindeer differs from domestic and wild populations inhabiting country.
In this regard, we believe that our findings will be useful for solving problems related to conservation in order to increase the number of this substantial reindeer population, which is vital for the normal functioning of ecosystems and for the life and culture of the indigenous peoples living in the region. In addition, the disclosure of the genetic characteristics of the Tuvan reindeer obtained in this study may also be functional for implementing genetic diversity databases accumulated from breeds and populations with two different goals: the conservation and the sustainable use and exploitation of the Rangifer tarandus species worldwide.

 ,
, 


