Article

Genome-Wide Genetic Diversity and Population Structure of Local Sudanese Sheep Populations Revealed by Whole-Genome Sequencing

1
Amhara Regional Agricultural Research Institute, Bahir Dar P.O. Box 527, Ethiopia
2
Microbial, Cellular and Molecular Biology, Addis Ababa University, Addis Ababa P.O. Box 32853, Ethiopia
3
LiveGene, International Livestock Research Institute (ILRI), Addis Ababa P.O. Box 5689, Ethiopia
4
Jackson Laboratory, 600 Main Street, Bar Harbor, ME 04609, USA
5
Biomedical Research Institute, Darfur University College, Nyala P.O. Box 155, Sudan
6
Faculty of Medical Laboratory Sciences, University of Khartoum, Khartoum P.O. Box 321, Sudan
7
School of Life Sciences, University of Nottingham, University Park, Nottingham NG7 2RD, UK
8
Centre for Tropical Livestock Genetics and Health, The Roslin Institute, Edinburgh EH25 9RG, UK
*
Authors to whom correspondence should be addressed.
Diversity 2022, 14(11), 895; https://doi.org/10.3390/d14110895
Submission received: 7 September 2022 / Revised: 30 September 2022 / Accepted: 5 October 2022 / Published: 22 October 2022
(This article belongs to the Section Animal Diversity)

Abstract

:
Local Sudanese sheep populations inhabiting diverse environmental conditions and holding opposing morphologies provide opportunities for molecular-genetic research. Characterizing their genome is crucial for sustainable breeding improvement and targeting favorable genes in breeding programs. However, the genome of these sheep populations, which comprises several subtypes, remains uncharacterized using whole-genome sequence data. This study aimed to elucidate genome-wide genetic diversity and population structure of 11 local Sudanese sheep populations, namely, Hammari, Kabbashi, Meidobe, Ashgar, Dubasi, Watish, Bega, Naili, Fulani, Zagawi, and Garag. Ninety whole blood samples were collected, and we extracted DNA using a Qiagen DNeasy® extraction kit. We used the Illumina HiSeq 2000 platform to sequence all the DNA samples. We included whole-genome sequence data of three Ethiopian sheep (Doyogena, Kefis, and Gafera) and one Libyan sheep (Libyan Barbary) in the study to infer the genetic relationships of local Sudanese sheep populations from a continental perspective. A total of 44.8 million bi-allelic autosomal SNPs were detected; 28.5% and 63.3% occur in introns and intergenic regions, respectively. The mean genetic diversity ranged from 0.276 for Garag to 0.324 for Kabbashi sheep populations. The lowest FST estimates were observed between Kabbashi and Ashgar and the highest between Bega and Fulani local Sudanese sheep populations. The principal component and population structure analyses of the 11 local Sudanese sheep populations indicated three separate genetic groups categorized following their tail morphotype, geographical distribution, and population subtype. The thin-tailed local Sudanese sheep populations exhibited independent clustering from the fat-tailed Ethiopian and Libyan sheep. We also observed distinct clustering between the fat-tailed Ethiopian and Libyan sheep. The present study’s findings demonstrated the population structure and principal components related to tail morphotype, geographical distribution, and population subtype of local Sudanese sheep populations. A clear signature of admixture was observed among the studied local Sudanese sheep populations.

1. Introduction

Sudan, covering an area of about 1,861,484 square kilometers, possess one of the largest livestock populations in Africa [1,2]. Approximately 30% of Sudan’s total population rear livestock, contributing to 46% of the share of agriculture growth domestic product [3]. In 2009 Sudan official sources estimated that cattle, sheep, goats, and camels numbered 141 million head [4].
Sudan is well-endowed with sheep resources adapted to various environments and production systems, and sheep represent 36.6% of the estimated head of livestock (cattle, sheep, goat, and camel) in the country [4,5]. Sheep play an essential function in food security and the keeping of resource-poor rural households. Furthermore, sheep also play a fundamental socio-cultural role in the country and provide meat for local consumption, and meat and live animals for export [6]. They also play a critical role in the Sudanese economy and act as a store of wealth [7]. Despite their outstanding contribution, their productivity is still lower than expected due to several factors, including a lack of appropriate breeding and conservation strategies [1]. Moreover, local Sudanese sheep populations have never had the opportunity to express their productive performance under improved feeding and other environmental conditions due to the nomadic or semi-nomadic systems under which sheep are raised [8].
Local Sudanese sheep have been categorized into basic and fused populations [3,9,10]. The classifications depended mainly on tribal ownership, geographical and ecological distribution, physical features, and animal production traits. This classification approach might lead to grouping genetically identical populations into morphologically different groups [11,12]. The basic sheep populations include Desert, Nilotic, Arid equatorial, Arid upland, and West African, and the fused populations are their inter-crosses [13]. The Desert sheep is the main sheep type in Sudan, which encompasses a number of subtypes (e.g., Hammari, Kabbashi, Watish, Dubasi, Ashgar, Bega, Maidobe). Together with its fusions, the Desert sheep comprises approximately 80% of the sheep population in Sudan [14].
Documented information on the genetic resources of the existing population, including its phenotypic description, genetic uniqueness and potential, and socio-economic importance, is a prerequisite in livestock conservation [7]. Evaluation of the genetic divergence within and between breeds is the basis for genetic diversity studies in domestic animals [15]. Genetic characterizations were performed using microsatellite markers on local Sudanese sheep’s genetic diversity and population structure [1]. A recent study evaluated the genomic variation in Sudanese thin-tailed Desert sheep using 600K SNP genotype data [8]. However, the genomes of local Sudanese sheep populations remain uncharacterized using whole-genome sequence data.
Whole genome-based characterization of animals allows the reconstruction of full genome phylogenies, including population-level genomic studies, the assessment of population divergence [16,17], and the investigation of the genetic basis of phenotypic variation and local adaptation [18]. Furthermore, genome characterization allows the detection of genes in different breeds which are likely associated with specific animal traits [8]. This study aimed to characterize the genome of local Sudanese sheep populations using whole-genome sequence data.

2. Materials and Methods

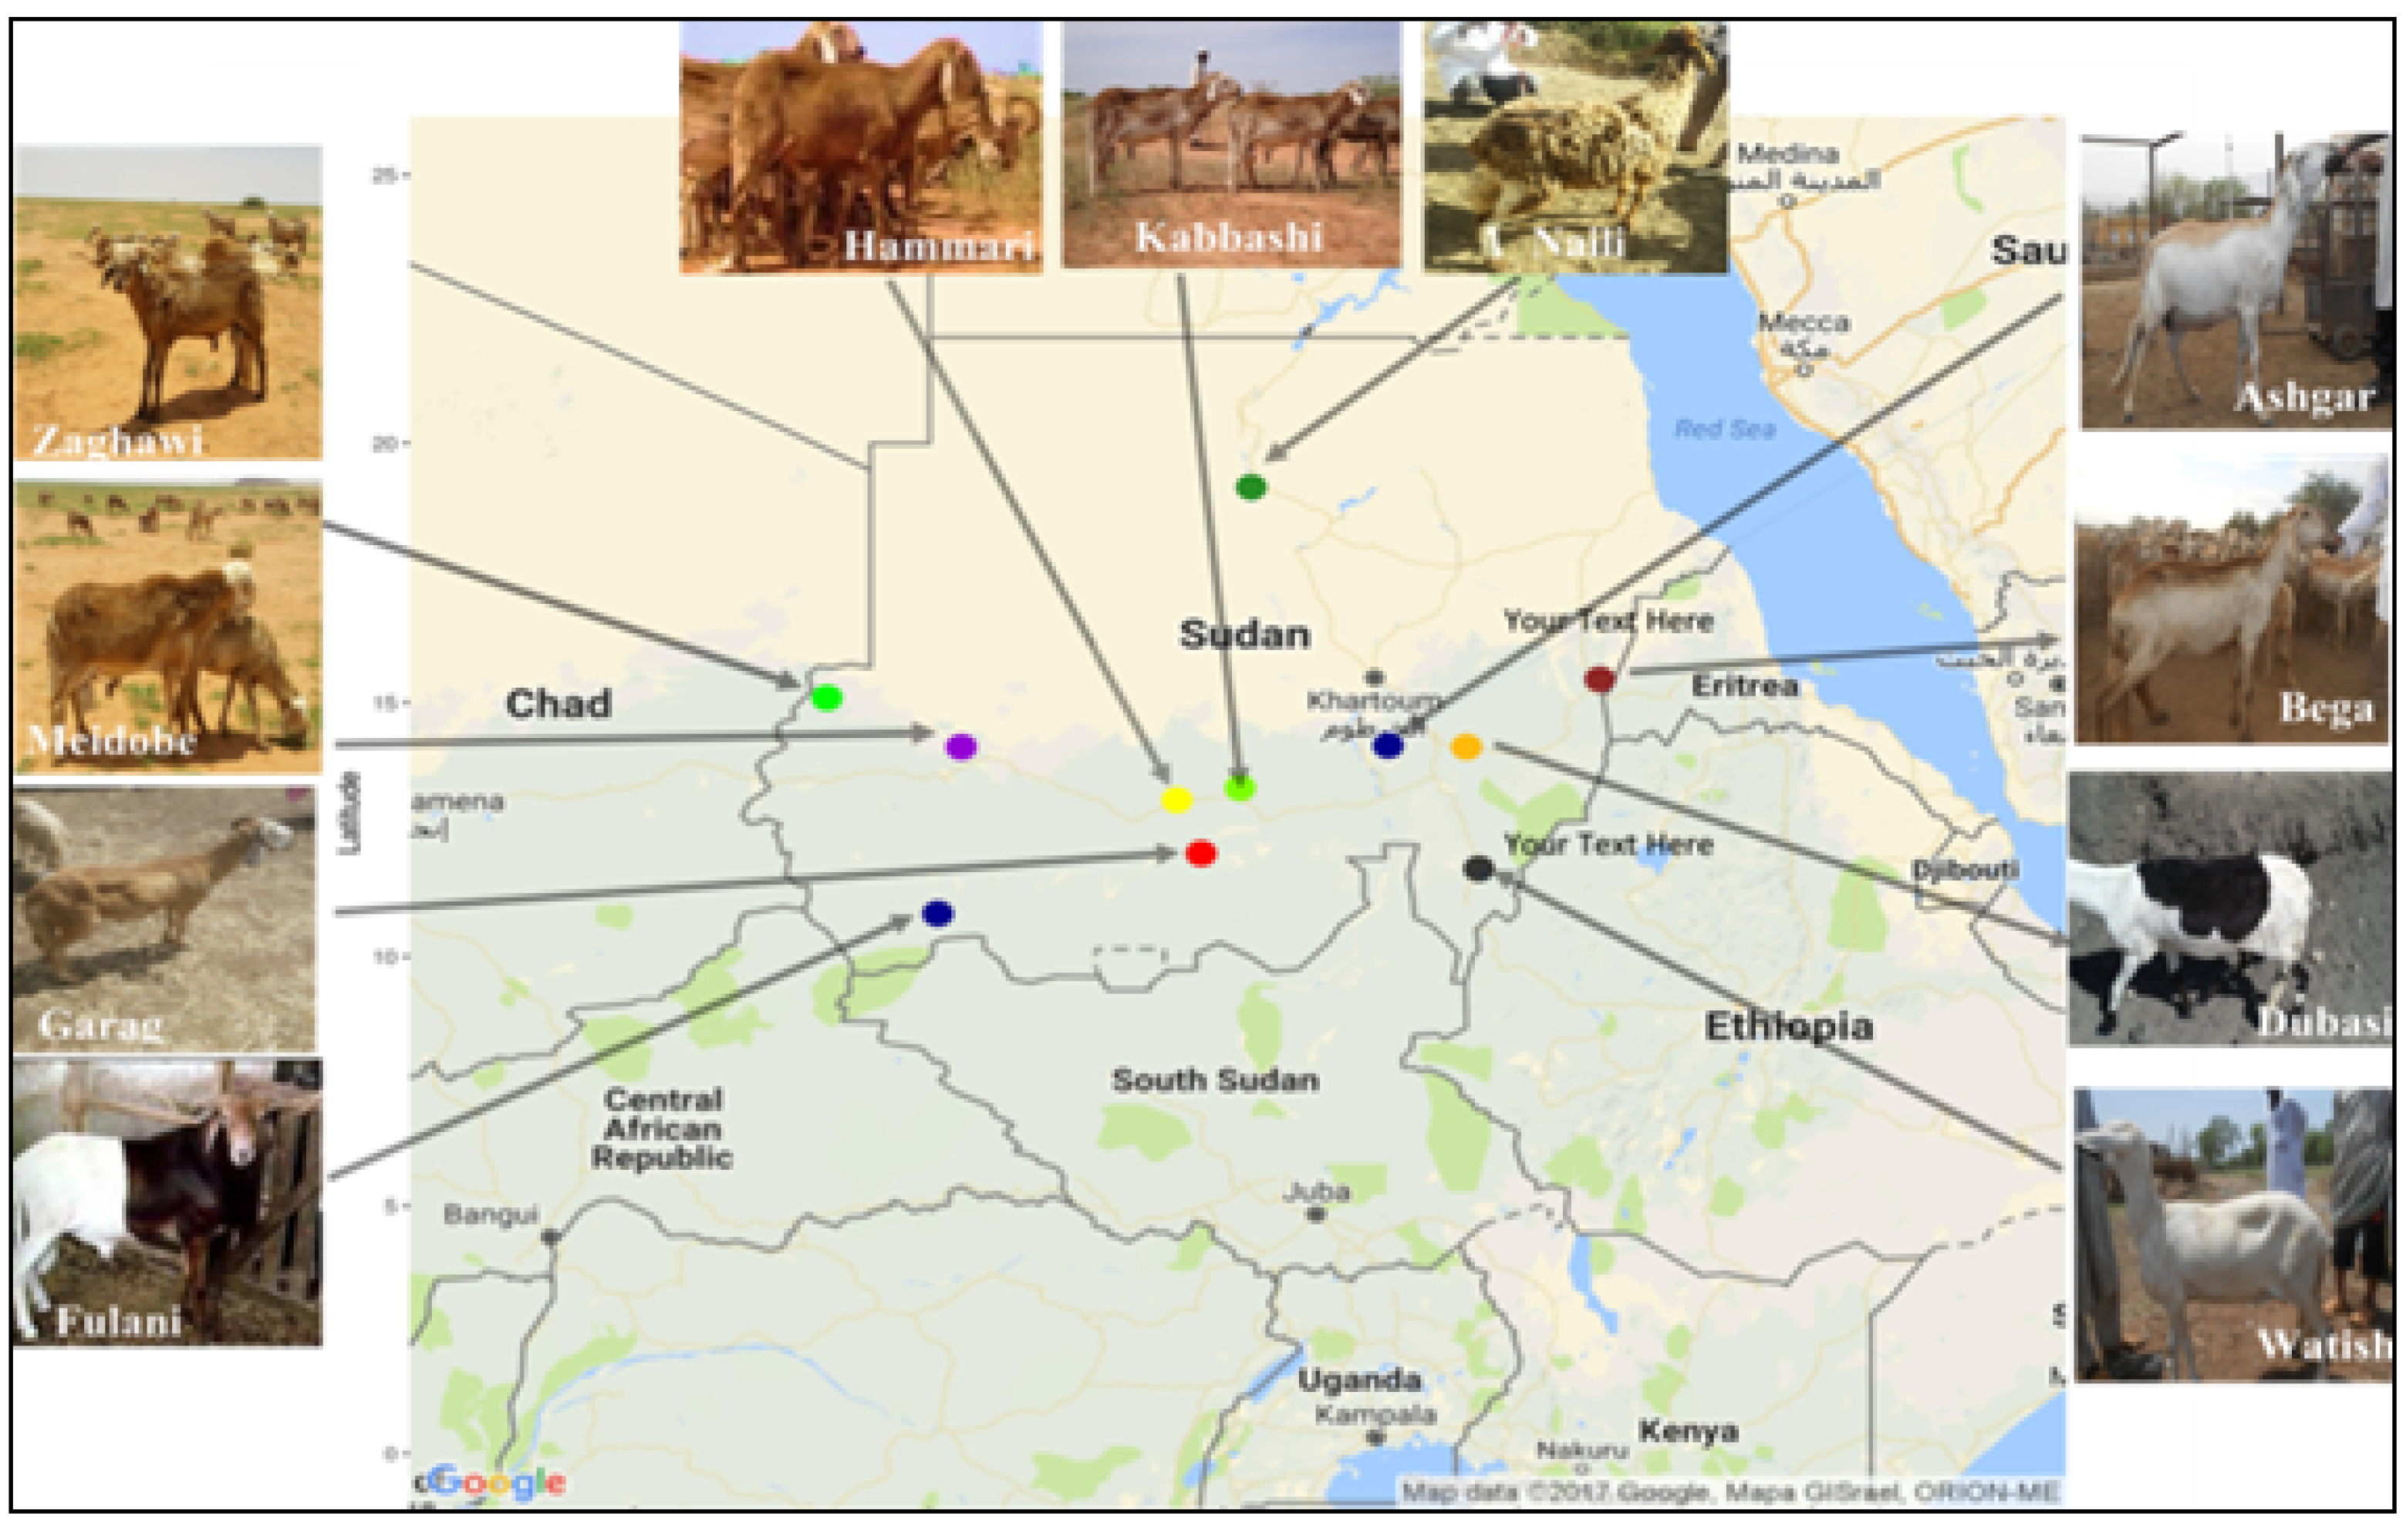
2.1. Sheep Populations, Sample Collection, and DNA Extraction

Whole blood samples were collected from 11 local Sudanese sheep populations, representing the Desert (comprising seven sheep subpopulations), Reverin (Naili), West African (Fulani), Arid-upland (Zagawi), and Fused (Garage) populations. They are adapted to diverse agroecological environments and were sampled from different geographical regions in the country, as presented in Figure 1 and Table 1. We recorded geographic positioning system (GPS) coordinates for each sheep population and developed a geographical distribution map based on their GPS coordinates (Figure 1).
Sheep populations with typical phenotypic features located in regions of the native breed geographic distribution in the country were sampled and maintained by smallholders under a low input production system. Pedigree information were unavailable under these management systems, but farmers are normally well aware of the breeding practices. Blood samples (n = 90) were collected from the studied 11 local Sudanese sheep populations based on FAO Guidelines (FAO, 2011) [19] and using a 5 mL vacutainer tube with 1 mL EDTA as an anticoagulant. A stratified random sampling procedure was followed to avoid sample collection from closely related individuals within each flock. Moreover, the samples were collected from different households in different villages based on flock owners’ information and typical phenotypic characteristics of each sampled animal to avoid sampling related animals.
We extracted genomic DNA (gDNA) using the Qiagen DNeasy® extraction kit (Qiagen, Valencia, CA, USA) based on the manufacturer’s protocol. The gDNA was assessed employing gel electrophoresis and a NanoDrop spectrophotometer (NanoDrop Technologies, Wilmington, DE, USA) methods. Whole genome sequence data of 44 individuals describing three Ethiopian (Doyogena = 9; Kefis = 13; Gafera = 10) and one Libyan (Libyan Barbary = 12) sheep were incorporated in the analysis as a reference to infer the genetic relationships of local Sudanese sheep populations from the continental perspective. Detailed descriptions of the studied sheep populations, including the reference four populations, are summarized in Table 1.
Table 1. Summary of the studied sheep populations and their geographical distribution.
Origin PopulationNLatitude Longitude AltitudeFiber TypeTail TypeType
SudanHammari 1013.0929.22621.45HairyLong, thin tailDesert
Kabbashi1013.0929.22621.45HairyLong, thin tailDesert
Meidobe 1114.1325.55945.91HairyLong, thin tailDesert
Ashgar714.1632.79418.51HairyLong, thin tailDesert
Dubasi1014.1334.13413.44HairyLong, thin tailDesert
Watish211.7434.34484.37HairyLong, thin tailDesert
Bega815.4536.39505.42HairyLong, thin tailDesert
Zaghawi1015.0923.27727.35HairyLong, thin tailArid-upland
Fulani1010.8525.15473.85HairyShort, thin tailWest African
Garag712.0429.63679.42HairyShort, thin tailFused
Naili519.1630.48227.37Wooly Long, thin tailReverin
EthiopiaKefis139.540.17890 HairyFat tail-
Gafera1011.5236.902500 HairyFat rump-
Doyogena107.3537.782324 HairyFat tail-
LibyaBarbary1232.5215.15< 100HairyFat tail-
Total134
N: number of observations; Sources: [13,20].

2.2. Whole-Genome Sequencing, Variant Detection, and Annotation

Pair-end sequencing was conducted on the Illumina HiSeq 2000 platform (Illumina Inc., San Diego, CA, USA) with a read length of 150 bp at each end for the qualified DNA libraries (Novogene, Beijing, China).
We employed the best procedures pre-processing Genome Analysis Toolkit (GATK) workflow from the Broad Institute (https://software.broadinstitute.org/gatk/best-practices accessed on 8 October 2021) to detect the variants (SNPs). Mapping of the sequence reads to the Ovis aries (sheep) reference genome (Oar_v3.1) was performed using BWA-mem v. 0.7.17 [21]. Variant calling and joint genotyping were performed using HaplotypCaller and GenotypeGVCFs, respectively. We employed VariantRecalibrator to conduct Variant Quality Score Recalibration. The variants failing the GATK filtering process were removed using the GATK tool, SelectVariants.
The detected genomic variants (SNPs) were annotated using the VEP tool v.98 [22] (https://genomebiology.biomedcentral.com/articles/10.1186/s13059-016-0974-4, accessed on 6 September 2022) to identify the various categories of the variant and their location on the genome (Figure 2, Table S2, Figure S2).

2.3. Data Management and Quality Control

Genomic analyses were performed using only bi-allelic autosomal SNPs (44.8 million). Those SNPs with less than 0.05 minor allele frequency (MAF) and genotype call rate less than 90% were discarded using PLINK v1.9 [23]. These filtering thresholds left 21.1 million bi-allelic autosomal SNPs. Further, the obtained SNPs were subjected to linkage disequilibrium pruning, using default options (50 SNPs step 5 SNPs, r2 0.5) to bypass the probable effect of groups of SNPs on population relationships and structure studies [24]. This linkage disequilibrium pruning process yielded 4.1 million SNPs for population structure analyses.

2.4. Genetic Diversity and Differentiation

The “--het” and “--window-pi” options in VCFtools v.0.1.15 [25] were employed to estimate the observed (Ho) and expected (He) heterozygosity, inbreeding coefficient (F), and nucleotide diversity (Pi).
Pairwise genetic variation (Fixation index, FST) [26] analysis was performed using a sliding window approach, a window size of 200 Kb with a stepping size of 200 Kb [20], to estimate the genetic differentiation between the studied sheep populations.

2.5. Genetic Population Structure Analyses

To investigate the genetic population structure, we performed principal component analysis (PCA) and estimation of the proportion of ancestry (admixture). We used the “pca” option in PLINK v1.9 [23] to perform the PCA, and the first two principal components were graphically displayed using the ggplot2 package provided by R [27]. We performed the admixture analysis in the ADMIXTURE v.1.3.0 program [28] to investigate the underlying genetic structure. As previously applied in a recent study [20], a 5-fold cross-validation procedure was used.

3. Results

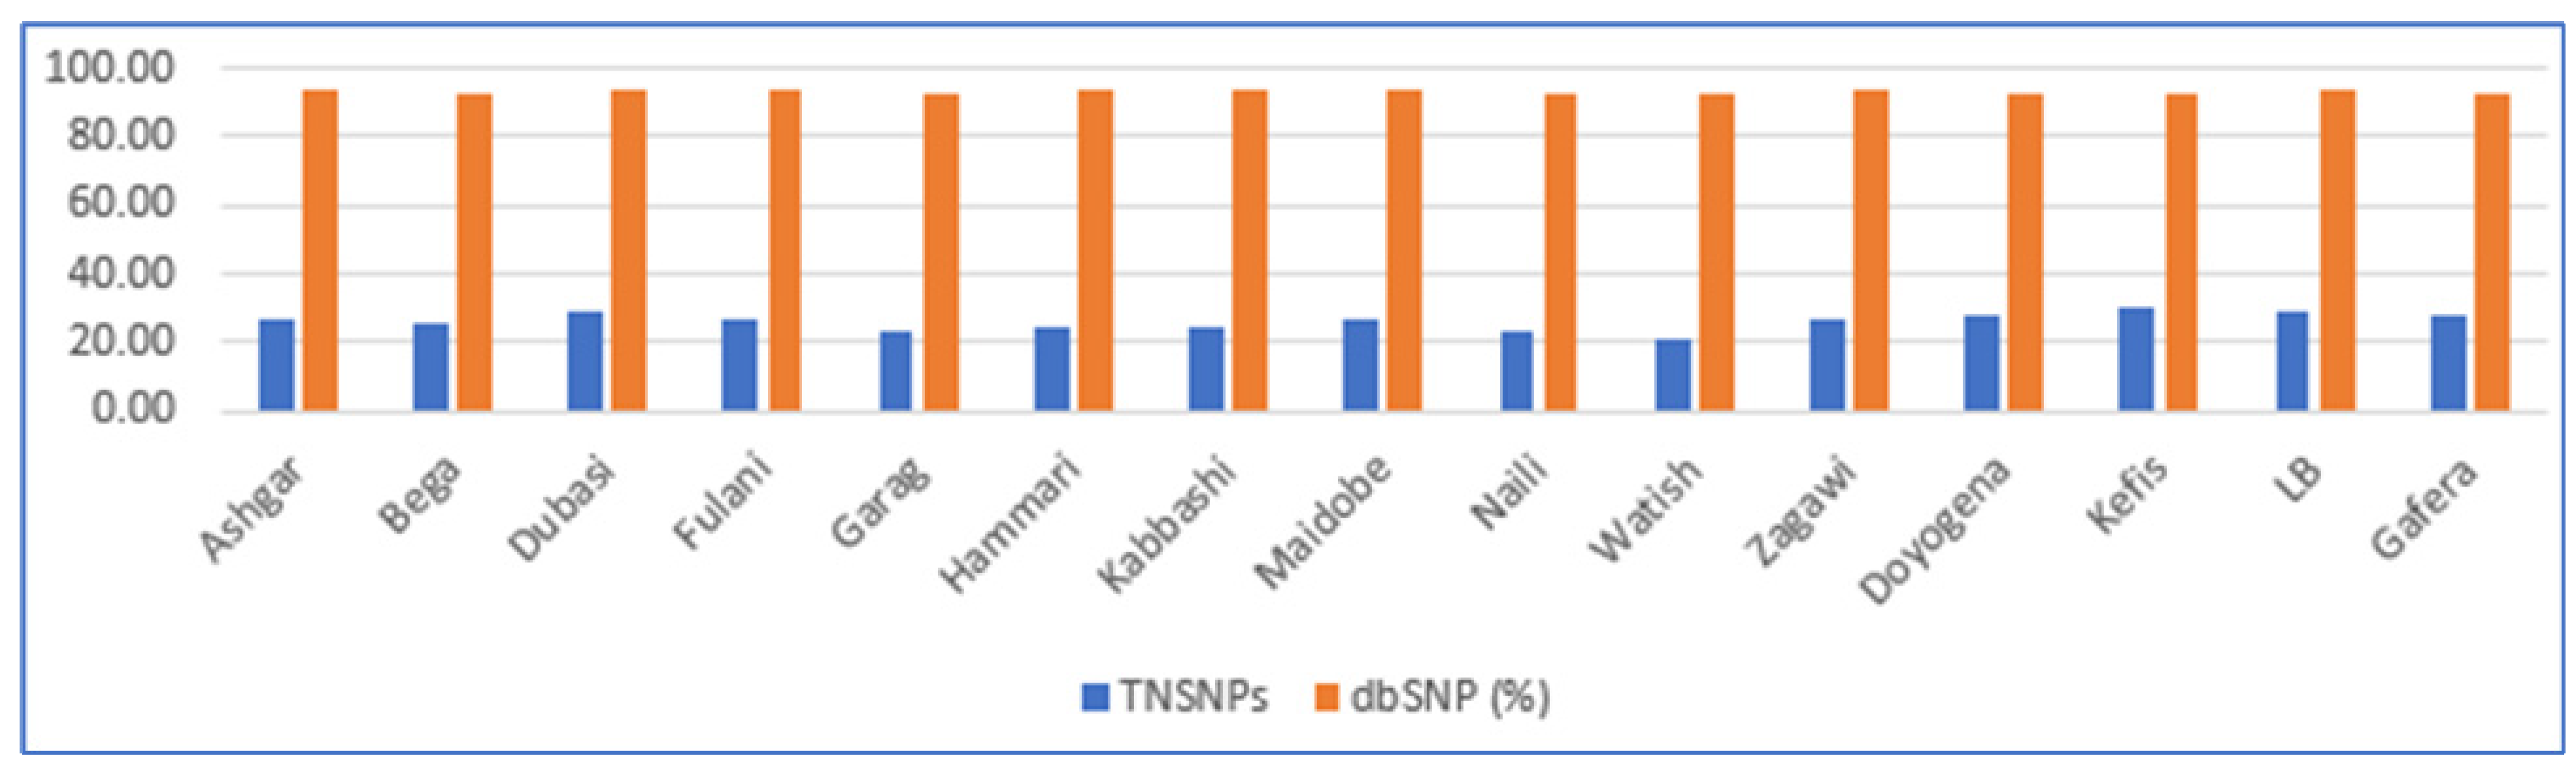
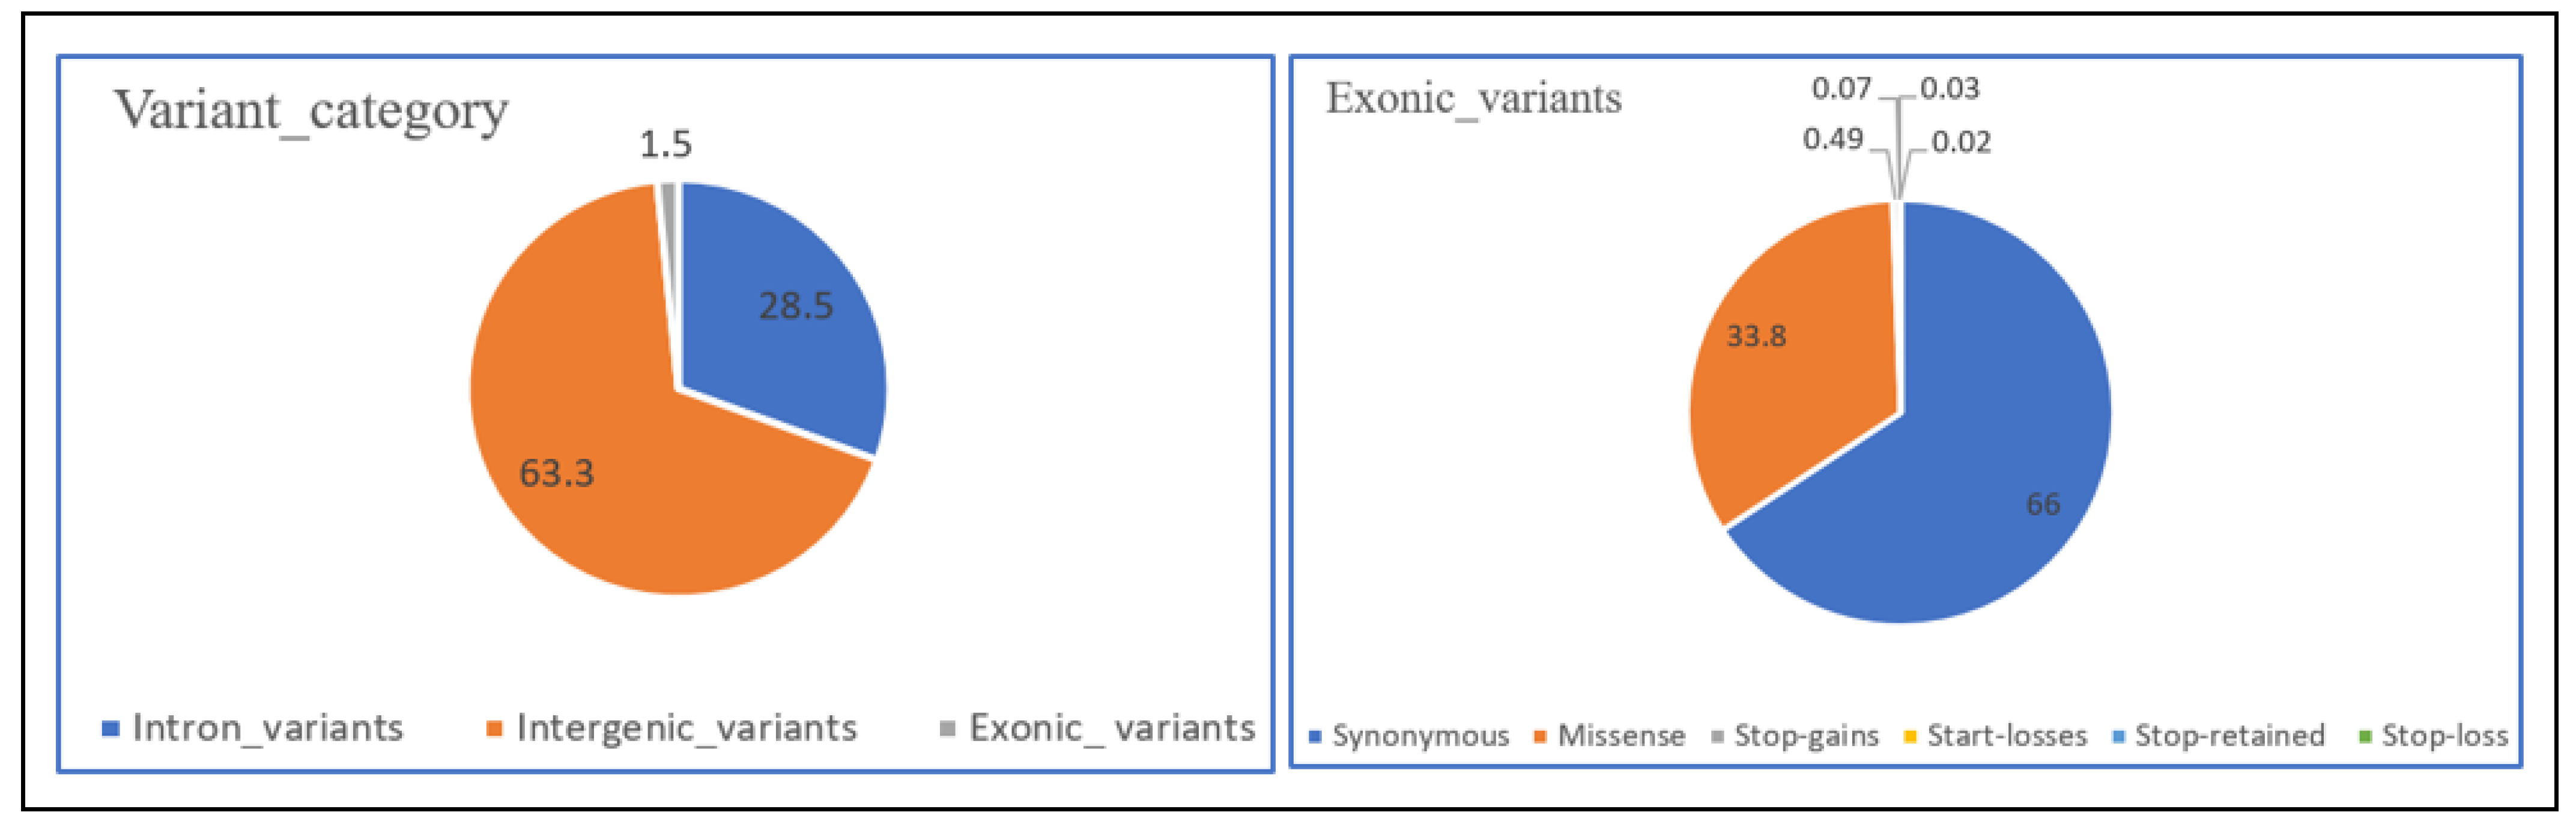
3.1. Variant Detection and Annotation

We applied strict filtration criteria to the variants (SNPs) that the variant calling process detected to minimize false-positive variant calls. A total of 44.8 million bi-allelic autosomal SNPs were detected from the analysis of whole genome sequence data of 134 sheep samples. In all sheep populations, the number of SNPs detected ranged from 21.5 to 29.8 million in Watish and Kefis sheep populations, respectively (Figure 2, Table S1). Based on the comparison with the Ovis aries dbSNP, around 93.34% of the total SNPs are present in the sheep dbSNP database, which indicates the remaining 6.66% of the total SNPs are not present in the SNP database (Figure 2).
The SNP annotation of the 44,798,565 unique variants, data from the 15 sheep populations representing 134 sheep samples, is presented in Figure 3, Table S2, and Figure S1. Around 28.5% and 63.3% of the variants occur in introns and intergenic regions, respectively, while exonic variants are represented by only 1.5% of the variants. These exonic variants are represented by 671, 971 SNPs including 440,718 (65.6%) synonymous, 227,165 (33.8%) missense, 3282 (0.49%) stop-gains, 475 (0.07%) start-losses, 184 (0.03%) stop-retained, and 147 (0.02%) stop-loss variants.

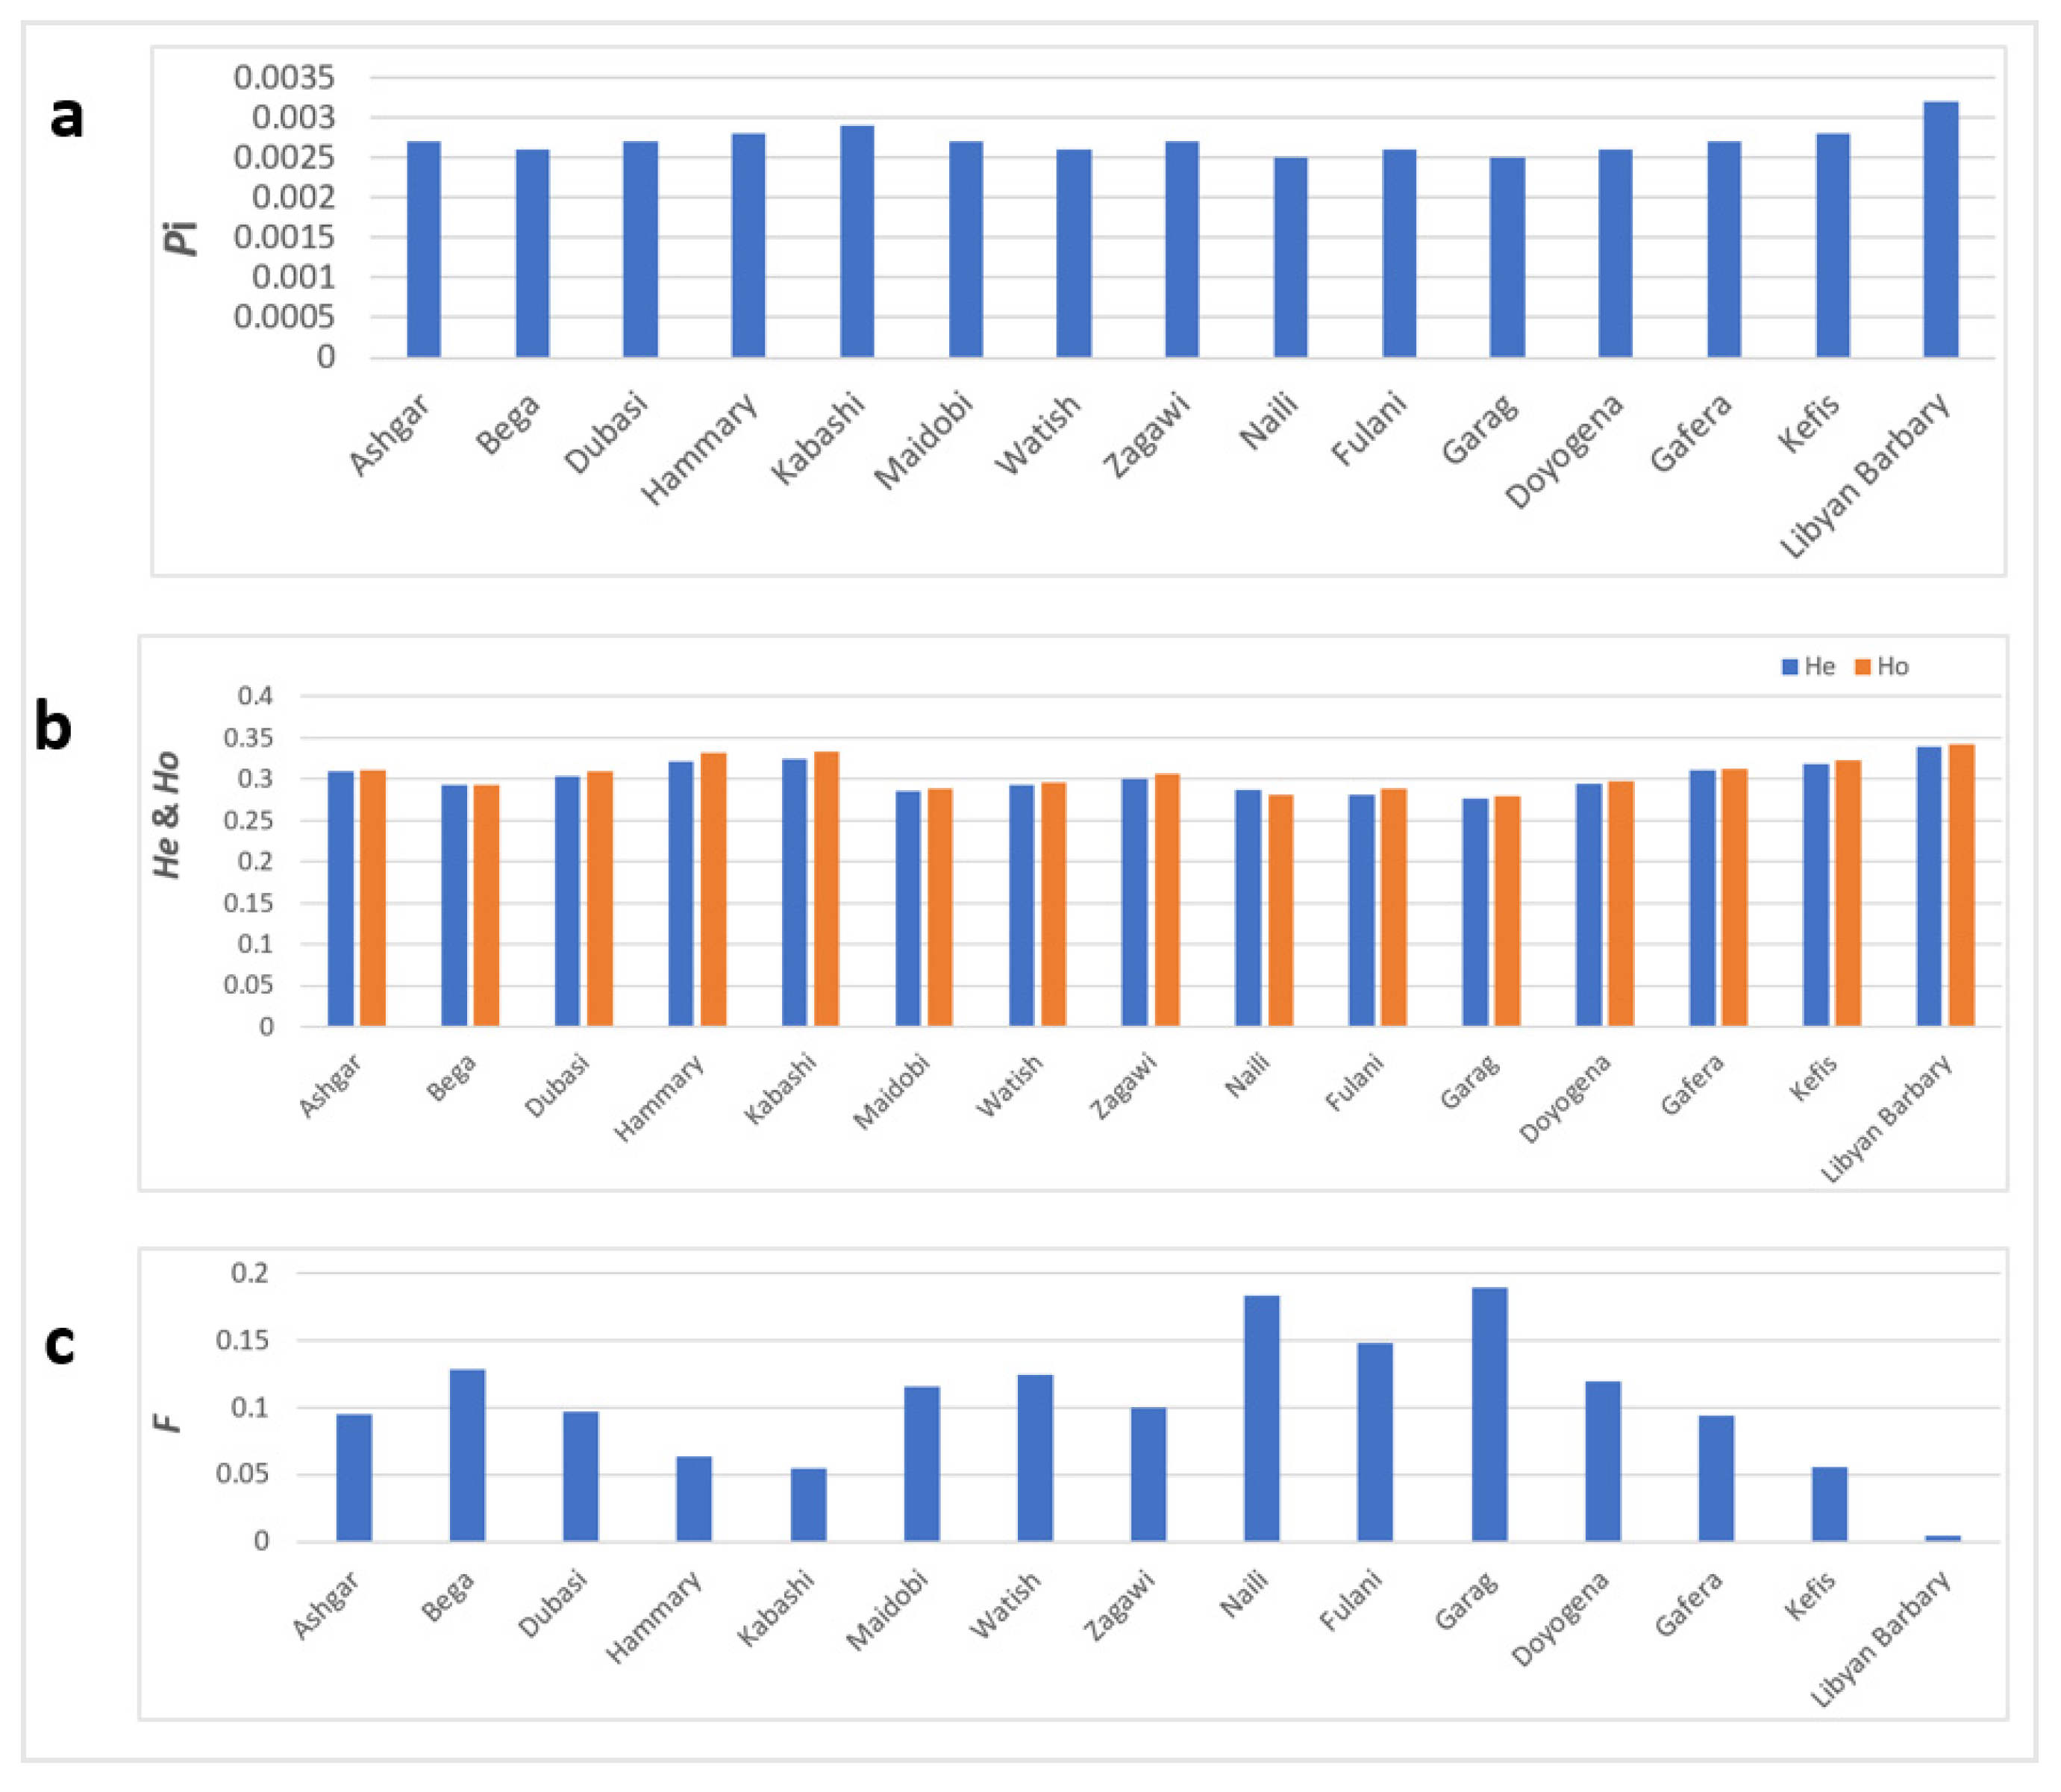
3.2. Estimation of Genetic Diversity

The mean estimates of inbreeding coefficient (F), nucleotide diversity (Pi), observed (Ho), and expected (He) heterozygosity, as measures of genetic variation within a population, for 15 sheep populations, are shown in Figure 4 and Table S3. From a continental perspective, the lowest level of F reflected by high levels of Pi, Ho, and He were observed in Libyan Barbary sheep. In contrast, the highest F level, also reflected by low levels of Pi, Ho, and He, were observed in Garag and Naili sheep populations. Similarly, a higher level of F was observed in local Sudanese sheep populations (0.118) than in Libyan Barbary (0.005) and Ethiopian (0.089) sheep. The overall mean F value of the local Sudanese sheep populations was 0.118, with the lowest values were observed in the Kabbashi and Hammari sheep populations and the highest in the Garag and Naili sheep populations.

3.3. Population Divergence and Relationships

Pairwise genetic differentiation (FST values) among the 14 studied sheep populations was estimated using 23,259,203 variants (Table 2). Watish sheep, one of the seven subpopulations of the Desert local Sudanese sheep population, were excluded from the analysis due to their very small sample size (n = 2). The estimated average FST value was 0.049, ranging from 0.001 to 0.112. The lowest pairwise value (0.001) was observed between the two long thin-tailed Desert sheep subpopulations (Kabbashi and Ashgar) and the highest (0.112) between the long thin-tailed Fused-Garag and the fat-tailed Ethiopian Gafera sheep populations.
The overall FST value of the local Sudanese sheep populations was 0.030. It ranged from 0.001 to 0.085, with the closest pairwise value (0.001) between Kabbashi and Ashgar sheep populations and the highest pairwise value (0.085) between the long thin-tailed Desert Bega and short thin-tailed West African-Fulani sheep populations. The overall genetic differentiation (FST value) observed among the six subpopulations of the Desert local Sudanese sheep populations was low (0.012). The Desert (comprises six subpopulations), Reverin (Naili), and Arid-upland (Zagawi) local Sudanese sheep populations showed no genetic differentiation, but the other local Sudanese sheep populations (Desert, West African-Fulani, and Fused-Garag) demonstrated moderate genetic differentiation.
The Sudanese West African-Fulani, Fused-Garag, Ethiopian, and Libyan Barbary sheep populations also revealed moderate genetic differentiation. Moreover, the two short thin-tailed local Sudanese sheep populations, West African-Fulani and Fused-Garag, indicated moderate genetic differentiation.

3.4. Principal Component Analysis

The principal component analysis, including the continental sheep populations, revealed that the 15 sheep populations are distinguished following their geographical distribution and/or origin (Sudan: 11 local sheep populations; Ethiopia: three sheep populations; Libya: one sheep population), population type, and tail morphotype (Figure 5a, Table 1). The first principal component (PC1), which accounted for 10.5% of the total variation, separates the thin-tailed local Sudanese and the fat-tailed Libyan Barbary sheep populations from the fat-tailed and fat-rumped Ethiopian sheep. The Libyan Barbary and the two short thin-tailed local Sudanese (Fused-Garag and West African-Fulani) sheep populations are separated by the second principal component (PC2), which accounted for 8.5% of the total variation, from Ethiopian and the rest of the local Sudanese sheep populations. These two local Sudanese sheep populations (Garag and Fulani) diverge from the other local Sudanese sheep populations; instead, they cluster together with the Libyan Barbary sheep. Interestingly, the continental principal component analysis separates the 11 local Sudanese sheep populations into two distinct genetic groups (Figure 5a) in contrast to the principal component analysis results in the local Sudanese sheep populations dataset, which differentiate them into three distinct genetic groups (Figure 5b). These results were well-supported by the continental admixture analysis result (Figure 6).
We conducted the principal component analysis comprising only local Sudanese sheep populations dataset (Figure 5b). The first (PC1) and the second (PC2) principal components accounted for 10% and 7.9% of the total variation, respectively. They clustered the 11 local Sudanese sheep populations into three distinct genetic groups according to their tail morphotype, geographical distribution and population type. PC1 separates the short thin-tailed West African Fulani and the short thin-tailed Fused-Garag sheep populations from the rest of the local Sudanese sheep populations. PC2 differentiates the long thin-tailed Desert (except Watish and some individuals of Ashgar) and Fulani sheep populations from the Garag sheep population.

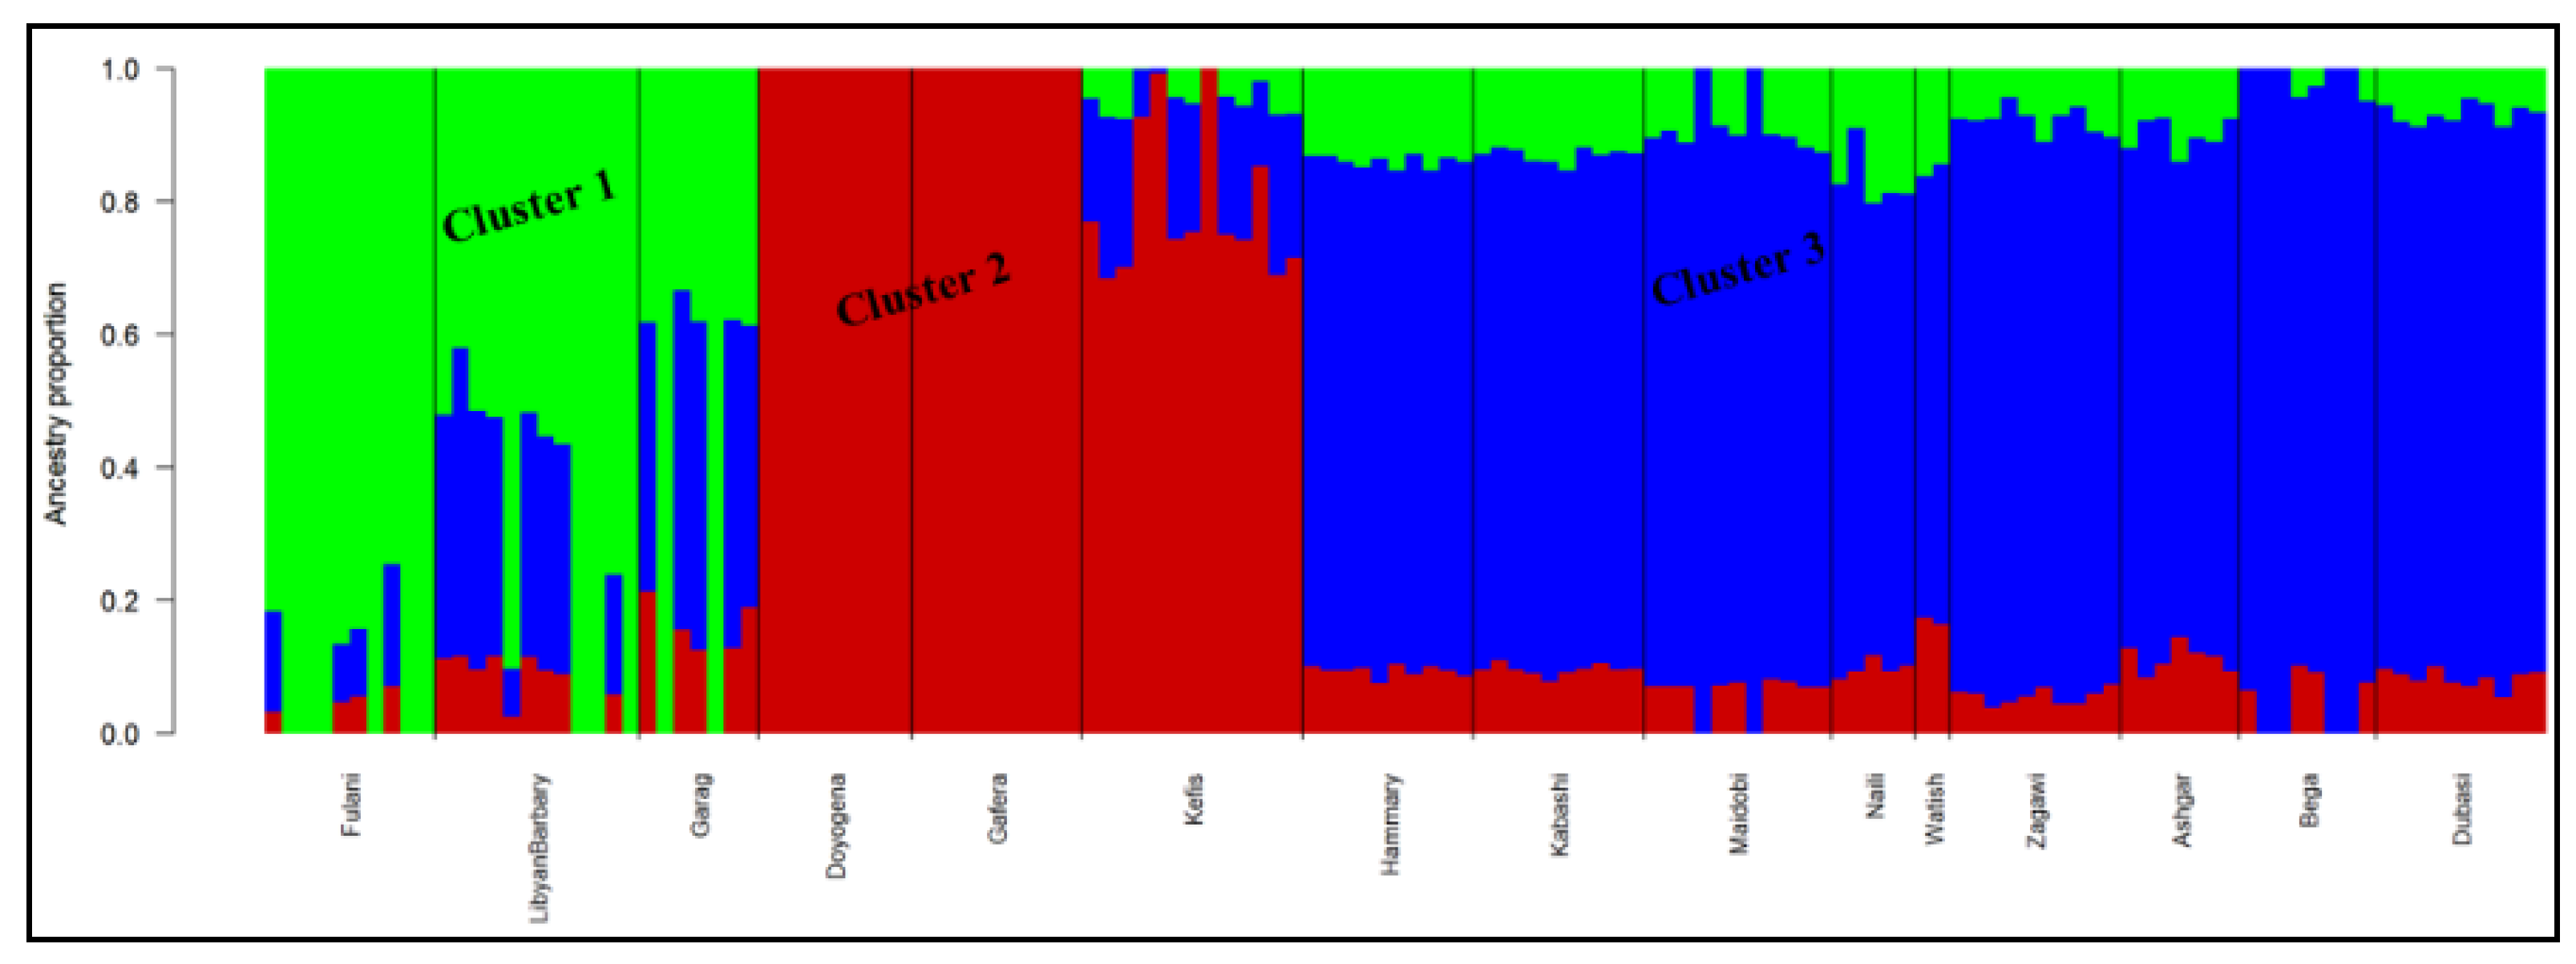
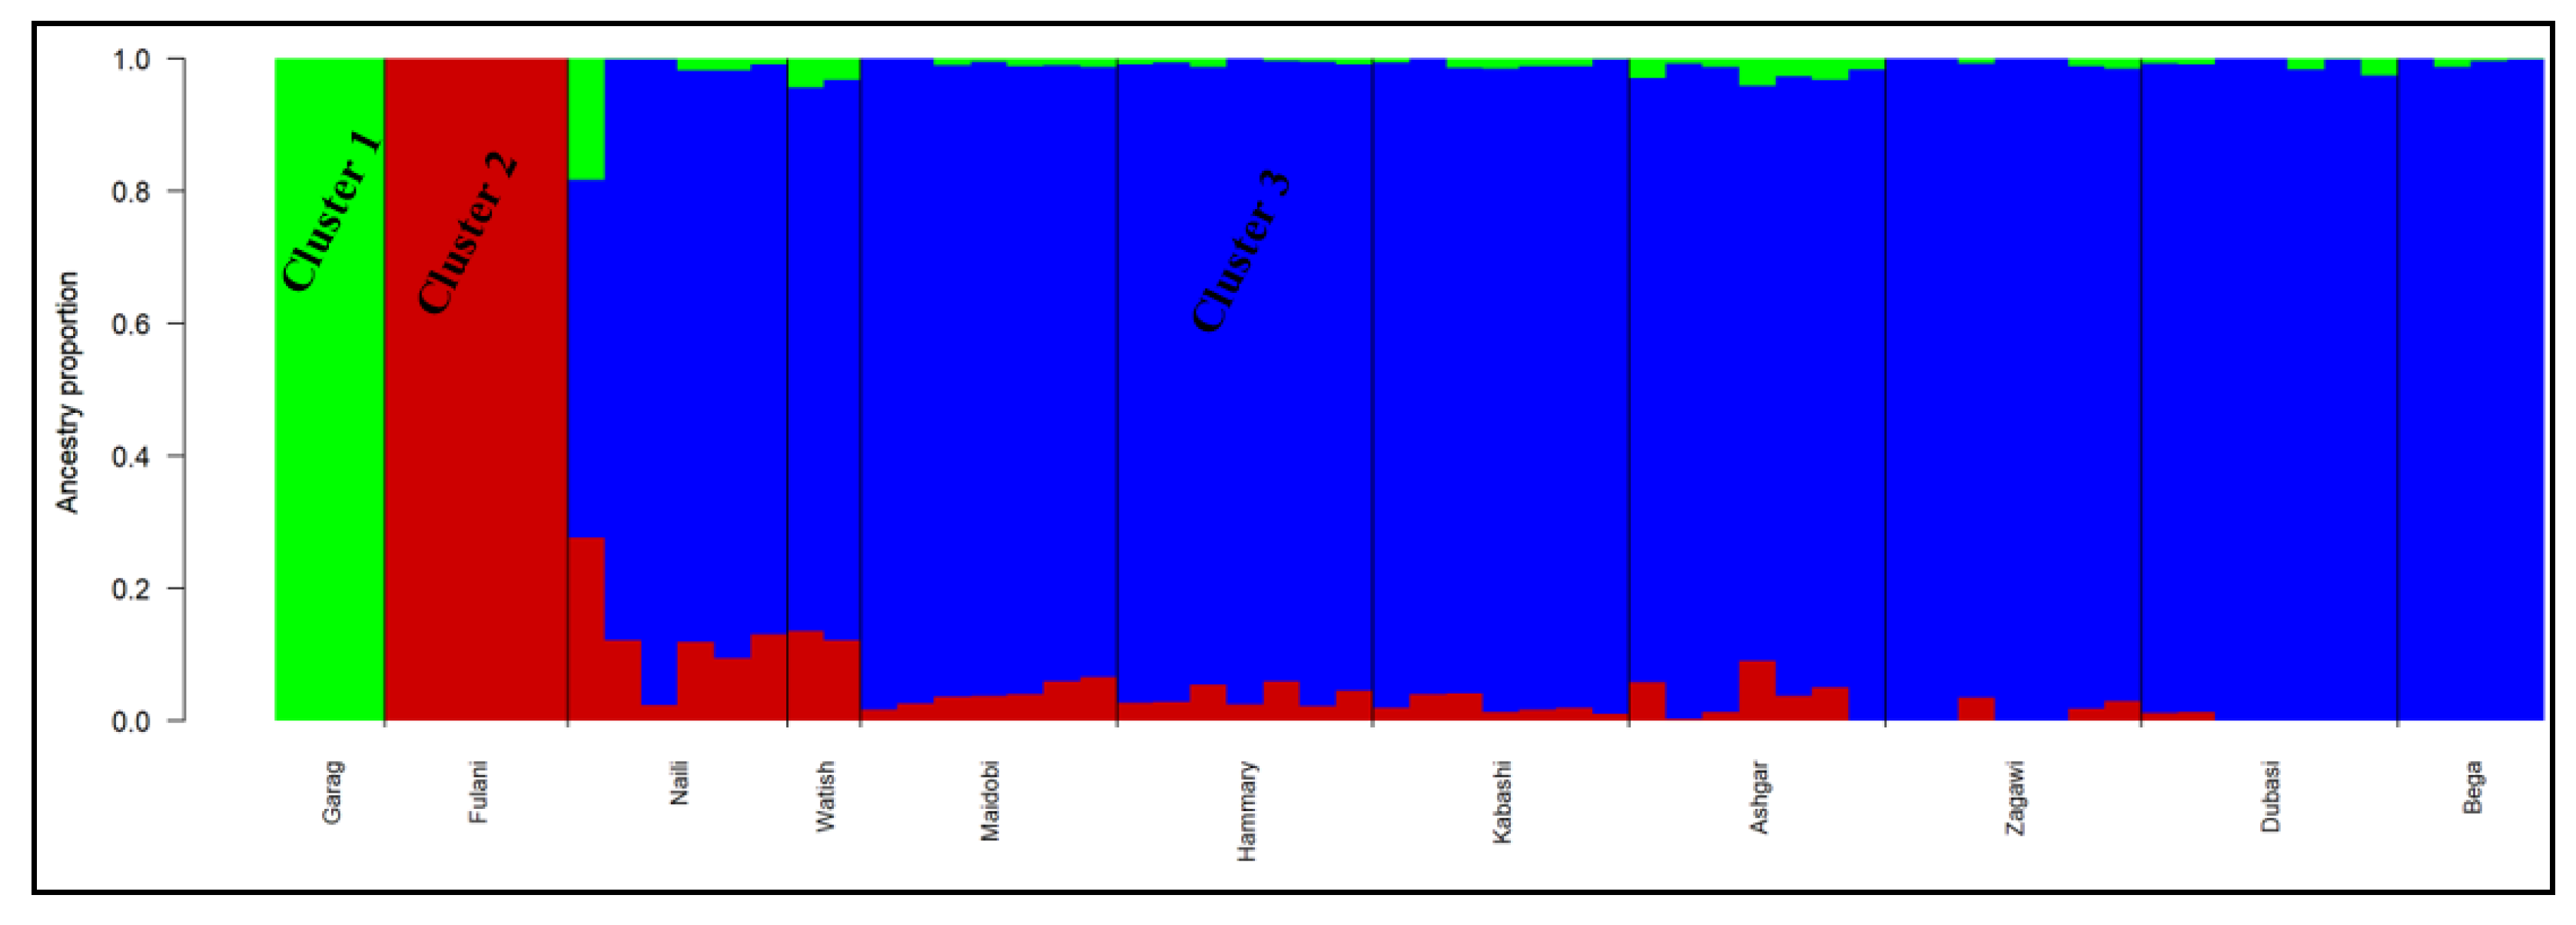
3.5. Genetic Population Structure Analysis

Admixture analysis performed using the continental dataset differentiated the studied sheep populations according to their geographic distribution and/or origin, tail morphotype, and population type (Figure 6). We used hypothetical ancestral clusters (K) ranging from 1 to 10. The lowest CV (cross-validation) error value was recorded at K = 3, indicating this to be the optimal number of ancestral clusters describing the variation (Figure 7a). The contribution of each population at K = 3 for each ancestral cluster (Cluster 1, Cluster 2, and Cluster 3) is illustrated in Figure 6, Table S4, and Figure S2. At this level, the two short thin-tailed local Sudanese (West African-Fulani and Fused-Garag) and the fat-tailed Libyan Barbary sheep populations share up to 72% of one genetic background in common (Cluster 1), with the highest proportion contributed by the Fulani sheep population (~93%, Table S4). Ethiopian sheep populations (Doyogena, Gafera, and Kefis) formed their own cluster (Cluster 2), with a relatively low ratio contributed by the fat-rumped Kefis sheep (~79%). Moreover, Kefis sheep share up to 16.4 % of their genome with local Sudanese sheep populations (Cluster 3) (Table S4).
The local Sudanese sheep population representatives except Garag and Fulani shared one genetic background (Cluster 3) with a relatively high proportion contributed by the long thin-tailed Desert Bega sheep subpopulation (~94%, Table S4). Even though some admixture is observed, the thin-tailed local Sudanese sheep populations indicated separate clustering from the other East Africa (Ethiopia: fat-tailed and fat-rumped) and North Africa (Libya: fat-tailed) sheep. Moreover, the fat-tailed Libyan Barbary (LB) sheep shared 69% of its genome with the two short thin-tailed local Sudanese (Garag and Fulani) sheep populations (Table S4 and Figure S2). Admixture analysis in the continental dataset showed two autosomal genetic backgrounds in the 11 local Sudanese sheep populations (Figure 6: Cluster 1 except LB sheep, Cluster 3), which was well supported by the continental principal component analysis result (Figure 5a).
We performed admixture analysis involving the local Sudanese sheep populations dataset using hypothetical ancestral clusters (K) from one to 10 (Figure 8). The lowest CV error value reported at K = 3, indicating this to be the optimal number of groups illustrating the variation in the dataset (Figure 7b). The contribution of each population at K = 3 for each genetic background is indicated in Figure 8, Table S5, and Figure S3. At this level, the short thin-tailed Fused-Garag sheep population (with the highest proportion, ~99%) and a few individuals of the long thin-tailed (Naili, Watish, and Ashgar) local Sudanese sheep populations formed one cluster group (Cluster 1). Cluster 2 was observed in the other short thin-tailed West African-Fulani (with the highest proportion, ~100%) sheep population and some individuals of Reverin-Naili (12.7%) and the Desert-Watish (12.8%) local Sudanese sheep populations. The rest of the local Sudanese sheep populations formed Cluster 3 with a relatively low proportion of Naili and Watish sheep populations (~83% each, Table S5 and Figure S3). All the long thin-tailed local Sudanese sheep populations, except Garag and Fulani, showed close clustering. The two short thin-tailed local Sudanese sheep populations, Garag and Fulani, did not designate one genetic group; instead, they formed two distinct genetic groups (Cluster 1 and 2, Figure 8). Admixture analysis in the local Sudanese sheep populations dataset showed three autosomal genetic backgrounds (Figure 8: Cluster 1, 2, 3), which was well supported by the principal component analysis results in the local Sudanese sheep populations dataset (Figure 5b).
We also confirmed the present principal component and admixture analysis findings by comparing pairwise FST values estimated between the studied sheep populations (Table 2).

4. Discussion

4.1. Variant Detection and Annotation

The difference in variant (SNP) numbers observed among the studied sheep populations may be due to differences in sample numbers and depth of genome coverage. The largest number of SNPs was detected in Ethiopian Kefis (29.8 million) and Libyan Barbary (28.9 million) sheep, represented by 13 and 12 samples, respectively. In contrast, we found the lowest number of SNPs (21.5 million) in the Watish sheep population, represented by only two individuals (Figure 2). The reduced number of variants in local Sudanese (an average of 25.2 million SNPs) sheep populations compared to Ethiopian and Libyan Barbary sheep is possibly a consequence of their lower genome coverage, ~11.1 × against ~54 × coverage [30]. Validation of 93.34% of the total SNPs detected in the sheep dbSNP database, Het/Hom (observed ratios of heterozygous SNPs to homozygous non-reference SNPs), and Ti/Tv (transition to transversion ratio) indicate the high reliability of our annotation in the present study [31]. This finding also suggests the remaining 6.66% of the total SNPs detected, not present in the SNP database, may be novel (Figure 2, Table S1).
The SNP annotation analysis result indicated that the SNP annotation results or ratios (Figure 3, Table S2, Figure S1) are consistent with a previous study on Chinese native sheep [17].

4.2. Genetic Diversity, Population Divergence and Relationships

The higher observed within-population genetic diversity in terms of nucleotide diversity and expected heterozygosity is also reflected by the lower value of inbreeding coefficient in Libyan Barbary (LB) sheep than in the rest of the studied sheep populations (Figure 3 and Table S3). This could be due to the presence of low selection pressure in LB sheep, and the management system in which the animals are raised, as these animals are grown under a nomadic system where there is free movement of the animal. This provides a greater chance to mate with other unrelated sheep breeds, resulting in increased heterozygosity. Moreover, a high level of genetic variation combined with reduced inbreeding values observed in LB sheep is consistent with the random mating system applied by their local owners [32]. By comparison, the lower within-population genetic variation observed in the two local Sudanese sheep populations, Reverin-Naili and Fused-Garag, than that in the rest of the studied sheep populations, may be associated with the management system where the animals are maintained, as these sheep populations are mainly raised in a confined environment (kept in houses and villages). This may lead to a decrease in the possibility of natural mating between unrelated flocks, resulting in a reduction in heterozygosity, and also increasing the opportunity for the inbreeding [1].
A low level of genetic variation and high inbreeding values observed in local Sudanese sheep populations compared to LB and Ethiopian sheep may indicate the presence of uncontrolled mating practices or possibly past bottlenecks in the local Sudanese sheep populations, which will increase the opportunity for inbreeding. Among the local Sudanese sheep populations, we observed a higher level of within-population genetic diversity in the two Desert sheep subpopulations, Hammari and Kabbashi, which could be associated with the management system used, in which the animals are raised by nomadic tribes in the same region as they are owned. This allows free movement of the animals to search for food and water and increase the chance of natural mating between unrelated flocks, thus increasing heterozygosity and reducing the opportunity for the inbreeding [1]. Furthermore, they inhabit the north-west and the central area and move through the Kordufan region from the north (habitat of other Desert subpopulations) to the south (habitat of Nilo-desert subpopulations), providing the greatest opportunity of contact in the region with other sheep populations not related to them. This results in increased heterozygosity [1], which enabled us to examine how the nomadic system affects the livestock biodiversity. We could also examine its role in mobile flocks, such as sheep in the desert region of Sudan with higher levels of heterozygosity, compared to Naili and Garag sheep populations with relatively lower levels of heterozygosity maintained and grown in villages and farm households in Sudan.
The results indicated that the calculated local Sudanese sheep populations’ genetic diversity is lower than the values reported (0.577–0.768) in previous studies for other local Sudanese sheep using microsatellite markers [1] and the values reported using microsatellite and SNP markers for Ethiopian sheep [11,12,20,33].
The presumed ancestral sheep in the Middle East (Afshari; HE = 0.376) and North Africa (HE = 0.401) showed higher levels of genetic diversity than local Sudanese sheep populations (HE = 0.298). Sheep located close to domestication centers are predicted to possess higher allelic diversity than those located far away [34]. The higher diversity estimates in the North African sheep, Libyan Barbary, compared to local Sudanese sheep populations, can also be defined by the Libyan Barbary sheep’s high admixture level, as illustrated in the admixture result (Figure 6, Table S4, Figure S2), between the pendulous fat-tailed Libyan Barbary sheep and thin-tailed local Sudanese sheep populations at the West and north-west borders of Sudan and South Libya.
From a continental perspective, the lowest pairwise genetic differentiation (FST estimates) observed between Kabbashi and Ashgar sheep populations (Table 2) could be because they are defined by the same tail morphotype (long thin tail). Furthermore, the Kabbashi sheep population with a light-brown coat color is designated locally as “Ashgar” [35], which indicates that the two subpopulations are raised by the same tribal subtype. This may serve as a barricade to the gene flow that shapes population substructure [36]. The opportunities for animal interchange are more prominent within the same tribal subtypes than between two different subtypes [37]. By comparison, the highest pairwise genetic differentiation observed between the short thin-tailed local Sudanese Garag and the fat-tailed Ethiopian Gafera sheep populations could be associated with a difference in tail morphotype (thin-tail vs. fat-tail), geographical distribution and/or origin (Sudan vs. Ethiopia), and environmental adaptation, and, hence, the different selective pressures encountered, which shape their genomes in a different way.
From the local Sudanese sheep populations dataset perspective, the highest genetic differentiation observed between the long thin-tailed Desert-Bega and the short thin-tailed West African-Fulani local Sudanese sheep populations may be associated with variations in environmental adaptation, geographic distribution, tail morphotype (long thin-tail vs. short thin-tail), and population type (Desert vs. West African) [38]. By comparison, the lowest genetic differentiation (FST estimates: 0.012) observed among the six subpopulations of the Desert sheep population may be associated with the similarity in tail morphotype (they are thin-tailed) and the subtype of tribe keeping the animal (nomadic tribe), which may function as barriers to the gene flow that shapes population substructure [36].
The distant association (high FST estimates) observed among local Sudanese, Ethiopian, and Libyan Barbary sheep populations could be due to differences in tail morphotype, eco-climates, geographical distribution and/or origin, and differences in population type, which may have shaped their genome differently. The continental principal component and admixture analysis results well demonstrated the findings (Figure 5a and Figure 6, respectively).
The results on the genetic differentiation among local Sudanese sheep populations indicated that the estimated overall FST value was lower than the FST value reported for Ethiopian sheep (0.046) using microsatellite markers [37], but comparable to the values documented for Moroccan sheep (3.64%) using microsatellite markers [39] and agreeing with previous studies on local Sudanese sheep using microsatellites [1].

4.3. Genetic Population Structure

A separate cluster of the two short thin-tailed Garag and Fulani local Sudanese sheep populations, as presented in the local Sudanese sheep populations PCA and admixture analyses results (Figure 5b and Figure 8), is consistent with differences in population (Fused vs. West African), population type (Fused vs. basic), geographical isolation, tribal subtype, and adaptation to different climatic conditions, and hence different selective pressures encountered, which shape their genomes in a different manner. Moreover, variation in an environmental adaptation that restricts gene flow may affect the genetic sub-grouping [36,37]. The finding was well supported by the pairwise (FST estimate) genetic differentiation analysis result (Table 2). By comparison, as presented in the continental PCA and admixture analysis results (Figure 5a and Figure 6, respectively), the close clustering of the two short thin-tailed local Sudanese sheep populations (Garag and Fulani) is in line with similarity in tail morphotype (both are short thin-tailed).
The close association of the three local Sudanese sheep populations (Desert, Reverin, and Arid-upland) indicates the presence of clear current intermixes. By comparison, the sub-grouping of local Sudanese sheep populations into Desert (comprising seven subpopulations), Fused (Garag), and West African (Fulani) subpopulations is consistent with the difference in management system, nomadic routs, tail morphotype, and population type, in addition to adaptation to different climatic conditions that restrict gene flow, which may have shaped the genetic sub-grouping [36,37]. The finding was also well supported by the pairwise (FST estimate) genetic differentiation analysis result (Table 2). The mixed genetic background formed by local Sudanese sheep populations (Cluster 3: Figure 8, Table S5, Figure S3) showed incomplete demarcation with the rest of the studied sheep populations.
The finding of the separate grouping of the thin-tailed local Sudanese sheep populations (Cluster 3) from the other East Africa (Ethiopia) and North Africa (Libya) fat-tailed sheep (Figure 5a and Figure 6) supports the independent introduction of the fat-tailed and thin-tailed African sheep into the continent and their subsequent distribution histories. Archaeological and molecular genetic information indicate different entrances and dispersal chronologies for the fat-tailed and thin-tailed African sheep [39]. The results obtained were also well supported by reports that sheep populations of Africa, with various tail-morphotypes and geographic roots, showed vast gene flow between them [12,20,33], which suggests, most probably, the present intermixing of sheep following human socio-economic and cultural interchanges. Moreover, the findings agree with anthropological and archaeological evidence suggesting the first entrance of thin-tailed sheep into the continent, followed by fat-tailed sheep [40,41]. The findings agree with an earlier report on sheep genetic resources of Africa being grouped into two main categories, sheep having thin tails and fat tails (including fat-rumped) [42,43], The results also agree with the separate chronologies and geographic distributions of African fat-tailed and fat-rumped sheep, and thin-tailed sheep [44,45]. Moreover, the molecular analyses revealed the different evolutionary history of the African fat- and thin-tailed sheep [46].
The close association of the fat-tailed North African Libyan Barbary sheep (which shared up to 69% of its genome) with the two short thin-tailed local Sudanese Fused-Garag and West African-Fulani sheep populations, and the sharing of up to 24% of its genome with the rest of the local Sudanese sheep populations, may indicate the presence of intermixing or gene flow between sheep populations of the two countries at the border (the southern region of Libya and the north-west border of Sudan). This was well demonstrated by continental admixture analysis results (Figure 6, Table S4, Figure S2), which indicated the formation of one mixed cluster (Cluster 1) with incomplete demarcation between them. The possible cause of such intermixing is the exchange of livestock between nomadic Arabs in the southern region of Libya with the Fulani tribes on the north-west border of Sudan [32]. Furthermore, the short thin-tailed Fused-Garag sheep population is widely spread over the transition belt between North and South Sudan. Another possible reason could be the loss in the monetary value of animal fat in recent decades due to the increased demand for products having less animal fat to avoid health risks [47,48], which has led to Libyan sheep farmers randomly crossing their fat-tailed sheep with thin-tailed types. This random crossing may erode the Barbary gene pool, which represents around 95% of Libya’s sheep population [49].
A separate clustering of the fat-tailed Libyan Barbary and Ethiopian sheep (Figure 5a and Figure 6) coincides with proof that the fat-tailed sheep entered the continent through the Horn of Africa and north-east Africa [43].
The genome sharing of the fat-rumped Ethiopian Kefis sheep, by up to 16% with the thin-tailed local Sudanese sheep populations (Cluster 3), reveals the existence of an admixture between sheep populations of the two countries at the border (West Ethiopia and South Sudan).

5. Conclusions

Whole-genome sequence data analyses of 11 local Sudanese sheep populations demonstrated the presence of an admixture among the studied sheep populations. This may be due to recent admixture levels, resulting in a low variation among them. The principal component (PCA) and admixture analyses in the local Sudanese sheep populations dataset revealed three distinct autosomal genomic backgrounds (Clusters 1, 2, and 3) clustered based on their tail morphotype, geographical distribution, and population type. In contrast, continental PCA and admixture analyses of the 11 local Sudanese sheep populations revealed two distinct autosomal genomic backgrounds (Clusters 1 and 3). Moreover, the PCA and admixture analyses in the continental dataset suggest independent introduction to the continent and subsequent dispersal chronologies of the African sheep having thin and fat tails. The findings support the evidence that fat-tailed sheep entered the continent in two separate ways: East of Africa, via the strait of Bab-el-Mandeb, and North Africa, via the Isthmus of Suez from the Middle East [43]. Moreover, the genome sharing observed between the thin-tailed local Sudanese and the fat-tailed North African Libyan Barbary sheep populations supports a shared route of introduction through the north-west of the continent. Similarly, the genome sharing observed between the thin-tailed local Sudanese and the fat-rumped Ethiopian Kefis sheep populations indicates the gene flow between the two sheep populations at the border (West Ethiopia and South Sudan). The genome analysis studies, including local Sudanese thin-tailed, Ethiopian fat-tailed and fat-rumped, and Libyan Barbary fat-tailed sheep populations, provide a more comprehensive view of the genome diversity of African sheep at the continental level.

Supplementary Materials

The following supporting information can be downloaded at: https://www.mdpi.com/article/10.3390/d14110895/s1, Figure S1: Dispersal of SNPs following annotation classifications (15 sheep populations); Figure S2: The contribution of each 15 sheep populations for the respective gene pool in the continental dataset; Figure S3: The contribution of each 11 sheep populations for the respective gene pool in the local Sudanese sheep populations dataset; Table S1: SNP statistics for each sheep population analyzed (134 sheep samples); Table S2: SNP annotation of the 44,798,565 unique variants (15 sheep populations); Table S3: Genetic diversity parameters estimates for each of the 15 sheep populations analyzed; Table S4: Proportions of the genetic admixture backgrounds in each 15 sheep population (%); Table S5: Proportions of the genetic admixture backgrounds in each 11 sheep population (%).

Author Contributions

Conceptualization, A.A., H.H.M. and O.H.; methodology, H.H.M., A.A., O.H. and G.B.; software, A.A., A.T., O.H. and G.B.; validation, A.A., H.H.M., O.H., G.B. and T.D.; formal analysis, A.A. and A.T.; investigation, A.A.; resources, H.H.M.; data curation, A.A. and H.H.M.; writing—original draft preparation, A.A.; writing—review and editing, A.A., H.H.M. and G.B.; visualization, A.A.; supervision, O.H. and G.B.; project administration, H.H.M.; funding acquisition, H.H.M. and O.H. All authors have read and agreed to the published version of the manuscript.

Funding

This work is part of the project “agricultural growth, capacity building for scientific preservation of livestock breeds in Sudan”. The project was supported by a Korea-Africa Economic Cooperation Trust Fund grant through the African Development Bank (Grant No: KOAFEC-TF-2013). The project support sample collection, DNA extraction and genome sequencing.

Institutional Review Board Statement

The blood sample of the studied local Sudanese sheep populations were collected as per the ethical rules and regulation of Darfur University college, Sudan.

Informed Consent Statement

Not applicable.

Data Availability Statement

The data presented in this study are available on request from the corresponding author.

Acknowledgments

The authors would like to acknowledge the following institutions for facilitating the research. The International Livestock Research Institutes livestock genomics program, supported by the CGIAR Research Program on Livestock (CRP livestock project) sponsored by the CGIAR funding contributors to the Trust Fund (http://www.cgiar.org/about-us/our-funders/), partly by Bill and Melinda get Foundation and UK aid from UK Foreign, Commonwealth and Development Office (Grant Agreement OPP1127286) under the auspices of the Centre for Tropical Livestock Genetics and Health (CTLGH), established jointly by the University of Edinburgh, SR UC (Scotland’s Rural College). The Ministry of Finance and National Economics, Sudan, and the African Development Bank, country office (Khartoum, Sudan) for supporting the project’s approval and implementation.

Conflicts of Interest

All authors declare no conflict of interest.

References

  1. Gornas, N.; Weimann, C.; El Hussien, A.; Erhardt, G. Genetic characterization of local Sudanese sheep breeds using DNA markers. Small Rumin. Res. 2011, 95, 7–33. [Google Scholar] [CrossRef]
  2. FAO. FAO Stat Data; Food and Agriculture Organization: Rome, Italy, 2018. [Google Scholar]
  3. Central Bank of Sudan. Annual Report. Khartoum, Sudan. 2009. Available online: https://cbos.gov.sd/sites/default/files/annual_09_0_0.pdf (accessed on 6 September 2022).
  4. MARF. Statistical Bulletin for Animal Resources; Ministry of Animal Resources and Fisheries: Khartoum, Sudan, 2009; No. 19. [Google Scholar]
  5. Bennett, S.C.J.; John, E.R.; Hewison, J.W. Animal Husbandry, Agriculture in Sudan; Oxford University Press: London, UK, 1948; pp. 663–667. [Google Scholar]
  6. Wilson, R.T. Livestock in the Republic of the Sudan: Policies, production, problems, possibilities, Bartridge House, Umberleigh, UK. Anim. Husb. Dairy Vet. Sci. 2018, 2, 1–12. [Google Scholar] [CrossRef]
  7. Alvarez, I.; Traore, A.; Tamboura, H.H.; Kabore, A.; Royo, L.J.; Fernandez, I.; Ouedraogo-Sanou, G.; Sawadogo, L.; Goyache, F. Microsatellite analysis characterizes Burkina Faso as a genetic contact zone between Sahelian and Djallonke sheep. Anim. Biotechnol. 2009, 20, 47–57. [Google Scholar] [CrossRef]
  8. Abied, A.; Ahbara, A.M.; Berihulay, H.; Xu, L.; Islam, R.; El-Hag, F.M.; Rekik, M.; Haile, A.; Han, J.-L.; Ma, Y.; et al. Genome Divergence and Dynamics in the Thin-Tailed Desert Sheep from Sudan. Front. Genet. 2021, 12, 659507. [Google Scholar] [CrossRef]
  9. McLeroy, G.B. The sheep of the Sudan, an extensive survey and system of classification. Sudan J. Vet. Anim. Husb. 1961, 2, 19–35. [Google Scholar]
  10. Wilson, R.T.; Clarke, S.E. Studies on the livestock of Southern Darfur, Sudan. The ecology and livestock resources of the area. Trop. Anim. Health Prod. 1975, 7, 165–187. [Google Scholar]
  11. Gizaw, S.; Komen, H.; Hanotte, O.; Van Arendonk, J.A. Indigenous sheep resources of Ethiopia: Types, production systems and farmers preferences. Anim. Genet. Resour. 2008, 43, 25–39. [Google Scholar] [CrossRef]
  12. Amane, A.; Belay, G.; Nasser, Y.; Kyalo, M.; Dessie, T.; Kebede, A.; Tarekegn, G.M. Genome-wide insights of Ethiopian indigenous sheep populations reveal the population structure related to tail morphology and phylogeography. Genes Genom. 2020, 42, 1169–1178. [Google Scholar] [CrossRef]
  13. Abualazayium, M. Animal Wealth and Animal Production in Sudan, 3rd ed.; Khartoum University Press: Khartoum, Sudan, 2004; pp. 50–51. [Google Scholar]
  14. Devendra, C.; McLeroy, G. Goat and Sheep Production in the Tropics; Longman Group UK Ltd.: Essex, UK, 1982; p. 271. [Google Scholar]
  15. Tapio, I.; Tapio, M.; Grislis, Z.; Holm, L.E.; Jeppsson, S.; Kantanen, J.; Miceikiene, I.; Olsaker, I.; Viinalass, H.; Eythorsdottir, E. Unfolding of population structure in Baltic sheep breeds using microsatellite analysis. Heredity 2005, 94, 448–456. [Google Scholar] [CrossRef] [Green Version]
  16. Kardos, M.; Luikart, G.; Bunch, R.; Dewey, S.; Edwards, W.; McWilliam, S.; Kijas, J. Whole-genome resequencing uncovers molecular signatures of natural and sexual selection in wild bighorn sheep. Mol. Ecol. 2015, 24, 5616–5632. [Google Scholar] [CrossRef]
  17. Yang, J.I.; Li, W.R.; Lv, F.H.; He, S.G.; Tian, S.L.; Peng, W.F.; Liu, M.J. Whole-genome sequencing of native sheep provides insights into rapid adaptations to extreme environments. Mol. Biol. Evol. 2016, 33, 2576–2592. [Google Scholar] [CrossRef] [Green Version]
  18. Daetwyler, H.D.; Capitan, A.; Pausch, H.; Stothard, P.; Van Binsbergen, R.; Brøndum, R.F.; Hayes, B.J. Whole-genome sequencing of 234 bulls facilitates mapping of monogenic and complex traits in cattle. Nat. Genet. 2014, 46, 858–865. [Google Scholar] [CrossRef]
  19. FAO. Molecular Genetic Characterization of Animal Genetic Resources; FAO Animal Production and Health Guidelines: Rome, Italy, 2011; No. 9. [Google Scholar]
  20. Ahbara, A.; Bahbahani, H.; Almathen, F.; Al Abri, M.; Agoub, M.O.; Abeba, A.; Kebede, A.; Musa, H.H.; Mastrangelo, S.; Pilla, F.; et al. Genome-wide variation, candidate regions and genes associated with fat deposition and tail morphology in Ethiopian indigenous sheep. Front. Genet. 2019, 9, 699. [Google Scholar] [CrossRef]
  21. Li, H.; Durbin, R. Fast and accurate long-read alignment with Burrows–Wheeler transform. Bioinformatics 2010, 26, 589–595. [Google Scholar] [CrossRef] [Green Version]
  22. McLaren, W.; Gil, L.; Hunt, S.E.; Riat, H.S.; Ritchie, G.R.; Thormann, A.; Flicek, P.; Cunningham, F. The Ensembl Variant Effect Predictor. Genome Biol. 2016, 17, 122. [Google Scholar] [CrossRef] [Green Version]
  23. Purcell, S.; Neale, B.; Todd-Brown, K.; Thomas, L.; Ferreira, M.A.; Bender, D.; Sham, P.C. PLINK: A tool set for whole-genome association and population-based linkage analyses. Am. J. Hum. Genet. 2007, 81, 559–575. [Google Scholar] [CrossRef] [Green Version]
  24. Yuan, Z.; Liu, E.; Liu, Z.; Kijas, J.W.; Zhu, C.; Hu, S.; Ma, X.; Zhang, L.; Du, L.; Wang, H.; et al. Selection signature analysis reveals genes associated with tail type in Chinese indigenous sheep. Anim. Genet. 2017, 48, 55–66. [Google Scholar] [CrossRef]
  25. Danecek, P.; Auton, A.; Abecasis, G.; Albers, C.A.; Banks, E.; DePristo, M.A.; Handsaker, R.E.; Lunter, G.; Marth, G.T.; Sherry, S.T.; et al. The variant call format and VCFtools. Bioinform 2011, 27, 2156–2158. [Google Scholar] [CrossRef]
  26. Weir, B.S.; Cockerham, C.C. Estimating F-statistics for the analysis of population structure. Evolution 1984, 38, 1358–1370. [Google Scholar]
  27. Wickham, H. ggplot2: Elegant Graphics for Data Analysis (Use R!); Springer: New York, NY, USA, 2009; ISBN 0387981403. [Google Scholar]
  28. Alexander, D.H.; Novembre, J.; Lange, K. Fast model-based estimation of ancestry in unrelated individuals. Genome Res. 2009, 19, 1655–1664. [Google Scholar] [CrossRef] [Green Version]
  29. Davenport, K.M.; Hiemke, C.; McKay, S.D.; Thorne, J.W.; Lewis, R.M.; Taylor, T.; Murdoch, B.M. Genetic structure and admixture in sheep from terminal breeds in the United States. Anim. Genet. 2020, 51, 284–291. [Google Scholar] [CrossRef] [Green Version]
  30. Wiener, P.; Robert, C.; Ahbara, A.; Salavati, M.; Abebe, A.; Kebede, A.; Wragg, D.; Friedrich, J.; Vasoya, D.; Hume, D.A.; et al. Whole-Genome Sequence Data Suggest Environmental Adaptation of Ethiopian Sheep Populations. Genome Biol. Evol. 2021, 13, evab014. [Google Scholar] [CrossRef]
  31. Park, S.D.; Magee, D.A.; McGettigan, P.A.; Teasdale, M.D.; Edwards, C.J.; Lohan, A.J.; MacHugh, D.E. Genome sequencing of the extinct Eurasian wild aurochs, Bos primigenius, illuminates the phylogeography and evolution of cattle. Genome Biol. 2015, 16, 234. [Google Scholar] [CrossRef]
  32. Mufarrih, M.E. Sudan desert sheep: Their origin, ecology, and production potential. World Anim. Rev. 1991, 66, 23–31. [Google Scholar]
  33. Edea, Z.; Dadi, H.; Dessie, T.; Kim, K.S. Genomic signatures of high-altitude adaptation in Ethiopian sheep populations. Genes Genom. 2019, 41, 973–981. [Google Scholar] [CrossRef]
  34. Peter, C.; Bruford, M.; Perez, T.; Dalamitra, S.; Hewitt, G.; Erhardt, G.; Econogene Consortium. Genetic diversity and subdivision of 57 European and Middle Eastern sheep populations. Anim. Genet. 2007, 38, 37–44. [Google Scholar] [CrossRef]
  35. MARF. Estimates of Animal Populations, Annual Report. Federal Ministry of Animal Resources and Fisheries; Khartoum, Sudan, 2013; Available online: https://openjicareport.jica.go.jp/pdf/12233656_02.pdf (accessed on 6 September 2022).
  36. Madrigal, L.; Ware, B.; Miller, R.; Saenz, G.; Chavez, M.; Dykes, D. Ethnicity, gene flow, and population subdivision in Limon, Costa Rica. Am. J. Phys. Anthropol. 2001, 114, 99–108. [Google Scholar] [CrossRef]
  37. Gizaw, S.; Van Arendonk, J.A.; Komen, H.; Windig, J.; Hanotte, O. Population structure, genetic variation, and morphological diversity in indigenous sheep of Ethiopia. Anim. Genet. 2007, 38, 621–628. [Google Scholar] [CrossRef]
  38. McLeroy, G.B. The sheep of the Sudan. 2. Eco-types and tribal breeds. Sudan J. Vet. Sci. Anim. Husb. 1961, 2, 101–151. [Google Scholar]
  39. Gaouar, S.B.S.; Kdidi, S.; Ouragh, L. Estimating population structure and genetic diversity of five Moroccan sheep breeds by microsatellite markers. Small Rumin. Res. 2016, 144, 23–27. [Google Scholar] [CrossRef]
  40. Muigai, A.W.; Hanotte, O. The origin of African sheep: Archaeological and genetic perspectives. Afr. Archaeol. Rev. 2013, 30, 39–50. [Google Scholar] [CrossRef]
  41. Gifford-Gonzalez, D.; Hanotte, O. Domesticating animals in Africa: Implications of genetic and archaeological findings. J. World Prehistory 2011, 24, 1–23. [Google Scholar] [CrossRef] [Green Version]
  42. Wilson, R.T. Small ruminant production and the small ruminant genetic resource in tropical Africa. In Food and Agriculture Organization of The United Nations; Springer: Rome, Italy, 1991; ISBN 0387981403. [Google Scholar]
  43. Ryder, M.L. Sheep. In Evolution of Domesticated Animals; Mason, I.L., Ed.; Longman: New York, NY, USA, 1984; pp. 63–84. [Google Scholar]
  44. Hanotte, O.; Bradley, D.G.; Ochieng, J.W.; Verjee, Y.; Hill, E.W.; Rege, J.E.O. African pastoralism: Genetic imprints of origins and migrations. Science 2002, 296, 336–339. [Google Scholar] [CrossRef] [Green Version]
  45. Muigai, A.W.T. Characterization and Conservation of Indigenous Animal Genetic Resources: The Fat-Tailed and Thin-Tailed Sheep of Africa. Ph.D. Thesis, Jomo Kenyatta University of Agriculture and Technology, Juja, Kenya, 2003. [Google Scholar]
  46. Aswani, O.B. Genetic Diversity and Relationships of African Sheep: A Y Chromosome Perspective. Master’s Thesis, University of Egerton, Njoro, Kenya, 2007. [Google Scholar]
  47. Moradi, M.H.; Nejati-Javaremi, A.; Moradi-Shahrbabak, M.; Dodds, K.G.; McEwan, J.C. Genomic scan of selective sweeps in thin and fat tail sheep breeds for identifying of candidate regions associated with fat deposition. BMC Genet. 2012, 13, 10. [Google Scholar] [CrossRef] [Green Version]
  48. Moioli, B.; Pilla, F.; Ciani, E. Signatures of selection identify loci associated with fat tail in sheep. J. Anim. Sci. 2015, 93, 4660–4669. [Google Scholar] [CrossRef]
  49. Abdulkarim, A. Small ruminant contribution to meat production in Libya. Egypt. J. Sheep Goat Sci. 2015, 10, 13–18. [Google Scholar]
Figure 1. Sheep populations and their geographical distributions. The different colored circles represent the sampling areas for the sheep populations.
Diversity 14 00895 g001
Figure 2. SNP statistics for each sheep population analyzed (134 sheep samples). TNSNPs: Total number of SNPs per population; dbSNP: Single Nucleotide Polymorphism Database; LB: Libyan Barbary.
Diversity 14 00895 g002
Figure 3. Dispersal of SNPs following annotation classifications (15 sheep populations).
Diversity 14 00895 g003
Figure 4. Genetic diversity parameter estimates for each of the 15 sheep populations analyzed: (a) Nucleotide diversity (Pi), (b) expected heterozygosity (He); observed heterozygosity (Ho) and (c) the inbreeding coefficient (F).
Diversity 14 00895 g004
Figure 5. The principal component analysis comprises the sheep populations studied (a) in a continental and (b) local Sudanese sheep populations dataset context.
Diversity 14 00895 g005
Figure 6. Analysis of admixture in the continental dataset. The three genetic clusters are designated. (Cluster 1: Fulani, Libyan Barbary, Garag; Cluster 2: Doyogena, Gafera, Kefis; Cluster 3: Hammari, Kabbashi, Maidobe, Naili, Watish, Zagawi, Ashgar, Bega, Dubasi).
Diversity 14 00895 g006
Figure 7. The plot of cross-validation error developed for (a) continental and (b) local Sudanese sheep populations.
Diversity 14 00895 g007
Figure 8. Analysis of admixture in the local Sudanese sheep populations dataset. The three genetic clusters are designated. (Cluster 1: Garag; Cluster 2: Fulani; Cluster 3: Naili, Watish, Maidobe, Hammari, Kabbashi, Ashgar, Zagawi, Dubasi, Bega).
Diversity 14 00895 g008
Table 2. Pairwise FST (genetic differentiation) in the studied sheep populations.
PopulationAshgarBegaDubasiFulaniGaragHamaKabaMaidNailiZagawiDoyoKefisGafera
Bega0.027
Dubasi0.0040.026
Fulani0.0600.0850.063
Garag0.0520.0780.0550.081
Hama0.0020.0240.0020.0580.049
Kabba0.0010.0260.0030.0600.0510.004
Maid0.0090.0300.0090.0620.0560.0050.004
Naili0.0180.0420.0190.0700.0640.0130.0140.021
Zagawi0.0120.0330.0120.0650.0580.0050.0060.0100.024
Doyo0.0650.0910.06800.1050.1080.0600.0620.0700.0800.073
Kefis0.0520.0750.0550.0950.1010.0480.0490.0560.0650.0590.066
Gafera0.0690.0930.0700.1070.1120.0630.0630.0720.0830.0750.0420.069
LB0.0440.0670.0470.0720.0910.0390.0410.0480.0480.0500.0850.0670.082
Weir and Cockerham’s FST values between 0 and 0.05 are grouped as no differentiation, 0.06–0.15 as moderate differentiation, 0.16–0.25 as great differentiation, and >0.26 as very great differentiation [29]. Hama: Hammari; Kabba: Kabbashi; Doyo: Doyogena; Maid: Maidobe; LB: Libyan Barbary.
Publisher’s Note: MDPI stays neutral with regard to jurisdictional claims in published maps and institutional affiliations.

