
Active Sampling and Understory Traps Can Cost-Effectively Detect Changes in Butterfly Communities after Hydroelectric Dam Construction
 , and
, and
Abstract
:1. Introduction
2. Materials and Methods
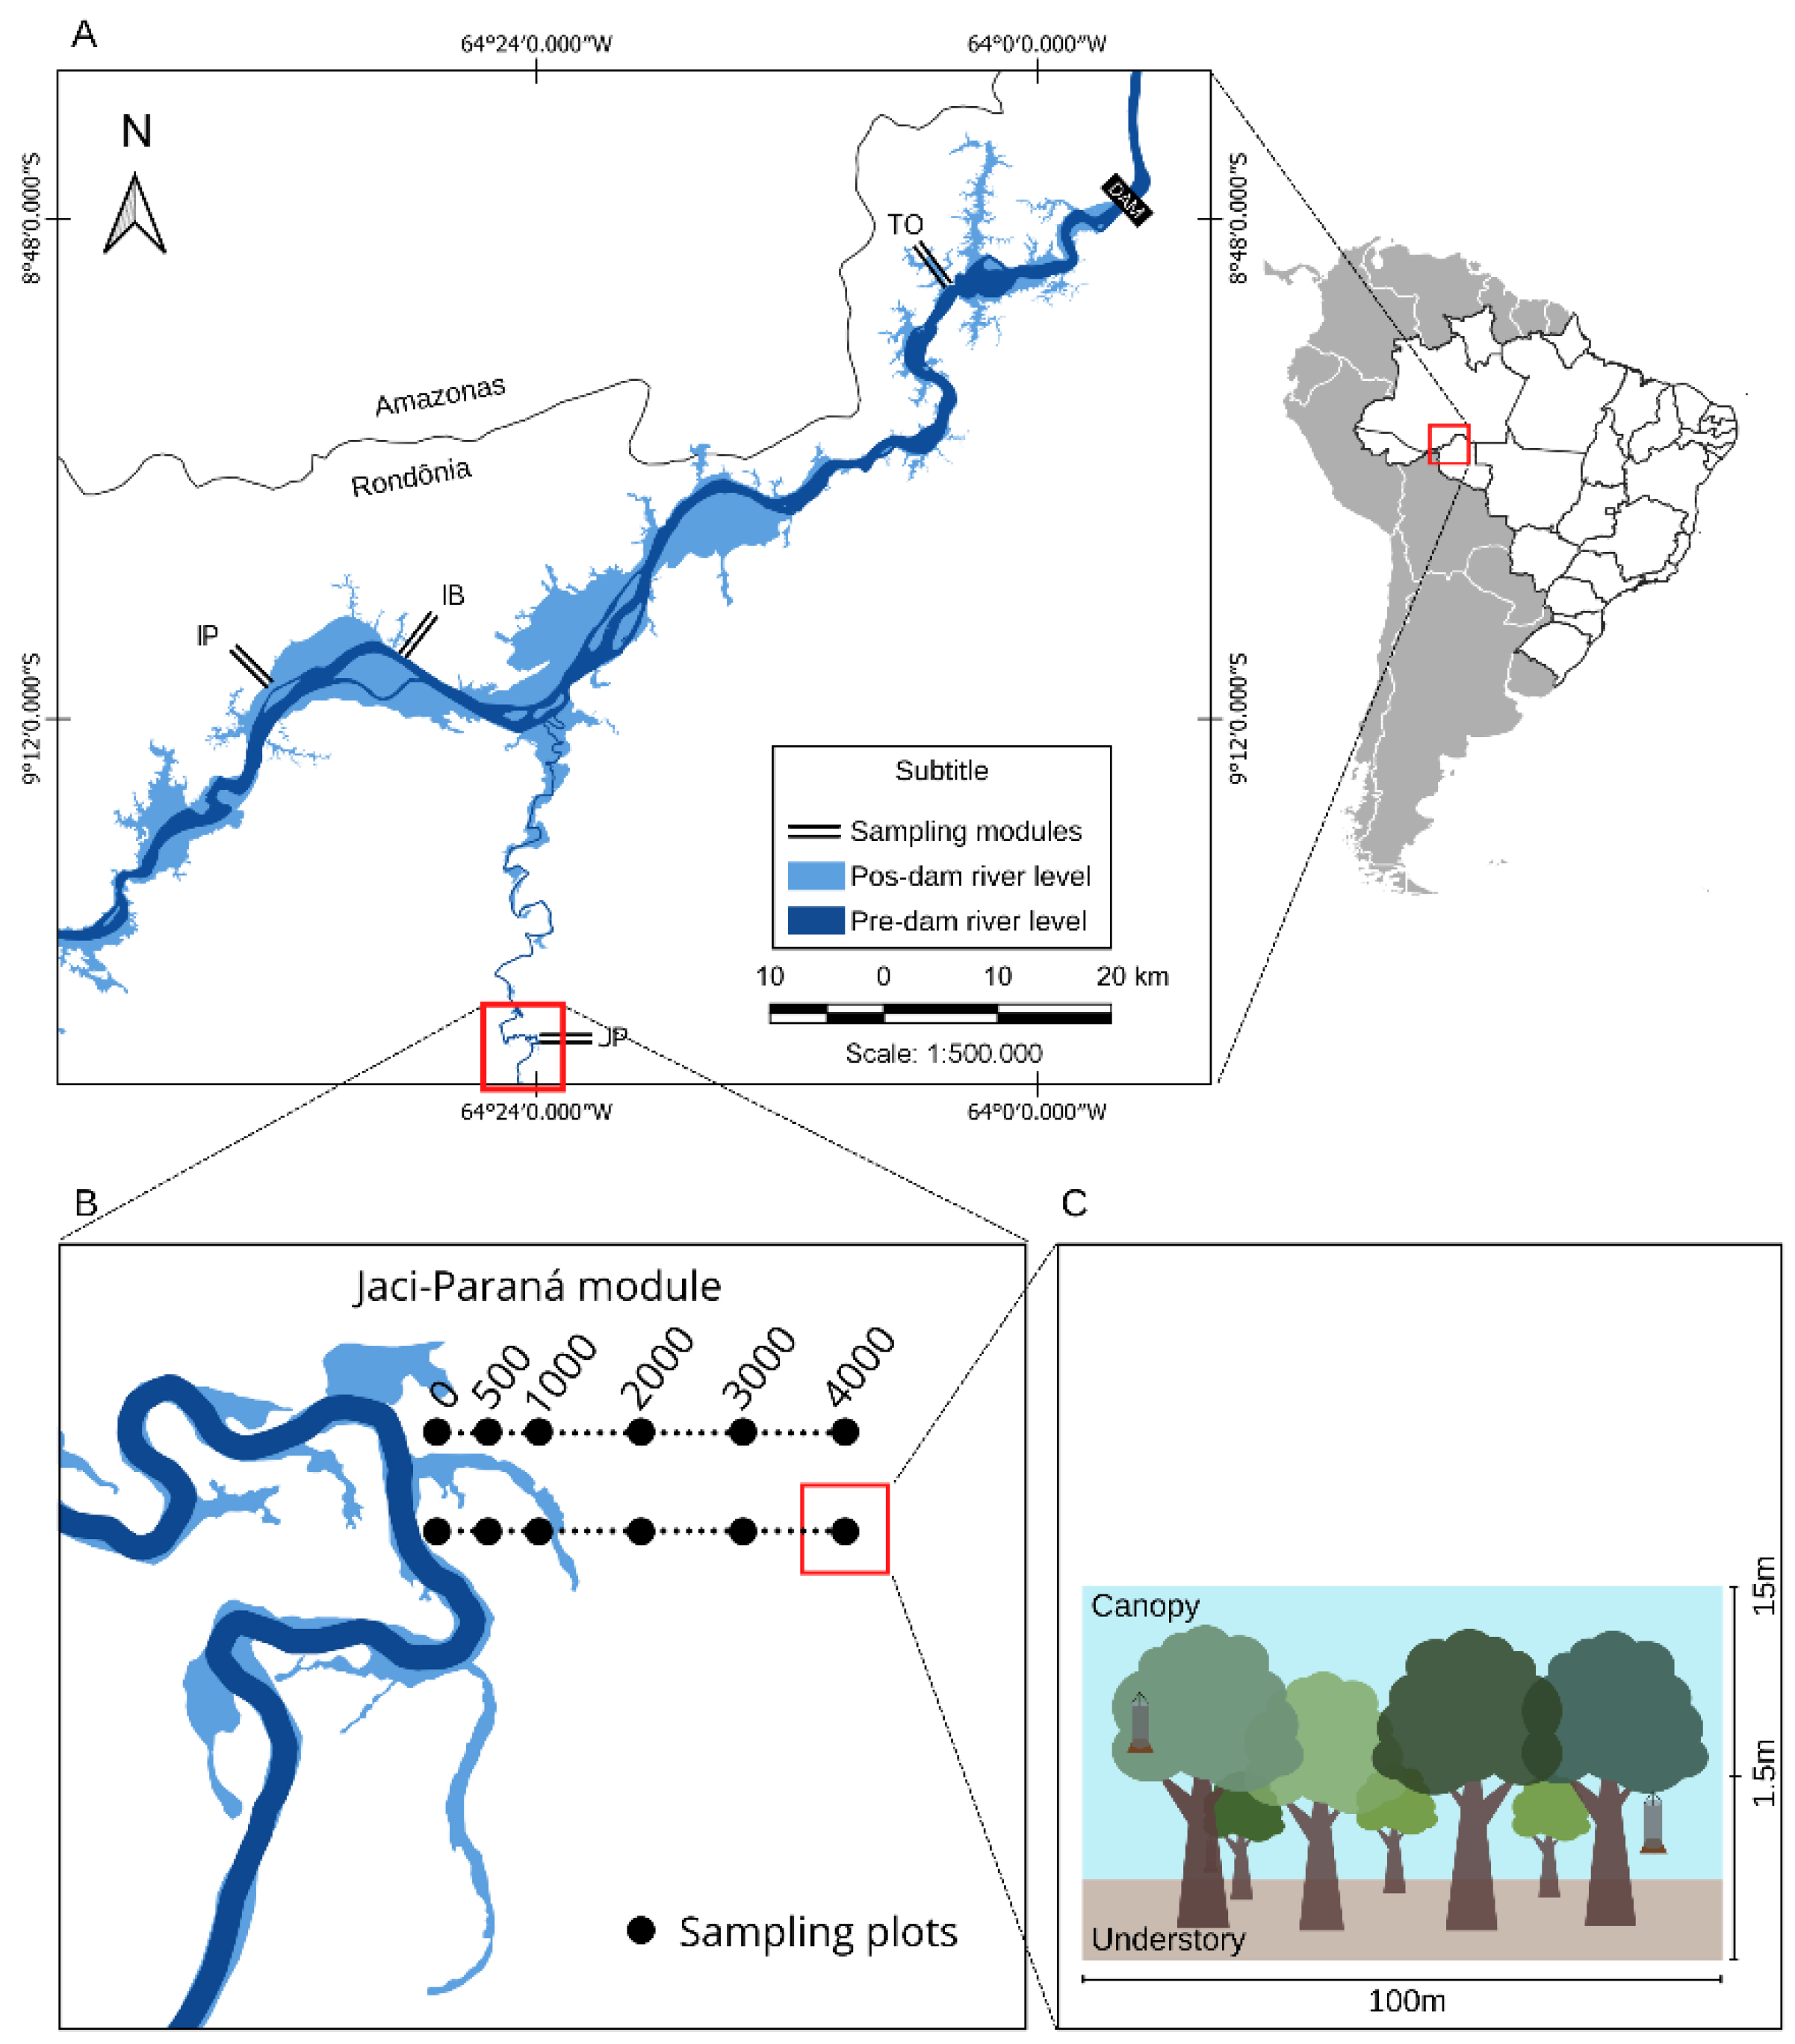
2.1. Study Site
2.2. Sampling
2.3. Passive Butterfly Sampling
2.4. Active Butterfly Sampling
2.5. Data Analysis
3. Results
4. Discussion
Supplementary Materials
Author Contributions
Funding
Data Availability Statement
Acknowledgments
Conflicts of Interest
References
- Bergmann, A.; Hanley, N.; Wright, R. Valuing the attributes of renewable energy investments. Energy Policy 2006, 34, 1004–1014. [Google Scholar] [CrossRef]
- Fearnside, P.M. Tropical hydropower in the clean development mechanism: Brazil’s Santo Antônio Dam as an example of the need for change. Clim. Chang. 2015, 131, 575–589. [Google Scholar] [CrossRef]
- Irving, G.J.; Round, P.D.; Savini, T.; Lynam, A.J.; Gale, G.A. Collapse of a tropical forest bird assemblage surrounding a hydroelectric reservoir. Glob. Ecol. Conserv. 2018, 16, e00472. [Google Scholar] [CrossRef]
- Fearnside, P. Impacts of Brazil’s Madeira River Dams: Unlearned lessons for hydroelectric development in Amazonia. Environ. Sci. Policy 2014, 38, 164–172. [Google Scholar] [CrossRef]
- Lees, A.C.; Peres, C.A.; Fearnside, P.M.; Schneider, M.; Zuanon, J.A.S. Hydropower and the future of Amazonian biodiversity. Biodivers. Conserv. 2016, 25, 451–466. [Google Scholar] [CrossRef]
- Botelho, A.; Lourenço-Gomes, L.; Pinto, L.M.; Sousa, P.; Sousa, S.; Valente, M. Using Choice Experiments to Assess Environmental Impacts of Dams in Portugal. AIMS Energy 2015, 3, 316–325. [Google Scholar] [CrossRef]
- Botelho, A.; Ferreira, P.; Lima, F.; Pinto, L.M.C.; Sousa, S. Assessment of the environmental impacts associated with hydropower. Renew. Sustain. Energy Rev. 2017, 70, 896–904. [Google Scholar] [CrossRef]
- Farias, V.G.L.; Lima, G.P.; Leite, M.J.D.H.; Cavalcante, A.T.G.; Da Silva, A.C.M.; Moura, A.C.D.A.; De Macedo, D.L.H.; Netto, J.S.D.S.; Gomes, V.C.A.; Cavalcante, R.M. Socio-environmental impacts caused by hydroelectric dams in northeastern Brazil. Braz. J. Dev. 2019, 5, 22846–22853. [Google Scholar] [CrossRef] [Green Version]
- Álvarez-Troncoso, R.; Benetti, C.J.; Sarr, A.B.; Pérez-Bilbao, A.; Garrido, J. Impacts of hydroelectric power stations on Trichoptera assemblages in four rivers in NW Spain. Limnologica 2015, 53, 35–41. [Google Scholar] [CrossRef]
- Martínez, Y.; Álvarez-Troncoso, R.; Garrido, J. Impact of small-scale hydropower stations on macroinvertebrate communities for regulated rivers. Limnetica 2020, 39, 317–334. [Google Scholar] [CrossRef]
- Sarr, M.A.B.; Benetti, C.J.; Troncoso, R.A.; Garrido, J. Environmental Drivers Shaping Beetle Assemblages in Four Rivers of NW Spain Affected by Hydroelectric Power Stations. Vie Milieu Life Environ. 2013, 63, 1–10. [Google Scholar]
- Vitule, J.R.S.; Skóra, F.; Abilhoa, V. Homogenization of freshwater fish faunas after the elimination of a natural barrier by a dam in Neotropics. Divers. Distrib. 2012, 18, 111–120. [Google Scholar] [CrossRef]
- Benchimol, M.; Peres, C. Predicting local extinctions of Amazonian vertebrates in forest islands created by a mega dam. Biol. Conserv. 2015, 187, 61–72. [Google Scholar] [CrossRef]
- Mafia, P.D.O.; De Azevedo, C.S. Avifauna of the region of the Volta Grande Hydroelectric Power Plant in Southeast Brazil. Papéis Avulsos Zool. 2020, 60, e20206016. [Google Scholar] [CrossRef]
- Storck-Tonon, D.; Peres, C.A. Forest patch isolation drives local extinctions of Amazonian orchid bees in a 26 years old archipelago. Biol. Conserv. 2017, 214, 270–277. [Google Scholar] [CrossRef]
- Dayrell, J.S.; Magnusson, W.E.; Bobrowiec, P.E.D.; Lima, A.P. Impacts of an Amazonian hydroelectric dam on frog assemblages. PLoS ONE 2021, 16, e0244580. [Google Scholar] [CrossRef]
- Moser, P.; Oliveira, W.L.; Medeiros, M.B.; Pinto, J.R.; Eisenlohr, P.V.; Lima, I.L.; Silva, G.P.; Simon, M.F. Tree Species Distribution along Environmental Gradients in an Area Affected by a Hydroelectric Dam in Southern Amazonia. Biotropica 2014, 46, 367–376. [Google Scholar] [CrossRef]
- Nilsson, C.; Berggren, K. Alterations of Riparian Ecosystems Caused by River Regulation. BioScience 2000, 50, 783–792. [Google Scholar] [CrossRef]
- Cochrane, S.M.; Matricardi, E.A.; Numata, I.; Lefebvre, P.A. Landsat-based analysis of mega dam flooding impacts in the Amazon compared to associated environmental impact assessments: Upper Madeira River example 2006–2015. Remote Sens. Appl. Soc. Environ. 2017, 7, 1–8. [Google Scholar] [CrossRef]
- Bobrowiec, P.E.D.; Tavares, V.D.C. Establishing baseline biodiversity data prior to hydroelectric dam construction to monitoring impacts to bats in the Brazilian Amazon. PLoS ONE 2017, 12, e0183036. [Google Scholar] [CrossRef] [Green Version]
- Waldron, A.; Mooers, A.O.; Miller, D.C.; Nibbelink, N.; Redding, D.; Kuhn, T.S.; Roberts, J.T.; Gittleman, J.L. Targeting global conservation funding to limit immediate biodiversity declines. Proc. Natl. Acad. Sci. USA 2013, 110, 12144–12148. [Google Scholar] [CrossRef]
- Graça, M.B.; Souza, J.L.; Franklin, E.; Morais, J.W.; Pequeno, P.A. Sampling effort and common species: Optimizing surveys of understorey fruit-feeding butterflies in the Central Amazon. Ecol. Indic. 2017, 73, 181–188. [Google Scholar] [CrossRef]
- Ribeiro, D.B.; Williams, M.R.; Specht, A.; Freitas, A.V.L. Vertical and temporal variability in the probability of detection of fruit-feeding butterflies and moths (Lepidoptera) in tropical forest. Austral Èntomol. 2016, 55, 112–120. [Google Scholar] [CrossRef]
- Di Marco, M.; Watson, J.; Venter, O.; Possingham, H. Global Biodiversity Targets Require Both Sufficiency and Efficiency. Conserv. Lett. 2016, 9, 395–397. [Google Scholar] [CrossRef]
- Gardner, T.A.; Barlow, J.; Araujo, I.S.; Ávila-Pires, T.C.; Bonaldo, A.B.; Costa, J.E.; Esposito, M.C.; Ferreira, L.V.; Hawes, J.; Hernandez, M.I.M.; et al. The cost-effectiveness of biodiversity surveys in tropical forests. Ecol. Lett. 2008, 11, 139–150. [Google Scholar] [CrossRef]
- Brito, M.M.; Ribeiro, D.; Raniero, M.; Hasui, E.; Ramos, F.N.; Arab, A. Functional composition and phenology of fruit-feeding butterflies in a fragmented landscape: Variation of seasonality between habitat specialists. J. Insect Conserv. 2014, 18, 547–560. [Google Scholar] [CrossRef]
- Fordyce, J.A.; DeVries, P.J. A tale of two communities: Neotropical butterfly assemblages show higher beta diversity in the canopy compared to the understory. Oecologia 2016, 181, 235–243. [Google Scholar] [CrossRef]
- Sant’Anna, C.L.B.; Ribeiro, D.B.; Garcia, L.C.; Freitas, A.V.L. Fruit-feeding Butterfly Communities are Influenced by Restoration Age in Tropical Forests. Restor. Ecol. 2014, 22, 480–485. [Google Scholar] [CrossRef]
- Ribeiro, D.B.; Freitas, A.V.L. The effect of reduced-impact logging on fruit-feeding butterflies in Central Amazon, Brazil. J. Insect Conserv. 2012, 16, 733–744. [Google Scholar] [CrossRef]
- de Andrade, R.B.; Balch, J.K.; Carreira, J.Y.O.; Brando, P.M.; Freitas, A.V.L. The impacts of recurrent fires on diversity of fruit-feeding butterflies in a south-eastern Amazon forest. J. Trop. Ecol. 2017, 33, 22–32. [Google Scholar] [CrossRef]
- Barlow, J.; Overal, W.L.; Araujo, I.S.; Gardner, T.A.; Peres, C.A. The value of primary, secondary and plantation forests for fruit-feeding butterflies in the Brazilian Amazon. J. Appl. Ecol. 2007, 44, 1001–1012. [Google Scholar] [CrossRef]
- Freitas, A.V.L.; Iserhard, C.A.; Santos, J.P.; Yasmin, J.; Carreira, O.; Ribeiro, D.B.; Henrique, D.; Melo, A.; Henrique, A.; Rosa, B.; et al. Studies with Butterfly Bait Traps: An Overview. Rev. Colomb. Entomol. 2014, 40, 209–218. [Google Scholar]
- Araujo, P.F.; Freitas, A.V.L.; Gonçalves, G.A.D.S.; Ribeiro, D.B. Vertical stratification on a small scale: The distribution of fruit-feeding butterflies in a semi-deciduous Atlantic forest in Brazil. Stud. Neotrop. Fauna Environ. 2020, 56, 10–39. [Google Scholar] [CrossRef]
- Filgueiras, B.K.C.; Melo, D.H.A.; Leal, I.R.; Tabarelli, M.; Freitas, A.V.L.; Iannuzzi, L. Fruit-feeding butterflies in edge-dominated habitats: Community structure, species persistence and cascade effect. J. Insect Conserv. 2016, 20, 539–548. [Google Scholar] [CrossRef]
- Latrubesse, E.M.; Arima, E.Y.; Dunne, T.; Park, E.; Baker, V.R.; D’Horta, F.M.; Wight, C.; Wittmann, F.; Zuanon, J.; Baker, P.A.; et al. Damming the rivers of the Amazon basin. Nature 2017, 546, 363–369. [Google Scholar] [CrossRef] [Green Version]
- Rodrigues dos Santos, E.; Michalski, F.; Norris, D. Understanding Hydropower Impacts on Amazonian Wildlife is Limited by a Lack of Robust Evidence: Results From a Systematic Review. Trop. Conserv. Sci. 2021, 14, 19400829211045788. [Google Scholar] [CrossRef]
- Adamy, A. Dinâmica Fluvial Do Rio Madeira. In Porto Velho: Cultura, Natureza e Territorio; Silva, R., Ed.; EDUFRO: Porto Velho, Brazil, 2016; pp. 120–147. [Google Scholar]
- Magnusson, W. Integrado Biodiversity and Integrated Environmental Monitoring; Áttema Editorial: Manaus, Brazil, 2013; ISBN 9788565551045. [Google Scholar]
- Caldas, A.; Robbins, R.K. Modified Pollard transects for assessing tropical butterfly abundance and diversity. Biol. Conserv. 2003, 110, 211–219. [Google Scholar] [CrossRef]
- Chao, A.; Gotelli, N.J.; Hsieh, T.C.; Sander, E.L.; Ma, K.H.; Colwell, R.K.; Ellison, A.M. Rarefaction and extrapolation with Hill numbers: A framework for sampling and estimation in species diversity studies. Ecol. Monogr. 2014, 84, 45–67. [Google Scholar] [CrossRef] [Green Version]
- Hsieh, T.C.; Ma, K.H.; Chao, A. iNEXT: An R package for rarefaction and extrapolation of species diversity (Hill numbers). Methods Ecol. Evol. 2016, 7, 1451–1456. [Google Scholar] [CrossRef]
- Wang, Y.; Naumann, U.; Wright, S.; Warton, D.I. Mvabund—An R package for model-based analysis of multivariate abundance data. Methods Ecol. Evol. 2012, 3, 471–474. [Google Scholar] [CrossRef]
- Warton, D.I.; Wright, S.T.; Wang, Y. Distance-based multivariate analyses confound location and dispersion effects. Methods Ecol. Evol. 2012, 3, 89–101. [Google Scholar] [CrossRef]
- Popovic, G.C.; Hui, F.K.C.; Warton, D.I. Fast model-based ordination with copulas. Methods Ecol. Evol. 2021, 13, 194–202. [Google Scholar] [CrossRef]
- Peres-Neto, P.R.; Jackson, D.A. How well do multivariate data sets match? The advantages of a Procrustean superimposition approach over the Mantel test. Oecologia 2001, 129, 169–178. [Google Scholar] [CrossRef]
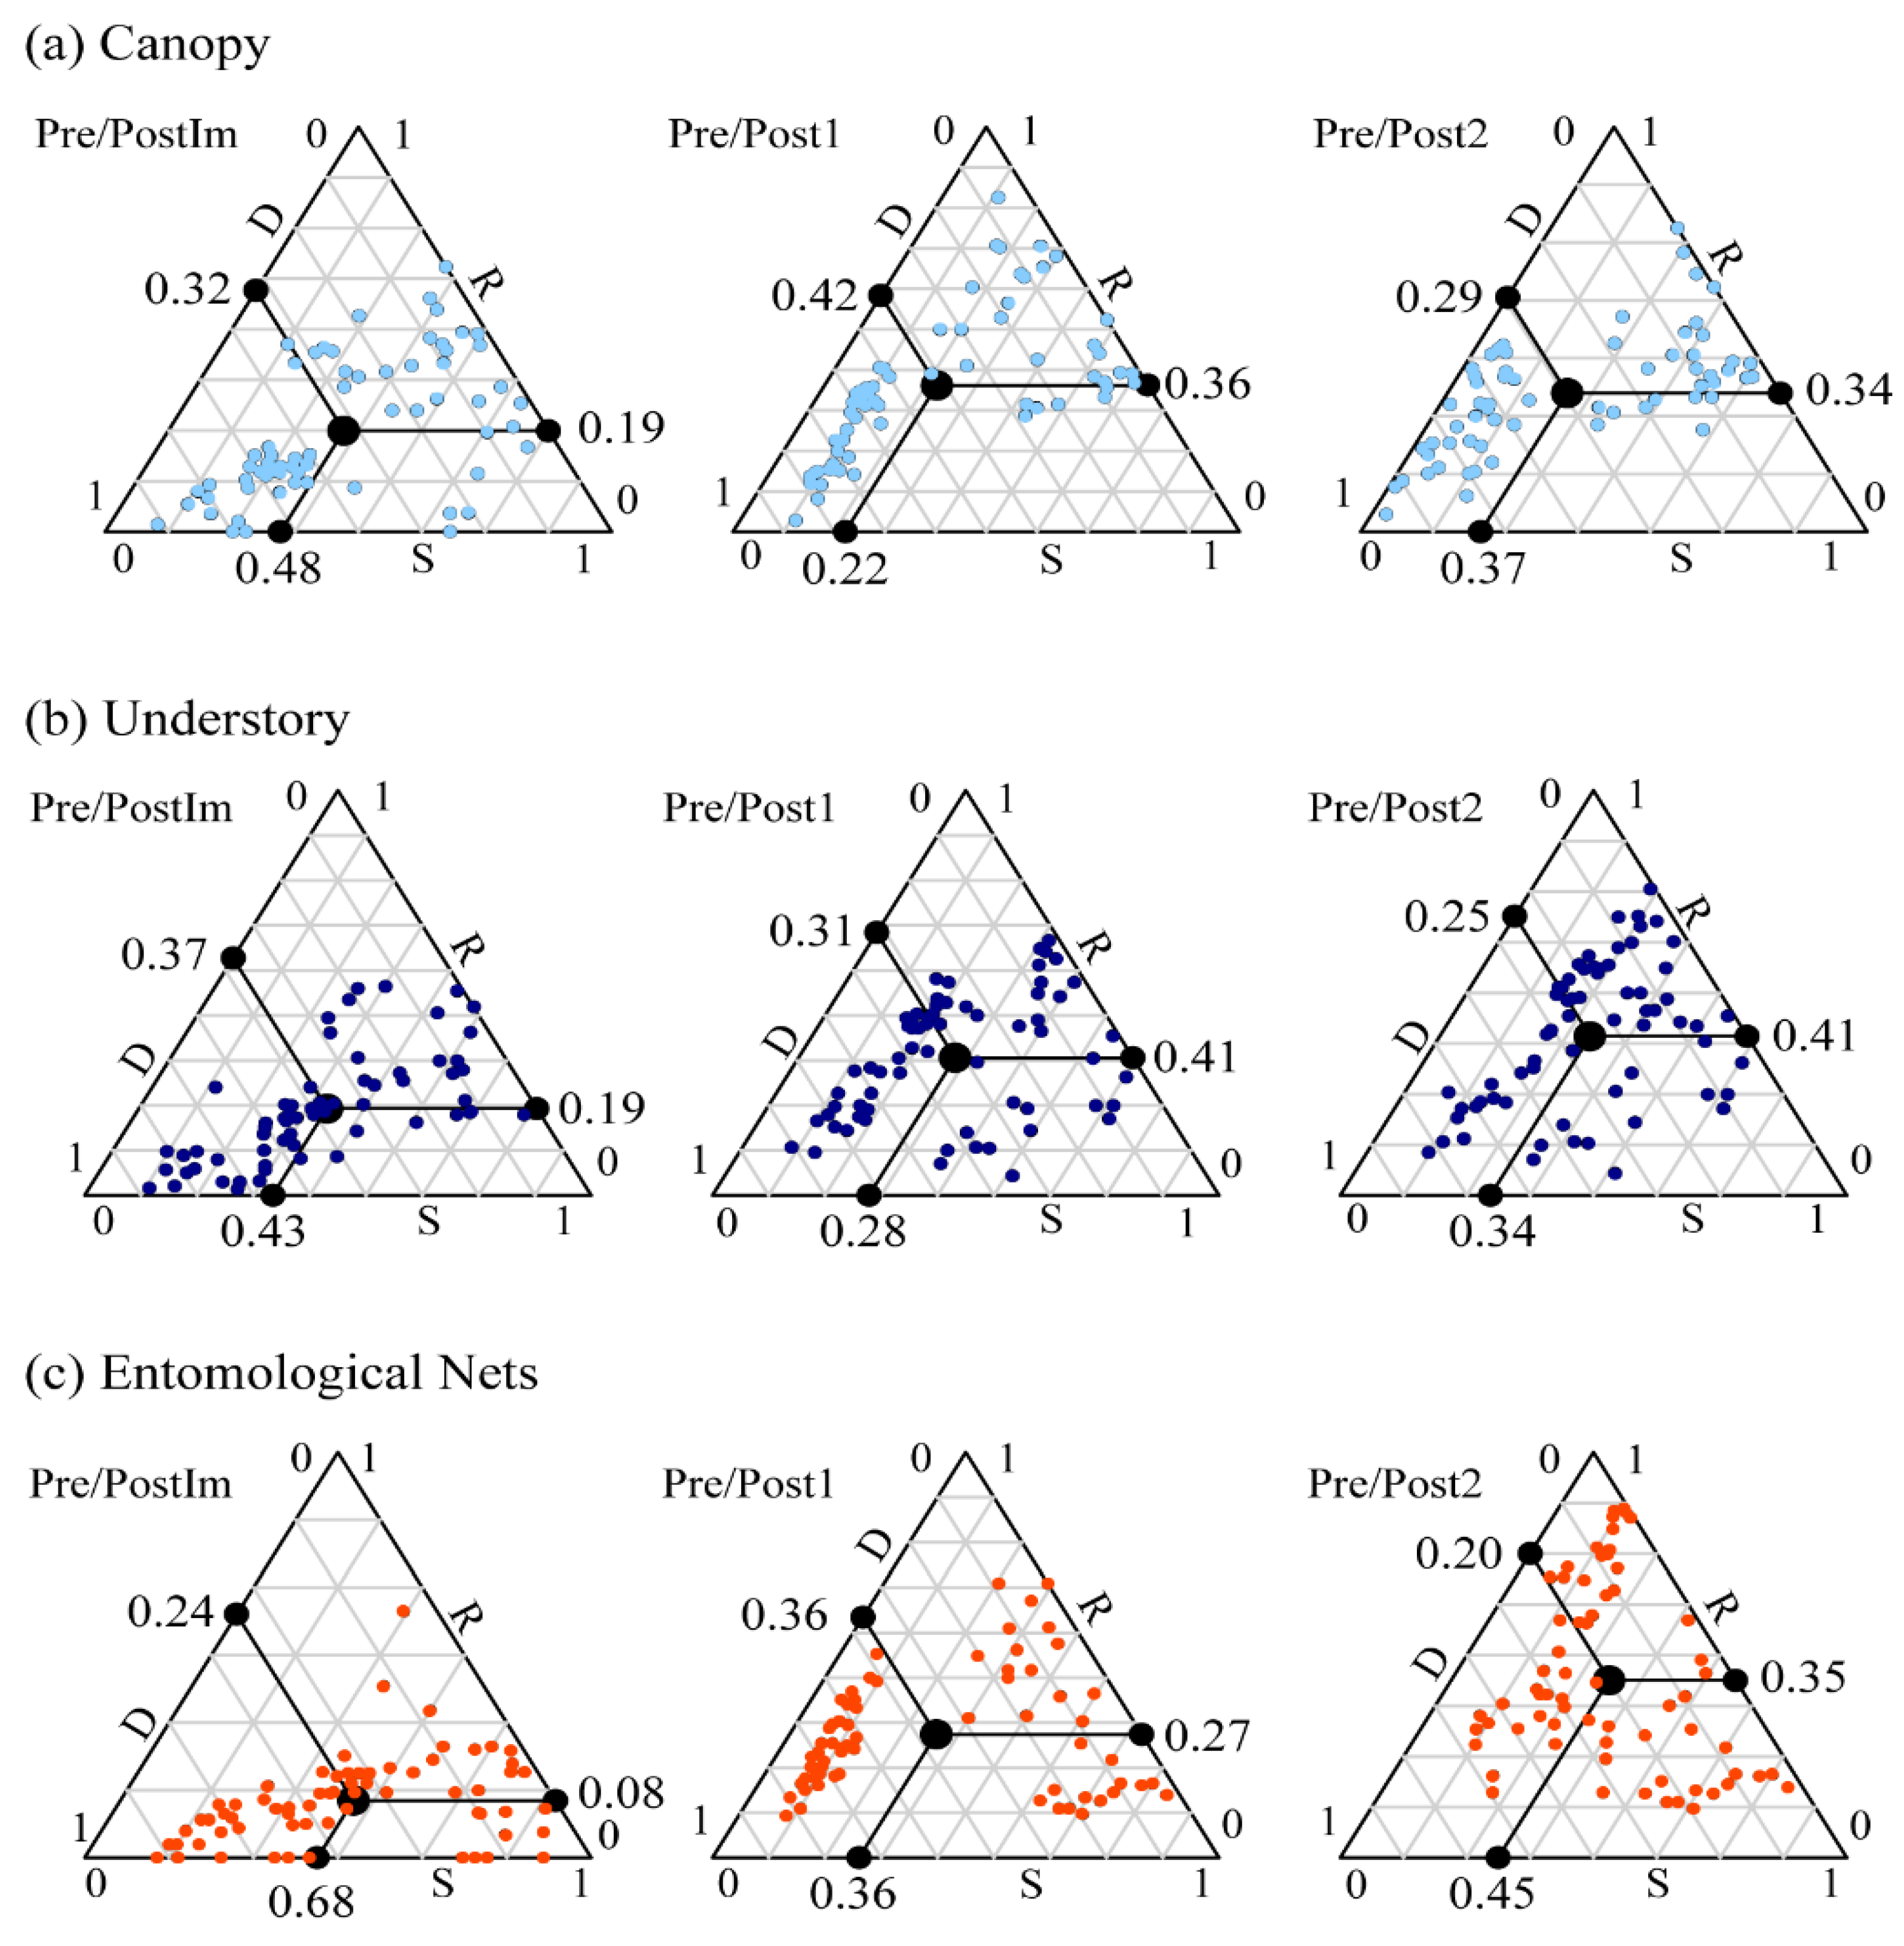
- Podani, J.; Ricotta, C.; Schmera, D. A general framework for analyzing beta diversity, nestedness and related community-level phenomena based on abundance data. Ecol. Complex. 2013, 15, 52–61. [Google Scholar] [CrossRef] [Green Version]
- Dray, S.; Pélissier, R.; Couteron, P.; Fortin, M.J.; Legendre, P.; Peres-Neto, P.R.; Wagner, H.H. Community ecology in the age of multivariate multiscale spatial analysis. Ecol. Monogr. 2012, 82, 257–275. [Google Scholar] [CrossRef]
- Chessel, D.; Dufour, A.B.; Thioulouse, J. The Ade4 Package—I: One-Table Methods. R News 2004, 4, 5–10. [Google Scholar]
- R Development Core Team. R: A Language and Environment for Statistical Computing; R Foundation for Statistical Computing: Viena, Austria, 2018. Available online: http://www.r-project.org (accessed on 24 September 2022).
- Basset, Y.; Barrios, H.; Segar, S.; Srygley, R.B.; Aiello, A.; Warren, A.D.; Delgado, F.; Coronado, J.; Lezcano, J.; Arizala, S.; et al. The Butterflies of Barro Colorado Island, Panama: Local Extinction since the 1930s. PLoS ONE 2015, 10, e0136623. [Google Scholar] [CrossRef] [Green Version]
- Thomas, J.A. Butterfly communities under threat. Science 2016, 353, 216–218. [Google Scholar] [CrossRef]
- Munes, E.C.; Dixon, M.D.; Swanson, D.L.; Merkord, C.L.; Benson, A.R. Large, infrequent disturbance on a regulated river: Response of floodplain forest birds to the 2011 Missouri River flood. Ecosphere 2015, 6, art212. [Google Scholar] [CrossRef]
- Chapman, P.M.; Tobias, J.A.; Edwards, D.P.; Davies, R.G. Contrasting impacts of land-use change on phylogenetic and functional diversity of tropical forest birds. J. Appl. Ecol. 2018, 55, 1604–1614. [Google Scholar] [CrossRef] [Green Version]
- Wu, H.; Chen, J.; Xu, J.; Zeng, G.; Sang, L.; Liu, Q.; Yin, Z.; Dai, J.; Yin, D.; Liang, J.; et al. Effects of dam construction on biodiversity: A review. J. Clean. Prod. 2019, 221, 480–489. [Google Scholar] [CrossRef]
- Durigan, G.; Pilon, N.A.L.; Abreu, R.; Hoffmann, W.A.; Martins, M.; Fiorillo, B.F.; Antunes, A.Z.; Carmignotto, A.P.; Maravalhas, J.B.; Vieira, J.; et al. No Net Loss of Species Diversity After Prescribed Fires in the Brazilian Savanna. Front. For. Glob. Chang. 2020, 3, 13. [Google Scholar] [CrossRef] [Green Version]
- Cox, K.D.; Black, M.J.; Filip, N.; Miller, M.R.; Mohns, K.; Mortimor, J.; Freitas, T.R.; Loerzer, R.G.; Gerwing, T.G.; Juanes, F.; et al. Community assessment techniques and the implications for rarefaction and extrapolation with Hill numbers. Ecol. Evol. 2017, 7, 11213–11226. [Google Scholar] [CrossRef] [PubMed]
- Habel, J.C.; Ulrich, W.; Eberle, J.; Schmitt, T. Species community structures of Afrotropical butterflies differ depending on the monitoring method. Biodivers. Conserv. 2022, 31, 245–259. [Google Scholar] [CrossRef]
- Abreu, T.L.S.; Berg, S.B.; de Faria, I.P.; Gomes, L.P.; Marinho-Filho, J.S.; Colli, G.R. River dams and the stability of bird communities: A hierarchical Bayesian analysis in a tropical hydroelectric power plant. J. Appl. Ecol. 2020, 57, 1124–1136. [Google Scholar] [CrossRef]


| Analysis | Sampling Techniques | (a) Flood Stages | (b) Sampling Techniques | |||
|---|---|---|---|---|---|---|
| Pre | PostIm | Post1 | Post2 | |||
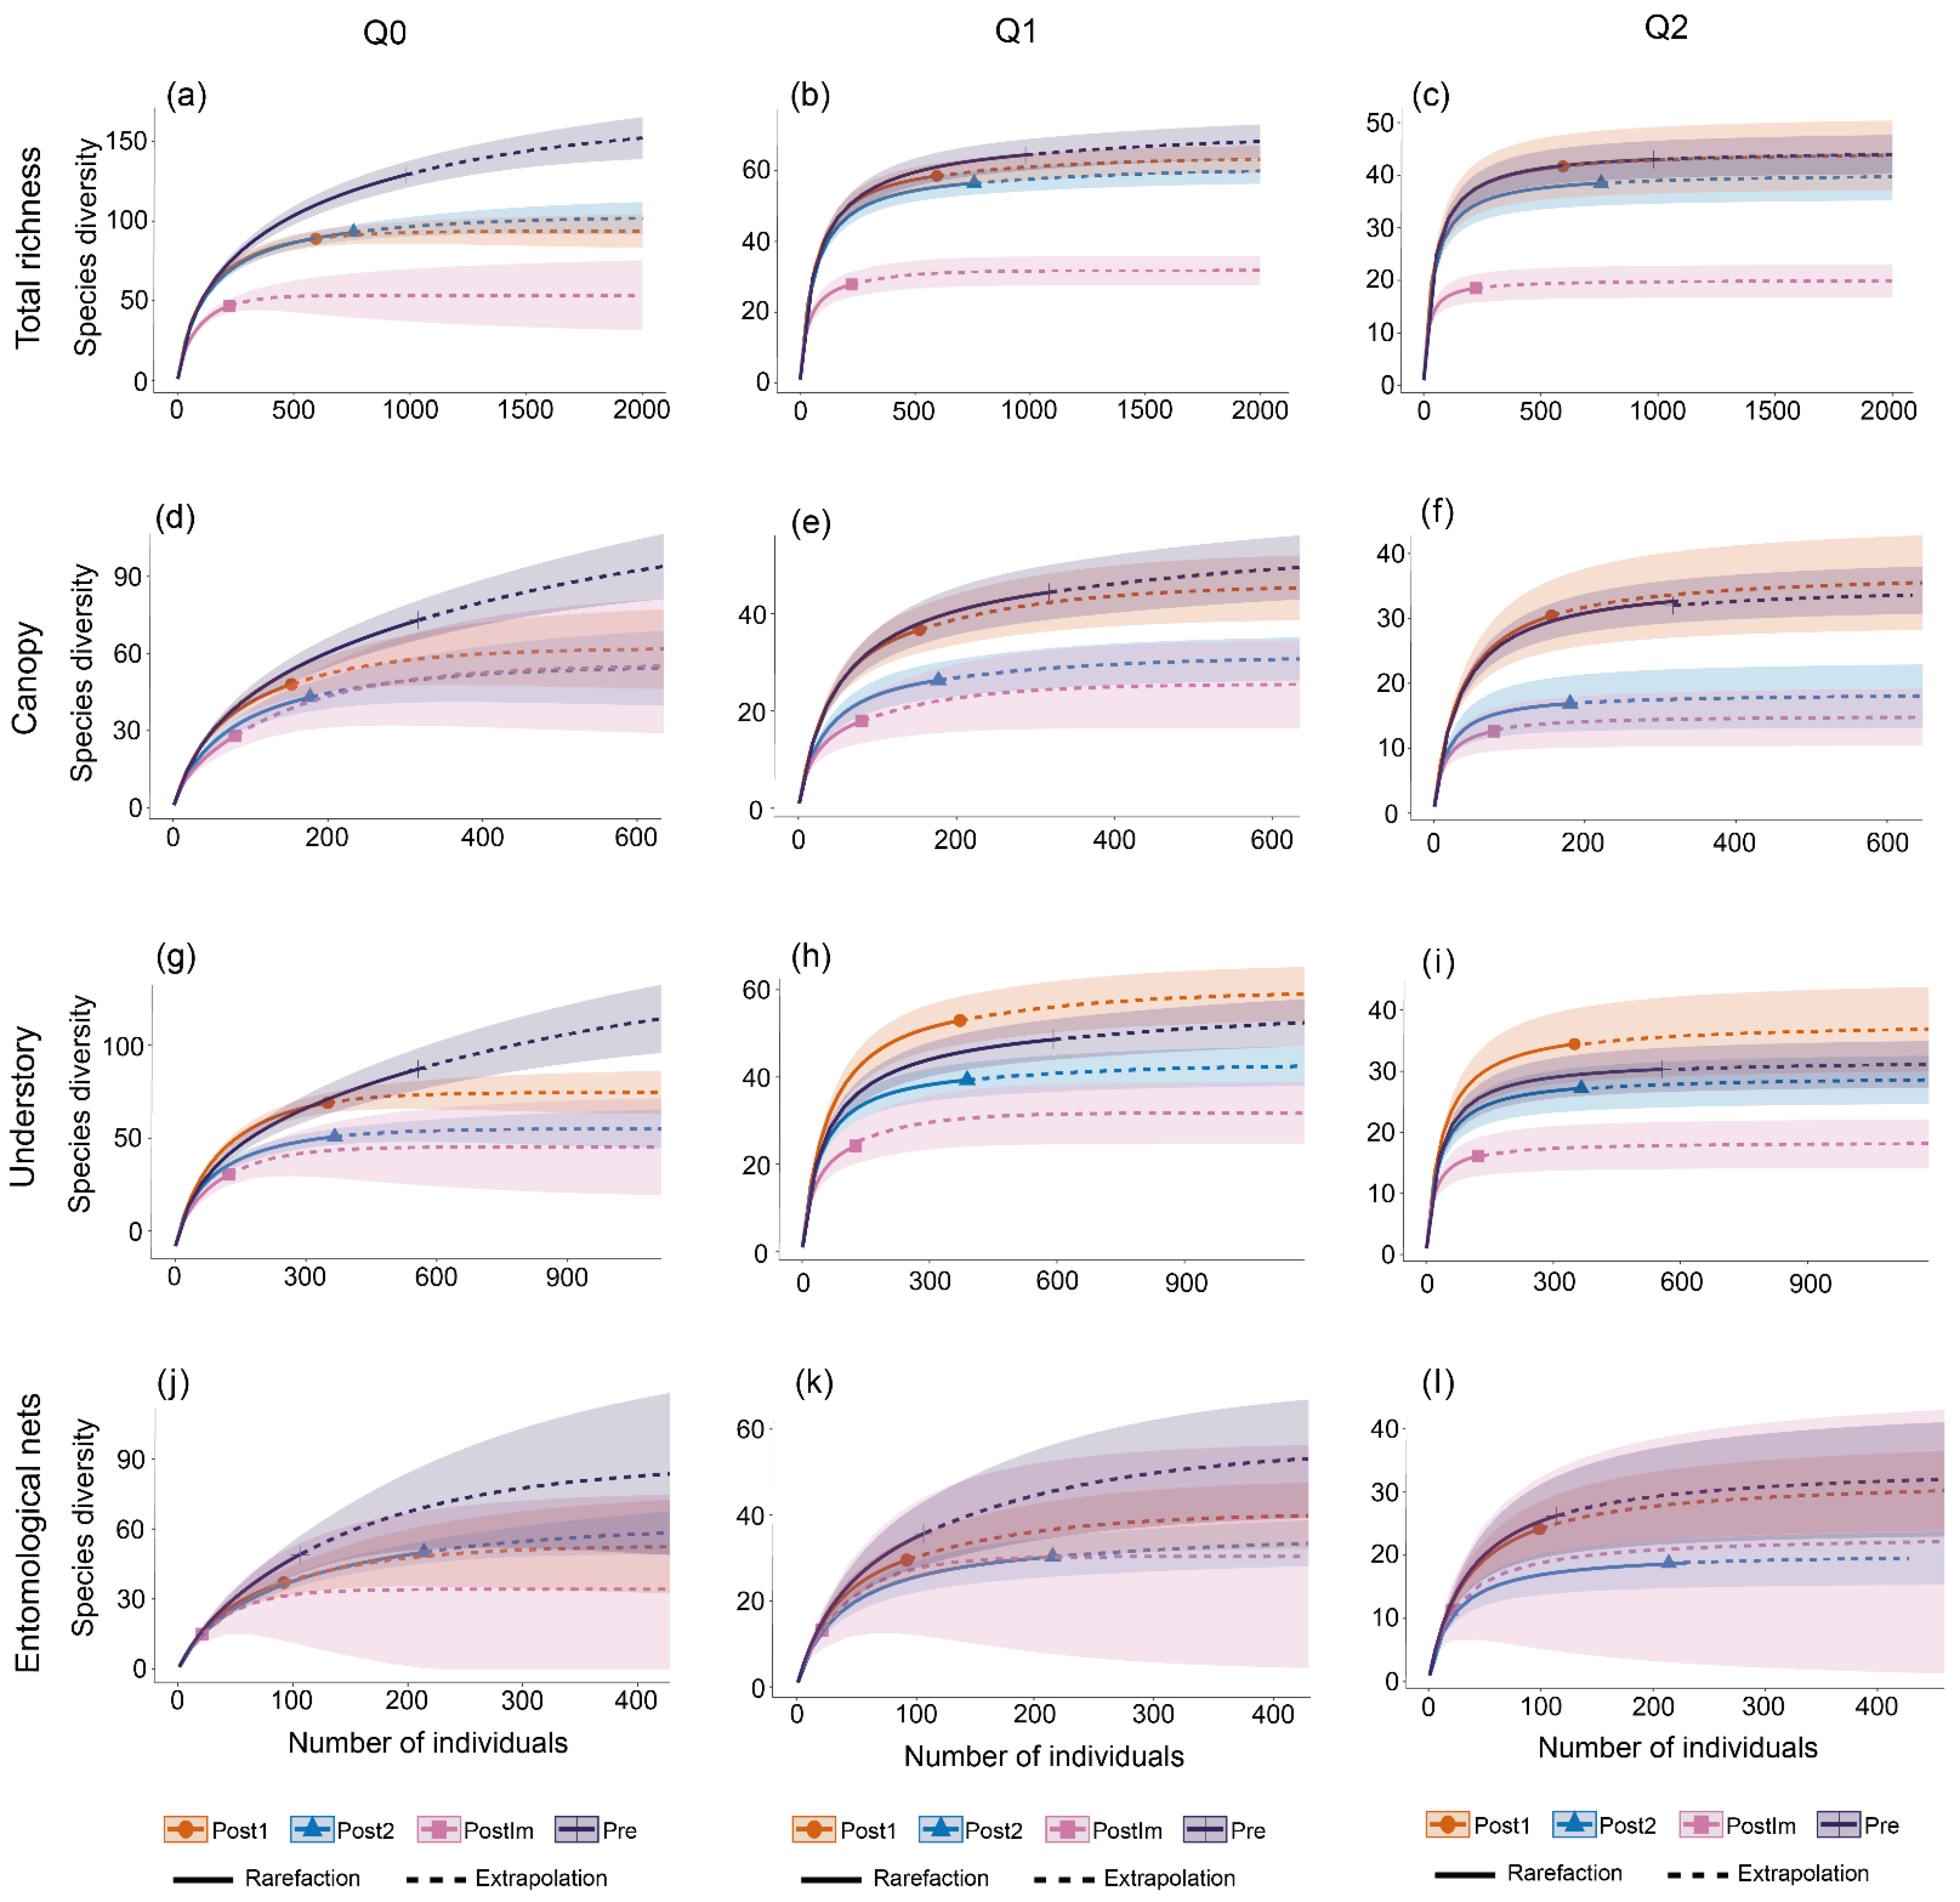
| Richness | Canopy | - | - | - | - | A |
| Understory | ↑ | ↓ | ↓ | ↓ | A | |
| Nets | - | - | - | - | A | |
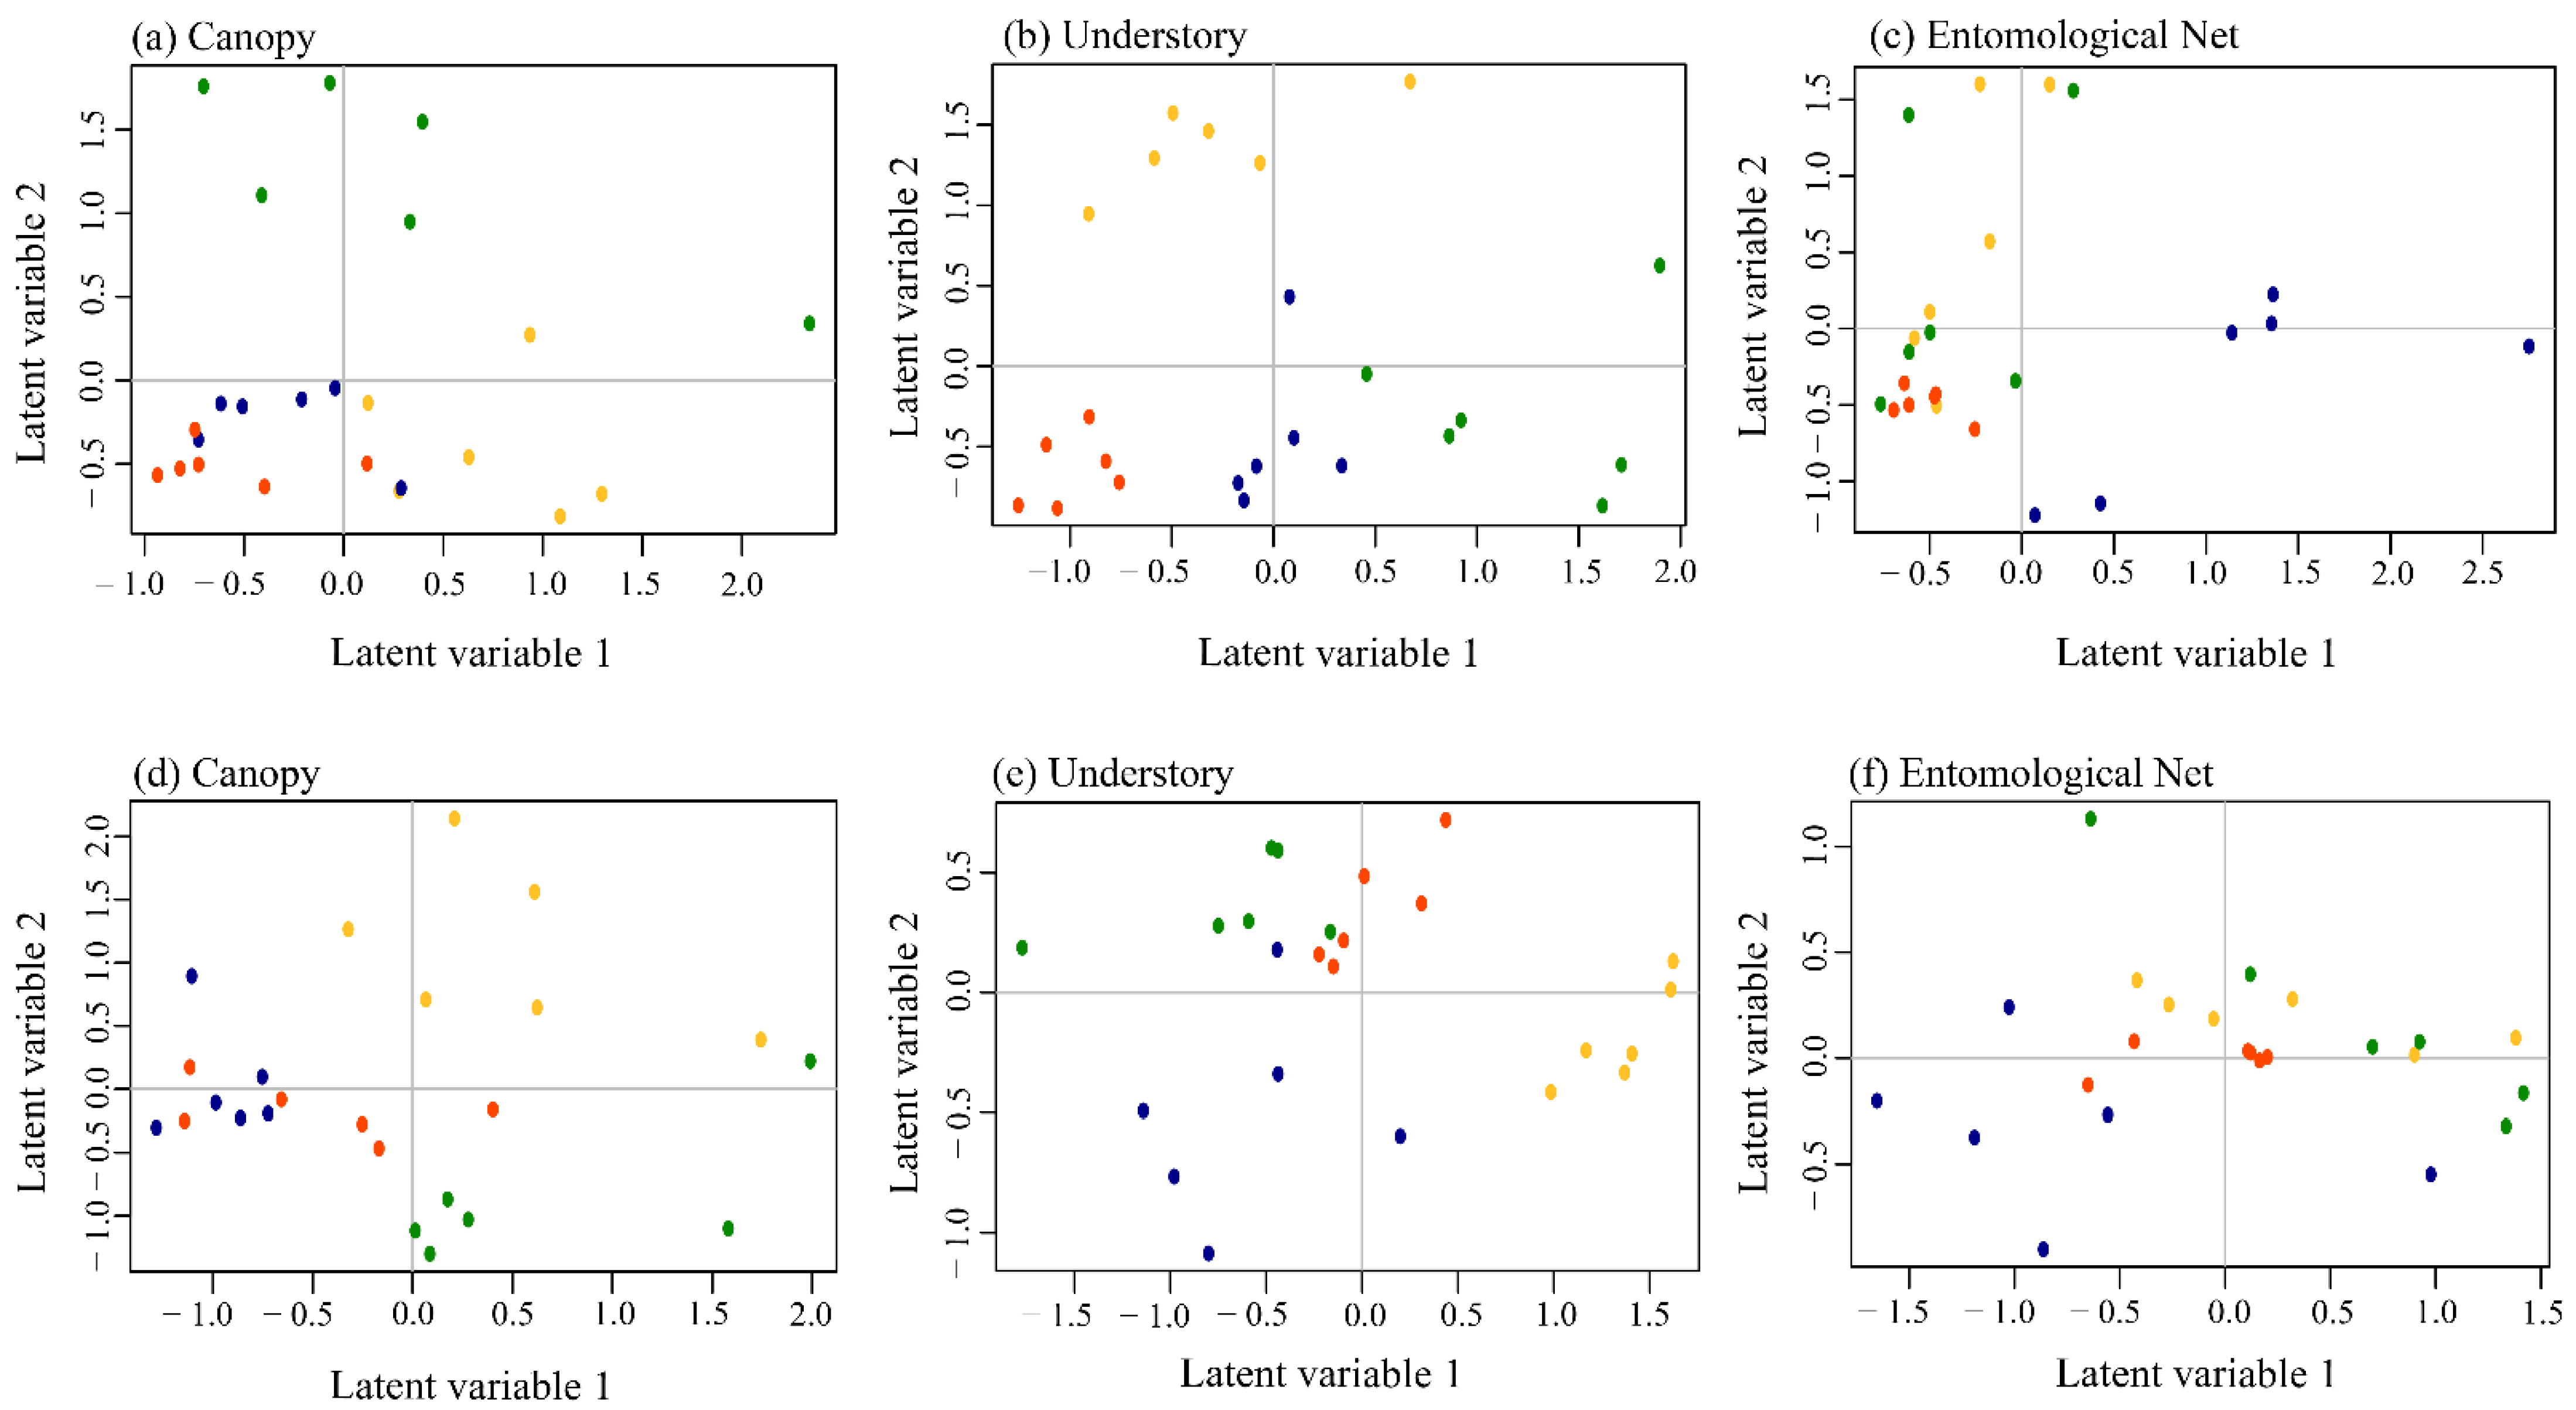
| Composition Occurrence | Canopy | A | B | - | - | - |
| Understory | A | B | C | D | A | |
| Nets | - | A | - | B | B | |
| Composition Abundance | Canopy | A | B | C | D | A |
| Understory | A | B | C | D | - | |
| Nets | A | B | C | D | B | |
| (a) | Canopy | Understory | Entomological Nets | ||||||
|---|---|---|---|---|---|---|---|---|---|
| Statistic | p-Value | p-Ajust | Statistic | p-Value | p-Ajust | Statistic | p-Value | p-Ajust | |
| PostIm–Pre | 203.2 | 0.023 * | 0.138 | 313.5 | 0.007 * | 0.042 * | 153.4 | 0.049 * | 0.2940 |
| Post2–Pre | 171.9 | 0.058 * | 0.174 | 286.1 | 0.015 * | 0.045 * | 152.1 | 0.052 * | 0.1560 |
| Post1–Pre | 159.7 | 0.063 | 0.126 | 279 | 0.015 * | 0.030 * | 139.4 | 0.052 * | 0.1040 |
| Post1–PostIm | 140.2 | 0.063 | 0.095 | 242.6 | 0.015 * | 0.023 * | 112.6 | 0.096 | 0.1440 |
| Post1–Post2 | 139.5 | 0.063 | 0.076 | 215.3 | 0.015 * | 0.018 * | 107.2 | 0.096 | 0.1152 |
| Post2–PostIm | 118.8 | 0.063 | 0.063 | 207.3 | 0.015 * | 0.015 * | 102.8 | 0.096 | 0.0960 |
| (b) | Canopy | Understory | Entomological Nets | ||||||
| Statistic | p-Value | p-Ajust | Statistic | p-Value | p-Ajust | Statistic | p-Value | p-Ajust | |
| PostIm–Pre | 230.1 | 0.011 * | 0.066 | 346.9 | 0.002 * | 0.012 * | 195.2 | 0.011 * | 0.066 |
| Post2–Pre | 224.8 | 0.011 * | 0.033 * | 339 | 0.002 * | 0.006 * | 188.1 | 0.011 * | 0.033 * |
| Post1–Pre | 210.1 | 0.011 * | 0.022 * | 323.7 | 0.002 * | 0.004 * | 178.5 | 0.011 * | 0.022 * |
| Post1–PostIm | 179.8 | 0.011 * | 0.017 * | 265.5 | 0.003 * | 0.005 * | 150.4 | 0.011 * | 0.017 * |
| Post1–Post2 | 171.4 | 0.011 * | 0.013 * | 256.1 | 0.003 * | 0.004 * | 138.1 | 0.011 * | 0.013 * |
| Post2–PostIm | 144.4 | 0.011 * | 0.011 * | 242.2 | 0.003 * | 0.003 * | 124.4 | 0.011 * | 0.011 * |
Publisher’s Note: MDPI stays neutral with regard to jurisdictional claims in published maps and institutional affiliations. |
© 2022 by the authors. Licensee MDPI, Basel, Switzerland. This article is an open access article distributed under the terms and conditions of the Creative Commons Attribution (CC BY) license (https://creativecommons.org/licenses/by/4.0/).
Share and Cite
Santos, A.d.C.; Carmo, D.L.R.d.; Plaza, T.G.D.; Arrua, B.A.; Nacagawa, V.A.F.; Fernades, R.A.M.; Pontes, F.T.N.; Ribeiro, D.B. Active Sampling and Understory Traps Can Cost-Effectively Detect Changes in Butterfly Communities after Hydroelectric Dam Construction. Diversity 2022, 14, 873. https://doi.org/10.3390/d14100873
Santos AdC, Carmo DLRd, Plaza TGD, Arrua BA, Nacagawa VAF, Fernades RAM, Pontes FTN, Ribeiro DB. Active Sampling and Understory Traps Can Cost-Effectively Detect Changes in Butterfly Communities after Hydroelectric Dam Construction. Diversity. 2022; 14(10):873. https://doi.org/10.3390/d14100873
Chicago/Turabian StyleSantos, Andréia de C., Débora L. R. do Carmo, Tarik G. D. Plaza, Bruno A. Arrua, Vivian A. F. Nacagawa, Rafaela A. M. Fernades, Felipe T. N. Pontes, and Danilo B. Ribeiro. 2022. "Active Sampling and Understory Traps Can Cost-Effectively Detect Changes in Butterfly Communities after Hydroelectric Dam Construction" Diversity 14, no. 10: 873. https://doi.org/10.3390/d14100873