Article

Stochastic Processes Drive Plant Community Assembly in Alpine Grassland during the Restoration Period

1
Institute of Tibetan Plateau Research, Chinese Academy of Sciences, Beijing 100101, China
2
University of Chinese Academy of Sciences, Beijing 100049, China
3
College of Ecology, Lanzhou University, Lanzhou 730000, China
4
College of Life Sciences, Wuhan University, Wuhan 430072, China
5
College of Urban and Environmental Sciences, Peking University, Beijing 100871, China
6
Tibet Autonomous Region Institute of Science and Technology Information, Lhasa 850000, China
*
Author to whom correspondence should be addressed.
Diversity 2022, 14(10), 832; https://doi.org/10.3390/d14100832
Submission received: 2 September 2022 / Revised: 27 September 2022 / Accepted: 29 September 2022 / Published: 3 October 2022
(This article belongs to the Special Issue Mountain Biodiversity, Ecosystem Functioning and Services)

Abstract

:
Enclosure (prohibition of grazing) is an important process to restore alpine grassland on the Qinghai-Tibetan Plateau. However, few studies have quantified the extent to which the long-term enclosure may contribute to the changes in plant phylogenetic diversity and community assembly in alpine grassland under environmental change. In this study, based on an 11-year fencing experiment along an altitudinal gradient ranging from 4400 m to 5200 m in central Tibet, we conducted an observation of species composition and coverage within and outside the fences in the fifth, eighth and eleventh year, and monitored the related climate and soil factors at 7 sites. Our aim is to quantify the relative effects of environmental change and grassland management on the alpine plant community assemblage. The results were: (1) the overall phylogenetic structure (NRI) of the alpine plant communities, whether inside or outside the enclosure, was divergent at altitudes where the environment was relatively unextreme (4800–5100 m), but aggregative at altitudes with low precipitation (4400–4650 m) or with low temperature (5200 m). (2) The phylogenetic structure of the nearest taxon of species (NTI) was more aggregative along the whole gradient. (3) Precipitation was the dominant factor driving the changes in species richness, phylogenetic diversity and community α-phylogenetic structure indices (NRI and NTI), followed by enclosure duration and soil C:N ratio. (4) The phylogenetic structure of the communities was similar at higher altitudes under grazing or enclosure treatments, and was opposite at lower sites. Stochastic processes have driven the changes in the communities between inside and outside the fences at all altitudes. In addition, homogeneous dispersal occurred in communities at higher sites. In summary, the 11-year enclosure had little effect on community structure of alpine meadows where the grazing pressure is relative lower, whereas it could help restore the community of steppe meadow at lower altitudes where the grazing pressure is extensively higher. This study may provide a vital theoretical support for the formulation of differential management for alpine grassland on the Tibetan Plateau.

1. Introduction

There is increasing evidence that conserved traits of ecological niches play an important role in ecology and phylogenetic evolution [1,2]. In the context of the long-term debate between ecological niche theory and neutral theory [3,4,5,6,7,8,9,10], researchers have also found that deterministic ecological processes (e.g., environmental filtration and biological interactions) and stochastic ecological processes (e.g., birth/death, species formation/extinction and migration) can both affect the community assembly [11,12,13,14,15,16,17] and are considered as complementary in reality ecosystems [18,19]. Therefore, revealing factors that control the relative impact of deterministic and stochastic processes at different spatiotemporal scales has become one of the core issues of community assembly [20]. Based on the neutral hypothesis of biomolecular evolution, Vellend [21] set up a theoretical framework, dividing community dynamic processes into selection, dispersal, speciation and ecological drift. Due to the development and functioning of the above four processes, the impact of the deterministic process gradually decreased, while that of the stochastic process gradually increased [22]. This theoretical framework unifies ecological niche theory and neutral theory and exerts a wide impact on community ecology [19,23,24,25,26]. This theoretical innovation also opens a new way to deconstruct the community assembly mechanism in different ecosystems.
Over the past decades, grassland degradation has become one of the vital problems of global changes threatening the stability of the terrestrial ecosystem [27,28,29] and hinders the sustainable development of regional economies and environments [30,31], and will eventually endanger human society, economic development and earth habitat [29]. On the Qinghai-Tibet Plateau (QTP), alpine grassland is the most widely distributed vegetation type, occupying approximately 60% of the whole area [32]. However, the short growing season length of alpine plants and the increasing number of livestock have led to widespread overgrazing in this region [33,34,35]. The impact of climate change (e.g., warming and drying) has now degraded up to 4.25 million ha of alpine grassland, accounting for one-third of the grassland area of the QTP [36]. As one of the common methods of vegetation restoration and rehabilitation of degraded grasslands [37,38], fencing refers to the use of fencing facilities to enclose grasslands for a certain period of time to recuperate and regenerate grassland plants, improve productivity and restore biodiversity [37,39]. Different studies reported different conclusions about the impact of enclosure on the phylogenetic community assembly. For example, studies on temperate grasslands in North America found that grassland restoration resulted in increased competition for dominant species, with more closely related species being excluded from the community, leading to an overdispersion pattern of community phylogeny [40]. In the Netherlands, a 7-year enclosure treatment promoted a more stochastic plant community assembly in a floodplain grassland [41]. However, in temperate shrub-grasslands in northern China, Hao found that the long-term enclosure enhanced the negative effect of competition between dominant species and auxiliary species, resulting in a more aggregated community phylogenetic structure [42]. Meanwhile, Sun found that the short-term enclosure did not result in significant differences in the community phylogenetic structure in alpine steppes meadows. It is also found that the effect of grazing on the community phylogenetic structure in alpine grasslands of northern Tibet was more correlated with grazing intensity [43]. High grazing intensity shifted the community phylogenetic structure from dispersion to aggregation, while low grazing intensity had little effect on species richness and community structure [44]. However, the above studies have not yet quantified the extent to which interannual changes of environmental factors during restoration may affect the phylogeny of grassland communities. In addition, whether the community assembly in alpine meadows is dominated by stochastic or deterministic processes during restoration, and whether there exists altitudinal variation is yet poorly known and needs to be answered.
The widely distributed alpine grassland on the QTP, with large altitudinal gradients and fenced versus grazing pastures, provides us an ideal platform to explore whether the long-term enclosure may contribute to the changes in phylogenetic diversity and community assembly in alpine grassland under climate change. We therefore set up an experiment along the altitudinal gradient in central Tibet to reveal the mechanism of alpine grassland community assembly during 11 years of enclosure. Previous studies have shown that species richness and aboveground biomass along the gradient reflected a unimodal pattern, while the limiting climatic factors at the upper and lower limit of the gradient were low temperature and drought, respectively [45]. We hypothesized that environmental filtering dominates the phylogenetic structure of alpine grassland plant communities, and the phylogenetic structure of plant communities at high and low altitudes is relatively clustered, while the phylogenetic structure at medium altitudes is divergent. In addition, we guessed that the change of phylogenetic community structure similarity between inside and outside fences may be related to the grazing intensity and enclosure time period, and it will happen at lower altitudes with high grazing pressure rather than at higher altitudes. Therefore, our aims were to (1) clarify the relative effects of environmental factors and grassland management on plant species richness and phylogenetic community assembly of alpine grassland and (2) reveal the relative impact of stochastic processes and deterministic processes on alpine grassland restoration.

2. Materials and Methods

2.1. Overview of Study Sites

The experiment was set up on the southern slope of Nyenqing-Tanggula Mountain in the central Tibetan Plateau (30°30’–30°32’ N, 91°03’ E; 4400–5200 m), near the grassland station in Dangxumg County, Tibet (Figure S1). This region is dominated by a semi-arid continental climate. According to the data of the Dangxumg meteorological station (4 km from the lowest site and 4288 m a.s.l.) during 1963–2017, the annual mean air temperature and precipitation were 1.94 °C and 479 mm, respectively. There are increasing trends of annual mean air temperature from the 1970s, and annual precipitation from the 1980s to the 2000s (unpublished data). As the only pure animal husbandry county in Lhasa, the capital of Tibet, Dangxumg County is rich in grassland resources (about 70% of the total area is grassland). Due to the high quality and vast area of grassland, the number of yak and sheep in this county reached 2.837 × 10⁵ and 2.215 × 10⁵ in 2017, respectively. In our study area, the resident settlement sits at the lower altitudes (Figure S1) where the grazing intensity is much greater than at higher altitudes.
In 2005, nine HOBO automatic weather stations (Onset Inc., Bourne, MA, USA) were installed at 4400 m, 4500 m, 4650 m, 4800 m, 4950 m, 5100 m, 5200 m, 5300 m and 5500 m (Figure S1). Air temperature (1.5 m above ground) and precipitation dynamics were recorded by the HOBO digger every 30 min. According to the automatic weather station data along the gradient from 2006 to 2016, the multi-year growing season mean air temperature (GST) decreased at a rate of 0.74 °C/100 m. However, growing season precipitation (GSP) showed a unimodal pattern with the maximum GSP (close to 500 mm) occurring at 5100 m and the minimum GSP (less than 370 mm) at and below 4650 m (Figure S2). The soil nutrient content, including soil organic carbon and nitrogen, also showed a unimodal pattern, with the maximum values occurring at 5100 m and minimum values at 4400 m (Figure S2).
Along the slope, the alpine steppe meadows with dominant species of Stipa pillacea, S. purpurea and Kobresia humilis are distributed at 4400–4600 m, while typical alpine meadows with K. pygmaea as dominant species are mainly distributed between 4600 and 5200 m. Other companion species include Androsace tapete, K. humilis, Potentilla saundersiana and Thalictrum alpinum [45,46]. The grass line, i.e., the upper limit of grassland, locates around 5200 m where the vegetation coverage is about 30–50%. The peak of vegetation above-ground biomass (AGB) occurs in late July to early August.

2.2. Measurement of Species Richness and Coverage of Each Species

In September 2006, we set up a 20 m × 20 m fence at each of the six altitudes below 5200 m (Figure S1). All the fences were set near the automatic weather stations mentioned above. At 5200 m, a large-sized fence was not used due to very low grazing intensity. Four 1 m×1 m fixed quadrats were set up within and without the fence in each altitude. Due to the chronic change of community in alpine grassland, species richness (SR) and coverage of each species were investigated during the peak growing season (from late July to early August) in 2011, 2014 and 2017. The quadrats were divided into 100 small grids of 10 cm × 10 cm, and the species names and coverage of each grid were recorded. Species richness was defined as the number of species per unit area for each quadrat [45].

2.3. Statistical Analysis

Species names were checked by R package plantlist and the assignment of families and genera was based on the Angiosperm Phylogeny Group IV classification [47,48]. The phylogenetic tree was generated by using the ape package [49].
Phylogenetic diversity (PD) has been considered to be a predictor of ecosystem functioning as conserved traits of ecological niches [50] and represents the evolutionary potential of a species setting against environmental changes [51]. Nowadays, PD has been increasingly considered as a strategy to identify geographical regions with maximum diversity and resilience to climatic fluctuations [52,53]. Therefore, to evaluate the total evolutionary history of the species in an assemblage, Faith’s PD was used and calculated by ape and picante package [49,54]. We also weighted the coverage of each species to calculate the Net Relatedness Index (NRI) and the Nearest Taxon Index (NTI) for revealing phylogenetic overdispersion (co-occurring species are more distantly related than would be expected by chance) or phylogenetic aggregation (co-occurring species are more closely related than would be expected by chance) by the null model of picante package [54,55,56].
In detail, a positive value of NRI or NTI indicates phylogenetic aggregation, and if the value is greater than 2, the phylogenetic aggregation pattern is significant; a negative value of NRI or NTI indicates phylogenetic overdispersion, and if the value is less than −2, the phylogenetic overdispersion pattern is significant [57]. The above 3 indices are different aspects of phylogenetic α-diversity in this study. Species richness and phylogenetic α-diversity indices were compared between inside and outside the enclosure at different altitudes using independent sample t-tests. We also used a one-sample t-test to compare the values of NRI or NTI, as well as 0 (the value of total randomness).
To ensure that the environmental factors and experimental treatments had an effect on community taxonomic and phylogenetic structure across the altitudinal gradient, we used the mantel test in the ape package to assess the relationship between standard Euclidean distances of environmental factors and phylogenetic dissimilarity in each quadrant [20].
The effects of management treatments, duration time of enclosure, soil C:N ratio, GST and GSP on SR and phylogenetic α-diversity indices were analyzed using generalized linear mixed-effects models (GLMMs) with generalized response variables being normal or abnormal. Altitude was included as a random effect. The GLMM of the response variables was modeled using a Gaussian error distribution with the lme4 package [58]. Using the following model, X represents a response variable:
X∼management treatment + duration time + soil C:N + GST + GSP + (1∕altitude)
The glmm.hp package was used to estimate the individual fixed effects of the response variables [59]. If the individual fixed effect of factors was negative, we would eliminate the factors and recalculate the equation without the factors.
Finally, to reveal the mechanism of community assembly within and outside the fence at the same altitude, we measured phylogenetic β-diversity metrics (β-nearest taxon index: βNTI, β-net relatedness index: βNRI, and Bray-Curtis-based Raup-Crick index: RCbray) based on the null-model using the iCAMP package and NST package [26,60]. The meaning of each phylogenetic β-diversity index and its threshold are shown below: if the |βNTI| or |βNRI| > 2, the deterministic processes govern community composition and phylogenies are more similar (homogeneous selection, βNTI or βNRI < −2), or phylogenies are not similar (heterogeneous selection, βNTI or βRTI > +2). Subsequently, with an |βNTI| or |βNRI| < 2 (stochastic pattern), RCbray was used to further distinguish between homogenized dispersal (taxonomically more similar, RCbray values < −0.95) and dispersal limitation (taxonomically less similar, RCbray values > 0.95). In contrast, with |βNTI| or |βNRI| < 2, and |RCbray|< 0.95, the community assembly was treated as an “undominated” pattern, i.e., no single process drove changes in community composition [61]. We also compared the values of βNRI or βNTI with a one-sample t-test, as well as 0 (a completely random value).
SPSS25.0 (SPSS Inc., Chicago, IL, USA) and R 4.1.3 were applied for statistical analysis. Graphpad 7.0 (San Diego, CA, USA) and the online site (https://www.chiplot.online/, accessed on 26 September 2022) was used for drawing figures.

3. Results

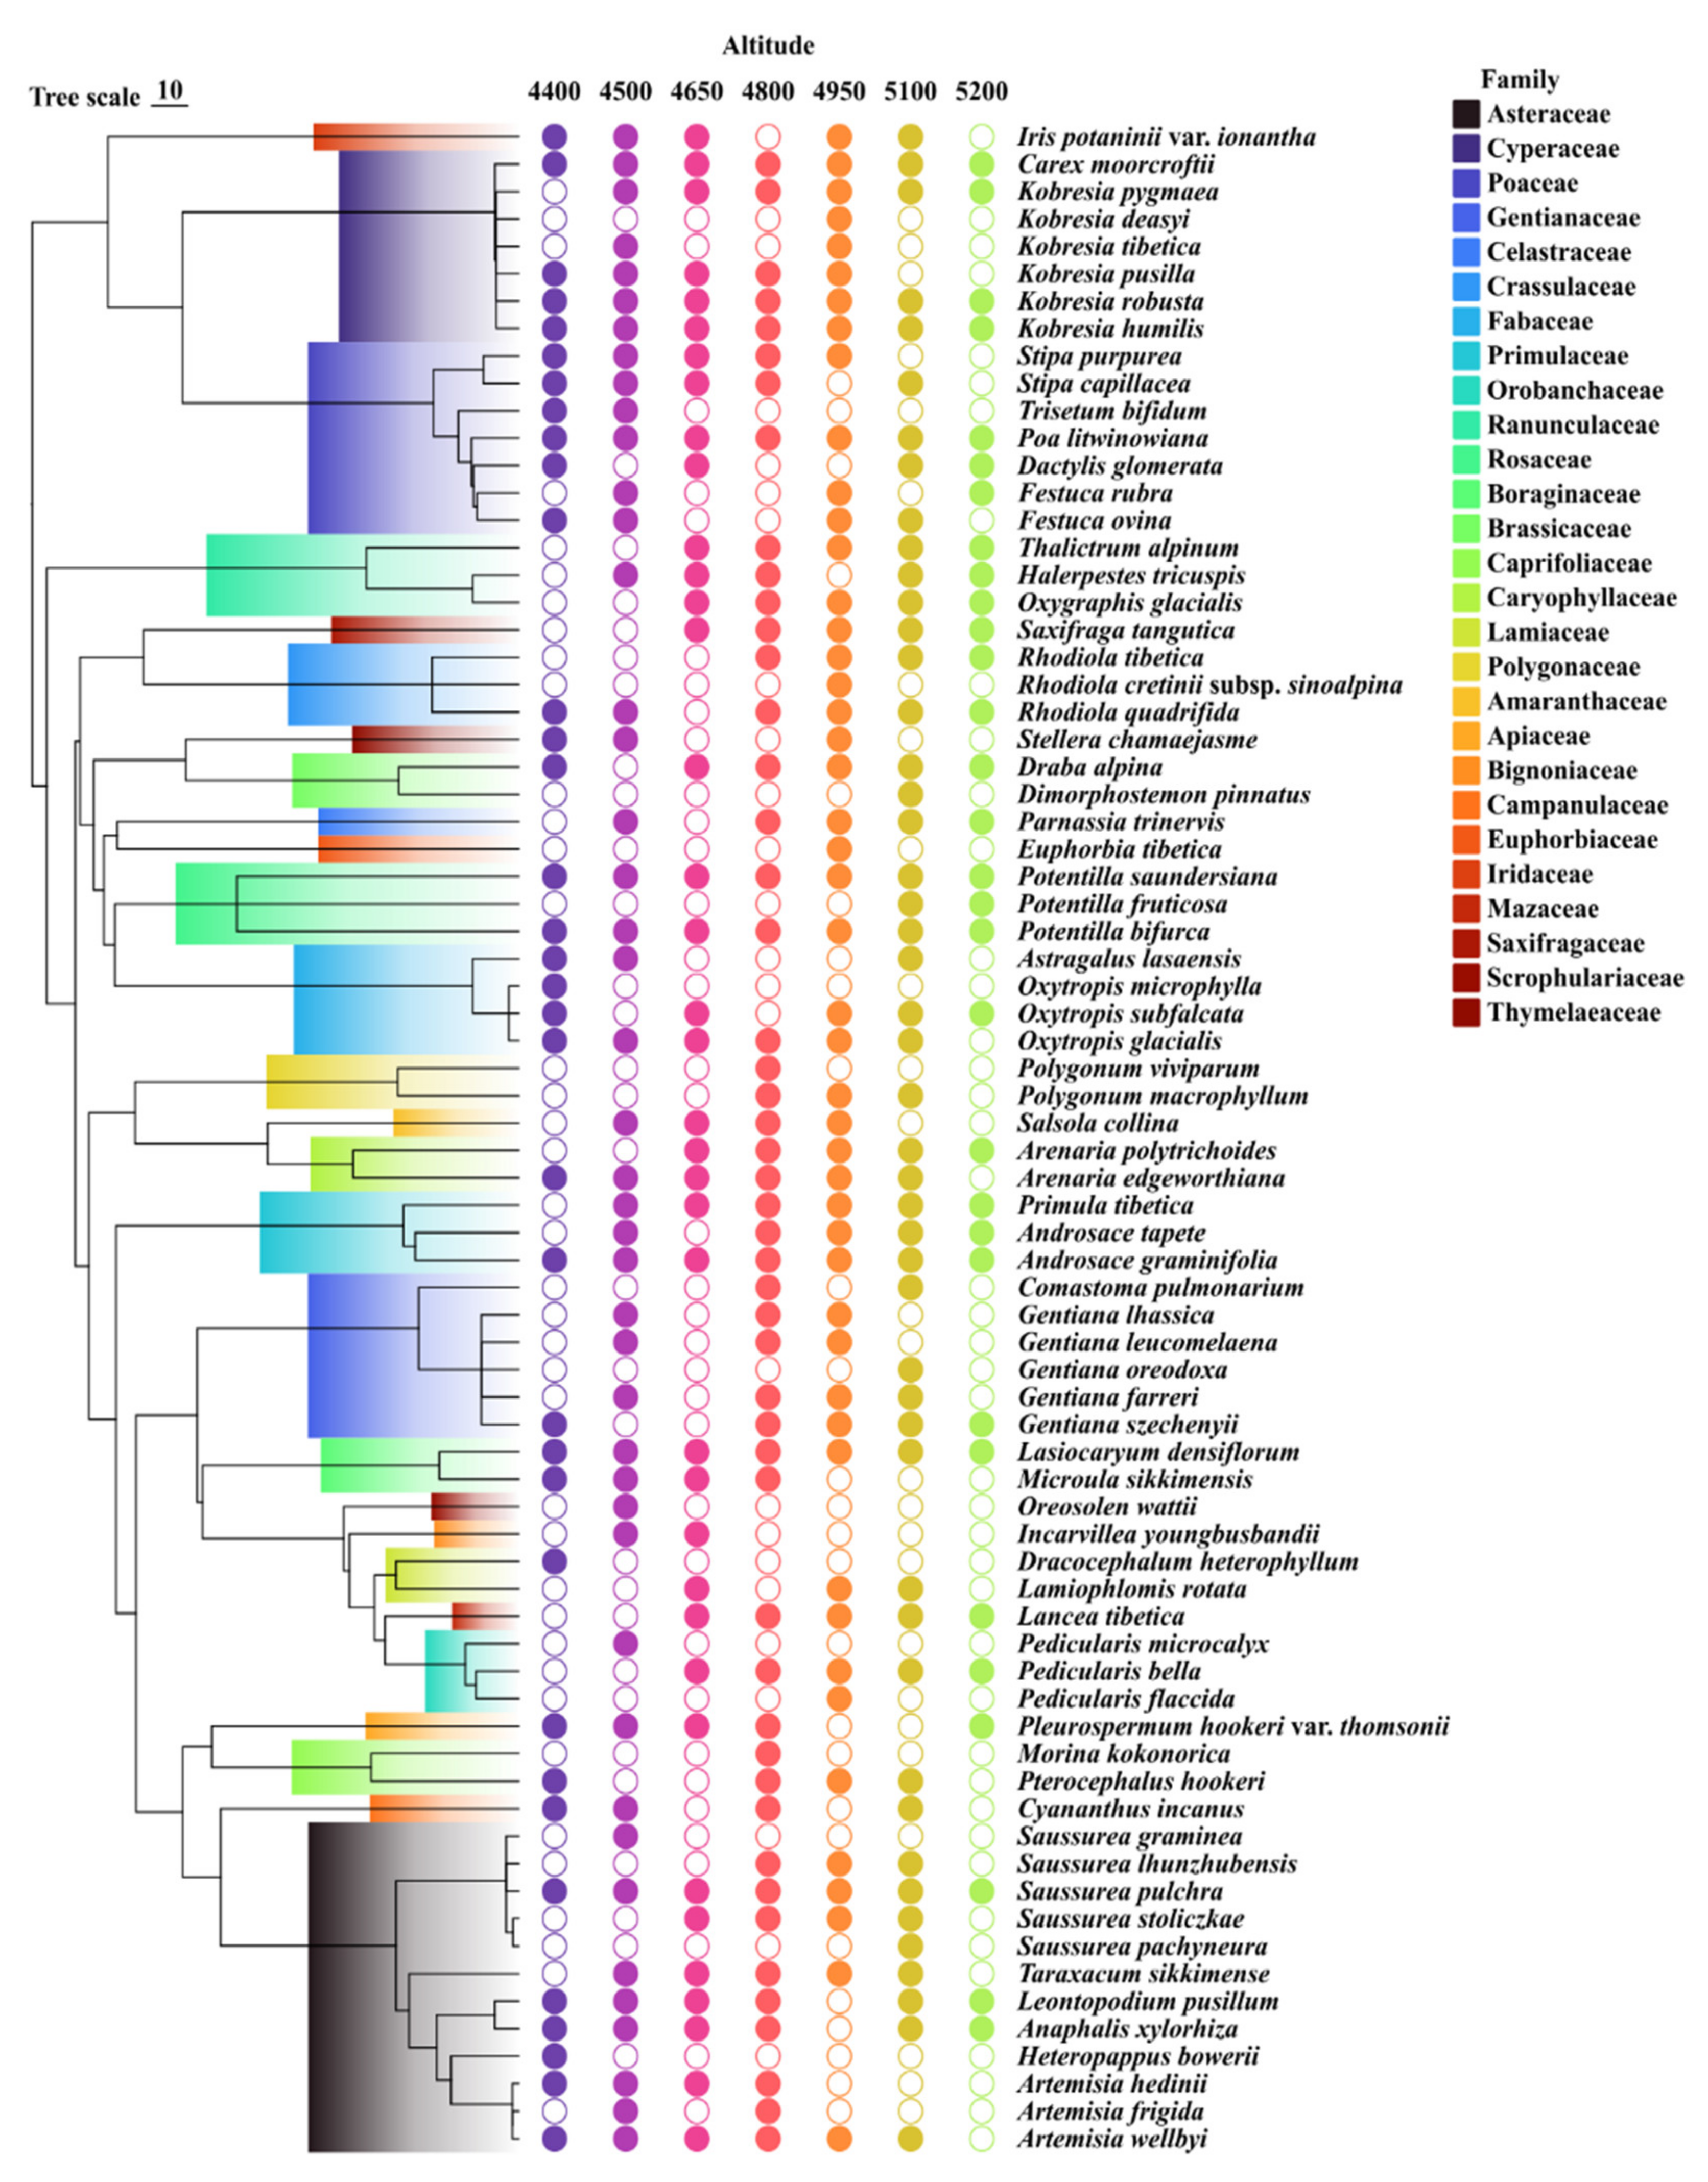
3.1. The Overview of the Community Structure

In total, we observed 75 species of vascular plants in our study sites, representing 46 genera from 27 families (Figure 1). Considering the most species-rich families represented, Asteraceae, with the highest number of 16.2%, was the most common family among the seven sites, followed by Poaceae with 9.5%, Cyperaceae with 9.5%, Gentianaceae with 8.1%, and Fabaceae with 5.4%, which together accounted for almost 50% of the total number of plants. In addition, plots at higher sites (>4600 m) were dominated by Kobresia and accounted for approximately 60% of the relative coverage, while those at lower altitudes (<4600 m) were mainly dominated by Stipa which accounted for about one-third of the relative coverage (Figure S3).

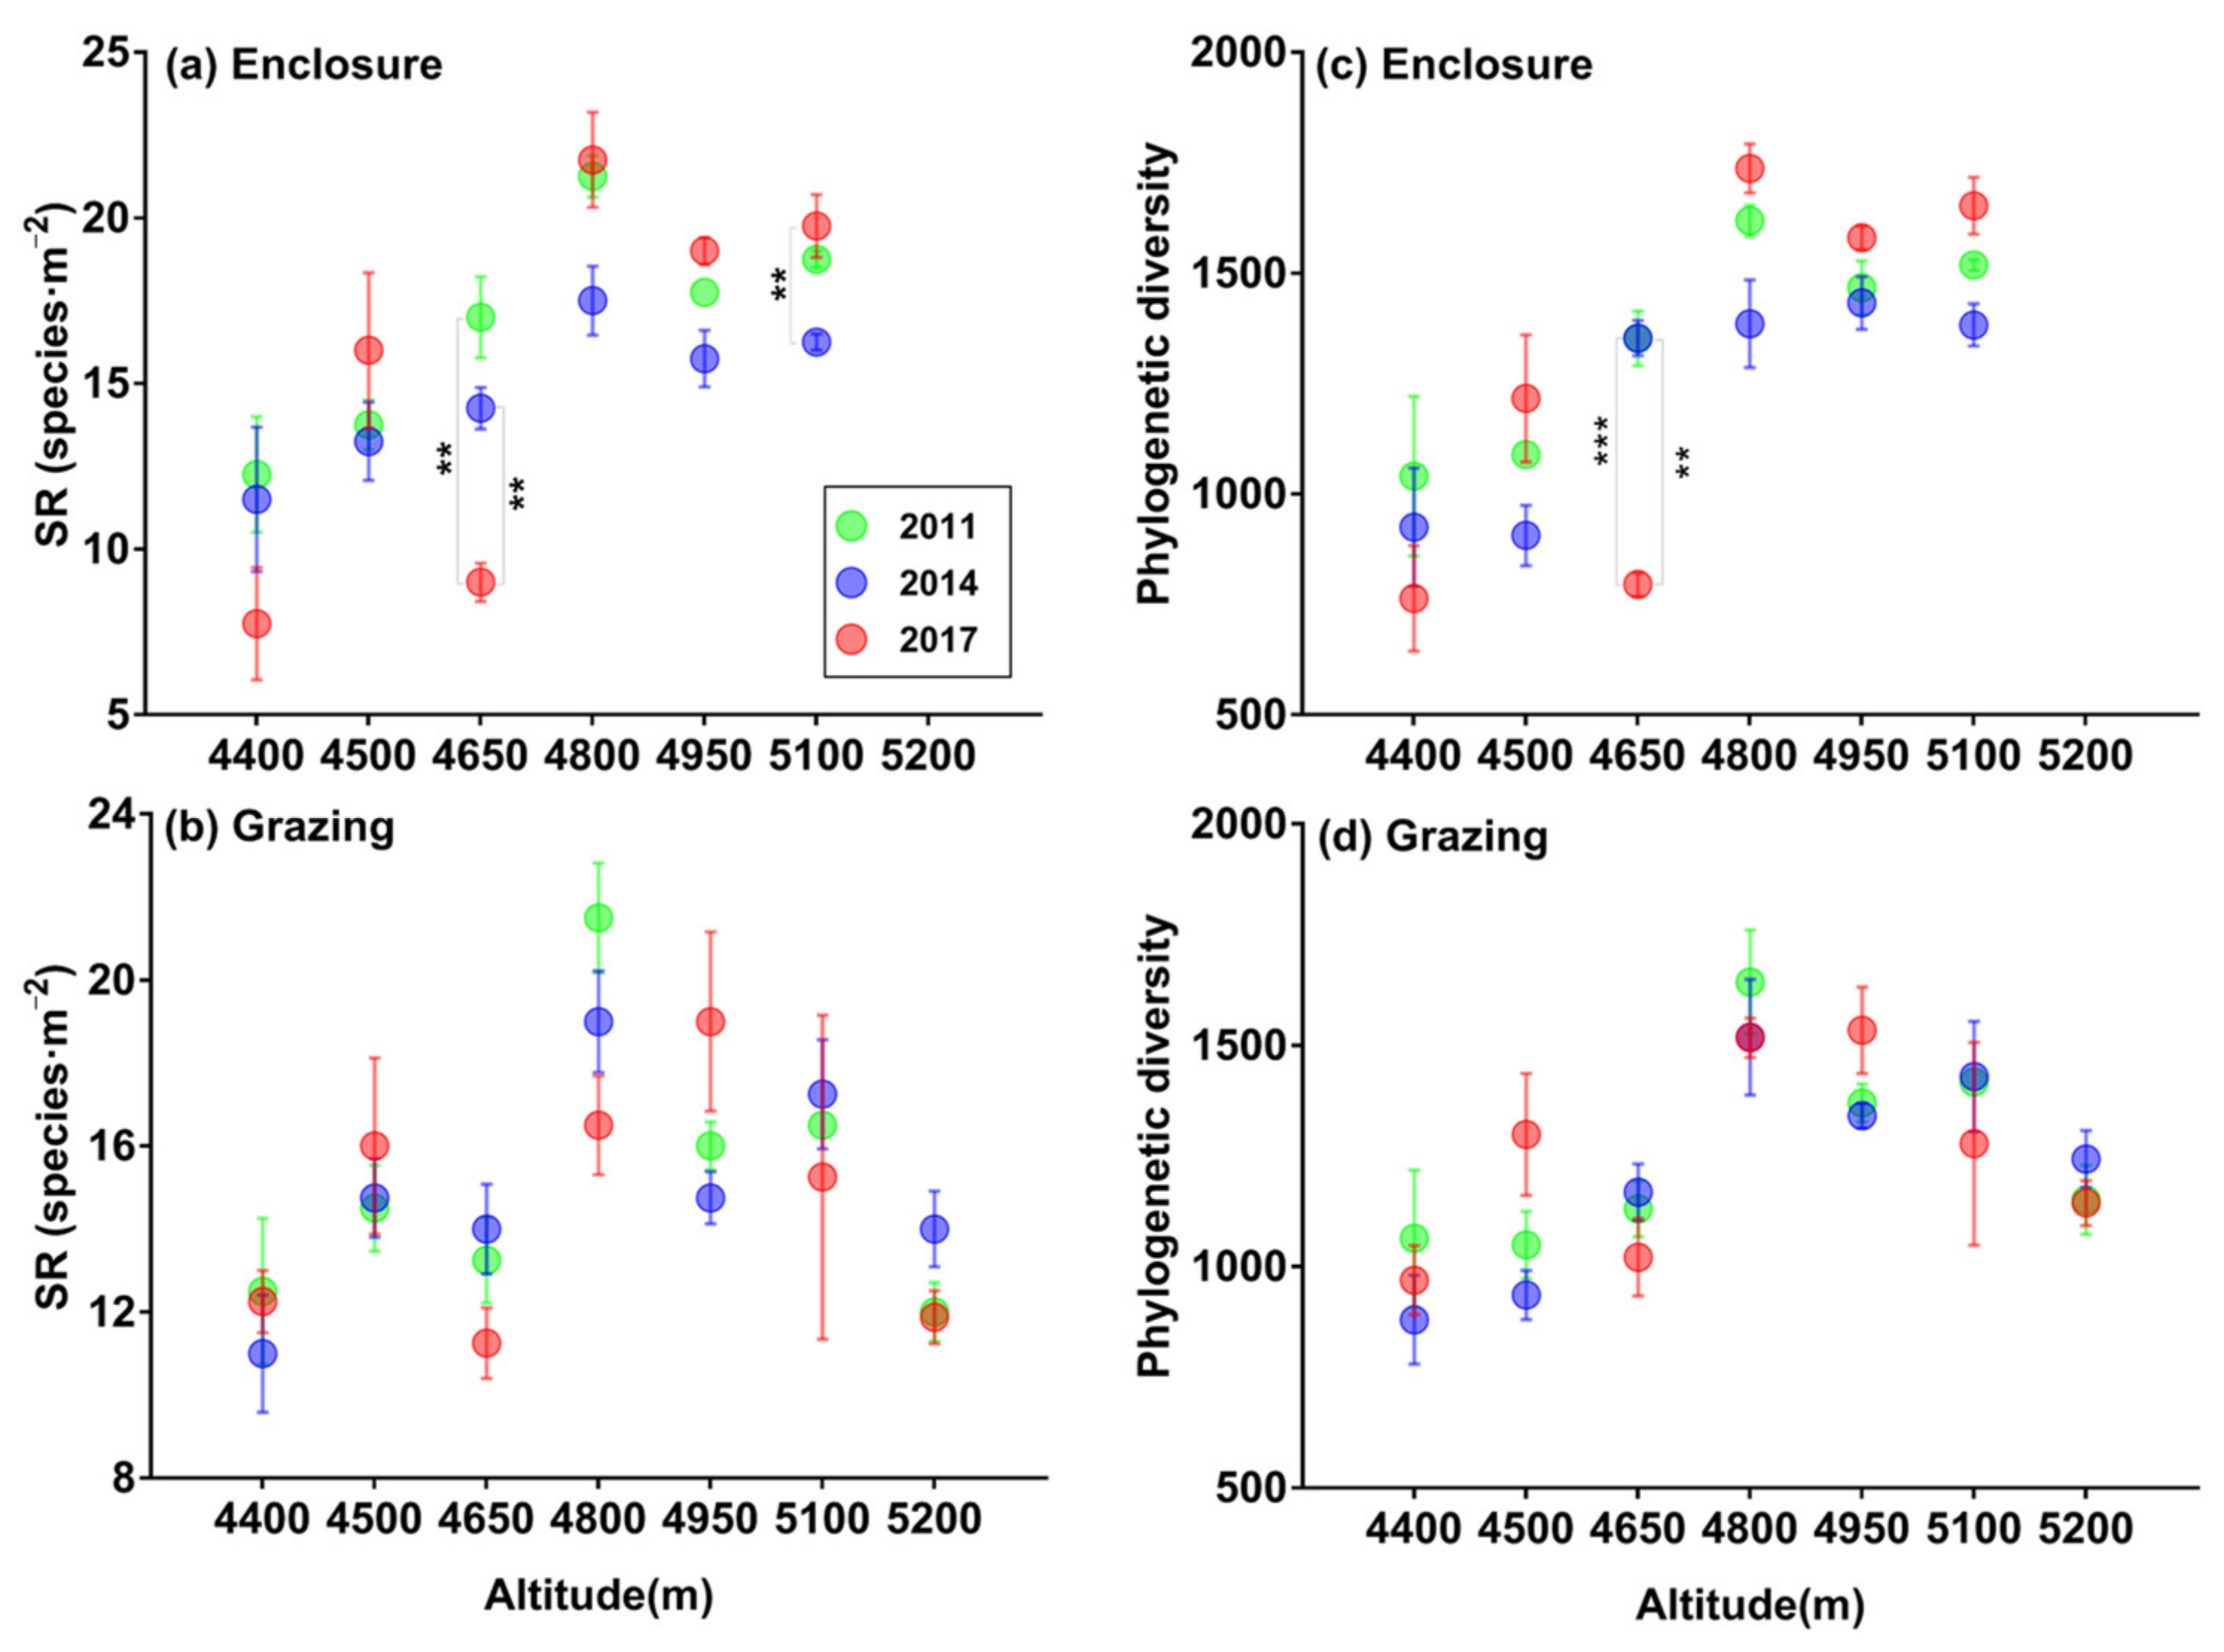
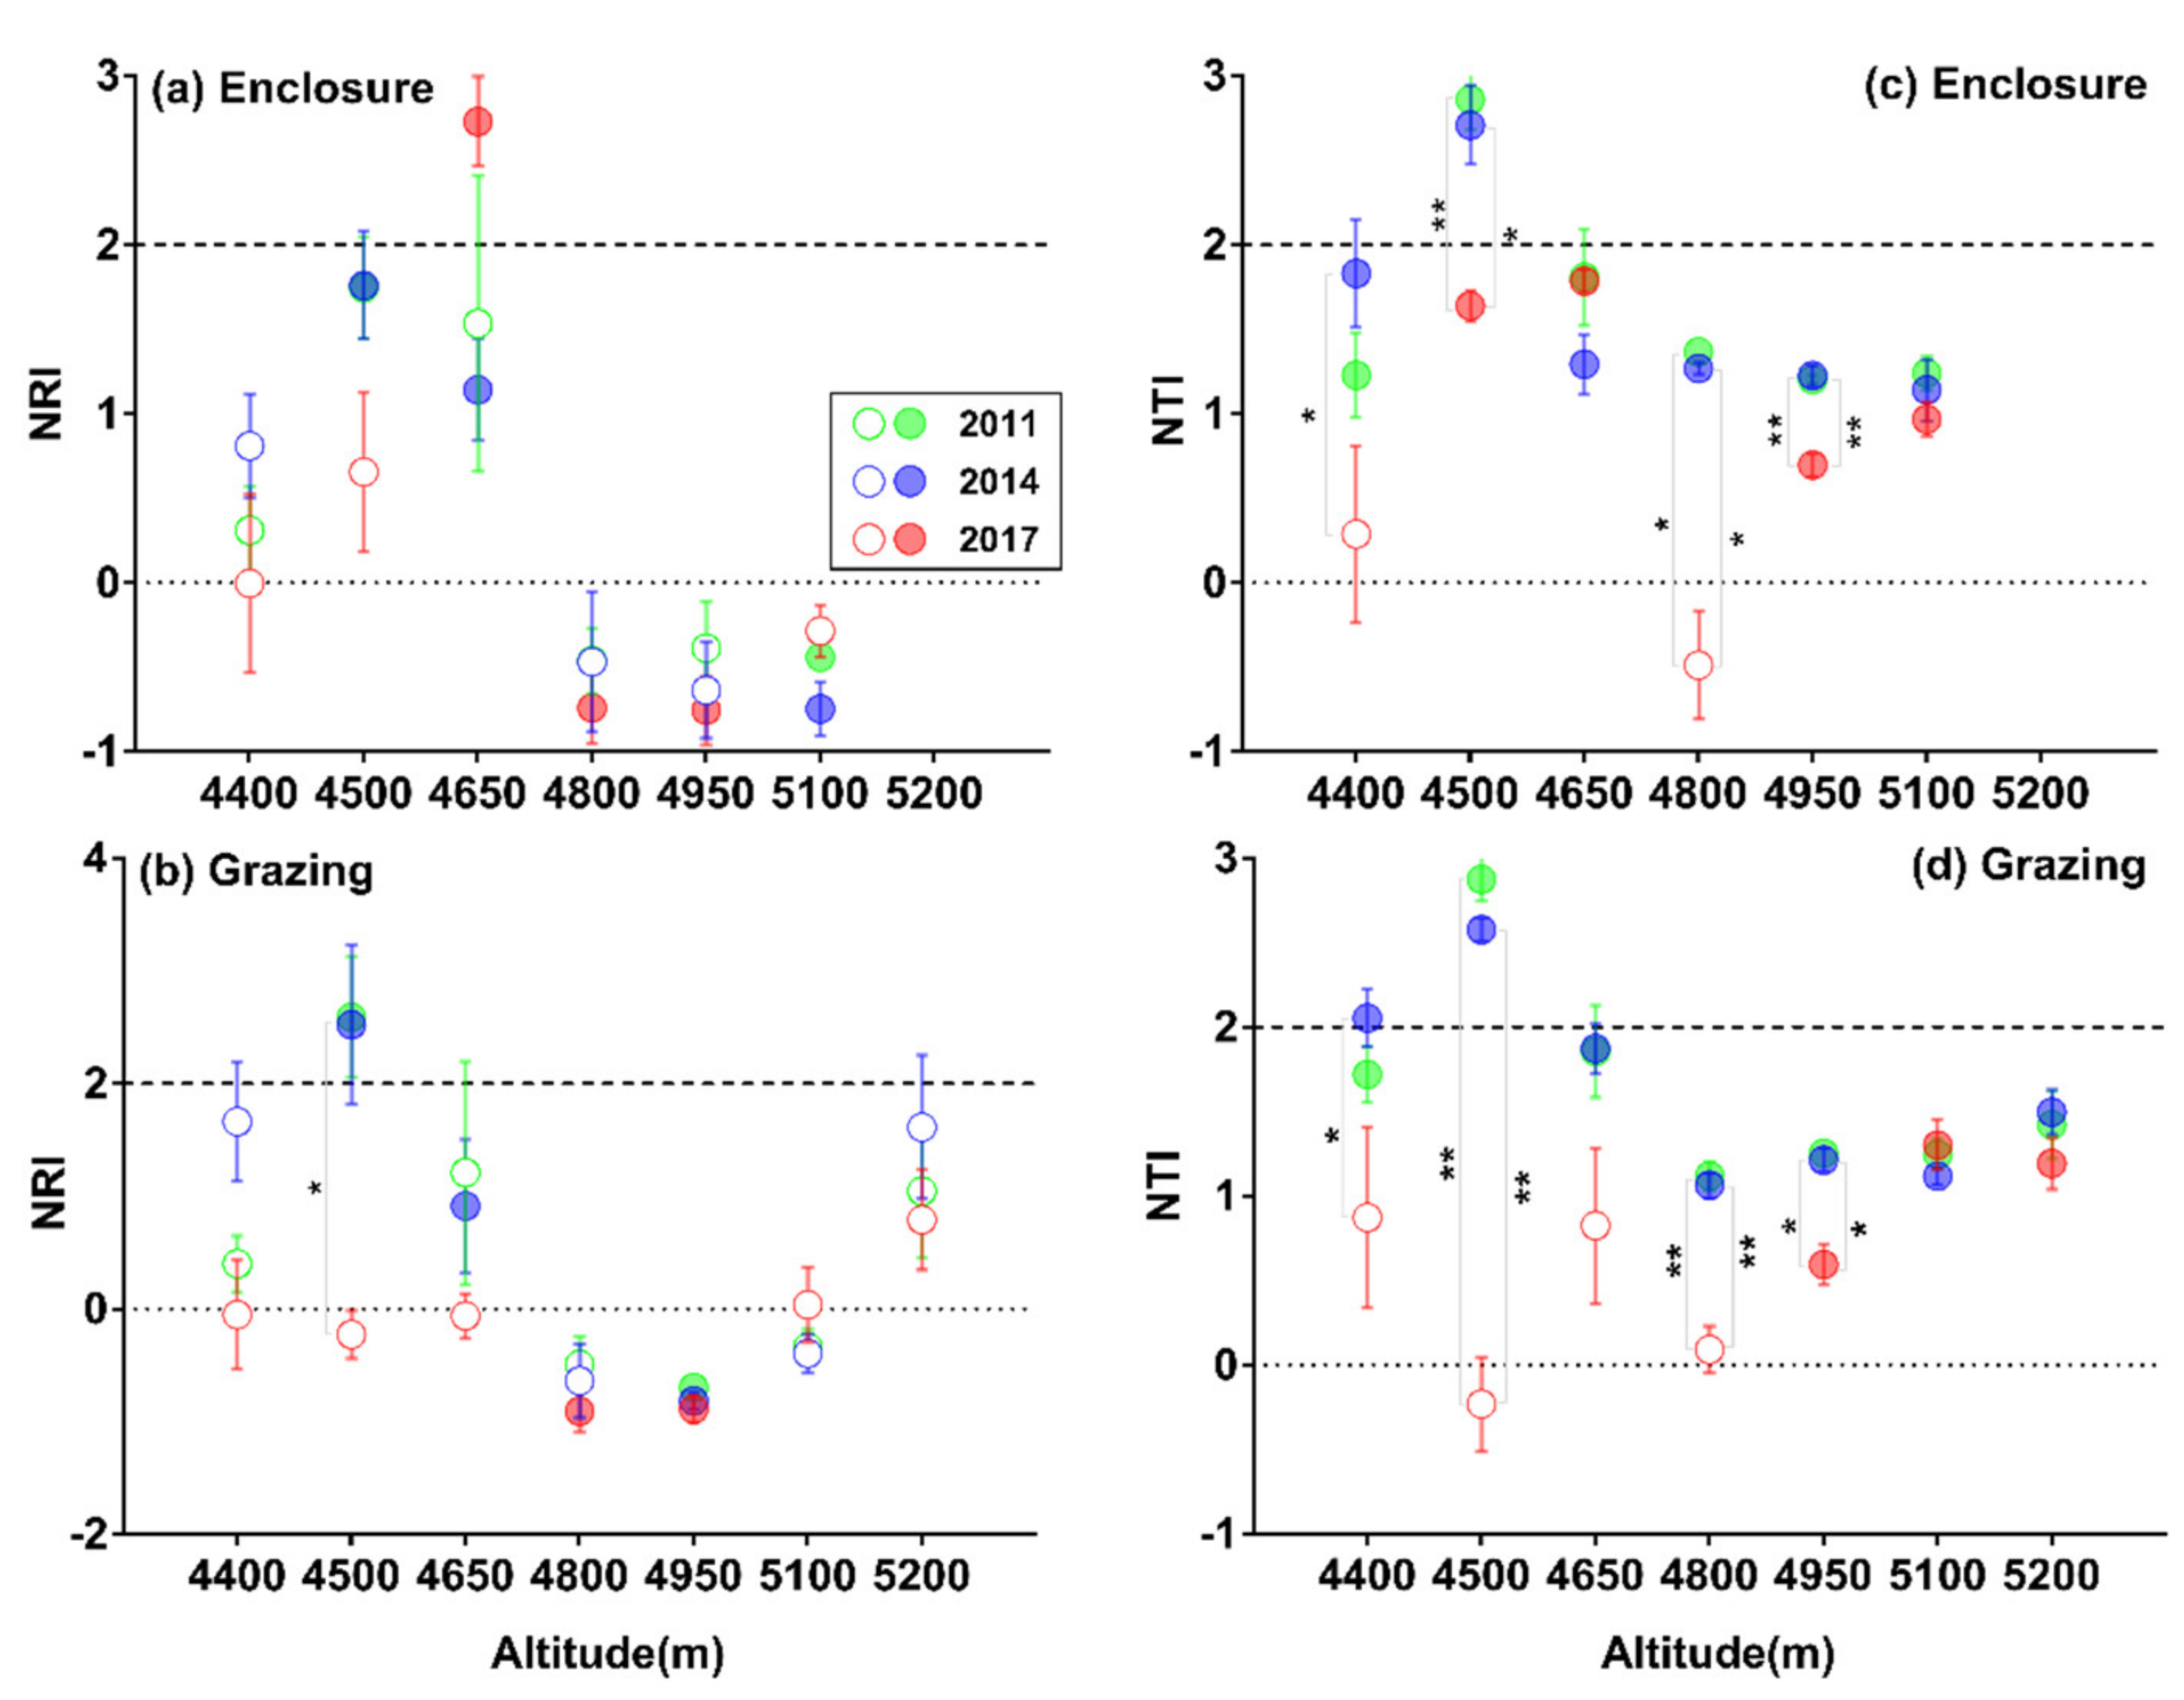
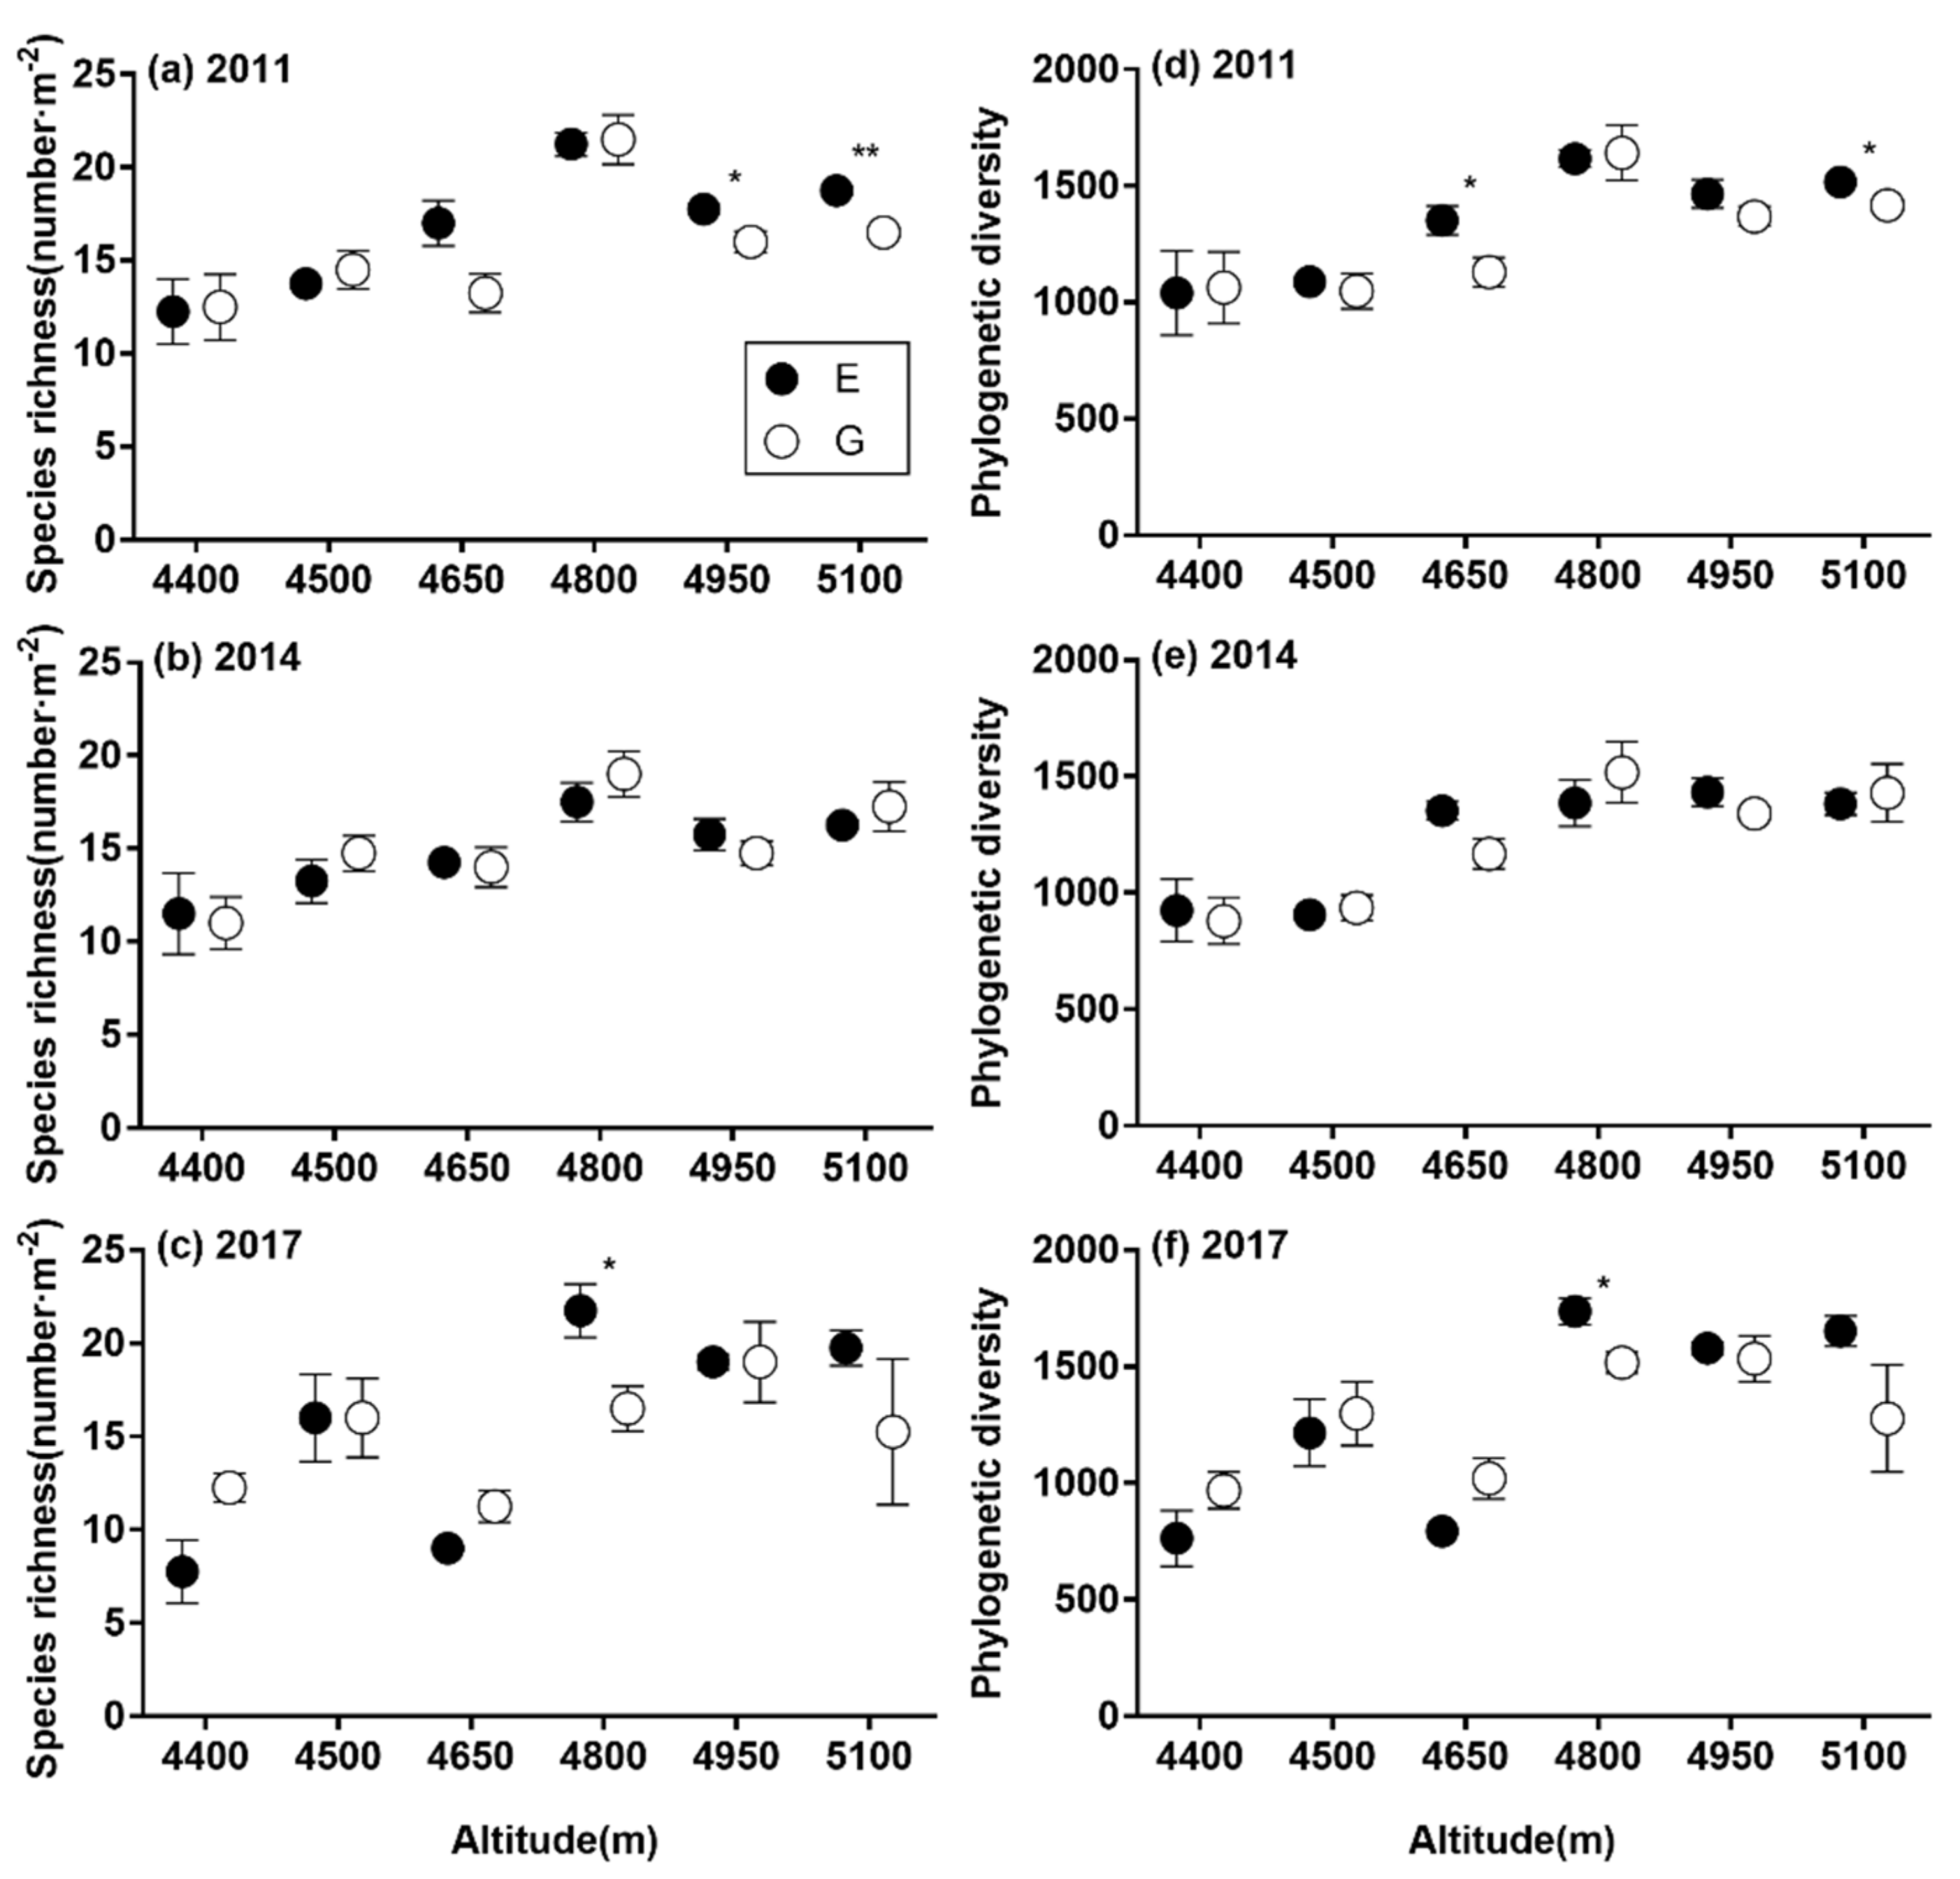
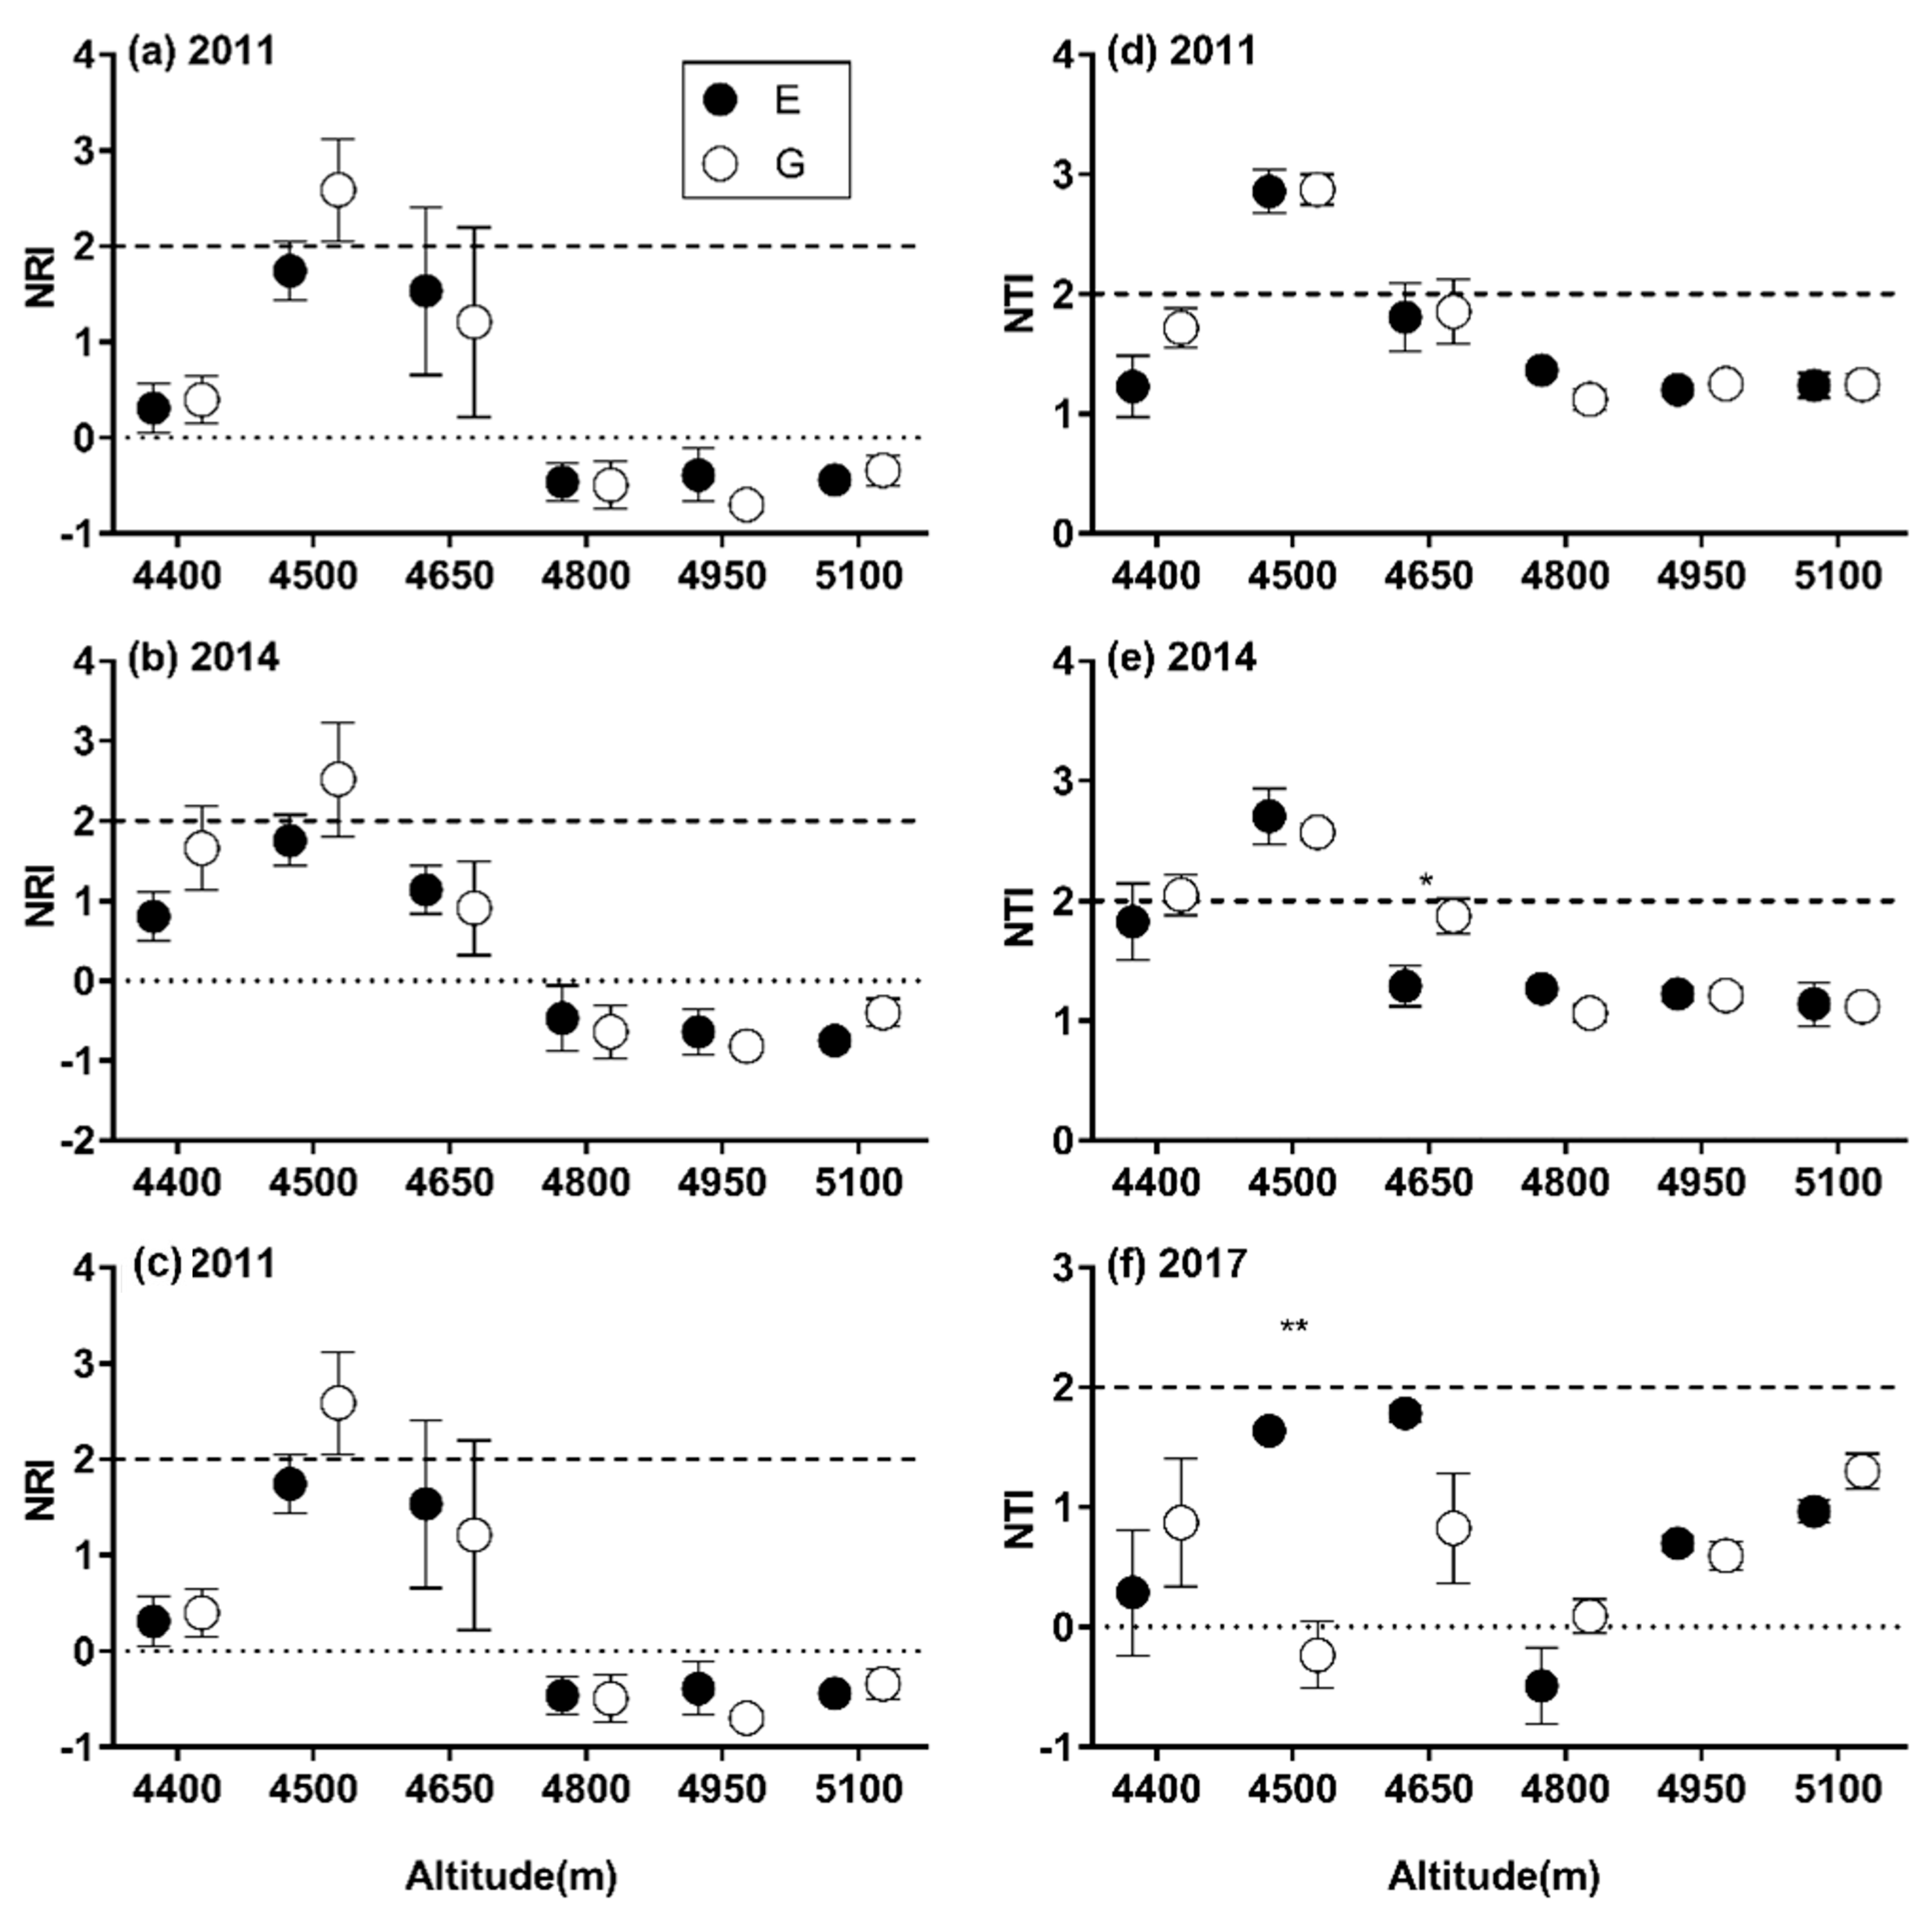
3.2. Patterns of SR and α-phylogenetic Indices

There was an approximate unimodal pattern of SR and PD along the altitudinal gradient no matter grazing or not. SR ranged from 7.75 ± 1.70 (at 4400 m in 2017) to 21.75 ± 1.44 (at 4800 m in 2017) within the fences, and from 11.00 ± 1.41 (4400 m in 2014) to 21.50 ± 1.32 (4800 m in 2011) outside the fences (Figure 2a,b). PD ranged from 763.43 ± 119.55 (4400 m in 2017) to 1736.77 ± 55.68 (4800 m in 2017) within the fences, and from 879.79 ± 100.30 (4400 m in 2014) to 1642.67 ± 117.88 (4800 m in 2011) outside the fences, resembled that of SR (Figure 2c,d). However, there was no consistent pattern in NRI and NTI along the gradient. NRI ranged from −0.76 ± 0.20 (4950 m in 2017) to 2.73 ± 0.27 (4650 m in 2017) within the fences, and from −0.91 ± 0.18 (4800 m in 2017) to 2.60 ± 0.54 (4500 m in 2011) outside the fences (Figure 3a,b). NTI ranged from −0.49 ± 0.32 (at 4800 m in 2017) to 2.89 ± 0.27 (at 4500 m in 2011) within the fences and from −0.23 ± 0.28 (4500 m in 2017) to 2.87 ± 0.27 (4500 m in 2011) outside the fences (Figure 3c,d).
There existed significant interannual variations for these indicators. For example, SR and PD in fenced plots at 4650 m sharply decreased in 2017 compared with 2011 and 2014. NRI in grazing plots at 4500 m decreased significantly in 2017. NTI at 4400 m, 4500 m, 4800 m and 4950 m tended to decrease during the restoration period.
During the investigation period, there was no significant difference in SR between inside and outside the fence at most altitudes, except a few cases (e.g., those at 4950 m and 5100 m in 2011, and 4800 m in 2017, SR inside the fence was higher than that outside) (Figure 4a–c). Similar to the findings of SR, no significant difference was found in PD between inside and outside the fence at most altitudes, except a few cases (e.g., those at 4650 m and 5100 m in 2011, and 4800 m in 2017, PD was higher inside than outside the fence) (Figure 4d–f). There was no significant difference in NRI and NTI between inside and outside the fence at most altitudes (Figure 5).
In summary, SR and PD were relatively higher at higher altitudes (4800~5100 m). Based on the data of NRI, the pattern of the phylogenetic structure was divergent or random at higher altitudes (4800~5100 m) (NRI ≤ 0). At lower altitudes (4400~4650 m) and the highest altitude (5200 m), the pattern of the phylogenetic structure was relatively clustered (NRI > 0). And for NTI, the aggregation structure of closely related species was common (NTI > 0) along the altitudinal gradient.

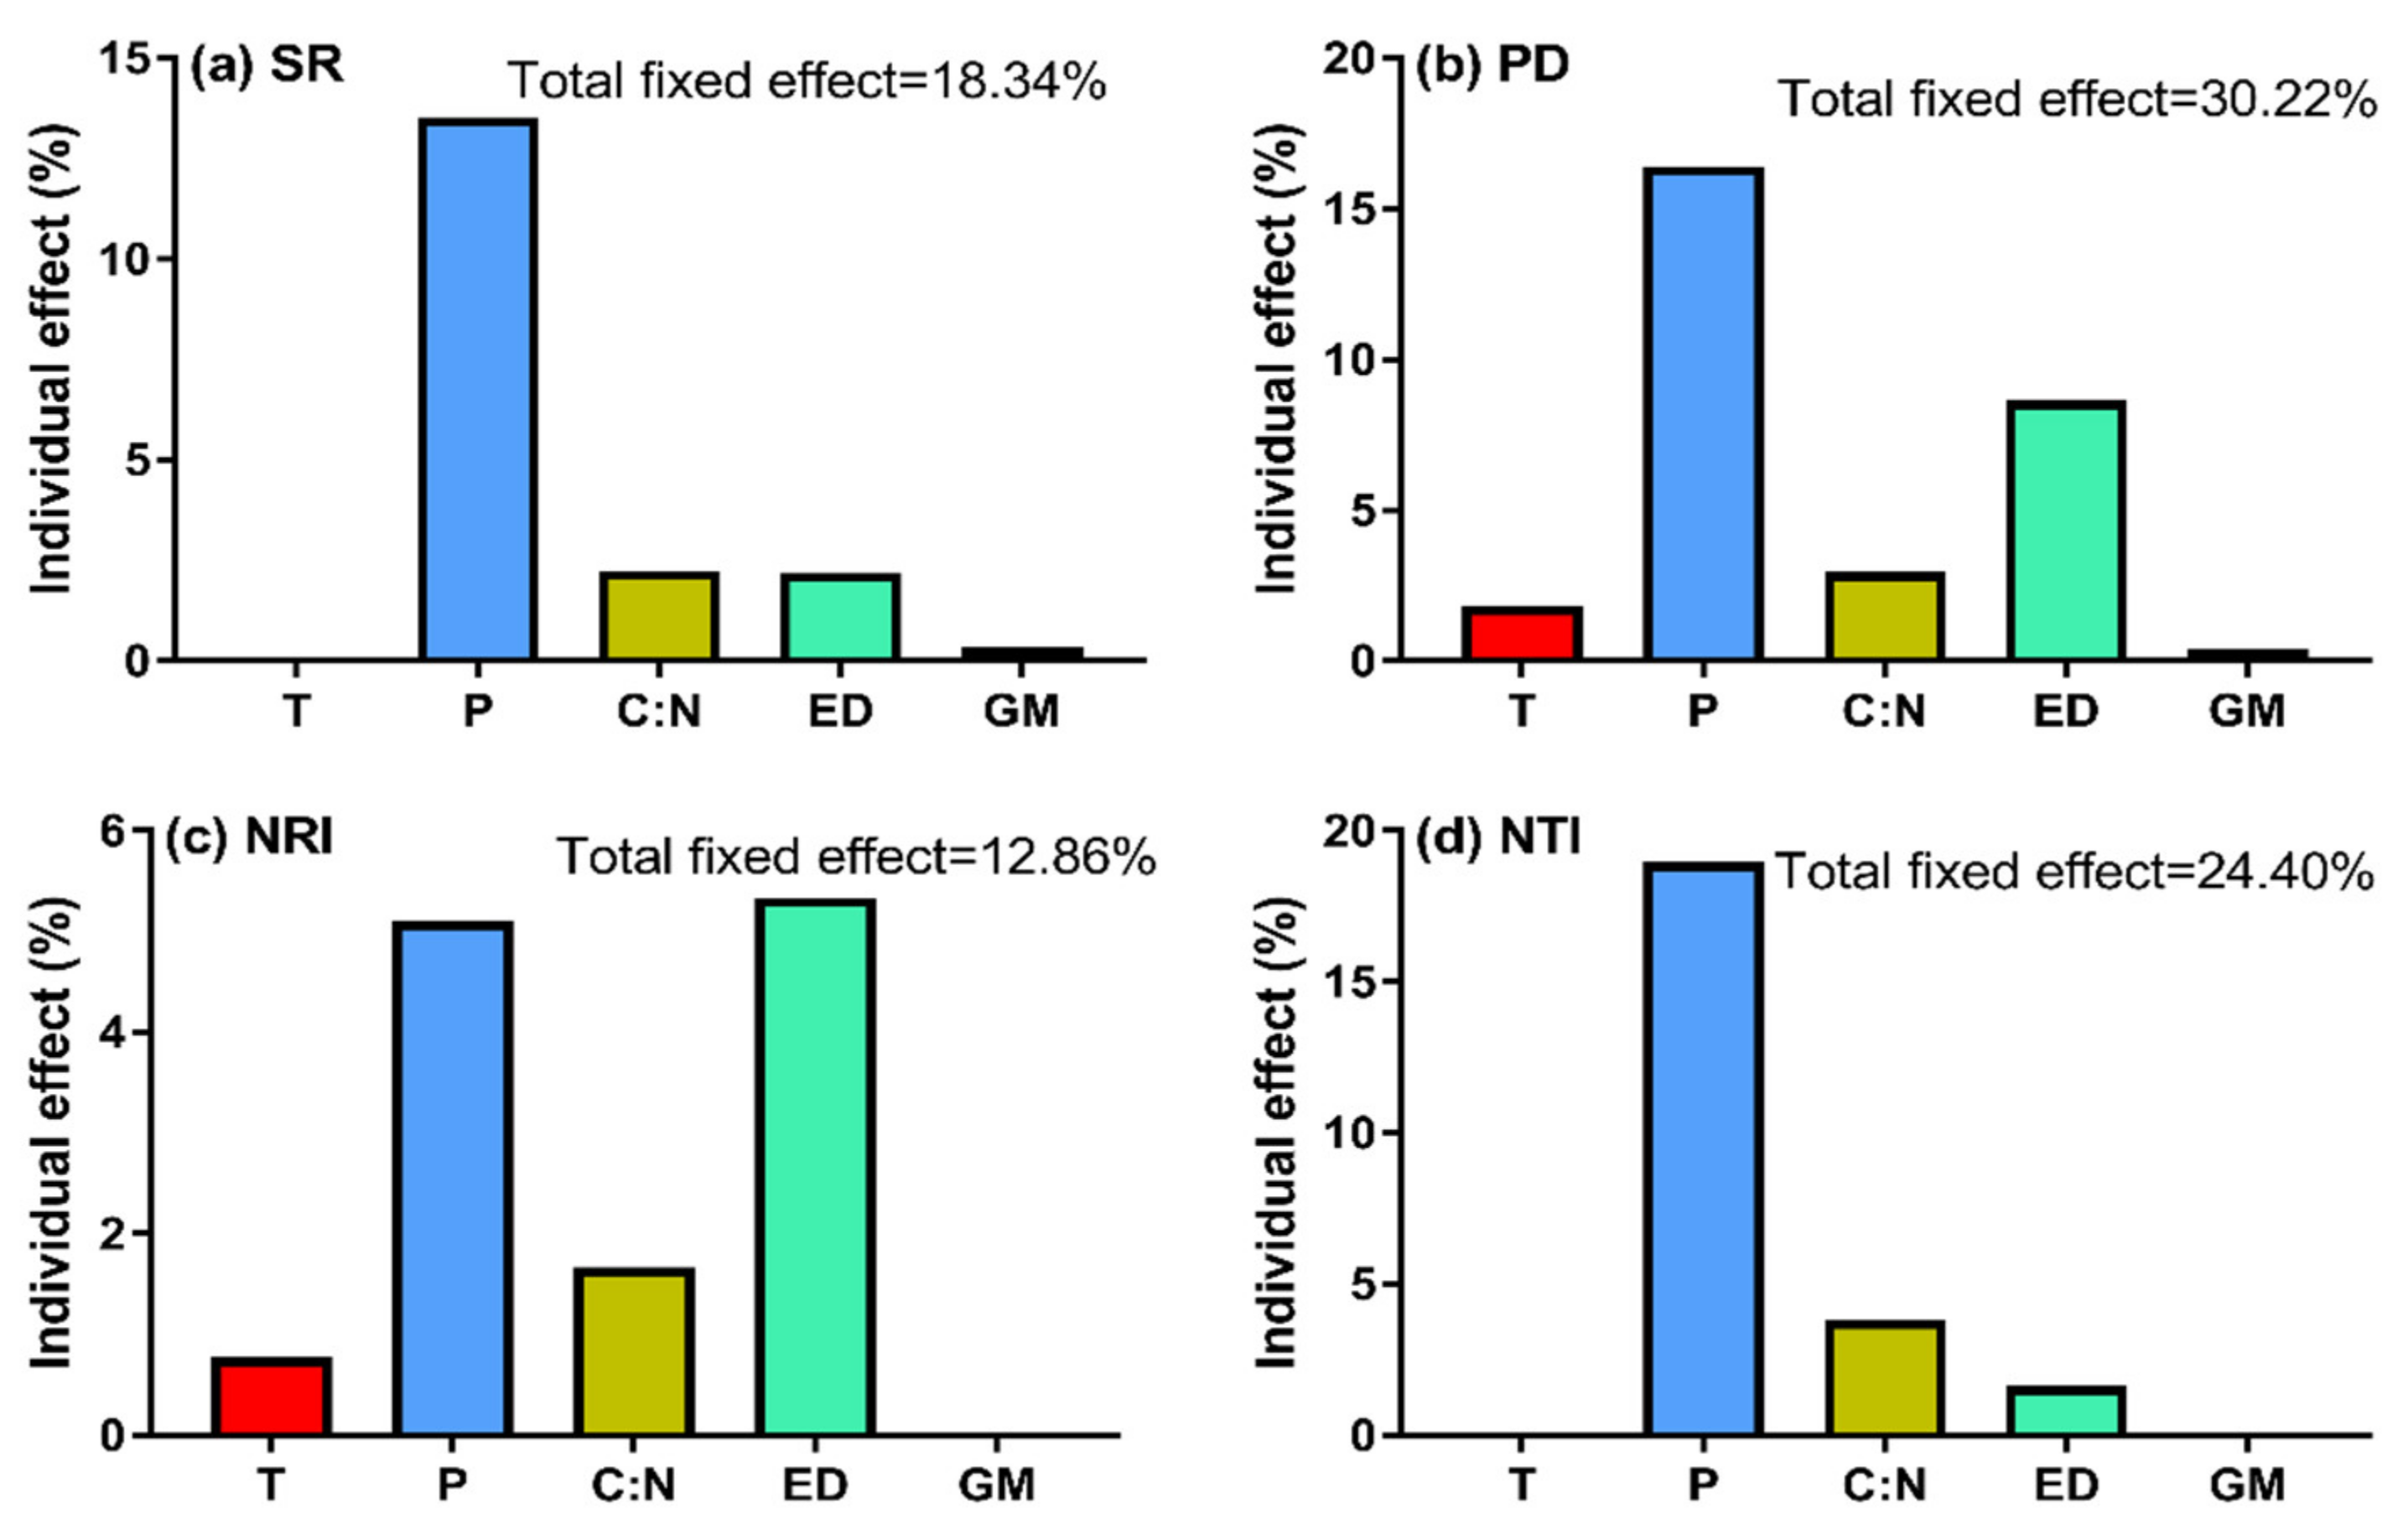
3.3. The Relative Impacts of Grazing Management, Duration of Enclosure and Environmental Factors on SR and α-phylogenetic Indices

Mantel test found that both taxonomic and phylogenetic signals of alpine grassland community along the gradient reflected a significant correlation with environmental factors (Figure S4), indicating that taxonomic and phylogenetic parameters can indicate the impact of environmental factors on community structure.
According to the established generalized linear model, for the whole altitude gradient, the overall fixed factors impact by the model on SR change was 18.34%. The influence of variation of GSP on SR change was more than 13%, and other factors just explained less than 6.0% (Figure 6a). The overall fixed factors impact by the model on the change of PD was 30.12%, and the influence of variation of GSP on PD change occupied more than half of the total explanations of the model. The second large influential impact was the duration of enclosure and soil C:N ratio which could explain 8.64% and 2.96%, respectively (Figure 6b). The overall fixed factors impact by the model on the change of NRI was 12.86%, and the variance explanations of three influential factors (duration of enclosure, variation of GSP and soil C:N ratio) were 5.33%, 5.10% and 1.66%, respectively (Figure 6c). The fixed factors impact by the model on the change of NTI was 24.40%, and variation of GSP, soil C:N ratio and duration of enclosure had a large impact on the change of NTI, with the variance explanations of 18.96%, 3.81% and 1.63%, respectively (Figure 6d).

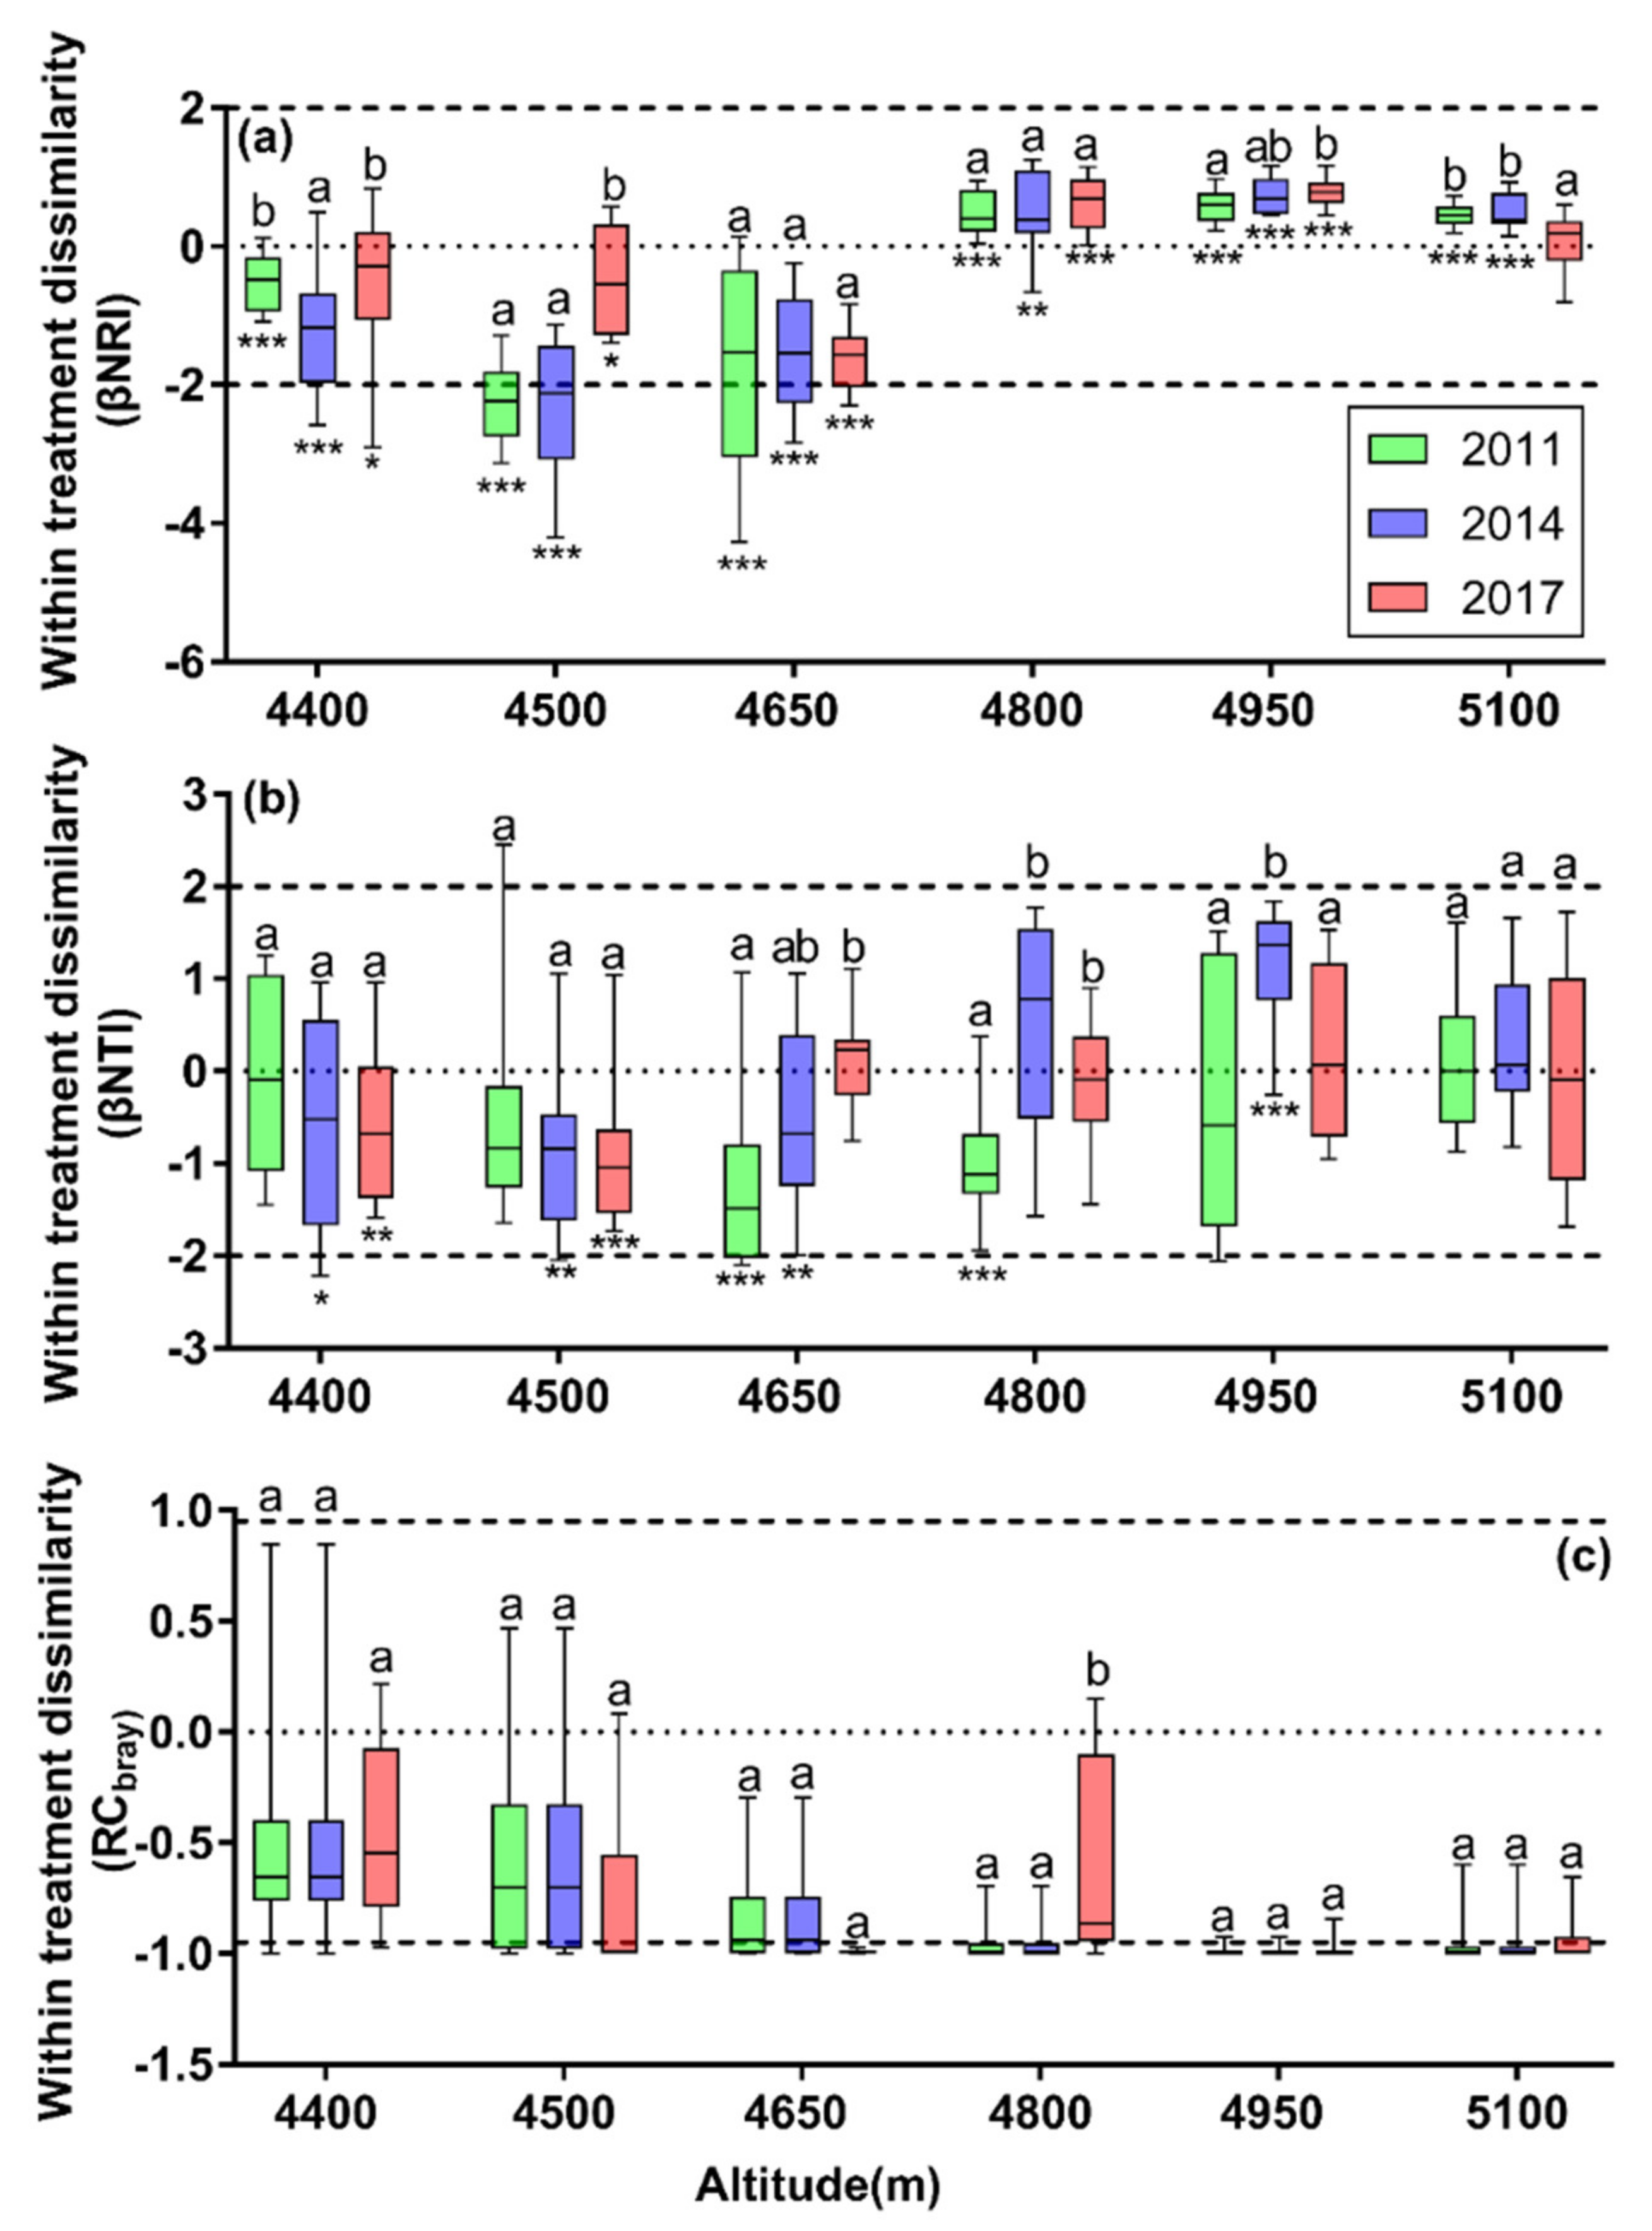
3.4. Patterns of β-phylogenetic Indices between Enclosure and Grazing Plots

In order to estimate the assembly process of plant assemblages in the alpine grassland on the QTP, we calculated the β-phylogenetic indices between the fenced and grazing plots. We found that there were differences in βNRI between 4500 m and other altitudes in 2011 and 2014. The βNRI values of 4500 m in 2011 and 2014 were less than −2, and those of the other plots were between −2~2. Compared with 0 (ecological drift), the values at other altitudes were significantly different from 0 in most cases except that at 5100 m in 2017 (Figure 7a). The βNTI at most sites ranged between −2 and +2 (Figure 7b). Compared with 0 (ecological drift), the frequency of insignificant difference of βNTI was higher at high altitudes. RCbray was negative at all altitudes, and was less than −0.95 from 4650 m to 5100 m in most years (Figure 7c). In addition, the β-phylogenetic indices showed significant inter-annual differences, e.g., βNRI at 4400 m, 4500 m, 4950 m and 5100 m, βNTI from 4650 m to 4950 m, and RCbray at 4800 m (Figure 7).

4. Discussion

Biodiversity plays a key role in maintaining and enhancing ecosystem structure, function and stability [62,63]. Therefore, biodiversity has long been the research hotspot in ecology and evolution. However, most studies concentrated on taxonomic diversity, which would lose some dimensions of biodiversity [64], and taxonomic always introduces polyphyletic groups that lead to frequent failure of taxonomic groupings to map onto ecologically relevant issues [56]. In contrast, phylogenetic diversity combines information from taxonomy and species’ evolutionary history, and therefore better represents ecological variation in functional traits and greatly expands the depth of biodiversity research [13,65,66]. In this study, SR was used to characterize the taxonomic diversity of the community, and PD, NRI and NTI were used to characterize the phylogenetic diversity of the community. For the community phylogenetic structure, this study found that NTI was generally more aggregated than NRI. Some researchers believed that the calculation method of the phylogenetic index may explain this difference [61,67], since NRI represents the overall structural pattern of the entire phylogenetic tree, while NTI focuses more on the top of the branches [1]. Therefore, NTI shows a stronger display of a uniform dispersion signal, for the similarity of the close relatives is much smaller than other species from the whole phylogenetic tree in the community. This is exactly supported by the current study. It is suggested that the ecological niche evolution has been relatively conservative and the relatively close species are generally more adapted to similar environments, although rapid uplift processes and repeated ice ages on the QTP have shaped a relatively high species diversity in this region, ultimately leading to aggregation of NTI.
Enclosures are the most common management tool for grassland restoration, and many experiments have shown that enclosures can improve grassland productivity and promote the restoration of species richness [68,69,70]. In general, large-scale environmental factors (i.e., climate factors of temperature or precipitation) select species from the regional species pool [71], while small-scale environmental factors (i.e., species interaction grazing/enclosure) generate further filtering [72]. In our study, we found that different pasture management had no significant effect on species richness, phylogenetic diversity, and phylogenetic structure across the altitudinal gradient (Figure 6). However, in certain altitudes, there is a controversy of different patterns of SR and NRI/NTI between enclosure and grazing treatment to some degree. Calculation formulas of NRI and NTI need to weigh the relative coverage of each species, while SR and PD do not need to do that, and so highlight rare species [73,74]. After a 11-year restoration, the species interactions might also exert an impact on NRI/NTI differences inside fences. And the high intensity of competition (e.g., light, water and nutrient competition) between dominant species and auxiliary species in the fence may lead to the consequence of NRI/NTI differentiation between outside and inside the fence, which is consistent with the results of enclosure shrub invasion plots in temperate grasslands in northern China [42]. In addition, we found that in 2017, compared to the other two years of the investigation, there was a significant decrease in the degree of aggregation of the phylogenetic structure outside the fence at low altitudes close to the settlement (Figure 3), which may be related to the strengthening of local environmental protection and the reduction of grazing pressure. As for the large difference in SR between inside and outside the high-altitude fences, it may be affected by grazing. And there are more rare species in the fence, which may lead to the differences at higher altitudes in some years. At low altitudes, due to long-term high-intensity grazing, the phenomenon of lack of rare species may be caused by the local seed bank. Even if the coverage of species inside and outside the fence is different, there is little difference in species richness. In brief, compared with SR and PD, NRI and NTI can reflect the impact of grazing on community structure, i.e., the impact of grazing interference at lower altitudes is greater than at higher altitudes.
Strong environmental gradients are powerful ways to study natural selection, especially in alpine ecosystems where environmental filtering is often recognized to be the only main driver of community assembly [75]. In this study, we found that the effect of precipitation on species richness, phylogenetic diversity and community phylogenetic structure were greater than that of temperature, consistent with our previous findings on aboveground biomass (unpublished data). Additionally, studies from alpine meadows in northern Tibet and wetland plants in the QTP concluded that plant species richness and phylogenetic diversity in arid and semi-arid areas of the QTP were mainly driven by precipitation [61,76]. However, Zhang found that temperature was the dominant environmental factor affecting the phylogenetic structure of alpine meadow communities compared to precipitation, and that the low temperature is the dominant force of natural selection [76]. Our study showed that in arid and semi-arid ecosystems of the QTP, although plants are exposed to low-temperature stress, precipitation is more likely a limited resource that may help maintain greater community coverage and species diversity. For the community phylogenetic structure in the middle and low altitudes ( ≤ 4650 m), relatively higher temperature and lower precipitation as the environmental filter caused a decrease in soil water availability, and the community was mainly composed of species like Stipa and Gramineae with relatively deep root systems as the co-dominant species, leading to an aggregated pattern of community phylogenetic structure. However, at middle and high altitudes (4800–5100 m) with more abundant precipitation and higher soil moisture availability, the species richness was also higher, and the interspecific competition effects might be relatively strong, leading to a relatively divergent community phylogenetic structure. In addition, the aggregation pattern of the community phylogenetic structure near the highest altitude of the grass line (5200 m), was more likely to be related to temperature, as cold temperature is often accompanied by more frequent meteorological extremes including frost and hail, especially at the upper edge of the grassland distribution [77]. Furthermore, only a small number of cold-tolerant species that can share similar environmental adaptation strategies were eventually selected by nature. Moreover, it has also been shown that the relative importance of environmental factors on phylogenetic structure increases as the species pool decreases [78], ultimately leading to the aggregation of community phylogenetic structure at lower and higher altitudes. In general, we found that the environmental filtering factors were not influential as proposed to affect species richness, phylogenetic diversity, and phylogenetic indices to a high degree, partly consistent with Qian who argued that shrubs and herbs are less sensitive to climate compared to trees and attributed this to their smaller sizes as they can be sheltered by micro-habitat effects [67]. However, the patterns of NRI and NTI along altitudinal gradient still suggested that the sometimes-questionable dogma-habitat filtering may lead to phylogenetic clustering, and that competitive exclusion will lead to phylogenetic overdispersion [55,79].
Most studies have shown that competitive exclusion dominates community assembly in climax communities in arid and semi-arid regions [80,81,82], while some researchers believe that the environmental filtering processes drive community assembly in degraded communities [83,84]. Meanwhile, more and more studies have pointed out that stochastic processes affect grassland community composition and structure [85,86,87,88]. However, studies on the changes in plant community phylogenetic structure of alpine grassland during the restoration period are still limited. Overall, the deterministic ecological processes affecting community assembly include heterogeneous and homogeneous selection, and the stochastic processes include homogeneous dispersal, dispersal limitation and ambiguous processes [14,20,22,26,60]. In this study, at most altitudes, the pattern of phylogenetic βNTI indicated that the community assembly was mainly determined by stochastic processes. Additionally, according to the values of RCbray andβNRI, the similarity of communities between inside and outside the fence is relatively low at lower altitudes (4400–4650 m), which infers that the stronger grazing pressure leads to differences in the community structure between inside and outside. This is especially true at 4500 m, where grazing pressure was the highest and homogeneous selection occurred in the fifth and eighth year after enclosure. At 4500 m, even after 8 years of enclosures, the environment still showed homogenization whether inside or outside the fences, and the effect of enclosure on community assembly remained insignificant. As homogenization is an important form of biotic impoverishment, it may lead to an increased risk of species extinction and reduce the resilience of the system to large-scale disturbances [89,90]. Until 10 years after enclosure, stochastic processes became dominant in determining the variability of community structure, which reveals that short-term restoration may not restore community structure to a normal state in areas of intense grazing, and the threshold of enclosure duration was similar to the result from an enclosure restoration experiment (13 years from unhealthy stage to health stage) of typical steppe in Northern China [91]. For the middle and high altitudes where grazing pressure was lower, the similarity of the communities between inside and outside the fence was very high, and homogenous dispersal occurred, indicating that the current grazing intensity exerts no significant impact on the community structure in this area. Overall, the results suggested that grassland management should be formulated rationally and depended on different situations. For instance, grazing intensity needs to be reduced at middle and low altitudes, especially at 4500 m which is closest to the settlement (Figure S1), and fencing management can be appropriately decreased at middle and high altitudes.
In most studies, the conserved hypothesis of ecological niche is the basis for inferring ecological processes [14,20,26]. However, we found that phylogenetic signals behaved well in remote relatives rather than in close relatives, albeit with a slight difference under the taxonomic view (Figure S4), which led to some uncertainties in the study. For example, the phylogenetic timing of most species at the genus level (Saussurea, Kobresia) and even at the family level may have contributed to this problem. In the future, we need improvements in technology to address the high resolution of the evolutionary history of species.
Although this study pointed out that the stochastic process dominated changes in the community structure of alpine grassland during restoration and identified the specific factors influencing the deterministic processes and the relative effects, the superimposed and antagonistic effects of environmental filtering and biological interactions may also contribute to the emergence of stochastic processes on community assembly [92]. This may depend on the relative importance of ecological niche differences and interspecific differences in competitiveness and/or mutualism [81]. Therefore, future studies need to separate the effects of environmental filtering and interspecific species relationships concisely [72] and refine the effects of deterministic processes on different scales on alpine grassland community assembly.

5. Conclusions

Recently, patterns, processes and mechanisms underlying diversity have raised a colossal interest in ecology. However, there is limited information about human activity regarding plant community assembly in alpine grassland ecosystems. This study attempted to provide insights into different grazing management on the diversity and the community assembly process of alpine grassland on the QTP. We found that the overall phylogenetic structure of the alpine grassland community was divergent at medium and high altitudes (4800–5100 m) where the environment was relatively unextreme. At the lower altitudes (4400–4650 m) with low precipitation, and the highest altitude (5200 m) with low temperature, the phylogenetic structure of the plant community was more aggregative. It seemed that the grassland management exerted little impacts on all the diversity and structure indices. Among the environmental factors, precipitation was the dominant factor affecting these indices. Stochastic processes have driven the changes in the communities between inside and outside the fences. In summary, the 11-year enclosure had little effect on alpine meadow community structure at higher altitudes. However, it could restore the community of steppe meadow at lower altitudes where the grazing pressure is high. For local grazing management, it should be better to relieve the burden of high grazing intensity by reducing the number of livestock below 4700 m, while keeping the current grazing intensity above 4700 m in this area.

Supplementary Materials

The following supporting information can be downloaded at: https://www.mdpi.com/article/10.3390/d14100832/s1, Figure S1: Distribution of fenced plots along the altitudinal gradient in Damxung County, Tibet; Figure S2: Variations in (a) growing season mean temperature (GST) and precipitation (GSP) during 2006–2017 and (b) soil total nitrogen (STN) and soil organic carbon (SOC) along the altitude gradient. Different letters indicate significant differences among the seven altitudes (ANOVA and Tukey HSD test, P < 0.05). Bars indicate SE of the mean.; Figure S3: The relative coverage of common genera along the altitude gradient.; Figure S4: Relationships between (a) taxonomic and (b) phylogenetic Bray–Curtis similarity of communities and the standardized Euclidean distance of environmental factors (including temperature, precipitation, soil C:N ratio, year of enclosure and grazing management treatments). The Mantel test was used to examine the correlations between pairwise Bray–Curtis similarity and pairwise differences in environmental factors, indicating taxonomic and phylogenetic signal test for ecological niche differences. The solid circles indicate significant signals (p ≤ 0.05).

Author Contributions

Conceptualization, Z.D.; methodology, Z.D.; software, Z.D.; validation, T.L.; formal analysis, Z.D.; investigation, Z.W., R.L., J.Z. and Z.D.; resources, T.L.; data curation, Z.D.; writing—original draft preparation, Z.D.; writing—review and editing, Z.D., J.Z., T.L., Z.W. and L.Z.; visualization, Z.D. and Y.G.; supervision, T.L. and L.Z.; project administration, T.L.; funding acquisition, T.L. All authors have read and agreed to the published version of the manuscript.

Funding

The National Natural Science Foundation of China (41830649) and the 2nd Tibetan Plateau Scientific Expedition and Research Program (2019QZKK0106) provided financial support.

Institutional Review Board Statement

Not applicable.

Data Availability Statement

All data used in the manuscript are already publicly accessible, and we provided the download address in the manuscript.

Acknowledgments

We would like to thank X Li and students at Lanzhou University and Tibet University, who engaged in investigation field work, and M Du and X Zhang for their help with the meteorological observations.

Conflicts of Interest

The authors declare no conflict of interest.

References

  1. Kraft, N.J.; Cornwell, W.K.; Webb, C.O.; Ackerly, D.D. Trait evolution, community assembly, and the phylogenetic structure of ecological communities. Am. Nat. 2007, 170, 271–283. [Google Scholar] [CrossRef] [PubMed]
  2. Arnillas, C.A.; Borer, E.T.; Seabloom, E.W.; Alberti, J.; Baez, S.; Bakker, J.D.; Boughton, E.H.; Buckley, Y.M.; Bugalho, M.N.; Donohue, I.; et al. Opposing community assembly patterns for dominant and nondominant plant species in herbaceous ecosystems globally. Ecol. Evol. 2021, 11, 17744–17761. [Google Scholar] [CrossRef] [PubMed]
  3. Gleason, H.A. The Individualistic Concept of the Plant Association. Bull. Torrey Bot. Club 1926, 53, 7. [Google Scholar] [CrossRef]
  4. Elton, C.S. The Ecology of Animals; Methuen: London, UK, 1933. [Google Scholar]
  5. Sale, P.F. Maintenance of High Diversity in Coral Reef Fish Communities. Am. Nat. 1977, 111, 337–359. [Google Scholar] [CrossRef]
  6. Chesson, P.L.; Warner, R.R. Environmental variability promotes coexistence in lottery competitive systems. Am. Nat. 1981, 117, 923–943. [Google Scholar] [CrossRef]
  7. Chesson, P. Mechanisms of maintenance of species diversity. Annu. Rev. Ecol. Syst. 2000, 31, 343–366. [Google Scholar] [CrossRef] [Green Version]
  8. Hubbell, S.P. The Unified Neutral Theory of Biodiversity and Biogeography; Princeton University Press: Princeton, NJ, USA, 2001; Volume 32. [Google Scholar]
  9. Adler, P.B.; Hillerislambers, J.; Levine, J.M. A niche for neutrality. Ecol. Lett. 2007, 10, 95–104. [Google Scholar] [CrossRef] [Green Version]
  10. Rosindell, J.; Hubbell, S.P.; He, F.; Harmon, L.J.; Etienne, R.S. The case for ecological neutral theory. Trends Ecol. Evol. 2012, 27, 203–208. [Google Scholar] [CrossRef]
  11. Dini-Andreote, F.; Stegen, J.C.; van Elsas, J.D.; Salles, J.F. Disentangling mechanisms that mediate the balance between stochastic and deterministic processes in microbial succession. Proc. Natl. Acad. Sci. USA 2015, 112, 1326–1332. [Google Scholar] [CrossRef] [Green Version]
  12. Kembel, S.W. Disentangling niche and neutral influences on community assembly: Assessing the performance of community phylogenetic structure tests. Ecol. Lett. 2009, 12, 949–960. [Google Scholar] [CrossRef]
  13. Srivastava, D.S.; Cadotte, M.W.; MacDonald, A.A.; Marushia, R.G.; Mirotchnick, N. Phylogenetic diversity and the functioning of ecosystems. Ecol. Lett. 2012, 15, 637–648. [Google Scholar] [CrossRef]
  14. Stegen, J.C.; Lin, X.; Fredrickson, J.K.; Konopka, A.E. Estimating and mapping ecological processes influencing microbial community assembly. Front. Microbiol. 2015, 6, 370. [Google Scholar] [CrossRef] [Green Version]
  15. Tripathi, B.M.; Stegen, J.C.; Kim, M.; Dong, K.; Adams, J.M.; Lee, Y.K. Soil pH mediates the balance between stochastic and deterministic assembly of bacteria. ISME J. 2018, 12, 1072–1083. [Google Scholar] [CrossRef]
  16. Maguire, V.G.; Bordenave, C.D.; Nieva, A.S.; Llames, M.E.; Colavolpe, M.B.; Gárriz, A.; Ruiz, O.A. Soil bacterial and fungal community structure of a rice monoculture and rice-pasture rotation systems. Appl. Soil Ecol. 2020, 151, 103535. [Google Scholar] [CrossRef]
  17. Mugnai, M.; Trindade, D.P.F.; Thierry, M.; Kaushik, K.; Hrček, J.; Götzenberger, L. Environment and space drive the community assembly of Atlantic European grasslands: Insights from multiple facets. J. Biogeogr. 2022, 49, 699–711. [Google Scholar] [CrossRef]
  18. Gravel, D.; Canham, C.D.; Beaudet, M.; Messier, C. Reconciling niche and neutrality: The continuum hypothesis. Ecol. Lett. 2006, 9, 399–409. [Google Scholar] [CrossRef] [Green Version]
  19. Chase, J.M.; Myers, J.A. Disentangling the importance of ecological niches from stochastic processes across scales. Philos. Trans. R. Soc. Lond. B Biol. Sci. 2011, 366, 2351–2363. [Google Scholar] [CrossRef] [Green Version]
  20. Stegen, J.C.; Lin, X.; Fredrickson, J.K.; Chen, X.; Kennedy, D.W.; Murray, C.J.; Rockhold, M.L.; Konopka, A. Quantifying community assembly processes and identifying features that impose them. ISME J. 2013, 7, 2069–2079. [Google Scholar] [CrossRef]
  21. Vellend, M. Conceptual synthesis in community ecology. Q. Rev. Biol. 2010, 85, 183–206. [Google Scholar] [CrossRef] [Green Version]
  22. Zhou, J.; Ning, D. Stochastic Community Assembly: Does It Matter in Microbial Ecology? Microbiol. Mol. Biol. Rev. 2017, 81, e00002-17. [Google Scholar] [CrossRef]
  23. Anderson, M.J.; Crist, T.O.; Chase, J.M.; Vellend, M.; Inouye, B.D.; Freestone, A.L.; Sanders, N.J.; Cornell, H.V.; Comita, L.S.; Davies, K.F.; et al. Navigating the multiple meanings of beta diversity: A roadmap for the practicing ecologist. Ecol. Lett. 2011, 14, 19–28. [Google Scholar] [CrossRef]
  24. Hanson, C.A.; Fuhrman, J.A.; Horner-Devine, M.C.; Martiny, J.B. Beyond biogeographic patterns: Processes shaping the microbial landscape. Nat. Rev. Microbiol. 2012, 10, 497–506. [Google Scholar] [CrossRef]
  25. Fukami, T. Historical contingency in community assembly: Integrating niches, species pools, and priority effects. Annu. Rev. Ecol. Evol. Syst. 2015, 46, 1–23. [Google Scholar] [CrossRef] [Green Version]
  26. Ning, D.; Yuan, M.; Wu, L.; Zhang, Y.; Guo, X.; Zhou, X.; Yang, Y.; Arkin, A.P.; Firestone, M.K.; Zhou, J. A quantitative framework reveals ecological drivers of grassland microbial community assembly in response to warming. Nat. Commun. 2020, 11, 4717. [Google Scholar] [CrossRef]
  27. Chen, B.; Zhang, X.; Tao, J.; Wu, J.; Wang, J.; Shi, P.; Zhang, Y.; Yu, C. The impact of climate change and anthropogenic activities on alpine grassland over the Qinghai-Tibet Plateau. Agric. For. Meteorol. 2014, 189, 11–18. [Google Scholar] [CrossRef]
  28. Li, C.; Peng, F.; Xue, X.; You, Q.; Lai, C.; Zhang, W.; Cheng, Y. Productivity and quality of alpine grassland vary with soil water availability under experimental warming. Front. Plant. Sci. 2018, 9, 1790. [Google Scholar] [CrossRef] [Green Version]
  29. Bardgett, R.D.; Bullock, J.M.; Lavorel, S.; Manning, P.; Schaffner, U.; Ostle, N.; Chomel, M.; Durigan, G.; Fry, E.L.; Johnson, D.; et al. Combatting global grassland degradation. Nat. Rev. Earth Environ. 2021, 2, 720–735. [Google Scholar] [CrossRef]
  30. Zhou, L.; Zhu, Y.; Yang, G.; Luo, Y. Quantitative evaluation of the effect of prohibiting grazing policy on grassland desertification reversal in northern China. Environ. Earth Sci. 2013, 68, 2181–2188. [Google Scholar] [CrossRef]
  31. Liu, S.; Wang, T.; Kang, W.; David, M. Several challenges in monitoring and assessing desertification. Environ. Earth Sci. 2015, 73, 7561–7570. [Google Scholar] [CrossRef]
  32. Fu, B.; Ouyang, Z.; Shi, P.; Fan, J.; Wang, X.; Zheng, H.; Zhao, W.; Wu, F. Current condition and protection strategies of Qinghai-Tibet Plateau ecological security barrier. Bull. Chin. Acad. Sci. 2021, 36, 1298–1306. [Google Scholar]
  33. Wei, D.; Ri, X.; Wang, Y.; Wang, Y.; Liu, Y.; Yao, T. Responses of CO2, CH4 and N2O fluxes to livestock exclosure in an alpine steppe on the Tibetan Plateau, China. Plant Soil 2012, 359, 45–55. [Google Scholar] [CrossRef]
  34. Dong, Q.M.; Zhao, X.Q.; Wu, G.L.; Shi, J.J.; Ren, G.H. A review of formation mechanism and restoration measures of “black-soil-type” degraded grassland in the Qinghai-Tibetan Plateau. Environ. Earth Sci. 2013, 70, 2359–2370. [Google Scholar] [CrossRef]
  35. Liu, H.; Mi, Z.; Lin, L.; Wang, Y.; Zhang, Z.; Zhang, F.; Wang, H.; Liu, L.; Zhu, B.; Cao, G.; et al. Shifting plant species composition in response to climate change stabilizes grassland primary production. Proc. Natl. Acad. Sci. USA 2018, 115, 4051–4056. [Google Scholar] [CrossRef] [PubMed] [Green Version]
  36. Shang, Z.; Long, R. Formation causes and recovery of the “Black Soil Type” degraded alpine grassland in Qinghai-Tibetan Plateau. Front. Agri. China 2007, 1, 197–202. [Google Scholar] [CrossRef]
  37. Wu, G.-L.; Du, G.-Z.; Liu, Z.-H.; Thirgood, S. Effect of fencing and grazing on a Kobresia-dominated meadow in the Qinghai-Tibetan Plateau. Plant Soil 2009, 319, 115–126. [Google Scholar] [CrossRef]
  38. Lin, X.; Zhao, H.; Zhang, S.; Li, X.; Gao, W.; Ren, Z.; Luo, M. Effects of animal grazing on vegetation biomass and soil moisture on a typical steppe in Inner Mongolia, China. Ecohydrology 2022, 15, e2350. [Google Scholar] [CrossRef]
  39. Meissner, R.A.; Facelli, J.M. Effects of sheep exclusion on the soil seed bank and annual vegetation in chenopod shrublands of South Australia. J. Arid Environ. 1999, 42, 117–128. [Google Scholar] [CrossRef]
  40. Barber, N.A.; Farrell, A.K.; Blackburn, R.C.; Bauer, J.T.; Groves, A.M.; Brudvig, L.A.; Jones, H.P.; Gibson, D. Grassland restoration characteristics influence phylogenetic and taxonomic structure of plant communities and suggest assembly mechanisms. J. Ecol. 2019, 107, 2105–2120. [Google Scholar] [CrossRef]
  41. Alberti, J.; Bakker, E.S.; van Klink, R.; Olff, H.; Smit, C. Herbivore exclusion promotes a more stochastic plant community assembly in a natural grassland. Ecology 2017, 98, 961–970. [Google Scholar] [CrossRef] [Green Version]
  42. Hao, G.; Yang, N.; Dong, K.; Xu, Y.; Ding, X.; Shi, X.; Chen, L.; Wang, J.; Zhao, N.; Gao, Y. Shrub-encroached grassland as an alternative stable state in semiarid steppe regions: Evidence from community stability and assembly. Land Degrad. Dev. 2021, 32, 3142–3153. [Google Scholar] [CrossRef]
  43. Sun, W.; Li, S.; Wang, J.; Fu, G. Effects of grazing on plant species and phylogenetic diversity in alpine grasslands, Northern Tibet. Ecol. Eng. 2021, 170, 106331. [Google Scholar] [CrossRef]
  44. Zhu, J.; Zhang, Y.; Wang, W.; Jiang, L.; Wang, L.; Shen, R.; Chen, N.; Yang, X. Species turnover drives grassland community to phylogenetic clustering over long-term grazing disturbance. J. Plant. Ecol. 2020, 13, 157–164. [Google Scholar] [CrossRef]
  45. Wang, Z.; Luo, T.; Li, R.; Tang, Y.; Du, M. Causes for the unimodal pattern of biomass and productivity in alpine grasslands along a large altitudinal gradient in semi-arid regions. J. Veg. Sci. 2013, 24, 189–201. [Google Scholar] [CrossRef]
  46. Zhao, J.X.; Luo, T.X.; Li, R.C.; Wei, H.X.; Li, X.; Du, M.Y.; Tang, Y.H. Precipitation alters temperature effects on ecosystem respiration in Tibetan alpine meadows. Agric. For. Meteorol. 2018, 252, 121–129. [Google Scholar] [CrossRef]
  47. Zhang, J.L.; Liu, B.; Liu, S.; Feng, Z.H.; Jiang, K.W. Plantlist: Looking Up the Status of Plant Scientific Names based on The Plant List Database. R package version 0.7.2. Available online: https://github.com/helixcn/plantlist/ (accessed on 15 June 2022).
  48. The Angiosperm Phylogeny Group. An update of the Angiosperm Phylogeny Group classification for the orders and families of flowering plants: APG IV. Bot. J. Linn. Soc. 2016, 181, 1–20. [Google Scholar] [CrossRef] [Green Version]
  49. Paradis, E.; Schliep, K. ape 5.0: An environment for modern phylogenetics and evolutionary analyses in R. Bioinformatics 2019, 35, 526–528. [Google Scholar] [CrossRef]
  50. Gravel, D.; Bell, T.; Barbera, C.; Combe, M.; Pommier, T.; Mouquet, N. Phylogenetic constraints on ecosystem functioning. Nat. Commun. 2012, 3, 1117. [Google Scholar] [CrossRef] [Green Version]
  51. Forest, F.; Grenyer, R.; Rouget, M.; Davies, T.J.; Cowling, R.M.; Faith, D.P.; Balmford, A.; Manning, J.C.; Procheş, Ş.; van der Bank, M.; et al. Preserving the evolutionary potential of floras in biodiversity hotspots. Nature 2007, 445, 757–760. [Google Scholar] [CrossRef]
  52. Scherson, R.A.; Faith, D.P. Phylogenetic Diversity: Applications and Challenges in Biodiversity Science; Springer International Publishing: Cham, Switzerland, 2018. [Google Scholar]
  53. Miller, J.T.; Jolley-Rogers, G.; Mishler, B.D.; Thornhill, A.H. Phylogenetic diversity is a better measure of biodiversity than taxon counting. J. Syst. Evol. 2018, 56, 663–667.54. [Google Scholar] [CrossRef] [Green Version]
  54. Kembel, S.W.; Cowan, P.D.; Helmus, M.R.; Cornwell, W.K.; Morlon, H.; Ackerly, D.D.; Blomberg, S.P.; Webb, C.O. Picante: R tools for integrating phylogenies and ecology. Bioinformatics 2010, 26, 1463–1464. [Google Scholar] [CrossRef] [Green Version]
  55. Webb, C.O.; Ackerly, D.D.; McPeek, M.A.; Donoghue, M.J. Phylogenies and community ecology. Annu. Rev. Ecol. Syst. 2002, 33, 475–505. [Google Scholar] [CrossRef]
  56. Vamosi, S.M.; Heard, S.B.; Vamosi, J.C.; Webb, C.O. Emerging patterns in the comparative analysis of phylogenetic community structure. Mol. Ecol. 2009, 18, 572–592. [Google Scholar] [CrossRef]
  57. Webb, C.O. Exploring the Phylogenetic Structure of Ecological Communities: An Example for Rain Forest Trees. Am. Nat. 2000, 156, 145–155. [Google Scholar] [CrossRef]
  58. Bates, D.; Mächler, M.; Bolker, B.; Walker, S. Fitting Linear Mixed-Effects Models Using lme4. J. Stat. Softw. 2015, 67, 1–48. [Google Scholar] [CrossRef]
  59. Lai, J.; Zou, Y.; Zhang, J.; Peres-Neto, P.R. Generalizing hierarchical and variation partitioning in multiple regression and canonical analyses using the rdacca.hp R package. Methods. Ecol. Evol. 2022, 13, 782–788. [Google Scholar] [CrossRef]
  60. Ning, D.; Deng, Y.; Tiedje, J.M.; Zhou, J. A general framework for quantitatively assessing ecological stochasticity. Proc. Natl. Acad. Sci. USA 2019, 116, 16892–16898. [Google Scholar] [CrossRef] [Green Version]
  61. Cui, S.; Ouyang, J.; Lu, Y.; Liu, W.; Li, W.; Liu, G.; Zhou, W. The diversity and community assembly process of wetland plants from lakeshores on the Qinghai-Tibetan Plateau. Diversity 2021, 13, 685. [Google Scholar] [CrossRef]
  62. Hopping, K.A.; Knapp, A.K.; Dorji, T.; Klein, J.A. Warming and land use change concurrently erode ecosystem services in Tibet. Glob. Chang. Biol. 2018, 24, 5534–5548. [Google Scholar] [CrossRef]
  63. Bennett, J.A.; Koch, A.M.; Forsythe, J.; Johnson, N.C.; Tilman, D.; Klironomos, J. Resistance of soil biota and plant growth to disturbance increases with plant diversity. Ecol. Lett. 2020, 23, 119–128. [Google Scholar] [CrossRef]
  64. Lyashevska, O.; Farnsworth, K.D. How many dimensions of biodiversity do we need? Ecol. Indic. 2012, 18, 485–492. [Google Scholar] [CrossRef]
  65. Pavoine, S.; Bonsall, M.B. Measuring biodiversity to explain community assembly: A unified approach. Biol. Rev. Camb. Philos. Soc. 2011, 86, 792–812. [Google Scholar] [CrossRef] [PubMed]
  66. Swenson, N.G. The role of evolutionary processes in producing biodiversity patterns, and the interrelationships between taxonomic, functional and phylogenetic biodiversity. Am. J. Bot. 2011, 98, 472–480. [Google Scholar] [CrossRef] [PubMed] [Green Version]
  67. Qian, H.; Jin, Y.; Ricklefs, R.E. Phylogenetic diversity anomaly in angiosperms between eastern Asia and eastern North America. Proc. Natl. Acad. Sci. USA 2017, 114, 11452–11457. [Google Scholar] [CrossRef] [PubMed] [Green Version]
  68. Firincioglu, H.K.; Seefeldt, S.S.; Sahin, B. The effects of long-term grazing exclosures on range plants in the Central Anatolian Region of Turkey. Environ. Manag. 2007, 39, 326–337. [Google Scholar] [CrossRef]
  69. Wu, J.; Shen, Z.; Zhang, X. Precipitation and species composition primarily determine the diversity–productivity relationship of alpine grasslands on the Northern Tibetan Plateau. Alpine. Bot. 2014, 124, 13–25. [Google Scholar] [CrossRef]
  70. Wu, J.; Li, M.; Fiedler, S.; Ma, W.; Wang, X.; Zhang, X.; Tietjen, B. Impacts of grazing exclusion on productivity partitioning along regional plant diversity and climatic gradients in Tibetan alpine grasslands. J. Environ. Manag. 2019, 231, 635–645. [Google Scholar] [CrossRef]
  71. Evan, W.; Paul, K. Ecological Assembly Rules Perspectives, Advances, Retreats; Cambridge University Press: New York, NY, USA, 1999. [Google Scholar]
  72. Kraft, N.J.B.; Adler, P.B.; Godoy, O.; James, E.C.; Fuller, S.; Levine, J.M.; Fox, J. Community assembly, coexistence and the environmental filtering metaphor. Funct. Ecol. 2015, 29, 592–599. [Google Scholar] [CrossRef]
  73. Jost, L. Partitioning diversity into independent alpha and beta components. Ecology 2007, 88, 2427–2439. [Google Scholar] [CrossRef] [Green Version]
  74. Chao, A.; Gotelli, N.J.; Hsieh, T.C.; Sander, E.L.; Ma, K.H.; Colwell, R.K.; Ellison, A.M. Rarefaction and extrapolation with Hill numbers: A framework for sampling and estimation in species diversity studies. Ecol. Monogr. 2014, 84, 45–67. [Google Scholar] [CrossRef] [Green Version]
  75. Chalmandrier, L.; Munkemuller, T.; Lavergne, S.; Thuiller, W. Effects of species’ similarity and dominance on the functional and phylogenetic structure of a plant meta-community. Ecology 2015, 96, 143–153. [Google Scholar] [CrossRef]
  76. Zhang, C.; Zhou, H.; Ma, Z. Phylogenetic structure of alpine steppe plant communities along a precipitation and temperature gradient on the Tibetan Plateau. Glob. Ecol. Conserv. 2020, 24, e01379. [Google Scholar] [CrossRef]
  77. Körner, C. Alpine Plant Life; Springer: Berlin, Germany, 2003. [Google Scholar]
  78. González-Caro, S.; Duivenvoorden, J.F.; Balslev, H.; Cavelier, J.; Grández, C.; Macía, M.J.; Romero-Saltos, H.; Sánchez, M.; Valencia, R.; Duque, Á.; et al. Scale-dependent drivers of the phylogenetic structure and similarity of tree communities in northwestern Amazonia. J. Ecol. 2020, 109, 888–899. [Google Scholar] [CrossRef]
  79. Miller, E.T.; Farine, D.R.; Trisos, C.H. Phylogenetic community structure metrics and null models: A review with new methods and software. Ecography 2017, 40, 461–477. [Google Scholar] [CrossRef]
  80. Tang, Z.; Fang, J.; Chi, X.; Yang, Y.; Ma, W.; Mohhamot, A.; Guo, Z.; Liu, Y.; Gaston, K.J. Geography, environment, and spatial turnover of species in China’s grasslands. Ecography 2012, 35, 1103–1109. [Google Scholar] [CrossRef]
  81. Odriozola, I.; García-Baquero, G.; Etxeberria, A.; Aldezabal, A. Patterns of species relatedness created by competitive exclusion depend on species niche differences: Evidence from Iberian Atlantic grasslands. Perspect. Plant Ecol. Evol. Syst. 2017, 28, 36–46. [Google Scholar] [CrossRef]
  82. Zhang, H.; John, R.; Liu, K.; Qi, W.; Long, W. Using functional trait diversity patterns to disentangle the processes influencing the recovery of subalpine grasslands following abandonment of agricultural use. Front. Ecol. Evol. 2019, 7, 128. [Google Scholar] [CrossRef] [Green Version]
  83. Purschke, O.; Schmid, B.C.; Sykes, M.T.; Poschlod, P.; Michalski, S.G.; Durka, W.; Kühn, I.; Winter, M.; Prentice, H.C.; Fridley, J. Contrasting changes in taxonomic, phylogenetic and functional diversity during a long-term succession: Insights into assembly processes. J. Ecol. 2013, 101, 857–866. [Google Scholar] [CrossRef]
  84. Dong, L.; Liang, C.; Li, F.Y.; Zhao, L.; Ma, W.; Wang, L.; Wen, L.; Zheng, Y.; Li, Z.; Zhao, C.; et al. Community phylogenetic structure of grasslands and its relationship with environmental factors on the Mongolian Plateau. J. Arid Land 2019, 11, 595–607. [Google Scholar] [CrossRef] [Green Version]
  85. Price, J.N.; Hiiesalu, I.; Gerhold, P.; Partel, M. Small-scale grassland assembly patterns differ above and below the soil surface. Ecology 2012, 93, 1290–1296. [Google Scholar] [CrossRef]
  86. Meynard, C.N.; Lavergne, S.; Boulangeat, I.; Garraud, L.; Van Es, J.; Mouquet, N.; Thuiller, W. Disentangling the drivers of metacommunity structure across spatial scales. J. Biogeogr. 2013, 40, 1560–1571. [Google Scholar] [CrossRef] [Green Version]
  87. Yang, Z.; Guo, H.; Zhang, J.; Du, G. Stochastic and deterministic processes together determine alpine meadow plant community composition on the Tibetan Plateau. Oecologia 2013, 171, 495–504. [Google Scholar] [CrossRef]
  88. Conradi, T.; Temperton, V.M.; Kollmann, J. Resource availability determines the importance of niche-based versus stochastic community assembly in grasslands. Oikos 2017, 126, 1134–1141. [Google Scholar] [CrossRef]
  89. Salgado-Luarte, C.; Escobedo, V.M.; Stotz, G.C.; Rios, R.S.; Arancio, G.; Gianoli, E. Goat grazing reduces diversity and leads to functional, taxonomic, and phylogenetic homogenization in an arid shrubland. Land Degrad. Dev. 2019, 30, 178–189. [Google Scholar] [CrossRef]
  90. Olden, J.D.; Poff, N.L. Toward a mechanistic understanding and prediction of biotic homogenization. Am. Nat. 2003, 162, 442–460. [Google Scholar] [CrossRef] [Green Version]
  91. Shan, G.L.; Cheng, G.; Liu, Z.I.; Yan, Z.J.; Chu, X.H. VOR and CVOR index for health evaluation of typical steppe in Inner Mongolia. Acta Agrestia Sin. 2012, 20, 401–406. [Google Scholar]
  92. Soliveres, S.; Torices, R.; Maestre, F.T. Environmental conditions and biotic interactions acting together promote phylogenetic randomness in semi-arid plant communities: New methods help to avoid misleading conclusions. J. Veg. Sci. 2012, 23, 822–836. [Google Scholar] [CrossRef]
Figure 1. The phylogenetic distribution of all plants in this study. Different colored circles indicate species that occur at different altitudes, blank circles indicate absence, and solid circles indicate presence during the survey. The different colors of the branches correspond to different families in the legend.
Diversity 14 00832 g001
Figure 2. Dynamic variations of effects of enclosure and grazing on (a,b) species richness (SR) and (c,d) Faith’s phylogenetic diversity along the altitudinal gradient. Asterisk denotes significant difference in SR or phylogenetic diversity among different years. * P < 0.05, ** P < 0.01, *** P < 0.001.
Diversity 14 00832 g002
Figure 3. Dynamic variations of effects of enclosure and grazing on (a,b) net relatedness index (NRI) and (c,d) nearest taxon index (NTI) along the altitudinal gradient. Blank and solid circles denote insignificant and significant differences from zero in NRI or NTI of each year based on one-sample t test, respectively. Asterisk denotes the significant differences in NRI among different years. * P < 0.05, ** P < 0.01, *** P < 0.001.
Diversity 14 00832 g003
Figure 4. Differences in (ac) species richness and (df) Faith’s phylogenetic diversity between enclosure and grazing along the altitudinal gradient among different years. Solid circles are for enclosure, and blank circles are for grazing plots. Asterisk denotes the significant difference between enclosure and grazing. * P < 0.05, ** P < 0.01, *** P < 0.001.
Diversity 14 00832 g004
Figure 5. Differences in (ac) net relatedness index (NRI) and (df) nearest taxon index (NTI) between enclosure and grazing along the altitudinal gradient among different years. Solid and blank circles are for enclosure and grazing plots, respectively. Asterisk denotes the significant difference between enclosure and grazing. Dashed and dotted line denote an NRI or NTI value of 2 and 0, respectively. * P < 0.05, ** P < 0.01, *** P < 0.001.
Diversity 14 00832 g005
Figure 6. Relative contributions of GST, GSP, soil C:N ratio, enclosure duration f (ED, year) and grassland management (GM, enclosure vs grazing) to the variation of (a) species richness (SR), (b) Faith’s phylogenetic diversity (PD), (c) net relatedness index (NRI), and (d) nearest taxon index (NTI).
Diversity 14 00832 g006
Figure 7. Effects of different types of grazing management on (a) net relatedness index based on β-diversity (βNRI), (b) nearest taxon index based on β-diversity (βNTI) and (c) Raup–Crick-based measure (RCBray) along the altitudinal gradient among different years. Dashed lines represent the threshold value of each index. Different letters indicate the significant differences (p < 0.05) among different years. Asterisk denotes values that are significantly different from zero based on one-sample t test. * P < 0.05, ** P < 0.01, *** P < 0.001.
Diversity 14 00832 g007
Publisher’s Note: MDPI stays neutral with regard to jurisdictional claims in published maps and institutional affiliations.

