Article

Genotypic and Phenotypic Selection of Newly Improved Putra Rice and the Correlations among Quantitative Traits

1
Laboratory of Climate Smart Food Crop Production, Institute of Tropical Agriculture and Food Security, Universiti Putra Malaysia (UPM), Serdang 43400, Selangor, Malaysia
2
Department of Crop Production and Landscape Management, Faculty of Agriculture and Natural Resources Management, Ebonyi State University, Abakaliki PMB 053, Nigeria
3
Department of Crop Science, Faculty of Agriculture, Universiti Putra Malaysia (UPM), Serdang 43400, Selangor, Malaysia
*
Author to whom correspondence should be addressed.
Diversity 2022, 14(10), 812; https://doi.org/10.3390/d14100812
Submission received: 15 July 2022 / Revised: 15 September 2022 / Accepted: 16 September 2022 / Published: 28 September 2022
(This article belongs to the Special Issue Plant Germplasm Genetic Integrity)

Abstract

:
This experiment was conducted to genotypically and phenotypically select new rice lines pyramided with blast and bacterial leaf blight disease resistance genes after a marker-assisted backcross breeding programme. The inter-relationship among agro-morphological characteristics and their effect on yield was also studied. The polymorphic functional and microsatellite markers Xa21FR and pTA248 (Xa21), Xa13prom (xa13), RM21 (xa5), MP (Xa4), RM6836 (Pi2, Pi9 & Piz) and RM8225 (Piz) were first confirmed for the target genes. The selected markers were used for foreground selection of BC2F2 homozygous progenies with the target genes. Plants that had homozygous IRBB60 alleles for these markers were evaluated for their recovery of the recurrent parent genome. IRBB60 was used as the donor parent for bacterial blight resistance genes while Putra-1 served as a recipient/recurrent parent with background blast-resistance genes and high yield. After the foreground selection, 79 polymorphic simple sequence repeat markers identified from the marker polymorphism survey were used for marker-assisted background selection to determine the percentage recovery of the recurrent parent genome. In order to make a selection on a phenotypic basis, 14 agro-morphological traits were measured and recorded. The result obtained from the study showed that 16 lines received the seven resistance genes in sufficiently varied numbers and were selected. The distribution of yield per hectare showed that about 50% of the selected lines had yields as high as 5 t/ha and above. Some of the lines produced as high as 8.4 t/ha. These lines demonstrated the potential of recording uniform 8t/ha upon recombination at BC2F2. The study also indicated that the number of panicles per hill correlated strongly, significantly and positively with the number of tillers (r = 0.962 **), total grain weight per hill (r = 0.928 **) and yield per hectare (r = 0.927 **). It was concluded that the newly improved resistant lines which were selected have the capability to compete with Putra-1 in terms of its productivity and yield. The newly developed lines would be useful in future breeding programmes as donors for bacterial leaf blight and blast resistance genes. These lines are recommended for release to farmers in Malaysia and other rice-growing agro-ecologies for commercial cultivation.

1. Introduction

Some landraces of rice (Oryza spp.) have been used as a source of germplasm, which confers resistance against diseases. Xa21 gene in Oryza longistaminata was sourced from unidentified cultivars. Resistance genes were also found in O. rufipogon, O. minuta, O. officinalis and O. australiensis after cloning and used in breeding for resistant varieties [1,2]. Zhang et al. [3] had earlier reported that some Oryza meyeriana genetic materials are resistant to bacterial leaf blight disease. However, it is difficult to study the resistance gene in O. meyeriana because normal hybridization between O. meyeriana and cultivated rice is very difficult due to the genetic compositions of the GG genome 2n = 24 and the AA genome. This indicates that there would be a need to adopt other approaches to identify the genes responsible for resistance in O. meyeriana [4,5]. Cultivated varieties with single resistance genes cannot retain their resistance to BLB due to the emergence of new races of the pathogen; hence, surveying and identifying new resistance genes as well as pyramiding of such genes are very important in selection [6,7].
Marker-assisted backcross breeding (MABB) has been used successfully to develop superior parental lines incorporated with bacterial leaf blight and blast resistance [8]. For instance, the Pusa RH10 hybrid was more susceptible to blast and bacterial leaf blight infections. Through MABB, Pusa RH10 improved the adaptability to disease-endemic areas and the productivity is sustained with the addition of blast and bacterial leaf blight resistance genes [9,10]. The introgression of Pi54 and Piz5 blast resistance genes into the variety PRR78 has led to the development of blast-resistant lines known as the Pusa1602 (PRR78CPiz5) and Pusa1603 (PRR78CPiz54) lines. The resistance genes were derived from C101A51 and Tetep donor lines and incorporated into the susceptible PRR78 through MABB [11].
Prior to hybridization and subsequent development of a line, molecular marker data can be used in identifying the cultivar, genetic diversity assessment, selection of parents and confirmation of hybrids. The markers are genetically analysed for their polymorphisms [12,13]. These tasks are done in conventional breeding by phenotypic selection and analysing data based on morphological traits. Molecular markers such as SSR and STS are used in hybrid rice to confirm purity. The marker-assisted approach is considered to be easier than the conventional approach that involves growing the plants to maturity and screening their floral and morphological traits. Markers are also used to confirm the identity of cultivars since seeds of different strains are usually mixed because of the challenge of handling large samples of seeds planted between and within breeding blocks [14,15]. The success of selection in a breeding programme depends on the level of genetic diversity. Expanding the genetic base of a core breeding material would involve that diverse strains be identified for crossing with elite varieties [16]. Molecular markers or DNA-based markers have been very useful in characterizing germplasms with detailed information to breeders that help in parental selection. On several occasions, information regarding a QTL or specific resistance gene within a germplasm is highly anticipated [17,18]. This experiment was designed with the aim of genotypically and phenotypically selecting the new rice lines pyramided with biotic stress (blast and bacterial leaf blight diseases) resistance genes for possible release to farmers. The inter-relationship among agro-morphological characteristics and their effect on yield was also studied.

2. Materials and Methods

2.1. Breeding Materials and Breeding Scheme

The breeding programme involved a backcrossing scheme where Putra-1 was used as the recipient parent and subsequently the recurrent parent during hybridization and backcrossing while IRBB60 served as the donor/male parent during hybridization. Putra-1 contained the blast resistance genes (Pi2, Pi9 and Piz) and it is also high yielding. The IRBB60 donated the Xoo resistance (Xa21, xa13, xa5 and Xa4) [10]. Following the development of F1 plants, the seeds of backcross progeny, as well as seeds of the recurrent parent (Putra-1) and donor parent (IRBB60) were first put in an oven at 40 °C for eight hours in order to break any form of dormancy [19]. The seeds were thereafter soaked in a water-filled Petri-dish for 24 h and the water was drained. The seeds were left in the Petri-dishes to pre-germinate for another 24 h. After 24 h, the seeds had uniform pre-germination of about 99.9% due to the freshness of the seeds. The pre-germinated seeds were germinated on the seed trays for two weeks. At this stage, the seedlings were suitable for transplanting to the pots where they grew to maturity. The planting density was three seedlings per pot with 25 cm × 25 cm spacing between plants maintained in the pot. All agronomic practices were done following the Malaysian Agricultural Research and Development Institute (MARDI) Manual Teknologi Penanaman Padi Lestari [20].

2.2. Crossing Procedure for Gene Pyramiding

At the flowering stage, the female parent was first emasculated in order to remove the anther from the rice floret and expose the stigma in preparation for crossing. This process is known as emasculation. A typical rice spikelet has six anthers (yellow in colour) and two stigmas (whitish). The spikelet was cut in half with the aid of sharp scissors at an angle of 45°. The six anthers were carefully removed with the aid of a pair of forceps without damaging the two stigmas. Emasculation was done most preferably between 6:00 a.m. and 8:00 a.m. in the morning before the opening of the flowers. In order to emasculate more spikelets for crossing, another emasculation was done between 6:00 p.m. and 8:00 p.m. in the evening when the flowers are closed again. The panicles emasculated were covered with paper bags and labelled appropriately. The emasculation procedure was carefully followed in order to avoid self-pollination or contamination and ensure the accuracy of the cross-pollination.
At about 11:00 a.m., the male (donor) flowering panicles with fresh spikelets were harvested from the glass house. The panicles were immersed in a bucket containing enough water inside a closed room (breeding house) in order to facilitate or induce anthesis. After about 10 min, the flowers opened and started shedding pollen (i.e., anthesis occurred). The paper bag placed on the emasculated panicles was removed and another paper bag with two open ends was placed on the emasculated panicle in preparation for dusting. The male panicles with enough pollen were carefully picked and inverted onto the emasculated panicle at an angle of 45°. The male panicles were gently shaken to release the dust (pollen grain) into the stigmas of the emasculated panicles. After dusting, the pollinated panicles were covered with a paper bag to avoid any form of contamination. A labelling tag containing information about the crossing (female × male) and the pollination date was tied to the pollinated panicle. The bag on the pollinated panicle was removed after five days when the grains have fully established, and no further pollination or contamination could take place. The pollinated seeds (grains) were harvested from the plant after 28 days. The F1 seeds were planted in the second experiment to produce F1 plants which were genotypically screened to confirm that the crossing was successful and also select heterozygotes containing the alleles of both parents i.e., selection of pyramided lines.

2.3. Molecular Genotyping Procedure

A total of 15 markers (see Table S1, Supplementary Data) reported to be linked to bacterial blight resistance were tested for polymorphism [1] out of which six were confirmed and selected (Table 1). Similarly, we found two SSR markers reported by Miah et al. [12] to be linked to Magnaportheoryzae resistance and we tested and confirmed the polymorphic markers. The DNA of both Putra-1 and IRBB60, recipient/recurrent and donor parents, respectively, were used for the genotyping. The polymorphic functional and microsatellite markers were confirmed in the molecular laboratory of ITAFoS, UPM. The selected markers were used for foreground selection of BC2F2 homozygous progenies with the target genes. Plants that had homozygous IRBB60 alleles for these markers were evaluated for their recovery of the recurrent parent genome. After the foreground selection, the 79 polymorphic SSR markers (see Table S2, Supplementary Data) identified from the marker polymorphism survey of 472 markers (both linked and unlinked) were used for marker-assisted background selection to determine the percentage recovery of the recurrent parent genome. DNA extraction was conducted following standard procedures as described by Doyle and Doyle [13]. Genotype data were obtained by analysing DNA with SSR markers using 15 μL PCR. After initial denaturation for 5 min at 94 °C, each cycle comprised 1 min denaturation at 94 °C, 1 min annealing at 55 °C and 2 min extension at 72 °C with a final extension for 5 min at 72 °C at the end of 35 cycles. Marker scoring was done by scoring the DNA bands obtained from the computer display result of the Gel document. Single bands were scored either as homozygous alleles similar to the female parent, coded ‘A’, or homozygous alleles similar to the male parent, coded ‘B’. Double bands were scored as heterozygous alleles carrying the genes of both female and male parents and coded ‘H’. The marker scores were arranged in an Excel spreadsheet and imported to Graphical Genotyper (GGT 2.0) [21] for further analysis to estimate the recovery of the recurrent parent genome.

2.4. Phenotypic Assessment and Evaluation of Plants for Disease Resistance

In order to make a selection on a phenotypic basis, the quantitative traits were measured and recorded as described in Table 2. A total of 14 agro-morphological traits including plant height, number of days to flowering and maturity, the total number of productive tillers, filled and unfilled grains per panicle, panicle length, etc. were studied.
Distilled water (5 mL) was poured into each culture plate and bacterial colonies were suspended and the concentration of inoculum was adjusted to 108 cfu/mL using the MacFarlane standard [5]. The suspension of all isolates was bulked in plastic buckets and mixed for uniformity. The plants were sprayed with water to create wet conditions favourable for disease development. Inoculation was done by cutting five leaves, approximately 5 cm from the tips of each line with scissors dipped in the prepared inoculum.
The donor parent (IRBB60), recurrent parent (Putra-1) and the newly developed BC2F2 progenies were challenged for resistance or otherwise against the pathogen. The plants were screened phenotypically in field conditions. Twenty-one-day-old rice plants were inoculated by spraying spore suspension diluted to a concentration of 1.5 × 10⁵ conidia/mL on 220 plants. In order to maintain an ideal environment for disease development, the plants were covered with plastic bags, maintaining about 90% humidity.

2.5. Experiment Design and Statistical Analysis

The seeds were planted in an ear-to-row fashion in a pot experiment. Each pot contained a different genotype and the final selection of lines was made based on the individual’s genotypic and phenotypic traits. Data obtained on the agro-morphological traits were subjected to descriptive statistics and analysis of variance (ANOVA) using SAS program version 9.4 (SAS Institute, Inc., Cary, NC, USA) [22,23,24]. In order to compare the means of the selected lines to that of their recurrent parent (Putra-1), Duncan’s new multiple range (DNMRT) test at p < 0.05 was adopted as a mean separation technique. Correlation analysis was also conducted in order to determine the relationships that existed among the agro-morphological traits studied.

3. Results

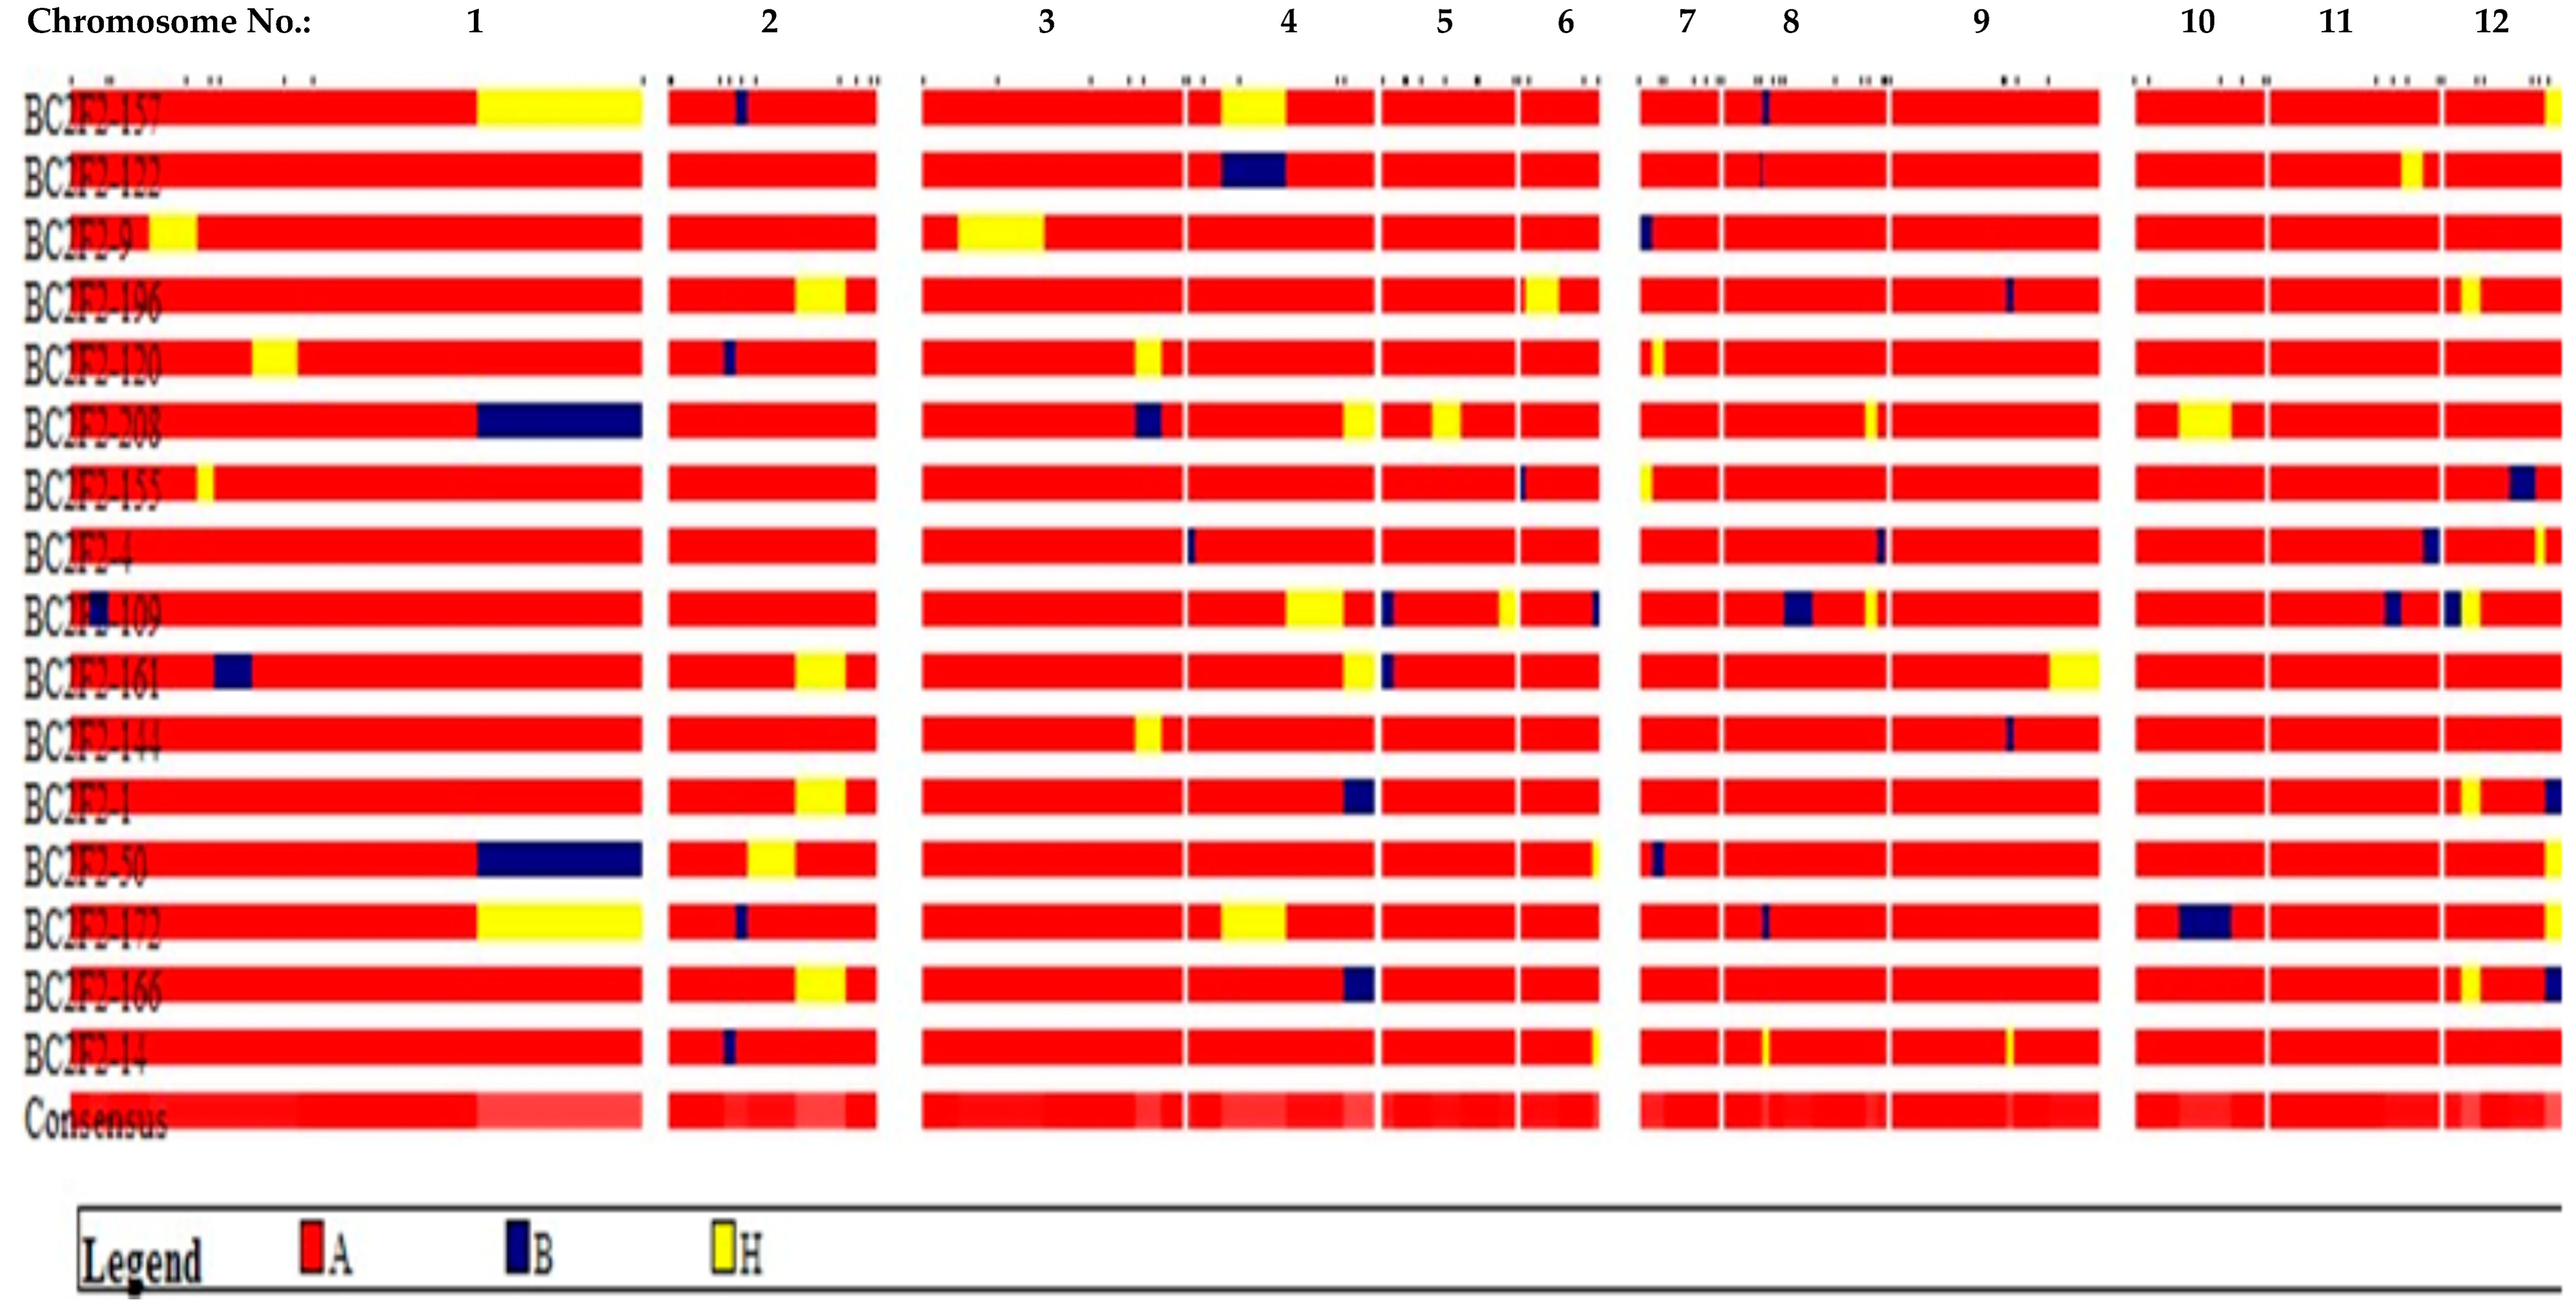
3.1. Genotypic Selection

The result obtained from this study showed that 16 lines were selected after BC2F2. The selected lines were confirmed to have been incorporated with the seven resistance genes (Table 3) for bacterial leaf blight and blast in varied numbers for broad-spectrum resistance. All the selected lines carried the three blast resistance genes introgressed. BC2F2–157 contained all the Xoo R-genes, making it the only line with all the seven R-genes. The BC2F2–122, BC2F2–9, BC2F2–196, BC2F2–120, BC2F2–208, BC2F2–155 and BC2F2–4 lines all had three Xoo R-genes, making a total of six Xoo and blast R-genes. Additionally, BC2F2–109, BC2F2–161, BC2F2–144, BC2F2–1, BC2F2–50, BC2F2–172, BC2F2–166 and BC2F2–14 lines had two Xoo R-genes, making a total of five Xoo and blast R-genes. In this study, plants selected after foreground selection (plants that carried all seven targeted genes) that had close resemblances to Putra-1 (recurrent parent) were subjected to marker-assisted background selection. Additionally, the DNA extraction protocol, PCR and cycling conditions applied in background selection were optimized for routine genotyping while the study lasted. However, it is expected that advances in molecular marker technology and sequencing platforms as well as high-throughput genotyping facilities would improve the efficiency of molecular marker-assisted backcross breeding in the foreseeable future. The chromosome-wise recurrent parent genome recovery (RPGR) of the 16 selected lines is shown in Figure 1. The figure indicates that the selected lines have fully recovered their recurrent parent. The recovery of the recurrent parent genome is an indication that the high-yielding characteristic of the recurrent parent was not sacrificed in the breeding programme but also inherited by the newly developed lines in addition to their resistance to blast and bacterial leaf blight.

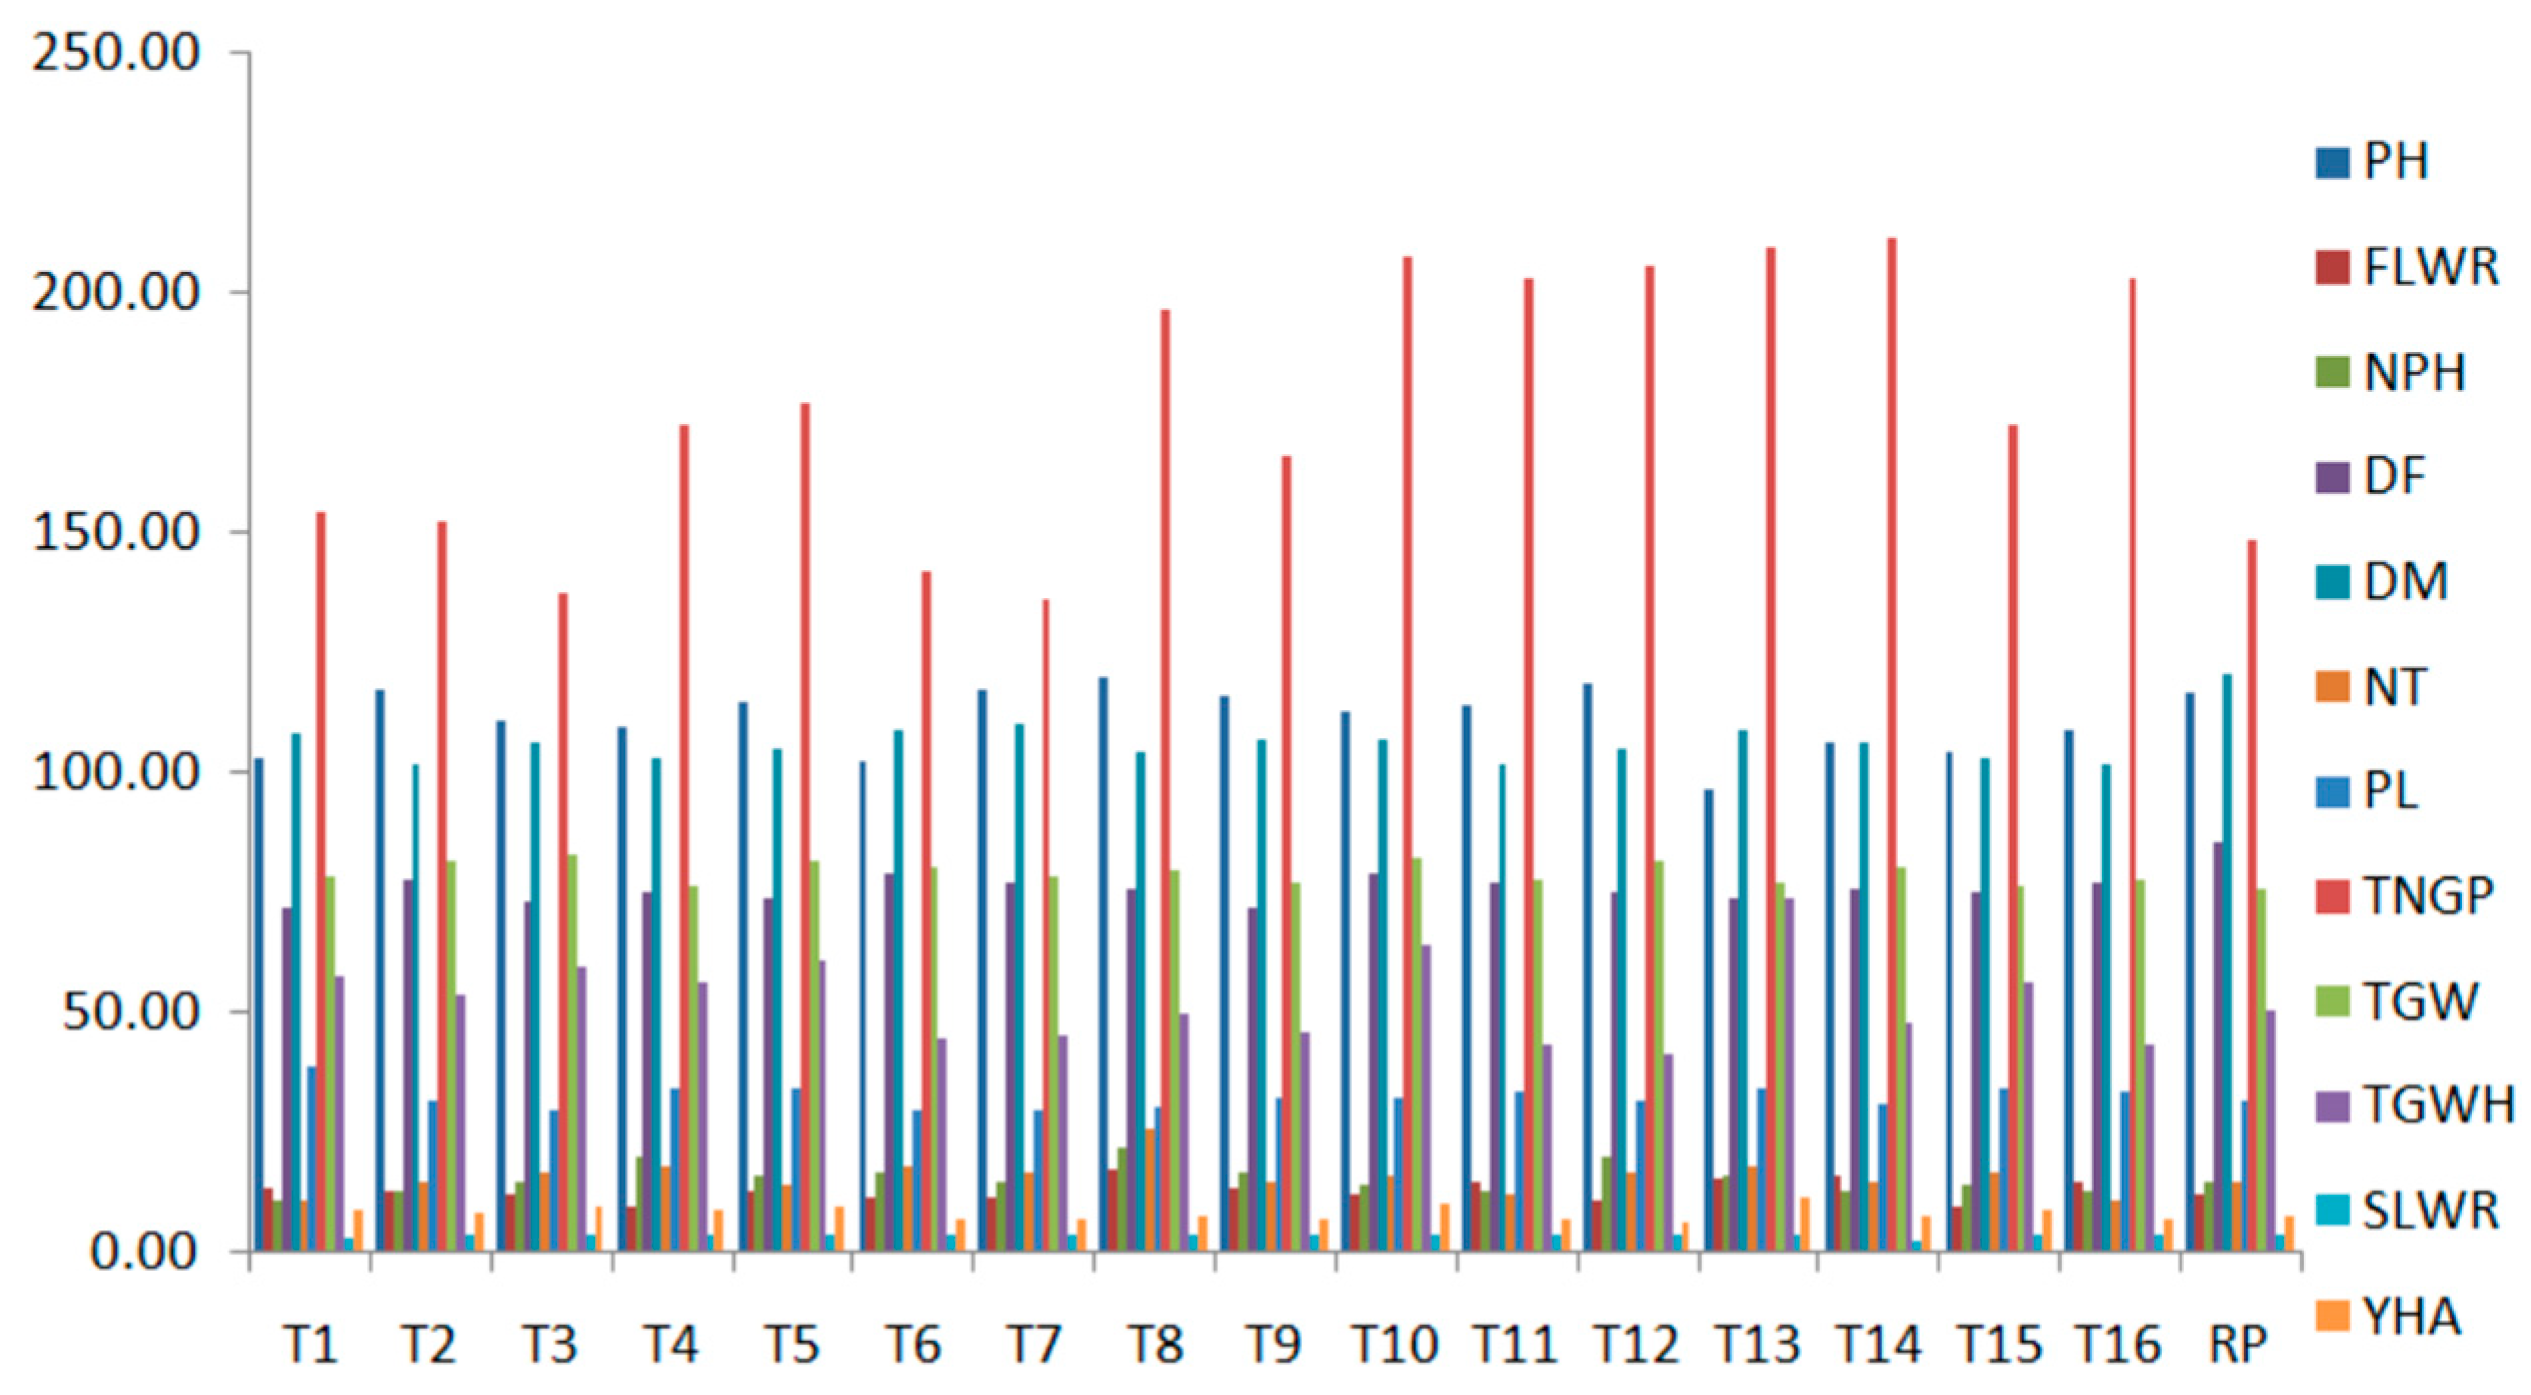
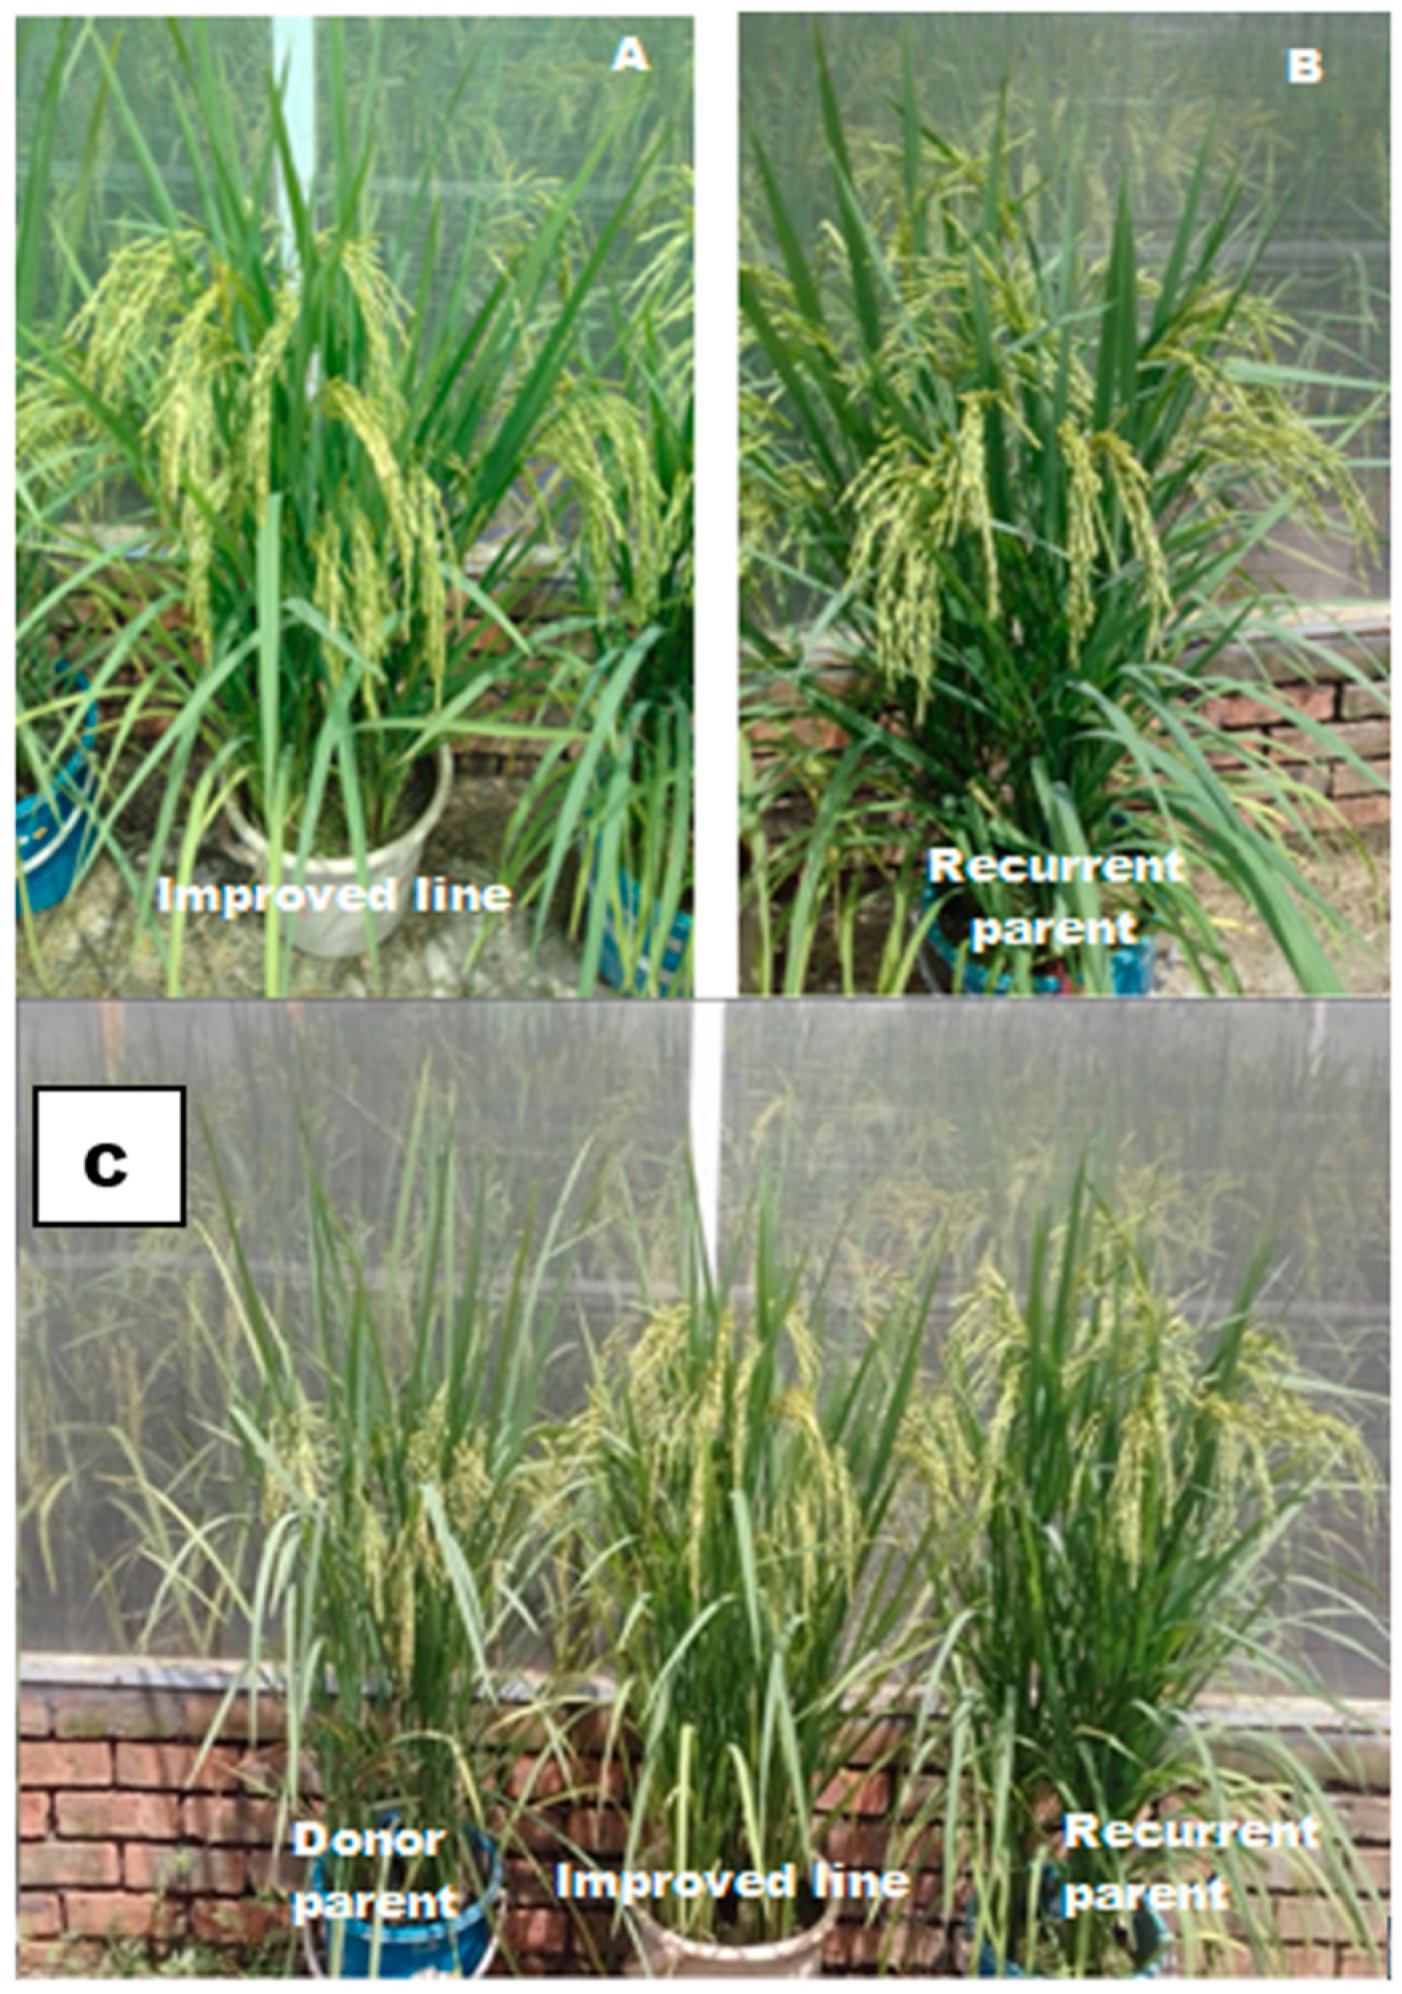
3.2. Phenotypic Selection

The result obtained from the quantitative evaluation of the selected improved lines showed that their plant height ranged from 102.30 cm to 118.70 cm with an average plant height of 110.50 cm. Flag leaf length and width, leaf area and leaf area index recorded an average of 36.66 cm and 2.71 cm; 74.59 cm2 and 0.12, respectively. The number of tillers and panicles per hill obtained were 9.57 and 9.07 on average while the length of the panicle and total grain number of each panicle were 29.80 cm and 142.21, respectively. The total grain weight per hill was 32.50 g (Table 4). The result obtained on the distribution of yield per hectare (Figure S1 Supplementary Data) showed that about 50% of the selected lines had yields as high as 5 t/ha and above. Some of the lines produced as high as 8.4 t/ha. These lines demonstrated the potential of recording uniform 8 t/ha upon recombination at BC2F2. The result obtained on the normal quantile-quantile plot for yield per hectare (Figure S2, Supplementary Data) in the selected lines showed that all the points did not lie exactly at the regression line. The dispersal of the points around the regression line showed the diversity in the selected lines which could be utilized in plant breeding. Very high genetic diversity in yield was evident in the two lines that deviated very far away from the regression line. Figure 2 describes the quantitative trait performance of the newly improved lines while the phenotypic expression of the improved lines vis-à-vis parental lines is presented in Figure 3. Figure S1 describes the histogram of yield/ha of the selected lines.

3.3. Trait Variation and Correlation

The results of bacterial leaf blight and blast screening of BC2F2 progenies are presented in Table 5. The Chi-square result showed a non-significant difference (p > 0.05) in the segregation of resistance against Xoo and Magnarporthe oryzae in the single dominant gene model with regard to the expected and observed number of resistant and susceptible plants. The result suggested the ability of the plants to segregate according to the expected 3:1 ratio proposed by Mendel for single dominant genes. Additionally, the Chi-square tests conducted on data obtained from segregation of resistance against blast in different gene models;viz.,the single gene model, two independent gene model and/or two-locus interaction revealed that the expected number of resistant and susceptible plants in the single dominant gene model’s segregation ratio did not differ significantly (p > 0.05) from the observed number of resistant and susceptible plants; hence, they fit the 3:1 Mendelian segregation ratio.
The result also showed the trait variation correlations of pathotypes P7.7 and P7.2 for bacterial leaf blight and blast pathogens. The result obtained on the challenging BC2F2 population with pathotype P7.7 of Xoo indicated a score of 8.11 and 0.64 for BLD and BLT, respectively, with 2.20% DLA. The BC2F2 population showed a resistance response against bacterial leaf blight infection. Blight lesion degree correlated positively, significantly and strongly with blight lesion type while %DLA had no significant correlation with blight lesion degree and type (BLD and BLT) (Table 6).
Additionally, the result showed that in the case of blast disease, Putra-1 had no symptoms of blast. The average leaf blast severity scores recorded in IRBB60 were 28.13 and 3.38 for BLD and BLT, respectively, with 47.89% DLA. The result also showed that the BC2F2 population challenged with pathotype P7.2 of Magnarporthe oryzae scored 8.33 and 0.98 with regard to BLD and BLT, respectively, while the DLA obtained was 0.48%. This result indicated that the BC2F2 population showed a resistance response to blast infection. Similar to the correlation result obtained on bacterial leaf blight infection, blast lesion degree correlated positively, significantly and strongly with blast lesion type while %DLA had no significant correlation with blast lesion degree and type (BLD and BLT) (Table 6).

3.4. Correlation among the Quantitative Traits

The result in Table 7 obtained from Pearson correlation analysis shows that some agro-morphological traits had significant (p < 0.05) and positive correlations. Strong, significant and positive correlation was observed between flag leaf length and leaf area (r = 0.950), leaf area index (r = 0.913) and flag leaf length to width ratio (r = 0.942). Additionally, flag leaf width had a moderate, significant and positive correlation with leaf area (r = 0.533) and leaf area index (r = 0.590) but a weak, nonsignificant and negative correlation with flag leaf length to width ratio (r = −0.091). The flag leaf width also had a significant and negative correlation with the total number of grains per panicle (r = −0.612). This result indicated that any increase in the flag leaf width would significantly reduce the number of grains per panicle, and as such, selection should be preferred on plants with narrow flag leaves. Leaf area also had a strong, significant and positive correlation with leaf area index (r = 0.988) and flag leaf length to width ratio (r = 0.791).
The result also indicated that the number of panicles per hill correlated strongly, significantly and positively with the number of leaves (r = 0.962), number of tillers (r = 0.962), total grain weight per hill (r = 0.928) and yield per hectare (r = 0.927). This result is an indication that the number of panicles per hill has great consequences on the yield and yield components. The strongest significant and positive correlation was observed between the number of leaves and the number of tillers (r = 1.00). The number of leaves and the number of tillers each had a strong, significant and positive correlation with total grain weight per hill (r = 0.867) and yield per hectare (r = 0.867). Another strong, significant and positive correlation was observed between one thousand grain weight and yield per hectare (r = 1.00). The result also showed that seed length correlated strongly, significantly and positively with seed length to width ratio (r = 0.622) while a significant and negative correlation was observed between seed weight and seed length to width ratio (Table 7).

4. Discussion

The lines developed in this study were pyramided with both dominant and recessive genes. There were two dominant Xoo R-genes (Xa21 and Xa4) and two recessive Xoo R-genes (xa13 and xa5). The blast R-genes (Pi2, Pi9 and Piz) were all in their dominant conditions. Due to the variable nature of pathogens, resistance could be lost after a few years and as such, breeders continue to search for novel R-genes that could sustain resistance for a longer period. Most resistance genes are naturally dominant but there are also some recessive genes. Chukwu et al. [1] reviewed some dominant Xoo resistance genes, including Xa-1, Xa-3, Xa-4, Xa-7, Xa-10, Xa-14, Xa-21 and Xa-22(t), and some major recessive genes are xa-5 and xa-13. The combination of both dominant and recessive R-genes has the potential to guarantee prolonged resistance against pathogens. Although all the blast resistance genes pyramided in the selected lines were dominant, the resistance could be lost after some time due to its characteristic single resistance gene locus with race-specific traits [12]. Molecular marker development and functional genomics played a vital role in selecting the Xoo and blast-resistant lines.
The selected lines from this study have recombined their recurrent parent genomes and could be used as parents in the subsequent generation. Recurrent parent genome recovery is accelerated by background selection. However, Miah et al. [12] reported that due to the large numbers of unlinked markers that are used in background selection, some molecular laboratories could find it difficult to conclude background selection before it is time for crossing. This is even more difficult where laboratory materials are insufficient or electricity is not in steady supply. Additionally, due to the high cost of purchasing markers and associated costs of genotyping, some breeders have decided to conduct the background selection at later stages of backcrossing instead of early generations [25].The use of molecular markers makes it possible to determine the extent of recovery of recurrent parent genomes at every stage of backcrossing. It is also useful in the selection of the best backcross lines produced in a given generation of backcrossing. The number of generations required to introgress the target gene is reduced by the potentiality of MABB in selecting recurrent parent genomes against the target locus. Ribaut et al. [26] reported that the response of selection for background screening on non-target chromosomes depends on some factors such as the degree of molecular marker map saturation, the technical resources available at a particular time and levels of line conversion required. Donor genome content reduction outside the gene of interest requires molecular markers that distribute evenly across the genome [27,28,29,30]. Previous theoretical and experimental studies have been able to establish the efficiency of background selection in marker-assisted backcross breeding [31,32]. The computer simulation findings by Tanksley et al. [33] showed that background marker selection could accelerate the recurrent parent genome recovery within two or three backcross generations. Factors such as the genetic distance between the donor and recurrent parents, breeder preference and initial genotypic and phenotypic screening could be responsible for the number of backcross generations adopted in varietal development. Evenly spaced markers are essential for efficient background selection. Visscher et al. [34] reported that an approximately 20 cM marker spacing was taken to be sufficient. However, a single marker located at the centre of a chromosome could be more informative compared to two markers located toward the ends of such chromosomes. The efficiency of MABB is influenced by a number of factors such as the crossing scheme, selection strategy applied, number of target genes to be introgressed and the marker map [34,35].
The gene and the marker are tightly linked when both are closely located on the same chromosome and as such tend to be transmitted together at each generation. Tanksley [36] proposed the marker-assisted foreground selection for target genes while several studies have investigated it in the context of resistance gene introgression [37,38].The transfer or introgression of target genes are both economical and feasible with the aid of molecular markers. Chukwu et al. [32] reported that marker-assisted foreground selection is utilized in the confirmation and selection of target genes in the progenies produced from self-fertilization of a cross between the recurrent and donor parents or the F1 hybrid crossed to the donor parent in order to select an individual or discard it. In the BC1F1 population, RM8225 and RM6836 displayed heterozygosity for blast R-genes and were used for foreground selection of blast genes in subsequent generations. The two markers are tightly linked to blast Piz R-genes;namely, Piz, Pi2 and Pi9 [12,39], and are located on the sixth chromosome of rice. The broad spectrum of races of M.oryzae rice blast fungal pathogen has been combated effectively using the Piz disease resistance genes [37,40]. The Chi-square result of 0.48 reported by Mondal et al. [41] fitted into the 1:1 expected ratio at BC1F1.Iftekharudaula [42] also found a non-significant Chi-square value of 0.28 at a 5% level of probability which agreed with the expected 1:1 ratio at BC1F1 generation. The use of graphical genotypes (GGT) for analysis of recurrent parent genome recovery was highlighted [43]. The recurrent parent genome recovery of 80.11% recorded in this present study at BC1F1 corresponds with earlier findings by Luu et al. [44] who found RPGR of 80.00% to 89.01%.
The best individual with the highest recurrent parent genome recovery can be selected at BC1. However, given a situation where more than one individual proved to be the best individual, the selection of the most superior individual for producing the BC2 population would be based on analysis of other marker loci (either located on the chromosome with the target gene or not) [27,37]. Semagn et al. [45] noted that, where none of the individuals at BC1 received the target gene, it implied that the backcrossing programme failed. The minimum sample size needed to get at least one best individual for use in the next backcrossing has been reviewed by several authors [46]. In the study conducted by Basavaraj et al. [47], two Xoo resistance genes, xa13 and Xa21, were incorporated into PRR78 from a single-donor parent. The percentage of recurrent parent genome recovery ranged from 87.01 to 92.81% at BC2F2, which increased at BC2F5 from 92.81 to 97.30%. Miah et al. [37] also reported that the recurrent parent genome ranged from 92.7 to 97.30% with an average proportion of RPGR in the selected improved lines (BC2F2) of 95.98%. These results were similar to the findings of this present study which revealed a range of RPGR of 93.2 to 98.5% and an average proportion of RPGR of 95.9% in the 16 selected improved BC2F2 lines. The increased recovery of the recurrent parent genome in the advanced backcross generation was due to the fixation of alleles of the recurrent parent from the heterozygous alleles. Additionally, the stringent phenotypic selection applied at every backcross stage led to contributory recurrent parent allele from backcross derivatives, which facilitated the high RPG recovery observed in this present study. A large number of polymorphic markers used in background selection makes it more effective. Singh et al. [48] reported that with only 20% SSR polymorphism between the recipient and donor parents, marker-assisted selection for background screening is limited. However, a stringent phenotypic selection for recurrent parent phenome recovery has the potential for maximizing the recurrent parent genome recovery [8,49,50].
The result obtained from this study reveals that resistance to Xoo pathotype P7.7 in IRBB60 was most likely due to single nuclear gene action. More so, the introgression of several resistance genes in the newly developed lines shows the presence of horizontal resistance. It is suggested that only the existence of horizontal resistance along with the vertical component could help varieties with enhanced and sustainable resistance to bacterial leaf blight. The pyramiding of dominant Xa4 and Xa21 genes led to the development of an improved ‘indica’ rice variety with a ‘broad spectrum durable resistance’ to bacterial leaf blight. Additionally, a pyramiding of Xa4 + xa5 + Xa21 BLB resistance genes expressed effective resistance to virulent BLB isolates of Korea in comparison to single resistance genes which had their resistance broken after a short while and became susceptible [51]. Pyramiding of genes and use of molecular markers in the screening of germplasms have been advocated for accurate and speedy assessment of germplasm to be used in resistance breeding. Resistance to BLB is considered to be due to or a combination of two or more genes that are often described as dominant, recessive, inhibitory, complementary or polygenic [52]. The result also revealed that blast resistance in Putra-1, especially against the Magnarporthe oryzae pathotype P7.2, is mainly controlled by single dominant gene action and not necessarily by two independent gene actions or epistasis. The result of this study is in agreement with the findings made by Ashkani et al. [53], who found that resistance to M. oryzae pathotype P7.2 in Pongsu Seribu 2 was mainly controlled by a single nuclear gene action.
Additionally, the phenotypic selection minimized the cost and time required for background screening for recurrent parent genome recovery.Other researchers have adopted phenotypic selection in selecting for increased yield and chemical constituents in maize and rice which proved to be successful [54]. The correlation analysis of quantitative traits studied established a strong relationship between grain yield and other yield component traits such as tiller number, panicle number and leaf number. The number of effective or productive tillers per plant and grain number per panicle have been reported to correlate with high grain yield in rice [55,56]. Chukwu et al. [57] used correlation analysis to monitor the relationship that existed among agronomic traits of maize and found a non-significant correlation between plant height and yield component traits. However, Sarif et al. [58] observed wide genetic diversity and variability among pigmented rice lines using both genotyping and morphological traits.

5. Conclusions

In conclusion, the genotypic selection was successfully conducted to recover yield and yield component traits leading to the development of an improved version of Putra-1 with incorporated resistance to the diseases. In this study, the genotypic assessment indicated that recurrent parent genome recovery was highly accelerated. The implication is that a few well-positioned markers cover the genome adequately in the backcrossing programme. The selected improved lines carrying both bacterial and blast resistance genes in the genetic background of Putra-1 measure equal or superior in agronomic value compared to the recurrent parent Putra-1, with added advantages of being resistant to bacterial leaf blight and blast infections. The bacterial leaf blight and blast-resistant improved lines have the capability to compete with Putra-1 in terms of its productivity. The newly developed lines would be useful in future breeding programmes as donors for bacterial leaf blight and blast resistance genes. The newly developed lines are recommended for release to farmers in Malaysia and other rice-growing agro-ecologies.

Supplementary Materials

The following supporting information can be downloaded at: https://www.mdpi.com/article/10.3390/d14100812/s1, Table S1: Bacterial leaf blight resistance genes in IRBB60 and blast resistance genes in Putra-1 and their linked markers; Table S2: Polymorphic background markers and their SSR details; Figure S1: Histogram of yield/ha of the selected lines; Figure S2: Normal quantile-quantile (Q-Q) plot for yield/ha of the selected lines. References [59,60,61,62,63,64,65,66,67,68,69,70,71,72,73,74] are cited in supplementary material.

Author Contributions

Conceptualization, S.C.C. and M.Y.R.; methodology, S.C.C. and M.Y.R.; software, S.C.C. and M.Y.R.; validation, S.C.C. and M.Y.R.; formal analysis, S.C.C. and M.Y.R.; investigation, S.C.C.; resources, S.C.C., M.Y.R., Y.O., E.O.O., I.M., S.S., M.A.-M., I.S.A. and M.J.; data curation, S.C.C.; writing—original draft preparation, S.C.C.; writing—review and editing, S.C.C., Y.O. and M.Y.R.; visualization, S.C.C.; supervision, M.Y.R.; project administration, S.C.C. and M.Y.R.; funding acquisition, S.C.C. and M.Y.R. All authors have read and agreed to the published version of the manuscript.

Funding

This research was funded by the Ministry of Higher Education of the Malaysia Government. This particular project was sponsored to develop a new rice variety against bacterial leaf blight and the grant was titled “Higher Institution Centre of Excellence (HiCoE) Research Grant award (Grant No: 6369105).

Institutional Review Board Statement

Not applicable.

Data Availability Statement

All relevant data for this research are contained within the manuscript. However, the corresponding author (mrafii@upm.edu.my or chukwu.samuel@ebsu.edu.ng) can be contacted for more information.

Acknowledgments

The authors thank our mentor, Mohd Y. Rafii for the training received from him. We are also grateful to Universiti Putra Malaysia for providing an enabling environment for research.

Conflicts of Interest

The authors declare no conflict of interest.

References

  1. Chukwu, S.C.; Rafii, M.Y.; Ramlee, S.I.; Ismail, S.I.; Hasan, M.M.; Oladosu, Y.A.; Magaji, U.G.; Akos, I.; Olalekan, K.K. Bacterial leaf blight resistance in rice: A review of conventional breeding to molecular approach. Mol. Biol. Rep. 2019, 46, 1519–1532. [Google Scholar] [CrossRef] [PubMed]
  2. Zheng, C.K.; Chun-Lian, W.A.N.G.; Yuan-Jie, Y.U.; Liang, Y.T.; Kai-Jun, Z.H.A.O. Identification and mo-lecular mapping of Xa32 (t), a novel resistance gene for bacterial blight (Xanthomonas oryzaepv. oryzae) in rice. Acta Agron. Sin. 2009, 35, 1173–1180. [Google Scholar]
  3. Zhang, Q.; Wang, C.L.; Shi, A.N.; Bai, J.F.; Ling, S.C.; Li, D.Y.; Chen, C.B.; Pang, H.H. Evaluation of resistance to bacterial blight (Xan-thomonasoryzaepv. oryzae) in wild rice species. Sci. Agric. Sin. 1994, 27, 1–9. [Google Scholar]
  4. He, B.; Huang, X.; Li, D.; Jiang, C.; Yu, T.; Yin, F.; Li, W.; Cheng, Z. The cDNA cloning of a novel bacterial blight-resistance gene ME137. Acta Biochim. Biophys. Sin. 2013, 45, 422–424. [Google Scholar] [CrossRef]
  5. Akos, I.S.; Rafii, M.Y.; Ismail, M.R.; Ramlee, S.I.; Shamsudin, N.A.A.; Ramli, A.; Chukwu, S.C.; Swaray, S.; Jalloh, M. Evaluation of Inherited Resistance Genes of Bacterial Leaf Blight, Blast and Drought Tolerance in Improved Rice Lines. Rice Sci. 2021, 28, 279–288. [Google Scholar] [CrossRef]
  6. Wu, J.; Yu, H.; Dai, H.; Mei, W.; Huang, X.; Zhu, S.; Peng, M. Metabolite profiles of rice cultivars containing bacterial blight-resistant genes are distinctive from susceptible rice. Acta Biochim. Biophys. Sin. 2012, 44, 650–659. [Google Scholar] [CrossRef]
  7. Halim, A.; Rafii, A.; Mohd, Y.; Mohamad, B.; Osman, Y.O.; Samuel, C.C. Ageing Effects, Generation Means, and Path Coefficient Analyses on High Kernel Elongation in MahsuriMutan and Basmati 370 Rice Populations. BioMed Res. Int. 2021, 2021, 8350136. [Google Scholar] [CrossRef]
  8. Chukwu, S.C.; Rafii, M.Y.; Ramlee, S.I.; Ismail, S.I.; Oladosu, Y.; Muhammad, I.I.; Musa, I.; Ahmed, M.; Jatto, M.I.; Yusuf, B.R. Recovery of recurrent parent genome in a marker-assisted backcrossing against rice blast and blight infections using functional markers and SSRs. Plants 2020, 9, 1411. [Google Scholar] [CrossRef]
  9. Zhou, Y.-L.; Uzokwe, V.N.; Zhang, C.-H.; Cheng, L.-R.; Wang, L.; Chen, K.; Gao, X.-Q.; Sun, Y.; Chen, J.-J.; Zhu, L.-H.; et al. Improvement of bacterial blight resistance of hybrid rice in China using the Xa23 gene derived from wild rice (Oryza rufipogon). Crop Prot. 2011, 30, 637–644. [Google Scholar] [CrossRef]
  10. Chukwu, S.C.; Rafii, M.Y.; Ramlee, S.I.; Ismail, S.I.; Oladosu, Y.; Kolapo, K.; Musa, I.; Halidu, J.; Muhammad, I.I.; Ahmed, M. Mark-er-assisted introgression of multiple resistance genes confers broad spectrum resistance against bacterial leaf blight and blast diseases in Putra-1 rice variety. Agronomy 2020, 10, 42. [Google Scholar] [CrossRef]
  11. Singh, V.K.; Singh, A.; Singh, S.P.; Ellur, R.K.; Choudhary, V.; Sarkel, S.; Singh, D.; Krishnan, S.G.; Nagarajan, M.; Vinod, K.K.; et al. Incorporation of blast resistance into “PRR78”, an elite Basmati rice restorer line, through marker assisted backcross breeding. Field Crops Res. 2012, 128, 8–16. [Google Scholar] [CrossRef]
  12. Miah, G.; Rafii, M.Y.; Ismail, M.R.; Puteh, A.B.; Rahim, H.A.; Islam, K.; Latif, M.A. A review of microsatellite markers and their ap-plications in rice breeding programs to improve blast disease resistance. Int. J. Mol. Sci. 2013, 14, 22499–22528. [Google Scholar] [CrossRef] [PubMed] [Green Version]
  13. Doyle, J.J.; Doyle, J.L. Isolation ofplant DNA from fresh tissue. Focus 1990, 12, 39–40. [Google Scholar]
  14. McCouch, S.R.; McNally, K.L.; Wang, W.; Sackville Hamilton, R. Genomics of gene banks: A case study in rice. Am. J. Bot. 2012, 99, 407–423. [Google Scholar] [CrossRef] [PubMed]
  15. Jena, K.K.; Mackill, D.J. Molecular Markers and Their Use in Marker-Assisted Selection in Rice. Crop Sci. 2008, 48, 1266–1276. [Google Scholar] [CrossRef]
  16. Divakara, B.N.; Upadhyaya, H.D.; Wani, S.P.; Gowda, C.L. Biology and genetic improvement of Jatropha curcas L.: A review. Appl. Energy 2010, 87, 732–742. [Google Scholar] [CrossRef]
  17. Sandhu, S.K.; Singh, G. Genomic-Assisted Breeding in Oilseed Brassicas. In Genomic-Assisted Breeding in Oilseed Brassicas; Springer: Cham, Switzerland, 2018; pp. 317–348. [Google Scholar] [CrossRef]
  18. Sabri, R.S.; Rafii, M.Y.; Ismail, M.R.; Yusuff, O.; Chukwu, S.C.; Hasan, N. Assessment of Agro-Morphologic Performance, Genetic Parameters and Clustering Pattern of Newly Developed Blast Resistant Rice Lines Tested in Four Environments. Agronomy 2020, 10, 1098. [Google Scholar] [CrossRef]
  19. IRRI. International Rice Research Institute. 2014. Available online: http://irri.org Practical Manual (accessed on 22 November 2019).
  20. Oladosu, Y.; Rafii, M.Y.; Magaji, U.; Abdullah, N.; Miah, G.; Chukwu, S.C.; Hussin, G.; Ramli, A.; Kareem, I. Genotypic and phe-notypic relationship among yield components in rice under tropical conditions. BioMed Res. Int. 2018, 15, 2018. [Google Scholar]
  21. van Berloo, R. GGT 2.0: Versatile Software for Visualization and Analysis of Genetic Data. J. Hered. 2008, 99, 232–236. [Google Scholar] [CrossRef]
  22. Hashim, N.; Rafii, M.Y.; Oladosu, Y.; Ismail, M.R.; Ramli, A.; Arolu, F.; Chukwu, S. Integrating multivariate and univariate statis-tical models to investigate genotype–environment interaction of advanced fragrant rice genotypes under rainfed condition. Sustainability 2021, 13, 4555. [Google Scholar] [CrossRef]
  23. Eslinger, J. The SAS Programmer’s PROC REPORT Handbook: Basic to Advanced Reporting Techniques; Sas Institute, Inc.: Cary, NC, USA, 2016; p. 23. [Google Scholar]
  24. Ahmed, M.A.; Rafii, M.Y.; Izzati, M.Z.N.A.; Khalilah, A.K.; Awad, E.A.; Kaka, U.; Chukwu, S.C.; Liang, J.B.; Sazili, A.Q. Biological additives improved qualities, in vitro gas production kinetics, digestibility, and rumen fermentation characteristics of different varieties of rice straw silage. Anim. Prod. Sci. 2022. [Google Scholar] [CrossRef]
  25. Yi, M.; Nwe, K.T.; Vanavichit, A.; Chai-Arree, W.; Toojinda, T. Marker assisted backcross breeding to improve cooking quality traits in Myanmar rice cultivar Manawthukha. Field Crop. Res. 2009, 113, 178–186. [Google Scholar] [CrossRef]
  26. Ribaut, J.M.; Jiang, C.; Hoisington, D.A. Simulation experiments on efficiencies of gene introgression by backcrossing. Crop Sci. 2002, 42, 557–565. [Google Scholar] [CrossRef]
  27. Frisch, M.; Bohn, M.; Melchinger, A.E. Comparison of Selection Strategies for Marker-Assisted Backcrossing of a Gene. Crop Sci. 1999, 39, 1295–1301. [Google Scholar] [CrossRef]
  28. Olalekan, K.K.; Rafii, M.Y.; Salleh, A.M.; Mohamed, M.T.; Ahmad, K.; Misran, A.; Abro, T.F.; Oladosu, Y.; Arolu, I.W.; Samuel, C.; et al. Analysis of recurrent parent genome recovery in marker-assisted backcross breeding programme in Watermelon. Int. J. Sci. Technol. Res. 2019, 8, 945–955. [Google Scholar]
  29. Oladosu, Y.; Rafii, M.Y.; Samuel, C.; Fatai, A.; Magaji, U.; Kareem, I.; Kamarudin, Z.S.; Muhammad, I.; Kolapo, K. Drought Resistance in Rice from Conventional to Molecular Breeding: A Review. Int. J. Mol. Sci. 2019, 20, 3519. [Google Scholar] [CrossRef]
  30. Oladosu, Y.; Rafii, M.Y.; Arolu, F.; Chukwu, S.C.; Muhammad, I.; Kareem, I.; Salisu, M.A.; Arolu, I.W. Submergence Tolerance in Rice: Review of Mechanism, Breeding and, Future Prospects. Sustainability 2020, 12, 1632. [Google Scholar] [CrossRef]
  31. Frisch, M.; Melchinger, A.E. Marker-assisted backcrossing for simultaneous introgression of two genes. Crop Sci. 2001, 41, 1716–1725. [Google Scholar] [CrossRef]
  32. Chukwu, S.C.; Rafii, M.Y.; Ramlee, S.I.; Ismail, S.I.; Oladosu, Y.; Okporie, E.; Onyishi, G.; Utobo, E.; Ekwu, L.; Swaray, S.; et al. Marker-assisted selection and gene pyramiding for resistance to bacterial leaf blight disease of rice (Oryza sativa L.). Biotechnol. Biotechnol. Equip. 2019, 33, 440–455. [Google Scholar] [CrossRef]
  33. Tanksley, S.D.; Young, N.D.; Paterson, A.H.; Bonierbale, M.W. RFLP Mapping in Plant Breeding: New Tools for an Old Science. Nat. Biotechnol. 1989, 7, 257–264. [Google Scholar] [CrossRef]
  34. Visscher, P.M.; Haley, C.S.; Thompson, R. Marker-Assisted Introgression in Backcross Breeding Programs. Genetics 1996, 144, 1923–1932. [Google Scholar] [CrossRef] [PubMed]
  35. Oladosu, Y.; Rafii, M.Y.; Arolu, F.; Chukwu, S.C.; Salisu, M.A.; Fagbohun, I.K.; Muftaudeen, T.K.; Swaray, S.; Haliru, B.S. Superabsorbent Polymer Hydrogels for Sustainable Agriculture: A Review. Horticulturae 2022, 8, 605. [Google Scholar] [CrossRef]
  36. Tanksley, S.D. Molecular markers in plant breeding. Plant Mol. Biol. Rep. 1983, 1, 3–8. [Google Scholar] [CrossRef]
  37. Miah, G.; Rafii, M.Y.; Ismail, M.R.; Puteh, A.B.; Rahim, H.A.; Latif, M.A. Recurrent parent genome recovery analysis in a mark-er-assisted backcrossing program of rice (Oryza sativa L.). Comptesrendusbiologies 2015, 338, 83–94. [Google Scholar]
  38. Melchinger, A.E. Use of Molecular Markers in Breeding for Oligogenic Disease Resistance. Plant Breed. 1990, 104, 1–19. [Google Scholar] [CrossRef]
  39. Rathour, R.; Chopra, M.; Sharma, T.R. Development and validation of microsatellite markers linked to the rice blast resistance gene Pi-z of Fukunishiki and Zenith. Euphytica 2008, 163, 275–282. [Google Scholar] [CrossRef]
  40. Fjellstrom, R.; McClung, A.M.; Shank, A.R. SSR Markers Closely Linked to the Pi-z Locus are Useful for Selection of Blast Resistance in a Broad Array of Rice Germplasm. Mol. Breed. 2006, 17, 149–157. [Google Scholar] [CrossRef]
  41. Mondal, U.; Khanom, M.; Hassan, L.; Begum, S. Foreground selection through SSRs markers for the development of salt tolerant rice variety. J. Bangladesh Agric. Univ. 2013, 11, 67–72. [Google Scholar] [CrossRef]
  42. Ebem, E.C.; Afuape, S.O.; Chukwu, S.C.; Ubi, B.E. Genotype × Environment Interaction and Stability Analysis for Root Yield in Sweet Potato [Ipomoea batatas (L.) Lam]. Front. Agron. 2021, 3, 1–14. [Google Scholar] [CrossRef]
  43. Young, N.D.; Tanksley, S.D. RFLP analysis of the size of chromosomal segments retained around the Tm-2 locus of tomato during backcross breeding. Theor. Appl. Genet. 1989, 77, 353–359. [Google Scholar] [CrossRef]
  44. Luu, M.C.; Luu, T.N.H.; Pham, T.M.H.; Vu, T.T.H.; Nguyen, Q.D.; Pham, T.M.; Vu, D.Q.; Abdelbagi, M.I.; Le, H.H. Application of marker assisted backcrossing to introgress the submergence tolerance QTL SUB1 into the Vietnam elite rice variety-AS996. Am. J. Plant Sci. 2012, 25, 2012. [Google Scholar]
  45. Semagn, K.; Ndjiondjopd, M.N.; Cissoko, M. Microsatellites and agronomic traits for assessing genetic relationships among 18 New Rice for Africa (NERICA) varieties. Afr. J. Biotechnol. 2006, 5, 42852. [Google Scholar]
  46. Hospital, F.; DeCoux, G. Popmin: A program for the numerical optimization of population sizes in marker-assisted backcross programs. J. Hered. 2002, 93, 383–384. [Google Scholar] [CrossRef] [PubMed]
  47. Basavaraj, S.H.; Singh, V.K.; Singh, A.; Singh, A.; Singh, A.; Anand, D.; Yadav, S.; Ellur, R.K.; Singh, D.; Krishnan, S.G.; et al. Marker-assisted improvement of bacterial blight resistance in parental lines of Pusa RH10, a superfine grain aromatic rice hybrid. Mol. Breed. 2010, 26, 293–305. [Google Scholar] [CrossRef]
  48. Singh, A.K.; Sarma, B.K.; Singh, P.K.; Nandan, R. Screening of rice (Oryza sativa L.) germplasms against Xanthomonas oryzaepv. oryzae. J. Eco-Friendly Agric. 2013, 8, 86–88. [Google Scholar]
  49. Gopalakrishnan, S.; Sharma, R.K.; Anand Rajkumar, K.; Joseph, M.; Singh, V.P.; Singh, A.K.; Bhat, K.V.; Singh, N.K.; Mohapatra, T. Integrating marker assisted background analysis with foreground selection for identification of superior bacterial blight re-sistant recombinants in Basmati rice. Plant Breed. 2008, 127, 131–139. [Google Scholar] [CrossRef]
  50. Chukwu, S.C.; Rafii, M.Y.; Ramlee, S.I.; Ismail, S.I.; Oladosu, Y.; Muhammad, I.I.; Ubi, B.E.; Nwokwu, G. Genetic analysis of microsat-ellites associated with resistance against bacterial leaf blight and blast diseases of rice (Oryza sativa L.). Biotechnol. Biotechnol. Equip. 2020, 34, 898–904. [Google Scholar] [CrossRef]
  51. Jeung, J.U.; Heu, S.G.; Shin, M.S.; Vera Cruz, C.M.; Jena, K.K. Dynamics of Xanthomonas oryzaepv.oryzae populations in Korea and their relationship to known bacterial blight resistance genes. Phytopathology 2006, 96, 867–875. [Google Scholar] [CrossRef] [PubMed] [Green Version]
  52. Khanh, T.D.; Linh, L.H.; Linh, T.H.; Ham, L.H.; Xuan, T.D. Rapid and high-precision marker assisted backcrossing to introgress the SUB1 QTL into the Vietnamese elite rice variety. J. Plant Breed. Crop. Sci. 2013, 5, 26–33. [Google Scholar] [CrossRef]
  53. Ashkani, S.; Rafii, M.Y.; Rusli, I.; Sariah, M.; Abdullah, S.N.A.; Rahim, H.A.; Latif, M.A. SSRs for Marker-Assisted Selection for Blast Resistance in Rice (Oryza sativa L.). Plant Mol. Biol. Rep. 2011, 30, 79–86. [Google Scholar] [CrossRef]
  54. Okporie, E.O.; Chukwu, S.C.; Onyishi, G.C. Phenotypic recurrent selection for increase yield and chemical constituents of maize (Zea mays L.). World Appl. Sci. J. 2013, 21, 994–999. [Google Scholar]
  55. Chukwu, S.C.; Ibeji, C.A.; Ogbu, C.; Oselebe, H.O.; Okporie, E.O.; Rafii, M.Y.; Oladosu, Y. Primordial Initiation, Yield and Yield Component Traits of Two Genotypes of Oyster Mushroom (Pleurotus spp.) as Affected by Various Rates of Lime. Sci. Rep. Springer Nat. 2022; in press. [Google Scholar]
  56. Kusutani, A.; Cui, J.; Toyota, M.; Asanuma, K.I. Studies on the varietal difference of harvest index in rice: Relationship between harvest index and morphological characteristics and leaf color. Jpn. J. Crop. Sci. 2000, 69, 359–364. [Google Scholar]
  57. Chukwu, S.C.; Ekwu, L.G.; Onyishi, G.C.; Okporie, E.O.; Obi, I.U. Correlation between agronomic and chemical characteristics of maize (Zea mays L.) genotypes after two years of mass selection. Int. J. Sci. Res. 2013, 4, 1708–1712. [Google Scholar]
  58. Sarif, H.M.; Rafii, M.Y.; Ramli, A.; Oladosu, Y.; Musa, H.M.; Rahim, H.A.; Zuki, Z.M.; Chukwu, S.C. Genetic diversity and variability among pigmented rice germplasm using molecular marker and morphological traits. Biotechnol. Biotechnol. Equip. 2020, 34, 747–762. [Google Scholar] [CrossRef]
  59. Ji, Z.-J.; Yang, S.-D.; Zeng, Y.-X.; Liang, Y.; Yang, C.-D.; Qian, Q. Pyramiding blast, bacterial blight and brown planthopper resistance genes in rice restorer lines. J. Integr. Agric. 2016, 15, 1432–1440. [Google Scholar] [CrossRef]
  60. Blair, M.W.; Garris, A.J.; Iyer, A.S.; Chapman, B.; Kresovich, S.; McCouch, S.R. High resolution genetic mapping and candidate gene identification at the xa5 locus for bacterial blight resistance in rice (Oryza sativa L.). Theor. Appl. Genet. 2003, 107, 62–73. [Google Scholar] [CrossRef]
  61. Zhang, G.Q.; Angeles, E.R.; Abenes, M.L.; Khush, G.S.; Huang, N. RAPD and RFLP mapping of the bacterial blight resistance gene xa-13 in rice. Theor. Appl. Genetics. 1996, 93, 65–70. [Google Scholar] [CrossRef]
  62. Singh, A.K.; Gopalakrishnan, S.; Singh, V.P.; Prabhu, K.V.; Mohapatra, T.; Singh, N.K.; Sharma, T.R.; Nagarajan, M.; Vinod, K.K.; Singh, D.; et al. Marker assisted selection: A paradigm shift in Basmati breeding. Indian J. Genet. Plant Breeding. 2011, 71, 120. [Google Scholar]
  63. Dokku, P.; Das, K.M.; Rao, G.J.N. Genetic enhancement of host plant-resistance of the Lalat cultivar of rice against bacterial blight employing marker-assisted selection. Biotechnol. Lett. 2013, 35, 1339–1348. [Google Scholar] [CrossRef]
  64. Singh, A.K.; Dharmraj, E.; Nayak, R.; Singh, P.K.; Singh, N.K. Identification of bacterial leaf blight resistance genes in wild rice of eastern India. Turk. J. Bot. 2015, 39, 1060–1066. [Google Scholar] [CrossRef]
  65. McCouch, S.R.; Sebastian, L.S.; Ikeda, R.; Huang, N.; Imbe, T.; Coffman, W.R. Molecular mapping of resistance to rice tungro spherical virus and green leafhopper. Phytopathol. 1996, 86, 25–30. [Google Scholar]
  66. Yoshimura, S.; Yoshimura, A.; Iwata, N.; McCouch, S.R.; Abenes, M.L.; Baraoidan, M.R.; Mew, T.W.; Nelson, R.J. Tagging and combin-ing bacterial blight resistance genes in rice using RAPD and RFLP markers. Mol. Breeding. 1995, 1, 375–387. [Google Scholar] [CrossRef]
  67. Ronald, P.C.; Albano, B.; Tabien, R.; Abenes, L.; Wu, K.S.; McCouch, S.; Tanksley, S.D. Genetic and physical analysis of the rice bacte-rial blight disease resistance locus, Xa21. Mol. Gen. Genet. MGG 1992, 236, 113–120. [Google Scholar] [CrossRef] [Green Version]
  68. Amgai, R.B.; Niroula, R.K.; Pantha, S.; Hamal, S.S.; Tamang, B.G.; Sah, B.P.; Bhatta, M.R. Marker Assisted Screening of Nepalese rice for bacterial leaf blight (BLB) resistance. Nepal J. Biotechnol. 2015, 3, 35–39. [Google Scholar] [CrossRef]
  69. Deshmukh, U.C.; Verma, R.K.; Saxena, R.R.; Mohan, P.; Verulkar, S.B.; Chandra, D.U.; Kumar, V.R.; Pratibha, M. Marker assisted selection for bacterial leaf blight resistance in segregating populations of Karma Mahsuri. Vegetos 2017, 30, 55. [Google Scholar] [CrossRef]
  70. Sundaram, R.M.; Laha, G.S.; Viraktamath, B.C.; Sujatha, K.; Natarajkumar, P.; Hari, Y.; Srinivasa Rao, K.; Reddy, C.S.; Balachandran, S.M.; Madhav, M.S.; et al. Marker assisted breeding for development of bacterial blight resistant rice. In Genomics and Crop Improvement: Relevance and Reservations; Institute of Biotechnology, Acharya NG Ranga Agricultural University: Hyderabad, Indian, 2011; Volume 500, pp. 154–182. [Google Scholar]
  71. Rajpurohit, D.; Kumar, R.; Kumar, M.; Paul, P.; Awasthi, A.; Basha, P.O.; Puri, A.; Jhang, T.; Singh, K.; Dhaliwal, H.S. Pyramiding of two bacterial blight resistance and a semidwarfing gene in Type 3 Basmati using marker-assisted selection. Euphytica 2010, 178, 111–126. [Google Scholar] [CrossRef]
  72. Huang, N.; Angeles, E.R.; Domingo, J.; Magpantay, G.; Singh, S.; Zhang, G.; Kumaravadivel, N.; Bennett, J.; Khush, G.S. Pyramiding of bacterial blight resistance genes in rice: Marker-assisted selection using RFLP and PCR. Theor. Appl. Genet. 1997, 95, 313–320. [Google Scholar] [CrossRef]
  73. Bojun, M.; Wenming, W.; Bin, Z.; Yongli, Z.; Lihuang, Z.; Wenxue, Z. Studies of PCR marker for the rice bacterial blight resistance gene Xa-4. Yi Chuan Hered. 1999, 21, 9–12. [Google Scholar]
  74. Miah, G.; Rafii, M.Y.; Ismail, M.R.; Puteh, A.B.; Rahim, H.A.; Latif, M.A. Marker-assisted introgression of broad-spectrum blast resistance genes into the cultivated MR219 rice variety. J. Sci. Food Agric. 2017, 97, 2810–2818. [Google Scholar] [CrossRef]
Figure 1. All linkage groups across 12 chromosomes of the 16 improved selected rice lines. Note: Red lines represent homozygous regions for recurrent parent (Putra-1) alleles, blue lines represent homozygous regions for donor parent (IRBB60) alleles while yellow lines represent heterozygous regions.
Diversity 14 00812 g001
Figure 2. Quantitative traits performance of the newly improved selected lines and their recurrent parent (RP).
Diversity 14 00812 g002
Figure 3. Phenotypic expression of the newly improved and parental lines. Note: (A) improved line, (B) recurrent parent and (C) parental and Improved lines.
Diversity 14 00812 g003
Table 1. SSR marker information used for the genotypic selection of the newly improved rice lines.
S/nMarkerGeneChromo.Primer Sequence (F)Exp. (bp)Putra1
(bp)
IRBB60
(bp)
Blast
1.RM6836Piz, Pi2, Pi96F: TGTTGCATATGGTGCTATTTGA
R: GATACGGCTTCTAGGCCAAA
240244218
2.RM8225Piz6F: ATGCGTGTTCAGAAATTAGG
R: TTGTTGTATACCTCATCGACAG
221268246
BLB
3.MPXa44F: ATCGATCGATCTTCACGAGG
R: TCGTATAAAAGGCATTCGGG
150219104
4.RM13xa55F: TCCAACATGGCAAGAGAGAG
R: GGTGGCATTCGATTCCAG
141187162
5.RM21xa511F: ACAGTATTCCGTAGGCACGG
R: GCTCCATGAGGGTGGTAGAG
157164154
6.Xa13promxa138F: GGCCATGGCTCAGTGTTTAT
R: GAGCTCCAGCTCTCCAAATG
450311484
7.Xa21FRXa2111F: TCCAACATGGCAAGAGAGAG
R: GGTGGCATTCGATTCCAG
140144132
8.pTA248Xa2111F: AGACGCGGAAGGGTGGTTCCCGGA
R: AGACGCGGTAATCGAAGATGAAA
925500687
Table 2. Description of agro-morphological traits studied for phenotypic selection of improved lines.
S/nParameterCodeDescription
1.Plant heightPHThis was measured from the soil surface to the tip of the tallest flag leaf. The unit of measurement is centimetres (cm).
2.Days to floweringDFCounted from the days from planting until 50% flowering. The unit of measurement is days.
3.Days to maturityDMCounted from the days from planting until 80% of the grains became golden yellow. The unit of measurement is days.
4.Total number of productive tillers per plantNTCounted as all of the tillers on each plant bearing panicles with grains. The unit of measurement is number.
5.Panicle lengthPLMeasured from the first node to the tip of the last spikelet (excluding awns). The unit of measurement is centimetres (cm).
6.Total number of filled grains per panicleTNG/PThis was recorded as the total number of matured spikelets filled with grains per panicle. The unit of measurement is number.
7.Total number of unfilled grains per panicleNUFGCounted as the number of spikelets without seed or grain. The unit of measurement is number.
8.1000-grain weight1000-GWOne thousand filled grains were counted and weighed. The unit of measurement is gramme (g).
9.Grain yield per plantY/PAll the grains harvested from each plant were weighed. The unit of measurement is gramme (g).
10.Seed lengthSLTen grains were measured using a Vernier calliper (Mitutoyo, Japan) from the base of the lowermost sterile lemma to the tip of the fertile lemma or palea. The unit of measurement is millimetre (mm).
11.Seed widthSWTen grains were measured using a Vernier calliper (Mitutoyo, Japan) from the distance across the fertile lemma and palea at the widest point. The unit of measurement is millimetre (mm).
12.Seed length:width ratioSLWRThis was recorded as seed length divided by the seed width.
13.Seed shapeSSThe seed shape was categorized using the record taken on seed length:width ratio.
14.Grain yield per hectareGY/haGrain yield per hectare was calculated using the equivalence of the grain yield per plant with a spacing of 25 cm × 25 cm.
Table 3. Genotypic composition of the selected lines based on the seven pyramided genes of resistance.
s/nImproved LinesXa21FR (Xa21)pTA248 (Xa21)Xa13prom
(xa13)
RM21
(xa5)
MP
(Xa4)
RM6836
(Pi2, Pi9, PiZ)
RM8225
(Piz)
1.BC2F2–157--++++++++++++
2.BC2F2–122---+++++-++++
3.BC2F2–9++-++--++++++
4.BC2F2–196+-+++---++++++
5.BC2F2–120----+++-++++++
6.BC2F2–208++--+---++++++
7.BC2F2–155+++++---++++++
8.BC2F2–4++-+---++++++
9.BC2F2–109-----++++++++
10.BC2F2–161---++++++++
11.BC2F2–144---++--++++++
12.BC2F2–1----++--++++++
13.BC2F2–50----++--++++++
14.BC2F2–172---++--++++++
15.BC2F2–166----++++++++
16.BC2F2–14--++--++++++
Note: ++ homozygous dominant alleles; +- heterozygous alleles; -- homozygous recessive alleles; - single recessive allele.
Table 4. Phenotypic selection of improved lines on the basis of their quantitative traits studied on-farm.
Improved LinesPH (cm)FLWRNP/HDFDMNTPL (cm)TNG/P1000 GW (g)TGW/H (g)SLWRY/HA (t/ha)
1103.0 o13.5 e11.0 g72.0 a,b108.0 a,b,c11.0 h38.6 a154.0 f,g,h78.6 e57.4 e3.4 h9.2 b,c
2117.0 d13.2 g13.0 g,f78.0 a,b102.0 b,c15.0 e32.0 d,c152.0 g,h,i81.8 a,b53.6 g3.8 f8.6 c,d
3110.5 j12.2 j15.0 d,e,f73.0 a,b106.0 a,b,c17.0 c30.1 g,f137.0 i82.8 a59.3 d3.7 g9.5 b
4109.2 k9.7 o20.0 a75.0 b103.0 c18.0 b34.1 b172.0 d,e,f76.3 g56.3 f4.1 b9.0 c,b
5114.7 g13.1 h16.0 d,c74.0 a,b105.0 a,b,c14.0 f34.4 b177.0 d,e81.9 a,b60.7 c3.9 e9.7 b
6102.2 p11.5 m17.0 c,d,e79.0 a,b109.0 a,b,c18.0 b29.6 g142.0 h,i80.6 c44.5 k3.9 e7.1 f,g,h
7117.5 c11.7 l15.0 d,e,f77.0 a,b110.0 a,b,c17.0 c29.7 g136.0 i78.6 e45.1 j3.8 f7.2 e,f,g,h
8119.8 a17.6 a22.0 a,b76.0 a,b104.0 a,b,c26.0 a30.2 g,f196.0 b,c79.5 d49.9 h4.2 a8.0 d,e,f
9115.7 f13.3 f17.0 b,d,c72.0 a,b107.0 a,b15.0 e32.6 c166.0 e,f,g76.8 g46.1 j4.0 c7.4 e,f,g,h
10112.5 i12.1 k14.0 e,f79.0 a107.0 a,b,c16.0 d32.7 d,e207.0 a,b82.5 a64.0 b4.0 c10.2 b
11114.0 h15.0 d13.0 g,f77.0 a,b102.0 b,c12.0 g33.8 b203.0 a,b77.9 f,e43.6 l4.0 c7.0 e,f,g,h
12118.5 b11.1 n20.0 a,b,c75.0 a,b105.0 a,b,c17.0 c32.0 d,c205.0 a,b81.3 b,c41.5 m3.8 f6.6 h
1396.5 q15.3 c16.0 c,d,e74.0 b109.0 a,b,c18.0 b34.3 b209.0 a,b77.3 f73.8 a4.2 a11.8 a
14106.5 m16.3 b13.0 g,f76.0 a106.0 a,b,c15.0 e30.9 f,e211.0 a80.6 c48.2 i2.9 i7.7 e,f,g
15104.0 n9.7 o14.0 e,f75.0 a,b103.0 a,b,c17.0 c34.1 b172.0 d,e,f,g76.3 g56.3 f4.1 b9.0 b,c
16108.7 l15.0 d13.0 g,f77.0 a,b102.0 a,b,c11.0 h33.8 b203.0 d,c77.9 e,f43.6 l4.0 c7.0 g,h
Recurrent parent116.50 e12.56 i15.00 d,e,f85.67 a120.67 a15.00 e31.83 c,d,e148.00 f,g,h75.53 g50.41 h3.92 d8.07 ed
Note: Analysis of variance (ANOVA): means not followed by the same letter are significantly different (p < 0.05) from the other while means followed by the same letter are not significantly different (p > 0.05) from each other. All abbreviations are as described in Table 1.
Table 5. Observed and expected segregation ratios of resistant and susceptible plants in the BC2F2 generation challenged with pathotypes P7.7 and P7.2 of Xoo and Magnaporthe oryzae.
ReactionObservedExpectedChi-Square (3:1)p-Value
BLB
Resistant1701650.15p > 0.05
Susceptible44552.22p > 0.05
Total2202202.37p > 0.05
Blast
Resistant1551650.63p > 0.05
Susceptible65551.89p > 0.05
Total2202202.53p > 0.05
Df = 1, χ2(0.05,1) = 3.84.
Table 6. Correlation coefficients among lesion degree (BLD), lesion type (BLT) and percentage disease leaf area (%DLA) for pathotypes. P7.7 and P7.2 in parental and improved populations.
Xoo Pathotype P7.7Magnaportheoryzae Pathotype P7.2
TraitBLDBLT%DLABLDBLT%DLA
BLD1.00 1.00
BLT0.99 **1.00 0.99 **1.00
%DLA0.990.991.000.960.961.00
** Significant at p = 0.05.
Table 7. The Pearson correlation coefficients (r) among quantitative traits of selected lines.
PHFLLFLWLALAIFLWRNPHDFDMNLNTPLTNGPNUFGNTGWTGWHSLSWSLWRYHA
PH1.000.1250.0950.1510.1480.082−0.138−0.1150.027−0.254−0.2540.4550.496−0.364−0.2860.048−0.334−0.4700.1350.049
FLL 1.000.2470.950 **0.913 **0.942 **−0.073−0.147−0.025−0.027−0.0270.0540.262−0.295−0.0310.052−0.302−0.173−0.1080.052
FLW 1.000.533 *0.590 *−0.091−0.216−0.1870.340−0.216−0.2160.107−0.612 *−0.0220.201−0.0740.1470.133−0.039−0.074
LA 1.000.988 **0.791 **−0.122−0.2120.067−0.078−0.0780.1130.032−0.2810.0080.027−0.214−0.118−0.0960.028
LAI 1.000.732 **−0.013−0.2680.0870.0220.0220.175−0.014−0.2790.0240.132−0.176−0.143−0.0610.133
FLWR 1.00−0.009−0.070−0.1220.0360.036−0.0090.478−0.282−0.0780.073−0.369−0.213−0.1150.073
NPH 1.00−0.3040.0570.962 **0.962 **0.3200.109−0.1270.0270.928 **0.143−0.2170.2350.927**
DF 1.00−0.108−0.225−0.225−0.4890.0950.1520.324−0.2310.007−0.1450.150−0.231
DM 1.00−0.048−0.048−0.082−0.265−0.129−0.0750.172−0.137−0.024−0.1360.171
NL 1.001.000 **0.2970.037−0.1350.0240.867 **0.249−0.1500.2760.867 **
NT 1.000.2970.037−0.1350.0240.867 **0.249−0.1500.2760.867 **
PL 1.000.175−0.516 *−0.3450.423−0.099−0.072−0.0290.423
TNGP 1.00−0.029−0.0690.151−0.390−0.3870.0500.151
NUFG 1.000.437−0.2970.3830.1910.197−0.297
NTGW 1.000.0690.1380.514−0.3290.069
TGWH 1.000.069−0.2400.1931.000 **
SL 1.000.3160.622 **0.069
SW 1.00−0.532 *−0.241
SLWR 1.000.194
YHA 1.00
Note:* correlation coefficient significant at p < 0.05; ** correlation coefficient significant at p < 0.01. All abbreviations as described in Table 1.
Publisher’s Note: MDPI stays neutral with regard to jurisdictional claims in published maps and institutional affiliations.

