
Monitoring Plant Diversity to Support Agri-Environmental Schemes: Evaluating Statistical Models Informed by Satellite and Local Factors in Southern European Mountain Pastoral Systems

 , , ,
, , ,  , and
, and
Abstract
:1. Introduction
- (i)
- What is the statistical support for a spatial monitoring of plant diversity at parcel level, a policy making scale, in Southern European mountain grasslands?
- (ii)
- If support exists, what is the most supported pathway(s) and how do variables composing the best performing pathway(s) relate to plant diversity?
2. Materials and Methods
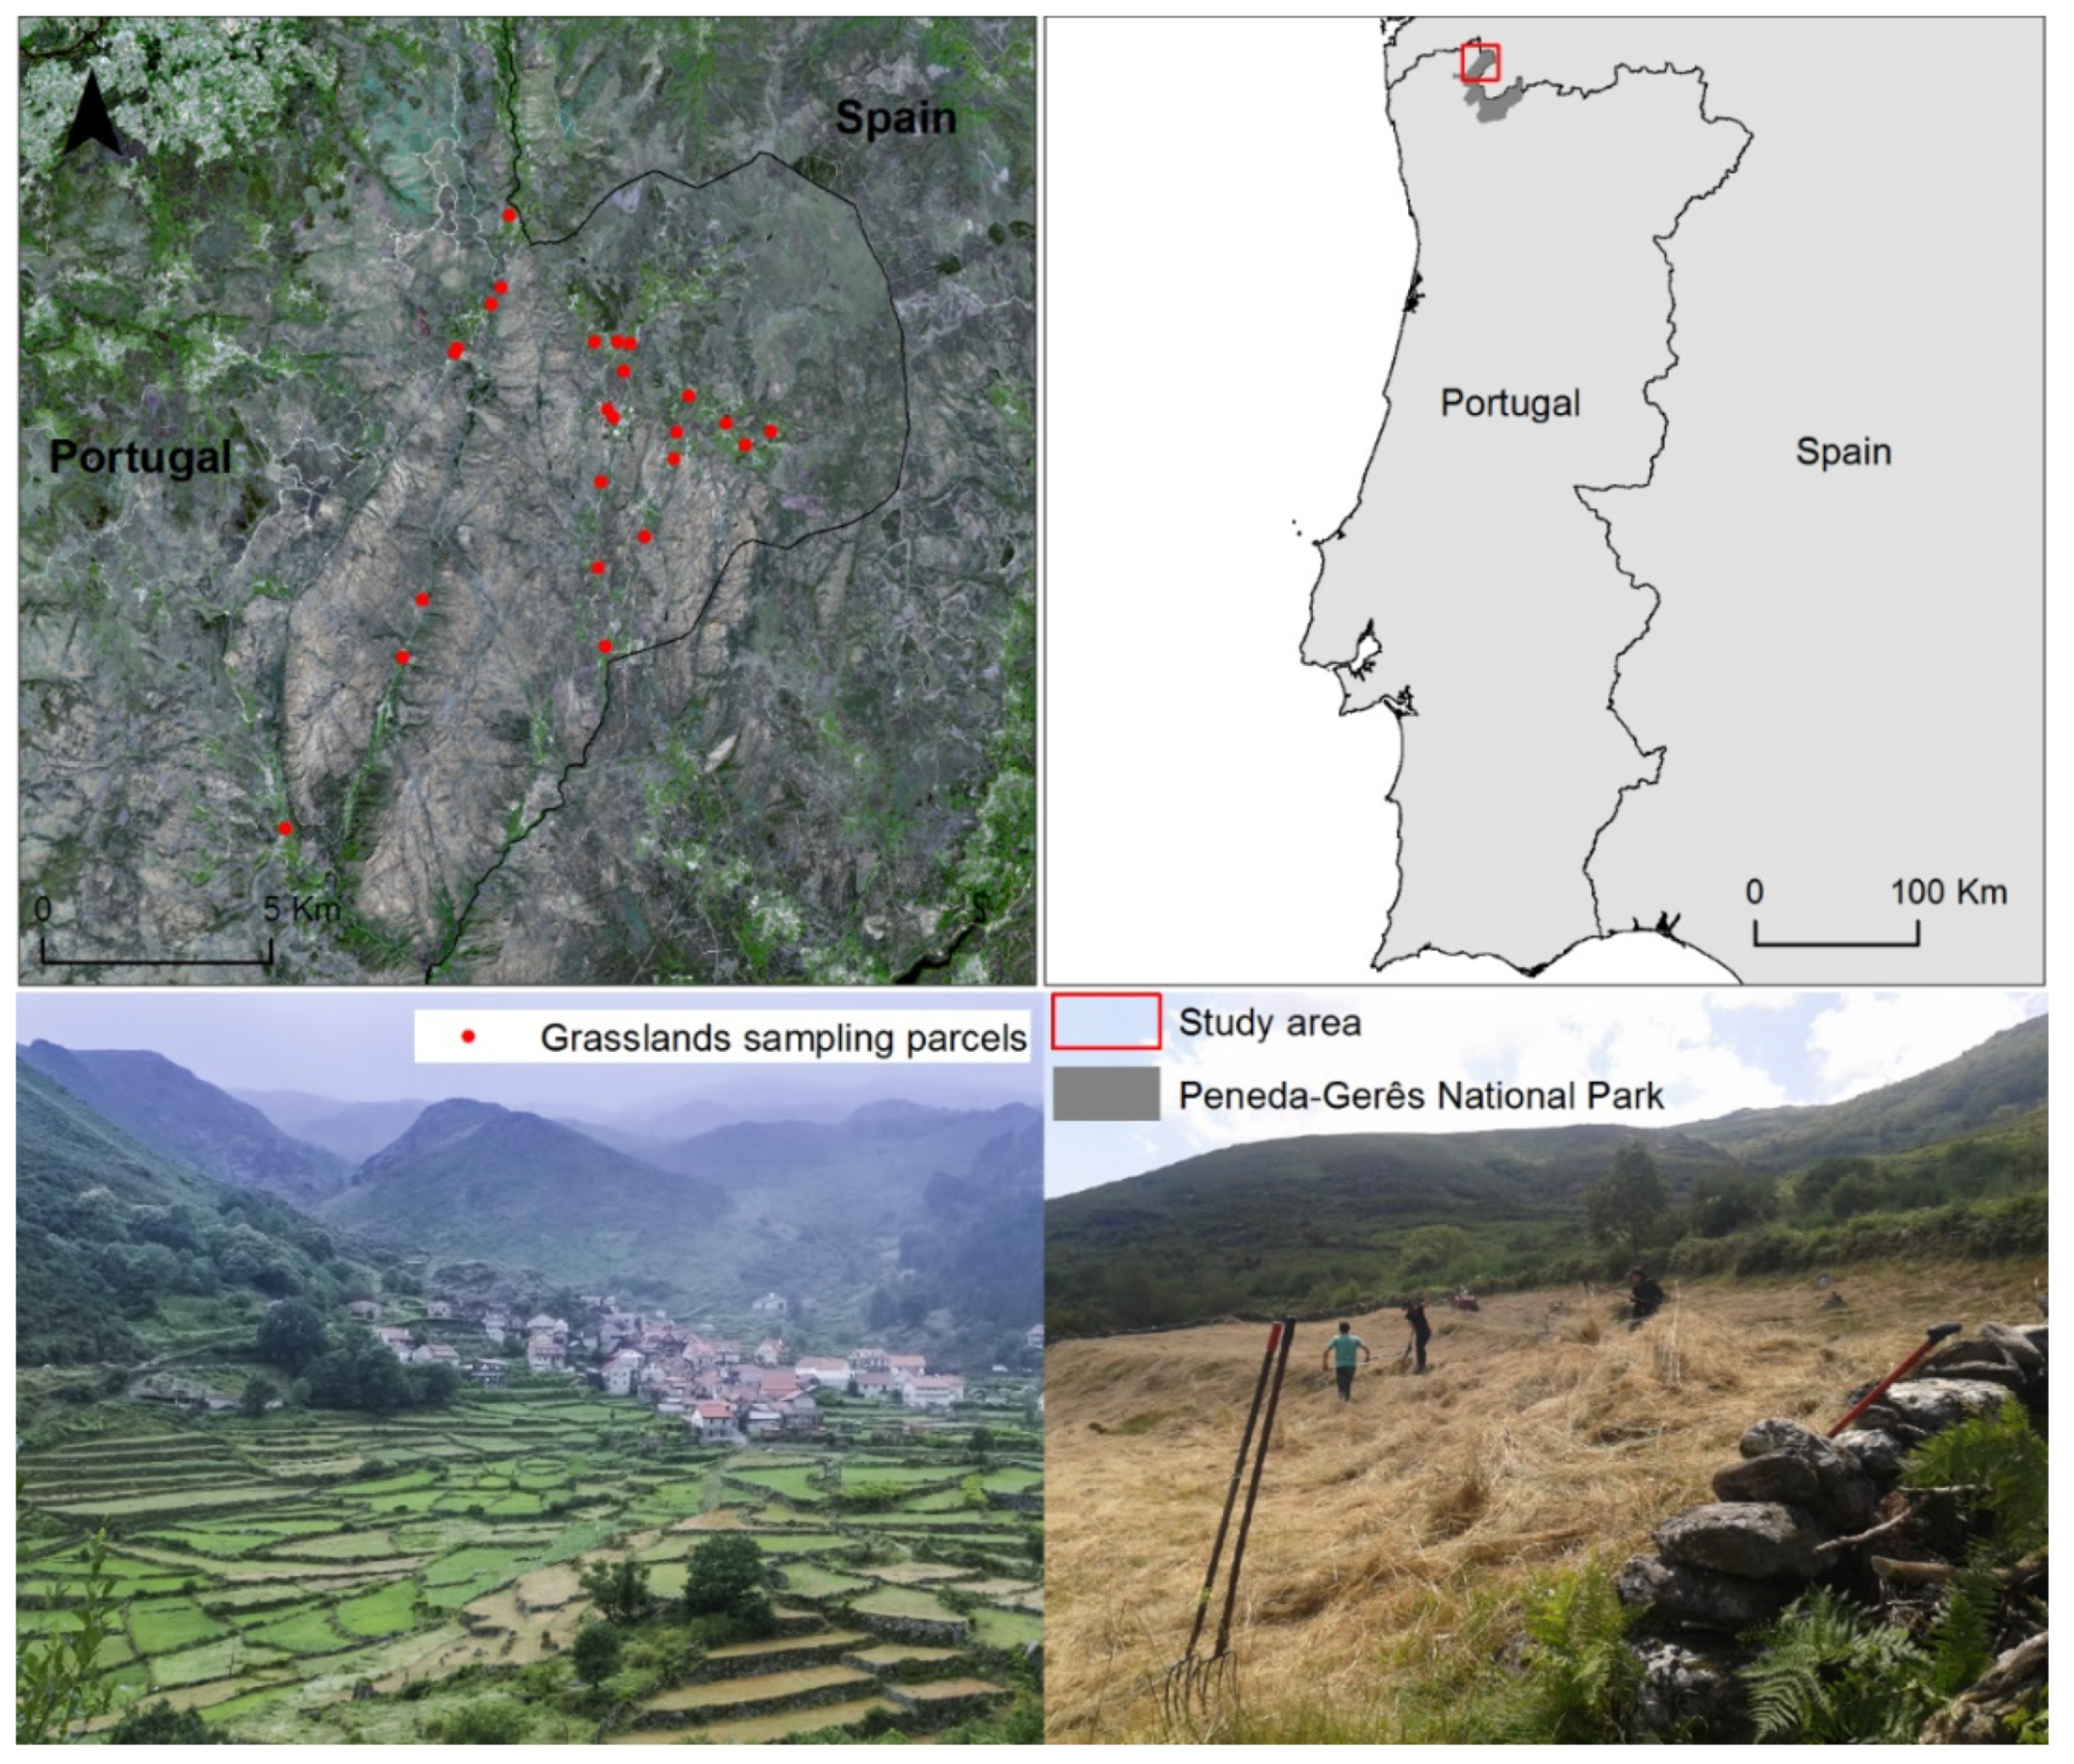
2.1. Study Area
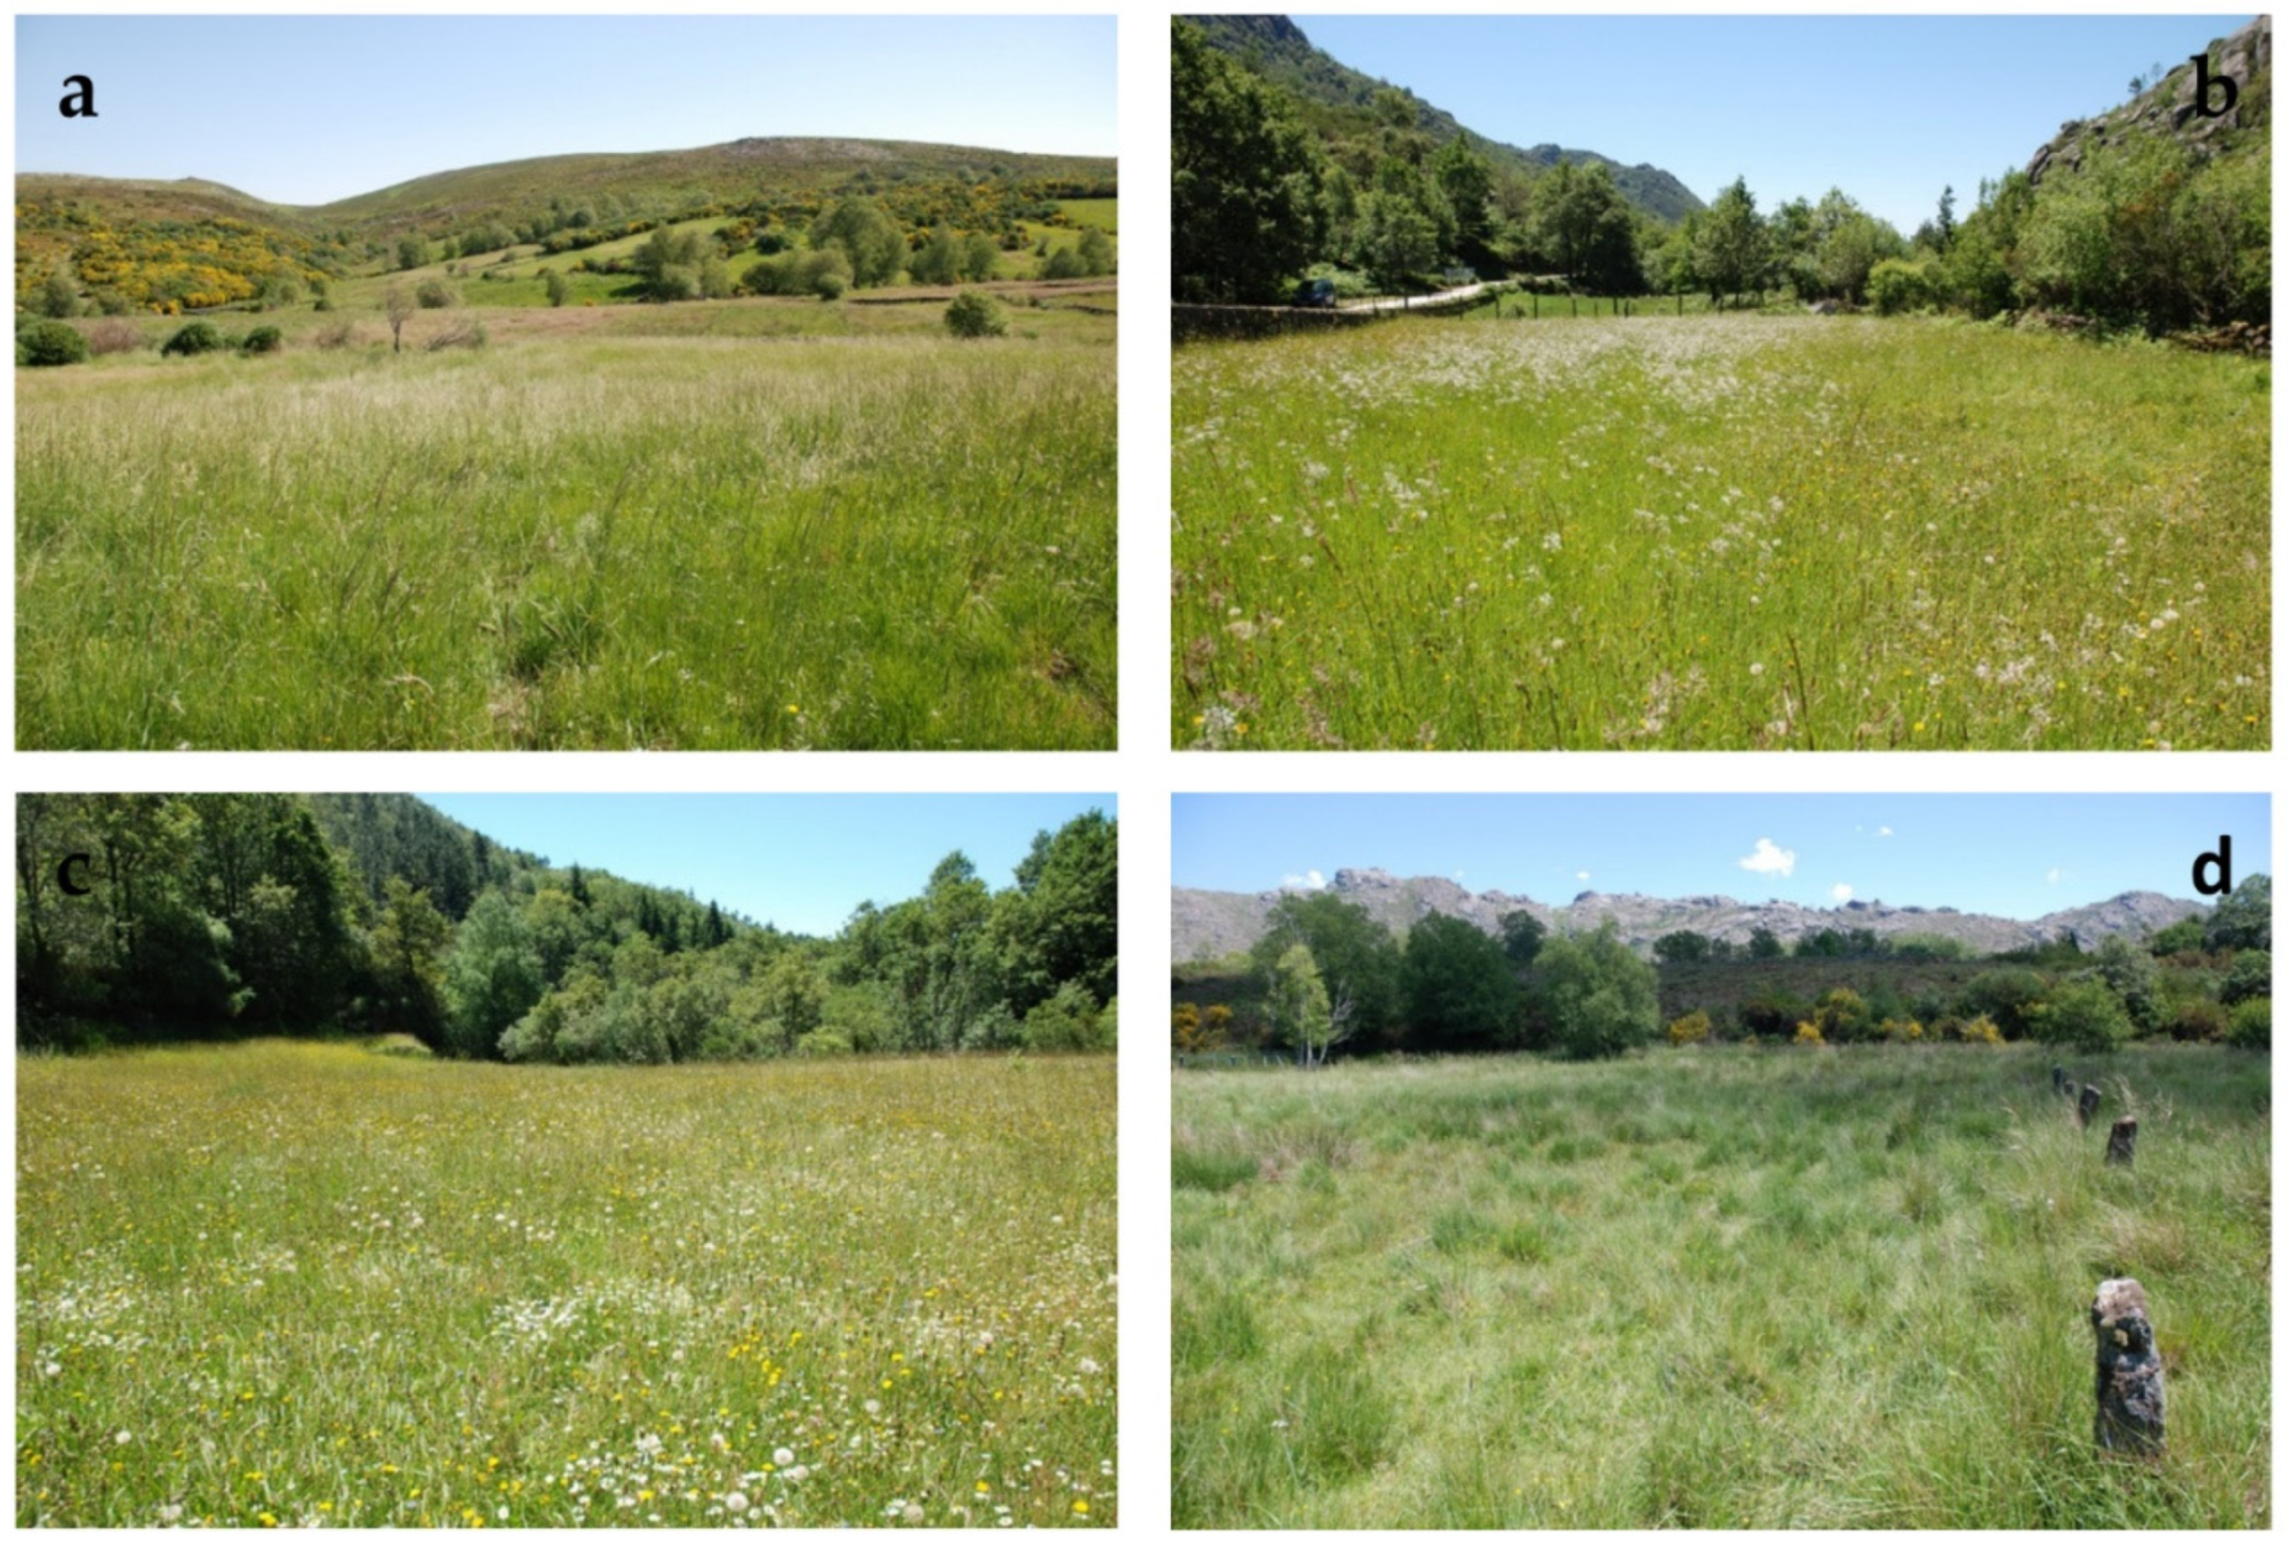
2.2. Field Data
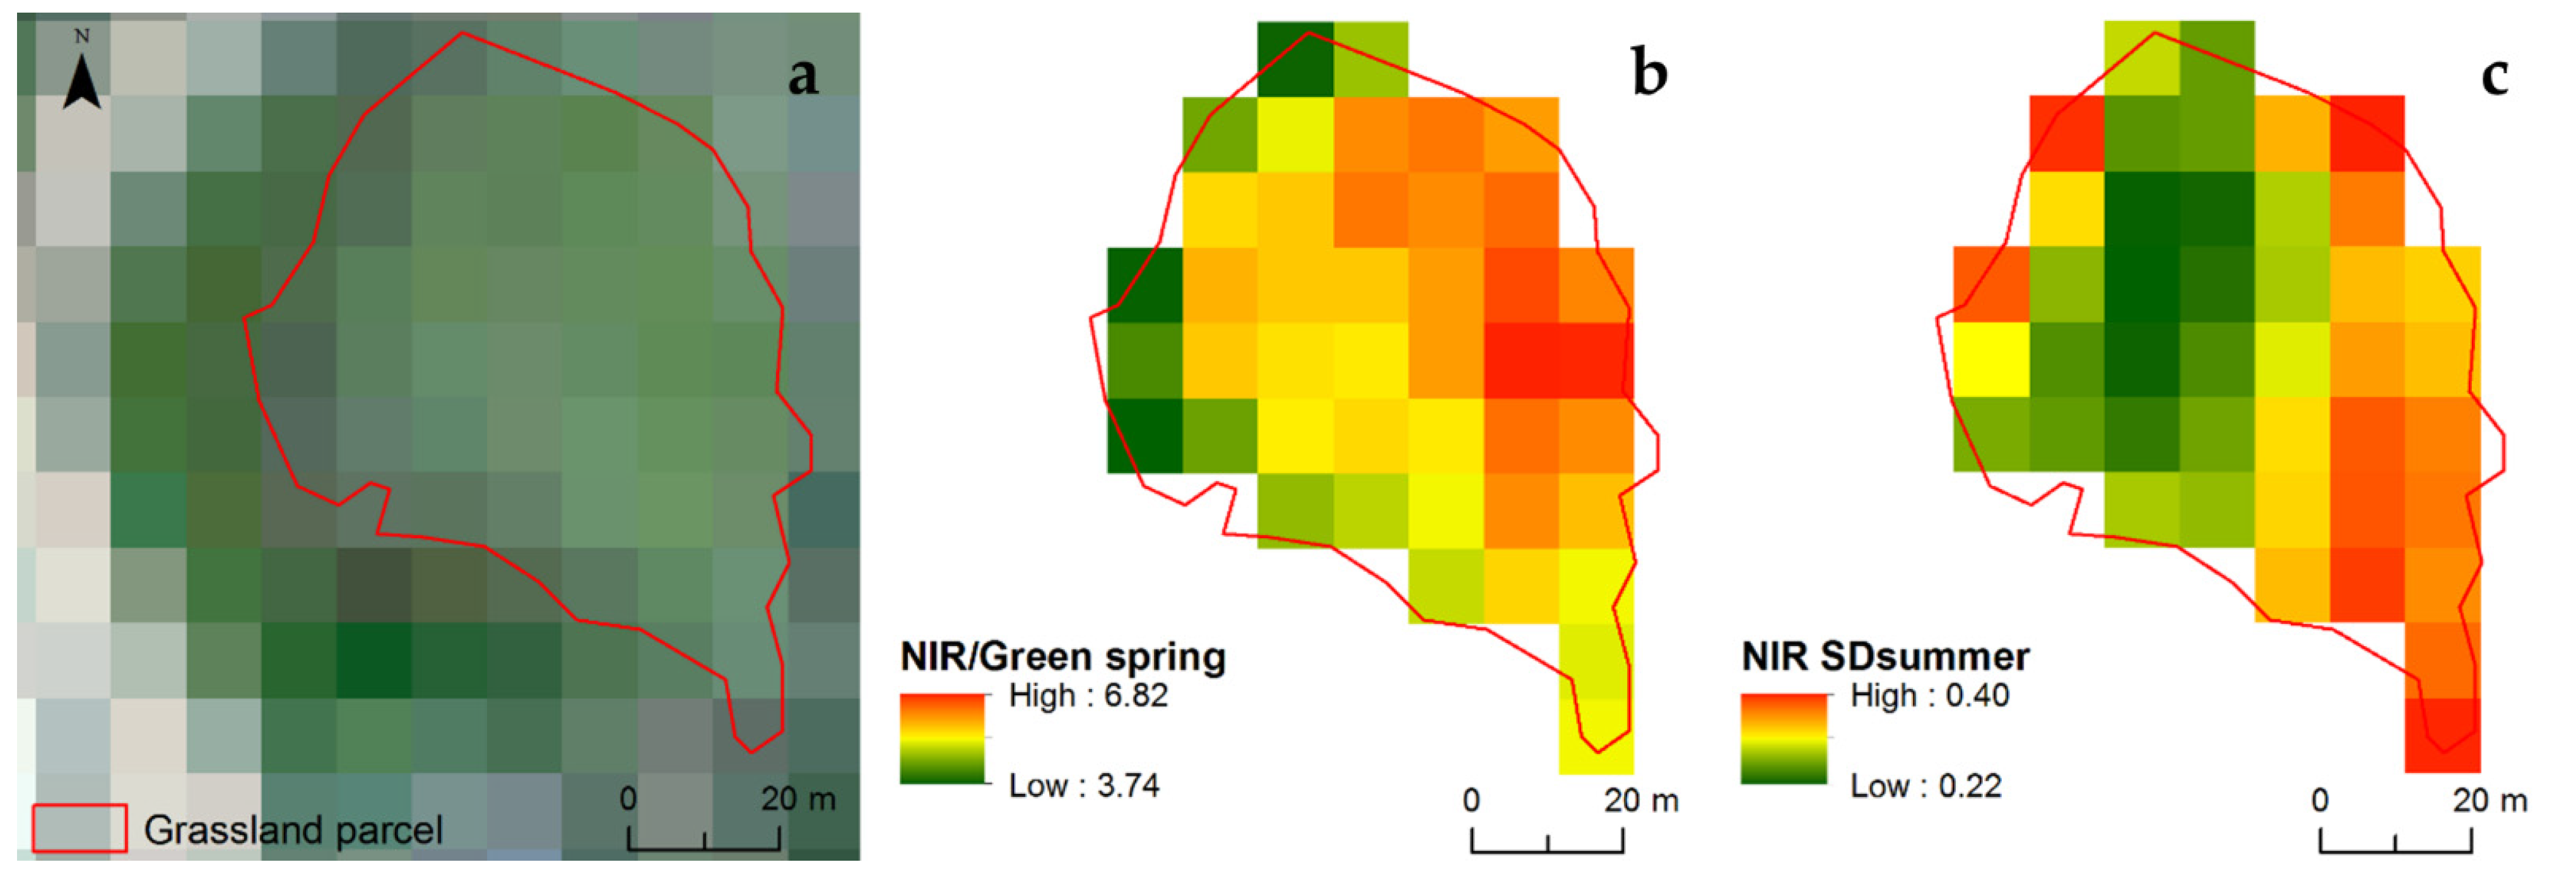
2.3. Remote Sensing and Spatial Environmental Data Collection
2.4. Competing Spatial Pathways
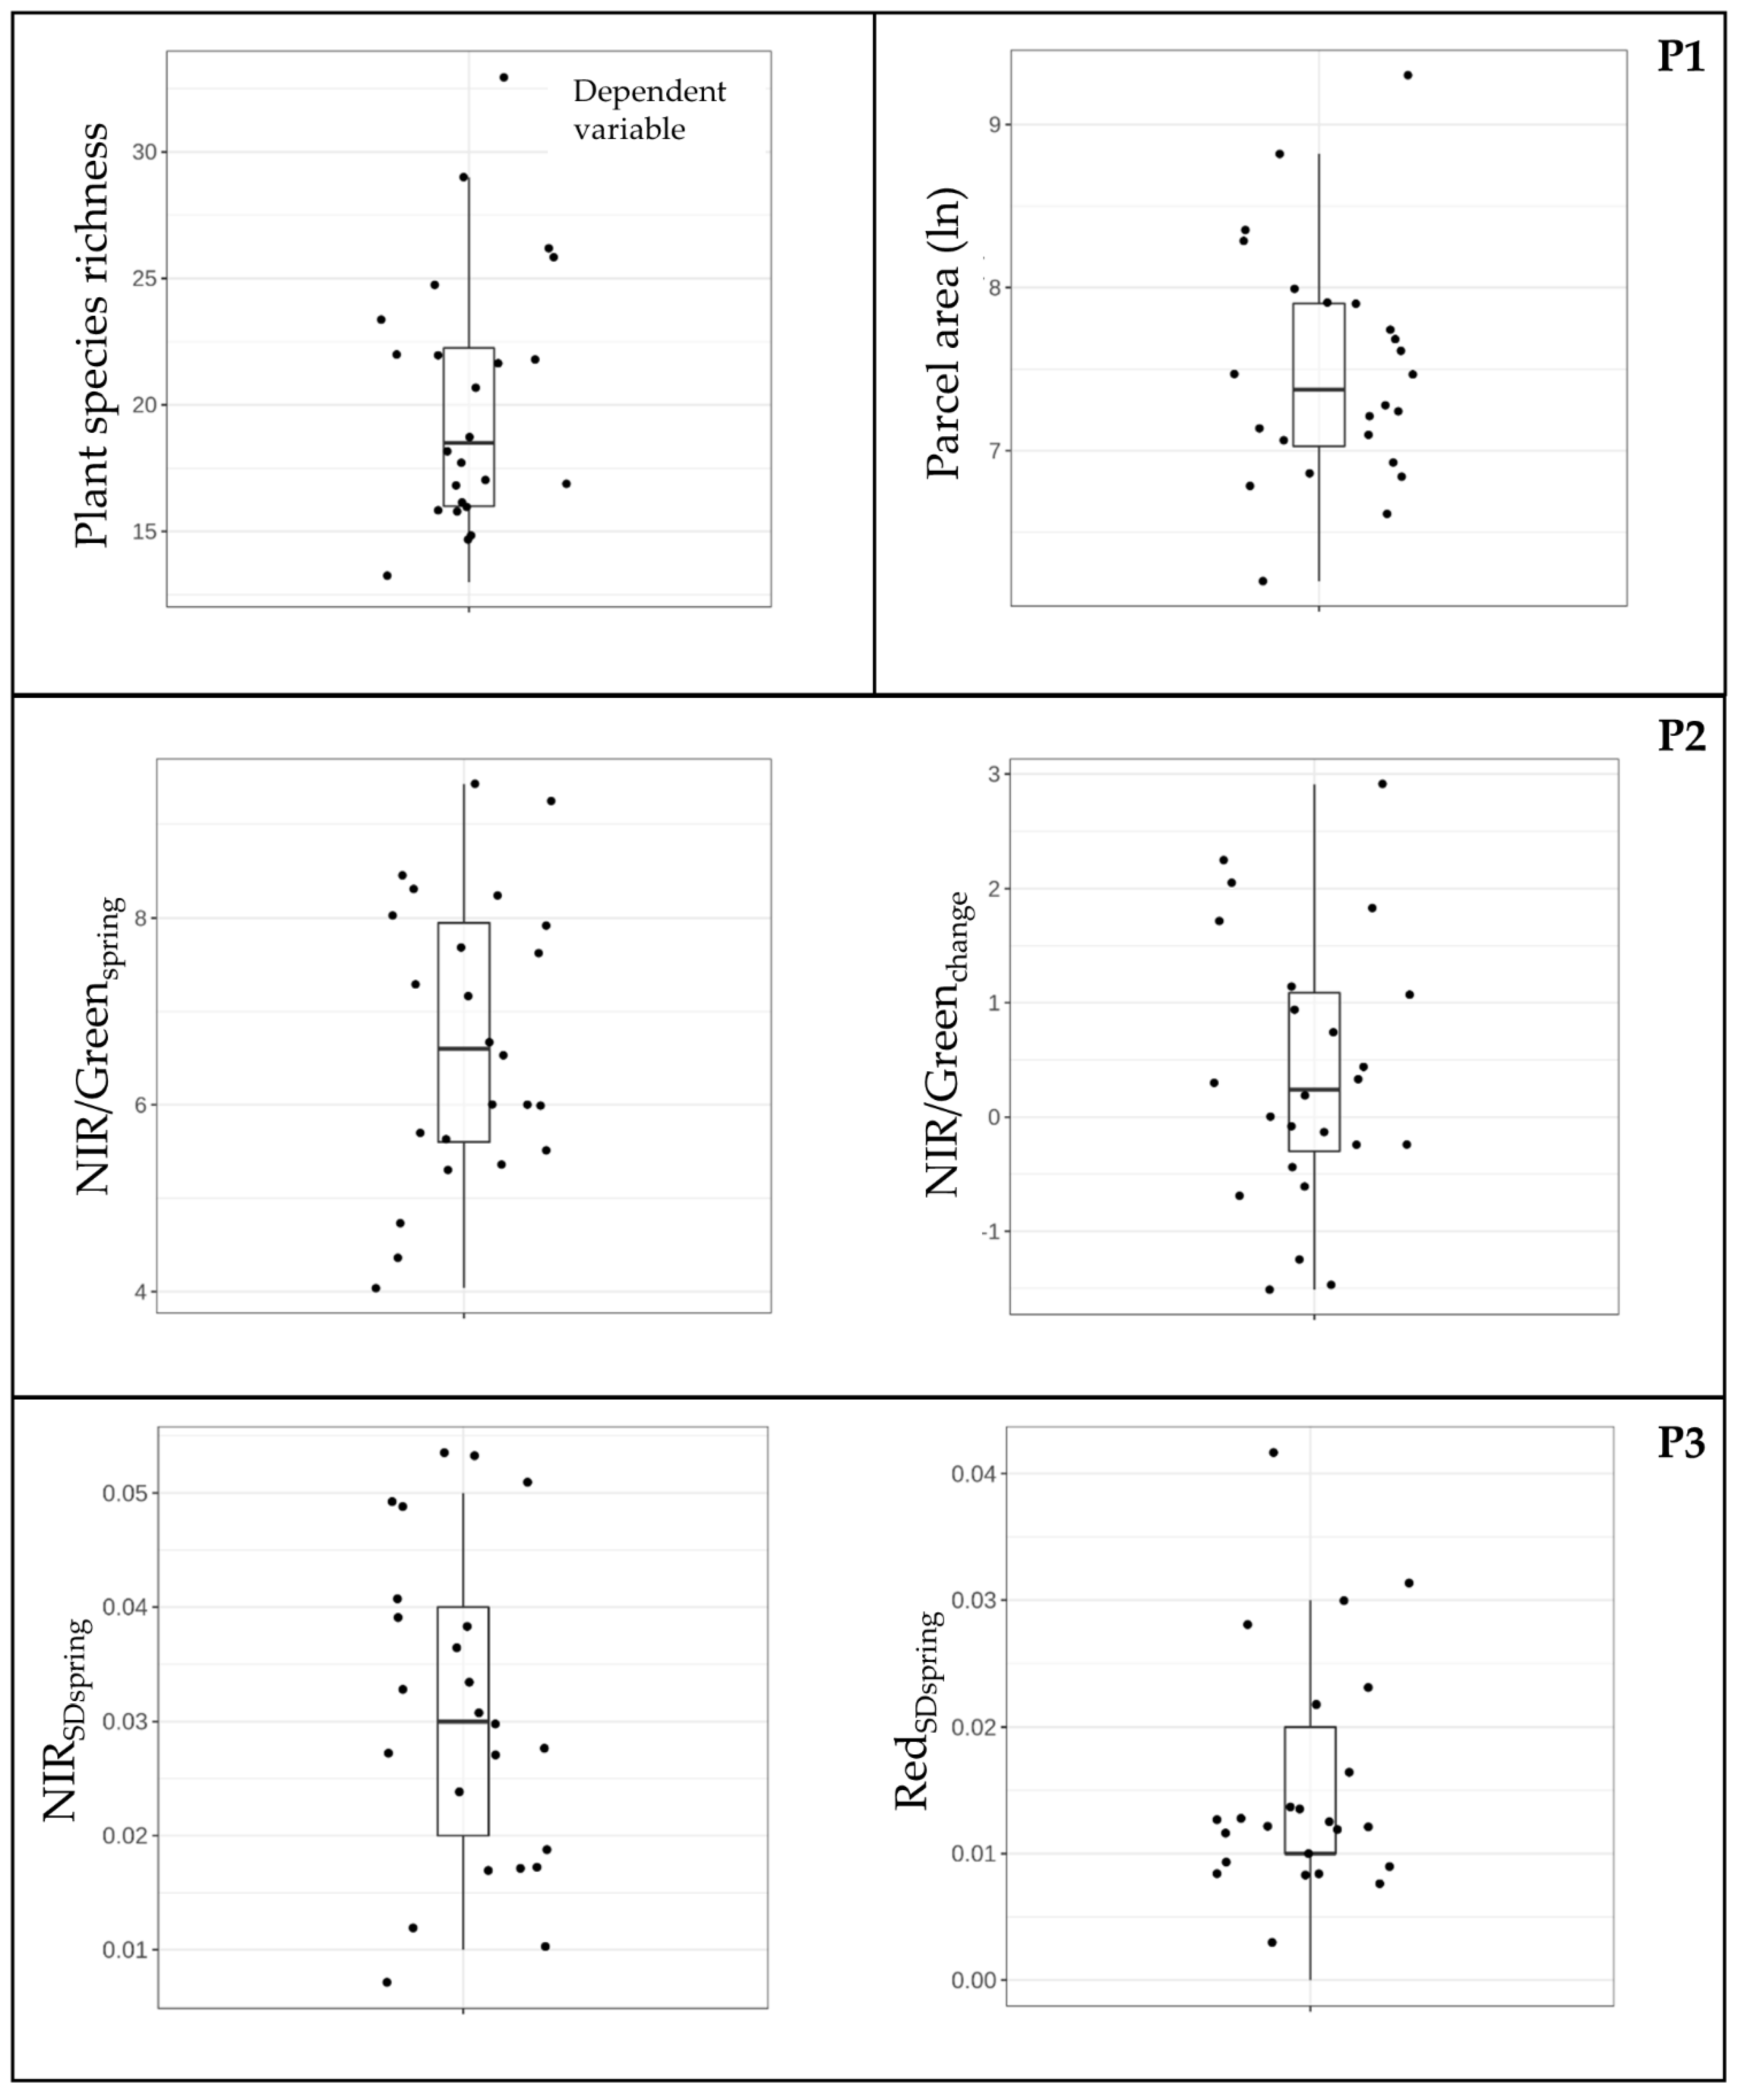
2.4.1. Species–Area (P1)
2.4.2. Species–Energy (P2)
2.4.3. Species–Spectral Heterogeneity (P3)
2.5. Model Selection and Accuracy Assessment
3. Results
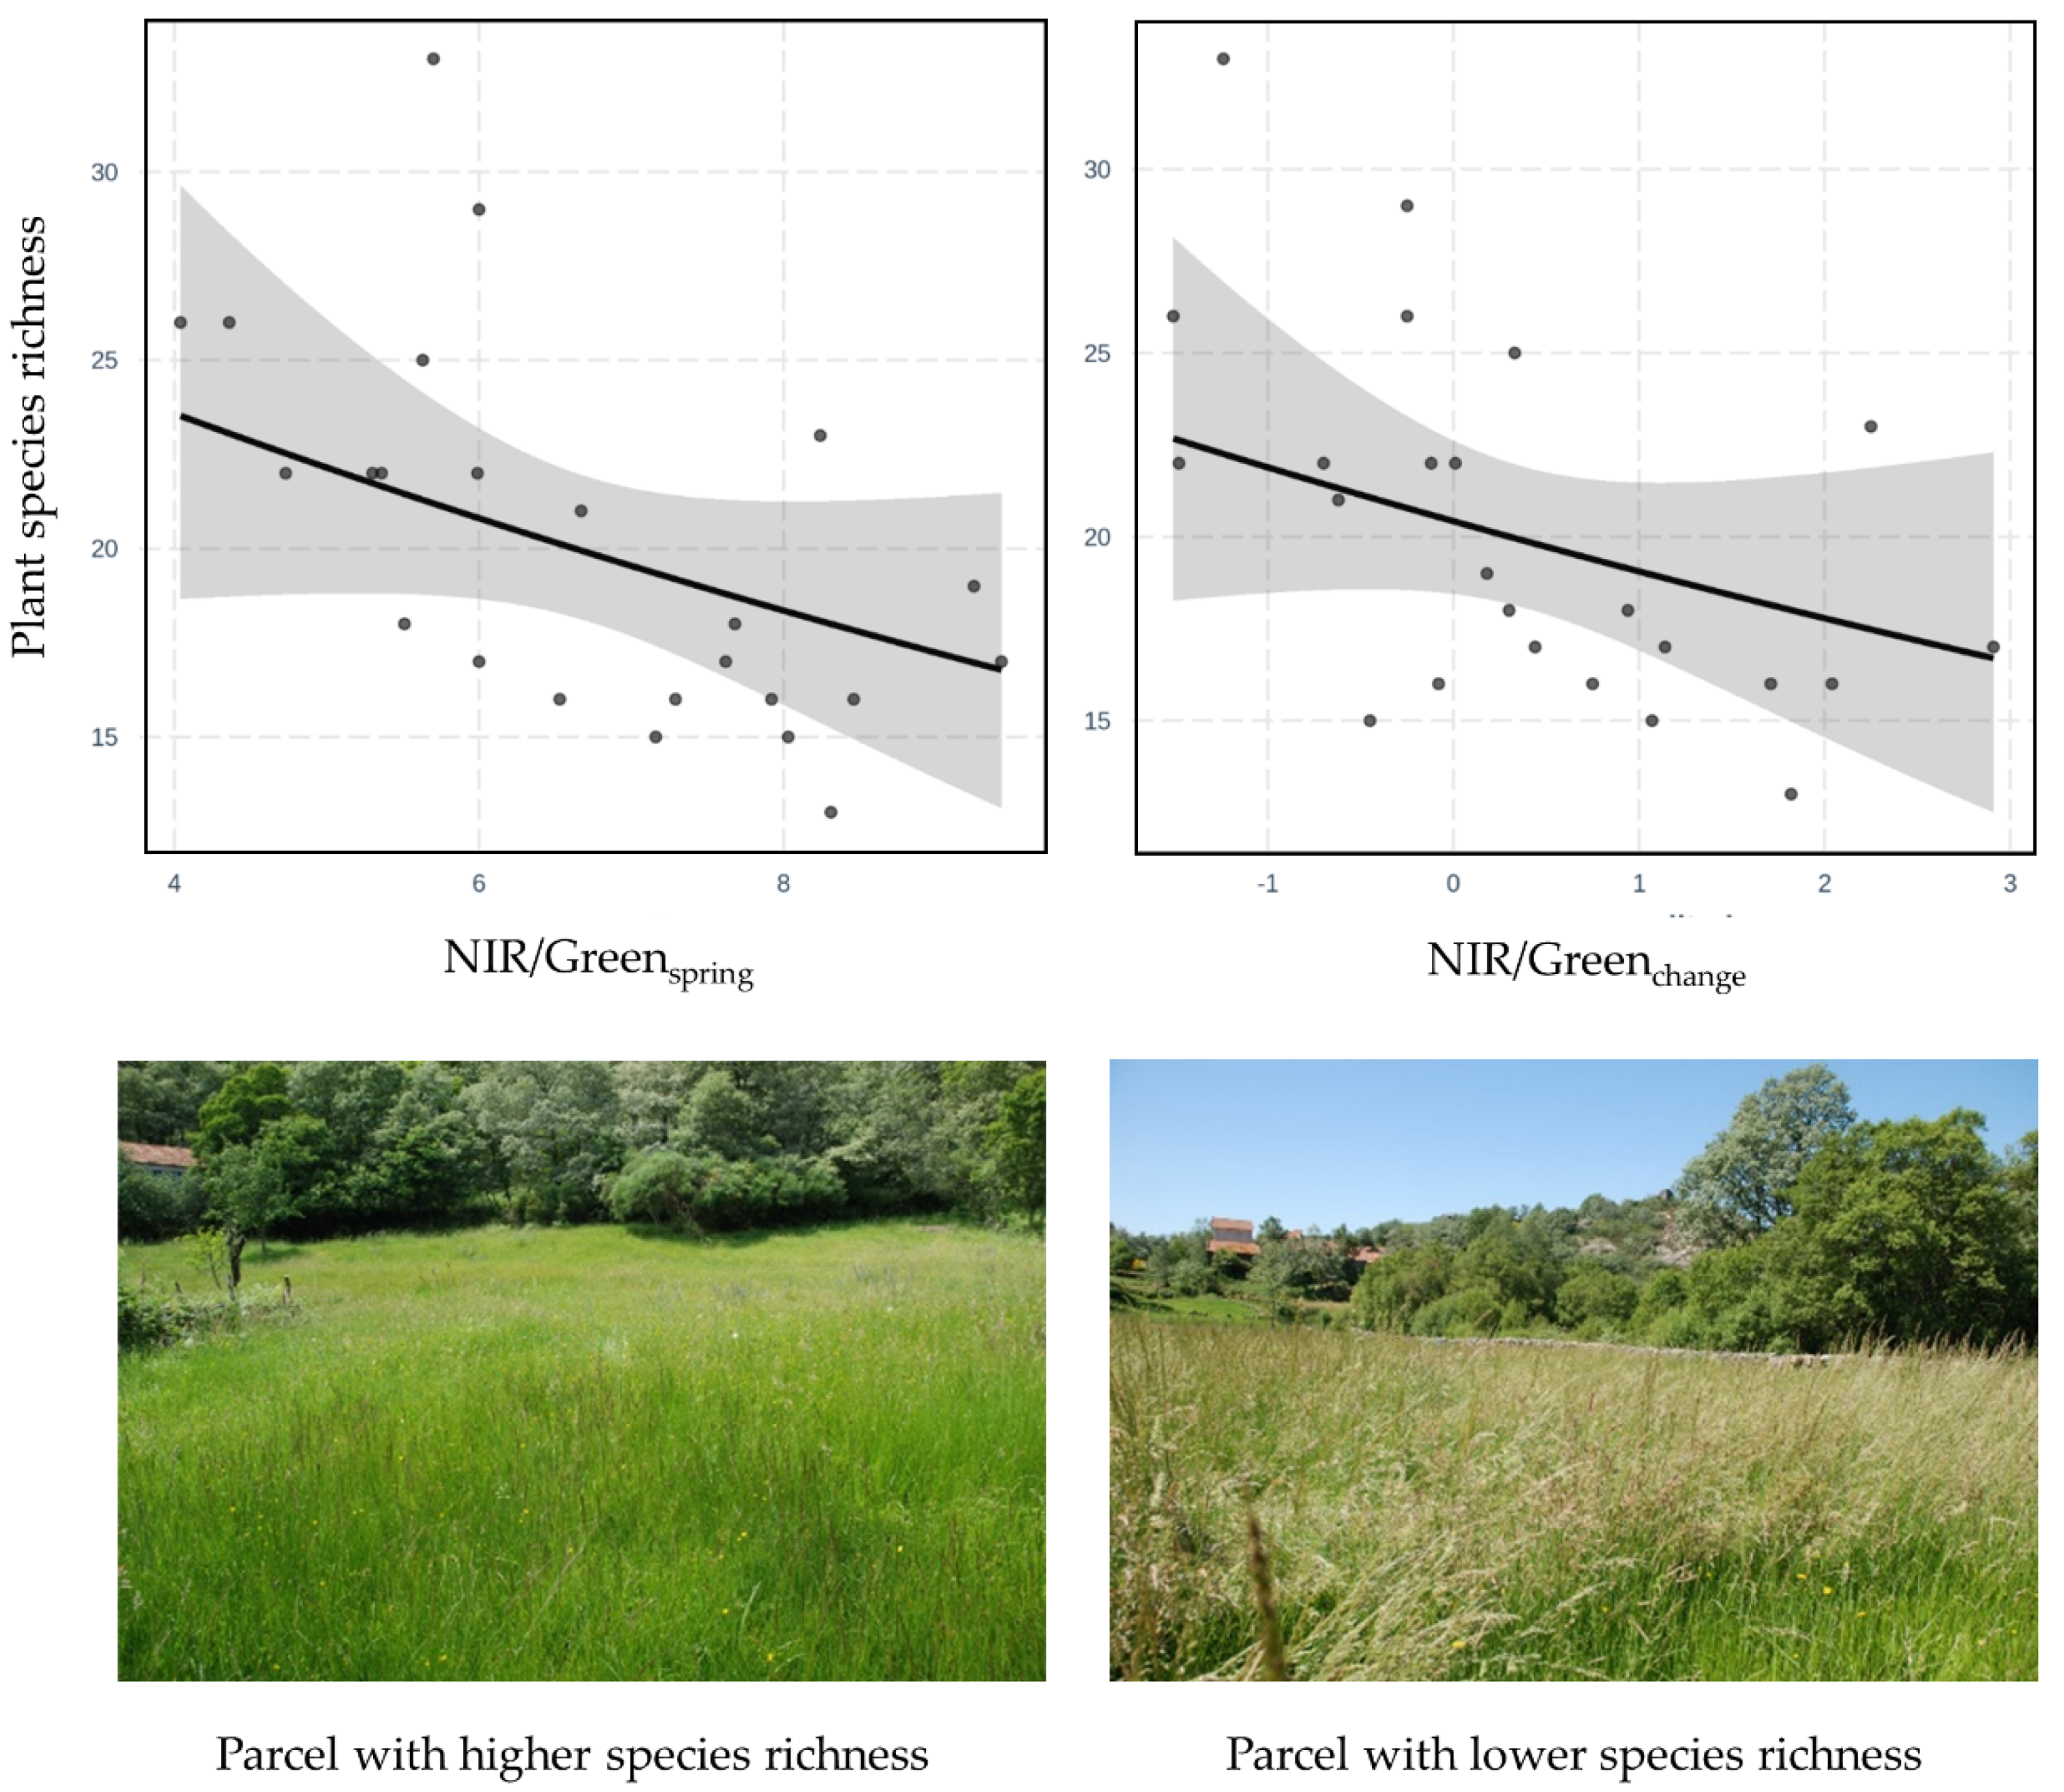
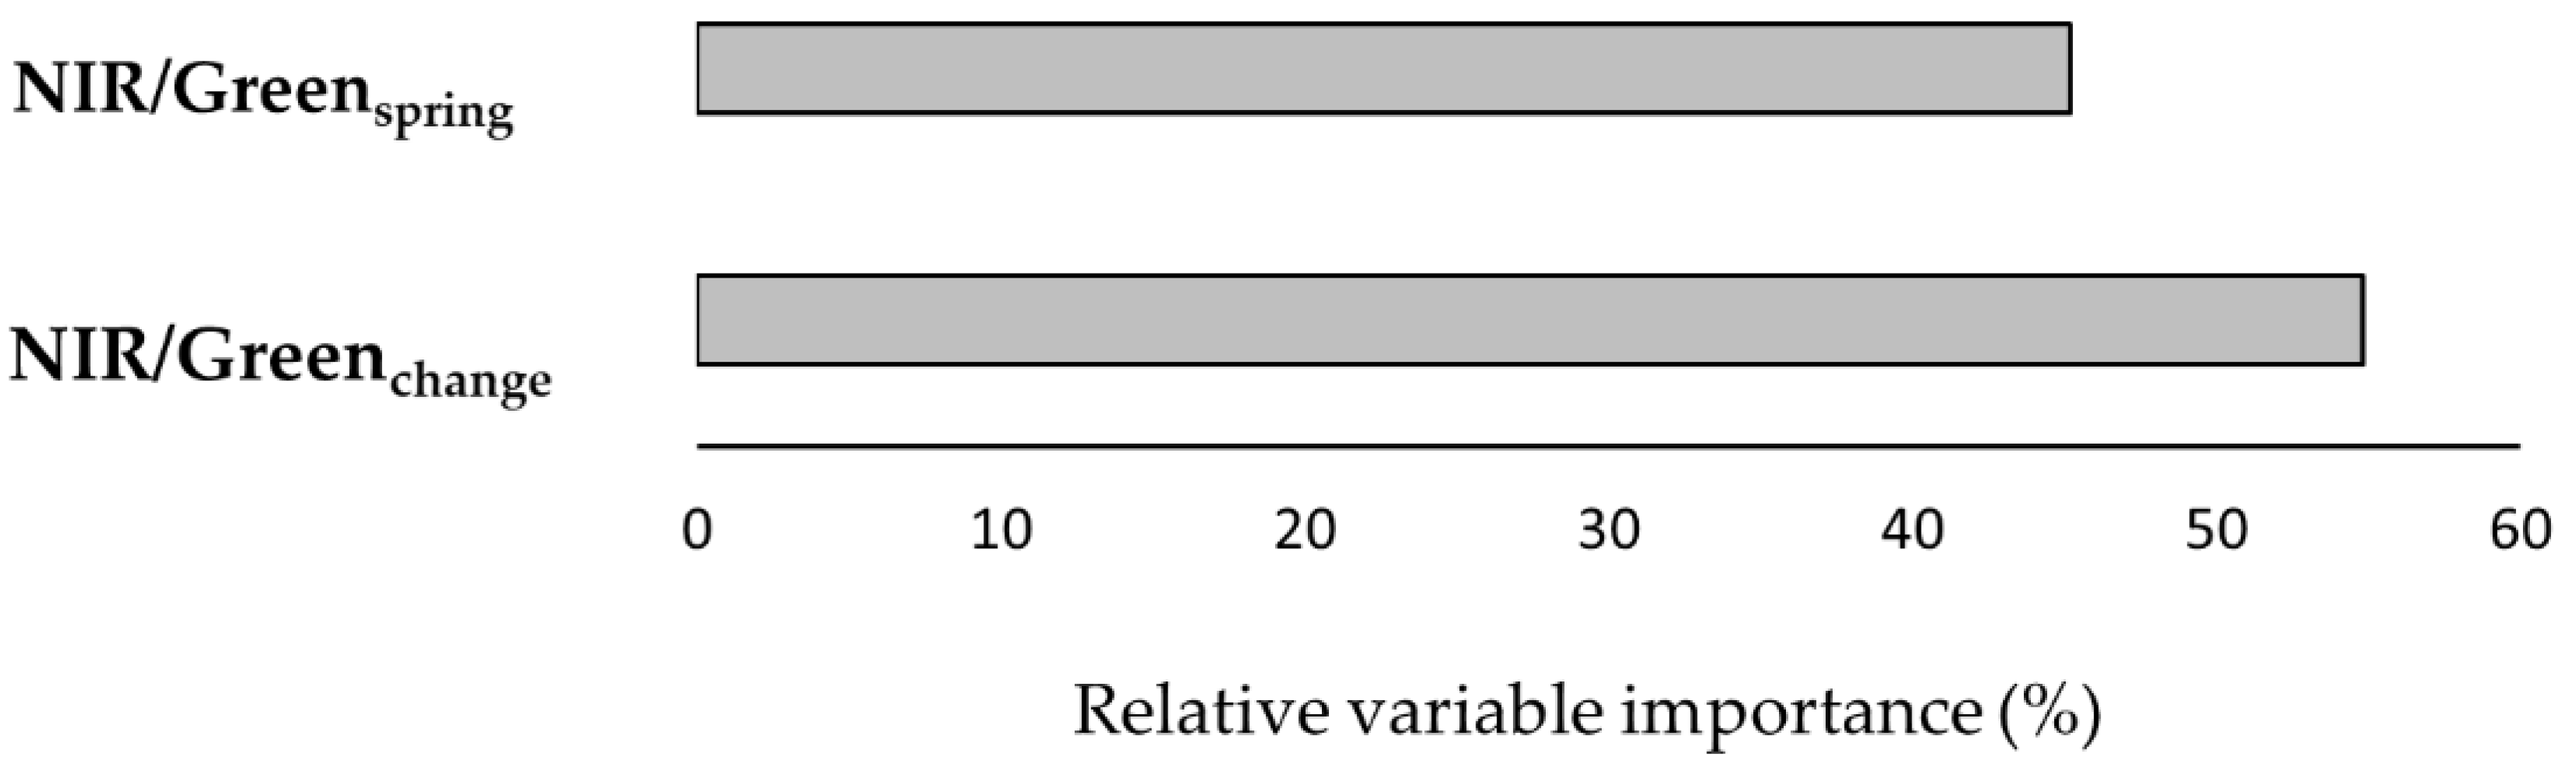
The Statistical Support for Spatial Monitoring of Species Richness in Grassland Parcels
4. Discussion
Spatial Pathways for the Monitoring of Grassland Parcels Biodiversity in Mountains
5. Conclusions
Supplementary Materials
Author Contributions
Funding
Institutional Review Board Statement
Informed Consent Statement
Data Availability Statement
Acknowledgments
Conflicts of Interest
References
- Mupepele, A.-C.; Bruelheide, H.; Brühl, C.; Dauber, J.; Fenske, M.; Freibauer, A.; Gerowitt, B.; Krüß, A.; Lakner, S.; Plieninger, T.; et al. Biodiversity in European agricultural landscapes: Transformative societal changes needed. Trends Ecol. Evol. 2021, 36, 1067–1070. [Google Scholar] [CrossRef] [PubMed]
- Batáry, P.; Dicks, L.V.; Kleijn, D.; Sutherland, W.J. The role of agri-environment schemes in conservation and environmental management. Conserv. Biol. 2015, 29, 1006–1016. [Google Scholar] [CrossRef] [Green Version]
- Monteiro, A.T.; Fava, F.; Hiltbrunner, E.; Della Marianna, G.; Bocchi, S. Assessment of land cover changes and spatial drivers behind loss of permanent meadows in the lowlands of Italian Alps. Landsc. Urban Plan. 2011, 100, 287–294. [Google Scholar] [CrossRef]
- Plieninger, T.; Hui, C.; Gaertner, M.; Huntsinger, L. The Impact of Land Abandonment on Species Richness and Abundance in the Mediterranean Basin: A Meta-Analysis. PLoS ONE 2014, 9, e98355. [Google Scholar] [CrossRef] [PubMed]
- Jetz, W.; Cavender-Bares, J.; Pavlick, R.; Schimel, D.; Davis, F.W.; Asner, G.P.; Guralnick, R.; Kattge, J.; Latimer, A.M.; Moorcroft, P.; et al. Erratum: Monitoring plant functional diversity from space. Nat. Plants 2016, 2, 16039. [Google Scholar] [CrossRef] [Green Version]
- Rocchini, D.; Boyd, D.S.; Jean-Baptiste, F.; Foody, G.M.; He, K.S.; Angela, L.; Harini, N.; Martin, W.; Nathalie, P. Satellite remote sensing to monitor species diversity: Potential and pitfalls. Remote Sens. Ecol. Conserv. 2016, 2, 25–36. [Google Scholar] [CrossRef]
- Randin, C.F.; Ashcroft, M.B.; Bolliger, J.; Cavender-Bares, J.; Coops, N.C.; Dullinger, S.; Dirnböck, T.; Eckert, S.; Ellis, E.; Fernández, N.; et al. Monitoring biodiversity in the Anthropocene using remote sensing in species distribution models. Remote Sens. Environ. 2020, 239, 111626. [Google Scholar] [CrossRef]
- Fava, F.; Parolo, G.; Colombo, R.; Gusmeroli, F.; Della Marianna, G.; Monteiro, A.T.; Bocchi, S. Fine-scale assessment of hay meadow productivity and plant diversity in the European Alps using field spectrometric data. Agric. Ecosyst. Environ. 2010, 137, 151–157. [Google Scholar] [CrossRef]
- Lopatin, J.; Dolos, K.; Hernández, H.J.; Galleguillos, M.; Fassnacht, F.E. Comparing Generalized Linear Models and random forest to model vascular plant species richness using LiDAR data in a natural forest in central Chile. Remote Sens. Environ. 2016, 173, 200–210. [Google Scholar] [CrossRef]
- Möckel, T.; Dalmayne, J.; Schmid, B.; Prentice, H.; Hall, K. Airborne Hyperspectral Data Predict Fine-Scale Plant Species Diversity in Grazed Dry Grasslands. Remote Sens. 2016, 8, 133. [Google Scholar] [CrossRef] [Green Version]
- Lopes, M.; Fauvel, M.; Ouin, A.; Girard, S. Spectro-Temporal Heterogeneity Measures from Dense High Spatial Resolution Satellite Image Time Series: Application to Grassland Species Diversity Estimation. Remote Sens. 2017, 9, 993. [Google Scholar] [CrossRef] [Green Version]
- Schmidtlein, S.; Fassnacht, F.E. The spectral variability hypothesis does not hold across landscapes. Remote Sens. Environ. 2017, 192, 114–125. [Google Scholar] [CrossRef] [Green Version]
- Fauvel, M.; Lopes, M.; Dubo, T.; Rivers-Moore, J.; Frison, P.-L.; Gross, N.; Ouin, A. Prediction of plant diversity in grasslands using Sentinel-1 and -2 satellite image time series. Remote Sens. Environ. 2020, 237, 111536. [Google Scholar] [CrossRef]
- Rossi, C.; Kneubühler, M.; Schütz, M.; Schaepman, M.E.; Haller, R.M.; Risch, A.C. From local to regional: Functional diversity in differently managed alpine grasslands. Remote Sens. Environ. 2020, 236, 111415. [Google Scholar] [CrossRef]
- Hauser, L.T.; Timmermans, J.; van der Windt, N.; Sil, Â.F.; César de Sá, N.; Soudzilovskaia, N.A.; van Bodegom, P.M. Explaining discrepancies between spectral and in-situ plant diversity in multispectral satellite earth observation. Remote Sens. Environ. 2021, 265, 112684. [Google Scholar] [CrossRef]
- Warren, S.D.; Alt, M.; Olson, K.D.; Irl, S.D.H.; Steinbauer, M.J.; Jentsch, A. The relationship between the spectral diversity of satellite imagery, habitat heterogeneity, and plant species richness. Ecol. Inform. 2014, 24, 160–168. [Google Scholar] [CrossRef]
- Bush, A.; Sollmann, R.; Wilting, A.; Bohmann, K.; Cole, B.; Balzter, H.; Martius, C.; Zlinszky, A.; Calvignac-Spencer, S.; Cobbold, C.A.; et al. Connecting Earth observation to high-throughput biodiversity data. Nat. Ecol. Evol. 2017, 1, 0176. [Google Scholar] [CrossRef] [PubMed]
- Noordwijk, C.G.E.v.; Verberk, W.C.E.P.; Turin, H.; Heijerman, T.; Alders, K.; Dekoninck, W.; Hannig, K.; Regan, E.; McCormack, S.; Brown, M.J.F.; et al. Species–area relationships are modulated by trophic rank, habitat affinity, and dispersal ability. Ecology 2015, 96, 518–531. [Google Scholar] [CrossRef] [Green Version]
- Bonn, A.; Storch, D.; Gaston, K.J. Structure of the species--energy relationship. Proc. R. Soc. B Biol. Sci. 2004, 271, 1685–1691. [Google Scholar] [CrossRef]
- Evans, K.L.; Greenwood, J.J.D.; Gaston, K.J. Dissecting the species–energy relationship. Proc. R. Soc. B Biol. Sci. 2005, 272, 2155–2163. [Google Scholar] [CrossRef] [Green Version]
- Mackey, R.L.; Currie, D.J. The Diversity–Disturbance Relationship: Is it generally strong and peaked? Ecology 2001, 82, 3479–3492. [Google Scholar] [CrossRef]
- Thompson, P.L.; Kéfi, S.; Zelnik, Y.R.; Dee, L.E.; Wang, S.; de Mazancourt, C.; Loreau, M.; Gonzalez, A. Scaling up biodiversity-ecosystem functioning relationships: The role of environmental heterogeneity in space and time. Proc. R. Soc. B Biol. Sci. 2021, 288, 20202779. [Google Scholar] [CrossRef] [PubMed]
- Marini, L.; Scotton, M.; Klimek, S.; Isselstein, J.; Pecile, A. Effects of local factors on plant species richness and composition of Alpine meadows. Agric. Ecosyst. Environ. 2007, 119, 281–288. [Google Scholar] [CrossRef]
- Öster, M.; Cousins, S.A.O.; Eriksson, O. Size and heterogeneity rather than landscape context determine plant species richness in semi-natural grasslands. J. Veg. Sci. 2007, 18, 859–868. [Google Scholar] [CrossRef]
- Reitalu, T.; Johansson, L.J.; Sykes, M.T.; Hall, K.; Prentice, H.C. History matters: Village distances, grazing and grassland species diversity. J. Appl. Ecol. 2010, 47, 1216–1224. [Google Scholar] [CrossRef]
- Hauser, L.T.; Féret, J.-B.; An Binh, N.; van der Windt, N.; Sil, Â.F.; Timmermans, J.; Soudzilovskaia, N.A.; van Bodegom, P.M. Towards scalable estimation of plant functional diversity from Sentinel-2: In-situ validation in a heterogeneous (semi-) natural landscape. Remote Sens. Environ. 2021, 262, 112505. [Google Scholar] [CrossRef]
- Capinha, C.; Essl, F.; Seebens, H.; Pereira, H.M.; Kühn, I. Models of alien species richness show moderate predictive accuracy and poor transferability. NeoBiota 2018, 38, 77. [Google Scholar] [CrossRef]
- Hobbs, N.T.; Hilborn, R. Alternatives To Statistical Hypothesis Testing In Ecology: A Guide To Self Teaching. Ecol. Appl. 2006, 16, 5–19. [Google Scholar] [CrossRef] [Green Version]
- Monteiro, A.T.; Carvalho-Santos, C.; Lucas, R.; Rocha, J.; Costa, N.; Giamberini, M.; Costa, E.M.d.; Fava, F. Progress in Grassland Cover Conservation in Southern European Mountains by 2020: A Transboundary Assessment in the Iberian Peninsula with Satellite Observations (2002–2019). Remote Sens. 2021, 13, 3019. [Google Scholar] [CrossRef]
- Instituto Portugûes do Mar e Atmosfera. Boletim Climatológico de Portugal Continental-Maio de 2016; Instituto Portugûes do Mar e Atmosfera: Lisbon, Portugal, 2016; Available online: https://www.ipma.pt/resources.www/docs/im.publicacoes/edicoes.online/20160606/BouXpNiHpWTKJsUladlE/cli_20160501_20160531_pcl_mm_co_pt.pdf (accessed on 20 December 2021).
- Bunce, R.G.H.; Groom, G.B.; Jongman, R.H.G.; Padoa-Schippa, E.; Metzger, M.J. Handbook for Surveillance and Monitoring of European Habitats, 1st ed.; Alterra: Wageningen, The Netherlands, 2005; pp. 1566–7197. [Google Scholar]
- Google Earth. Peneda-Gerês, Portugal. 41°42’59” N, −8°08’60” W. 2016. Available online: https://earth.google.com/web/ (accessed on 23 July 2016).
- Main-Knorn, M.; Pflug, B.; Louis, J.; Debaecker, V.; Müller-Wilm, U.; Gascon, F. Sen2Cor for Sentinel-2; SPIE: Bellingham, DC, USA, 2017; Volume 10427. [Google Scholar] [CrossRef] [Green Version]
- METI/NASA. Advanced Spaceborne Thermal Emission and Reflection Radiometer (ASTER) Global Digital Elevation Model (GDEM). 2019. Available online: https://asterweb.jpl.nasa.gov/gdem.asp (accessed on 8 July 2020).
- Burnham, K.; Anderson, D. Model Selection and Multimodel Inference: A Practical Information-Theoretic Approach; Springer: New York, NY, USA, 2002; pp. 1–488. [Google Scholar] [CrossRef] [Green Version]
- Kinzig, A.P.; Harte, J. Implications of endemics-area relationships for estimates of species extinctions. Ecology 2000, 81, 3305–3311. [Google Scholar] [CrossRef]
- Costa, H.; Almeida, D.; Vala, F.; Marcelino, F.; Caetano, M. Land Cover Mapping from Remotely Sensed and Auxiliary Data for Harmonized Official Statistics. ISPRS Int. J. Geo-Inf. 2018, 7, 157. [Google Scholar] [CrossRef] [Green Version]
- Rossini, M.; Cogliati, S.; Meroni, M.; Migliavacca, M.; Galvagno, M.; Busetto, L.; Cremonese, E.; Julitta, T.; Siniscalco, C.; Morra di Cella, U.; et al. Remote sensing-based estimation of gross primary production in a subalpine grassland. Biogeosciences 2012, 9, 2565–2584. [Google Scholar] [CrossRef] [Green Version]
- Magiera, A.; Feilhauer, H.; Waldhardt, R.; Wiesmair, M.; Otte, A. Mapping Plant Functional Groups in Subalpine Grassland of the Greater Caucasus. Mt. Res. Dev. 2018, 38, 63–72. [Google Scholar] [CrossRef]
- Monteiro, A.T.; Fava, F.; Gonçalves, J.; Huete, A.; Gusmeroli, F.; Parolo, G.; Spano, D.; Bocchi, S. Landscape context determinants to plant diversity in the permanent meadows of Southern European Alps. Biodivers. Conserv. 2013, 22, 937–958. [Google Scholar] [CrossRef]
- Rocchini, D.; Balkenhol, N.; Carter, G.A.; Foody, G.M.; Gillespie, T.W.; He, K.S.; Kark, S.; Levin, N.; Lucas, K.; Luoto, M.; et al. Remotely sensed spectral heterogeneity as a proxy of species diversity: Recent advances and open challenges. Ecol. Inform. 2010, 5, 318–329. [Google Scholar] [CrossRef]
- Imran, H.A.; Gianelle, D.; Scotton, M.; Rocchini, D.; Dalponte, M.; Macolino, S.; Sakowska, K.; Pornaro, C.; Vescovo, L. Potential and Limitations of Grasslands α-Diversity Prediction Using Fine-Scale Hyperspectral Imagery. Remote Sens. 2021, 13, 2649. [Google Scholar] [CrossRef]
- Fieberg, J.; Johnson, D.H. MMI: Multimodel inference or models with management implications? J. Wildl. Manag. 2015, 79, 708–718. [Google Scholar] [CrossRef] [Green Version]
- Cameron, A.C.; Trivedi, P.K. Regression-based tests for overdispersion in the Poisson model. J. Econom. 1990, 46, 347–364. [Google Scholar] [CrossRef]
- Azen, R.; Budescu, D.V. The dominance analysis approach for comparing predictors in multiple regression. Psychol. Methods 2003, 8, 129–148. [Google Scholar] [CrossRef]
- Wenger, S.J.; Olden, J.D. Assessing transferability of ecological models: An underappreciated aspect of statistical validation. Methods Ecol. Evol. 2012, 3, 260–267. [Google Scholar] [CrossRef]
- Meyer, H.; Lehnert, L.W.; Wang, Y.; Reudenbach, C.; Nauss, T.; Bendix, J. From local spectral measurements to maps of vegetation cover and biomass on the Qinghai-Tibet-Plateau: Do we need hyperspectral information? Int. J. Appl. Earth Obs. Geoinf. 2017, 55, 21–31. [Google Scholar] [CrossRef]
- Team, R. RStudio: Integrated Development for R; PBC: Boston, MA, USA, 2020. [Google Scholar]
- Hughes, A. Disturbance and Diversity: An Ecological Chicken and Egg Problem. Nat. Educ. Knowl. 2010, 3, 48. [Google Scholar]
- Primdahl, J.; Vesterager, J.P.; Finn, J.A.; Vlahos, G.; Kristensen, L.; Vejre, H. Current use of impact models for agri-environment schemes and potential for improvements of policy design and assessment. J. Environ. Manag. 2010, 91, 1245–1254. [Google Scholar] [CrossRef] [PubMed]
- Šumrada, T.; Vreš, B.; Čelik, T.; Šilc, U.; Rac, I.; Udovč, A.; Erjavec, E. Are result-based schemes a superior approach to the conservation of High Nature Value grasslands? Evidence from Slovenia. Land Use Policy 2021, 111, 105749. [Google Scholar] [CrossRef]
- Gillet, F.; Mauchamp, L.; Badot, P.-M.; Mouly, A. Recent changes in mountain grasslands: A vegetation resampling study. Ecol. Evol. 2016, 6, 2333–2345. [Google Scholar] [CrossRef] [Green Version]
- Rodríguez, A.; de Lamo, X.; Sebastià, M.-T. Interactions between global change components drive plant species richness patterns within communities in mountain grasslands independently of topography. J. Veg. Sci. 2018, 29, 1029–1039. [Google Scholar] [CrossRef]
- Rapinel, S.; Mony, C.; Lecoq, L.; Clément, B.; Thomas, A.; Hubert-Moy, L. Evaluation of Sentinel-2 time-series for mapping floodplain grassland plant communities. Remote Sens. Environ. 2019, 223, 115–129. [Google Scholar] [CrossRef]
- Sakowska, K.; MacArthur, A.; Gianelle, D.; Dalponte, M.; Alberti, G.; Gioli, B.; Miglietta, F.; Pitacco, A.; Meggio, F.; Fava, F.; et al. Assessing Across-Scale Optical Diversity and Productivity Relationships in Grasslands of the Italian Alps. Remote Sens. 2019, 11, 614. [Google Scholar] [CrossRef] [Green Version]
- Rossi, C.; Kneubühler, M.; Schütz, M.; Schaepman, M.E.; Haller, R.M.; Risch, A.C. Spatial resolution, spectral metrics and biomass are key aspects in estimating plant species richness from spectral diversity in species-rich grasslands. Remote Sens. Ecol. Conserv. 2021, 2056–3485. [Google Scholar] [CrossRef]
- Sun, H.; Hu, J.; Wang, J.; Zhou, J.; Lv, L.; Nie, J. RSPD: A Novel Remote Sensing Index of Plant Biodiversity Combining Spectral Variation Hypothesis and Productivity Hypothesis. Remote Sens. 2021, 13, 3007. [Google Scholar] [CrossRef]


| Rank | Model Structure a | Intercept | Loglik | df | AICc | ΔAICc | wi | Spatial Pathway |
|---|---|---|---|---|---|---|---|---|
| 1 | Species richness~NIR/Greenspring + NIR/Greenchange | 3.47 | −65.2 | 3 | 137.6 | 0.0 | 0.97 | species–energy (P2) |
| 2 | Species richness~NIRSDspring + RedSDspring | 2.9 | −69.4 | 3 | 145.9 | 8.28 | 0.02 | species–spectral heterogeneity (P3) |
| 3 | Species richness~Parcel area (ln) | 3.1 | −71.4 | 2 | 147.4 | 9.77 | 0.01 | species–area (P1) |
| Null model | 3.1 | −71.4 | 1 | 145.1 | 7.42 | 0.02 | ||
| VIFs | NIR/Greenspring (1.60); NIR/Greenchange (1.57) | |||||||
| Model | Model Structure (Coefficient, SE) | Intercept | R2 | RMSE | MAE | Spatial Pathway |
|---|---|---|---|---|---|---|
| 1 | Species richness~NIR/Greenspring (−0.07, 0.04) + NIR/Greenchange (−0.07, 0.05) | 3.47 ± 0.24 | 0.44 | 4.3 | 3.5 | species–energy (P2) |
Publisher’s Note: MDPI stays neutral with regard to jurisdictional claims in published maps and institutional affiliations. |
© 2021 by the authors. Licensee MDPI, Basel, Switzerland. This article is an open access article distributed under the terms and conditions of the Creative Commons Attribution (CC BY) license (https://creativecommons.org/licenses/by/4.0/).
Share and Cite
Monteiro, A.T.; Alves, P.; Carvalho-Santos, C.; Lucas, R.; Cunha, M.; Marques da Costa, E.; Fava, F. Monitoring Plant Diversity to Support Agri-Environmental Schemes: Evaluating Statistical Models Informed by Satellite and Local Factors in Southern European Mountain Pastoral Systems. Diversity 2022, 14, 8. https://doi.org/10.3390/d14010008
Monteiro AT, Alves P, Carvalho-Santos C, Lucas R, Cunha M, Marques da Costa E, Fava F. Monitoring Plant Diversity to Support Agri-Environmental Schemes: Evaluating Statistical Models Informed by Satellite and Local Factors in Southern European Mountain Pastoral Systems. Diversity. 2022; 14(1):8. https://doi.org/10.3390/d14010008
Chicago/Turabian StyleMonteiro, Antonio T., Paulo Alves, Claudia Carvalho-Santos, Richard Lucas, Mario Cunha, Eduarda Marques da Costa, and Francesco Fava. 2022. "Monitoring Plant Diversity to Support Agri-Environmental Schemes: Evaluating Statistical Models Informed by Satellite and Local Factors in Southern European Mountain Pastoral Systems" Diversity 14, no. 1: 8. https://doi.org/10.3390/d14010008