Article

Environmental Factors Affecting the Spatiotemporal Distribution of Copepods in a Small Mesotidal Inlet and Estuary

1
Marine Ecology Research Center, Manseong-ro 19, Yeosu 59697, Korea
2
Department of Environmental Oceanography, Chonnam National University, Daehak-ro 50, Yeosu 59626, Korea
3
Marine Biological Resource Center, Manseong-ro 19, Yeosu 59697, Korea
4
Interdisplinary Program of Bigdata Fishery Resources Management, Chonnam National University, Daehak-ro 50, Yeosu 59626, Korea
5
Department of Fisheries Sciences, Chonnam National University, Daehak-ro 50, Yeosu 59626, Korea
6
Fishery Resource Management Research Institute Based on ICT, Chonnam National University, Daehak-ro 50, Yeosu 59626, Korea
7
Department of Smart Fisheries Resources Management, Chonnam National University, Daehak-ro 50, Yeosu 59626, Korea
*
Authors to whom correspondence should be addressed.
Diversity 2021, 13(8), 389; https://doi.org/10.3390/d13080389
Submission received: 21 July 2021 / Revised: 6 August 2021 / Accepted: 13 August 2021 / Published: 18 August 2021
(This article belongs to the Section Marine Diversity)

Abstract

:
To understand the environmental factors affecting the spatiotemporal distribution of copepods, sampling was conducted seasonally in a small mesotidal inlet and estuary located in Doam Bay of southwestern Korea. The study area was divided seasonally into two or three station groups (estuarine, mixed, and coastal) by a cluster analysis and non-metric multidimensional scaling based on copepod abundance. Acartia forticrusa, A. hudsonica, A. ohtsukai, Paracalanus parvus s. l., Pseudodiaptomus marinus, Tortanus derjugini, T. dextrilobatus, T. forcipatus, Oithona spp., and harpacticoids were important species for grouping the stations. The spatiotemporal distribution of the first two species was restricted to the estuarine area in summer and significantly correlated with temperature, salinity, and chlorophyll-a concentration. The distribution of other brackish species, such as T. derjugini and T. dextrilobatus, significantly correlated with temperature, salinity, and chlorophyll-a concentration. In contrast, A. hudsonica significantly correlated with dinoflagellate density and turbidity in winter, in addition to the abovementioned environmental factors. Acartia hudsonica also maintained a large population in the estuarine area in fall and winter, and its distribution extended across the entire bay in spring. Other coastal species occurred in all areas and did not significantly correlate with environmental factors. Therefore, brackish species in the study area may have developed seasonally different behaviors to sustain their populations.

1. Introduction

Estuaries are partly surrounded by land and serve as a transition zone from freshwater to marine environments in coastal regions, where freshwater and seawater mix [1]. High nutrient concentrations flow into estuaries in the process of mixing, placing these regions among the most productive natural habitats in the world [2,3]. Therefore, the strength of freshwater discharge in conjunction with tidal forcing affect the distribution of primary consumers, such as zooplankton, in estuaries [4]. Grindley [5,6] revealed that plankton had a higher diversity and lower biomass near the bay entrance than in the estuarine region adjacent to the river. This might be associated with adaptation mechanisms of the plankton assemblages in a semi-closed bay to resist the diffusion losses that result from tidal exchanges and freshwater inflows on sediments [7]. Some zooplankton, especially copepods, are capable of migrating to avoid tidal advection in estuaries [8]. The other factors affecting the patchy distribution of zooplankton are the water temperature and salinity of the different water masses.
Doam Bay, located in the south of Korea, was defined as a mesotidal estuary by Davies [9], whereas the estuaries situated on the west and east of Korea are macrotidal and microtidal, respectively. At the lower estuaries of the two major rivers in western Korea (Geum River and Yeongsan River), large estuary banks have been installed to prevent the inflow of seawater. Therefore, the development of brackish water zone and the mixing of freshwater and seawater are extremely limited. Conversely, the bays connected to relatively small rivers (Seomjin River and Tamjin River) in southern Korea have natural well-developed brackish water zones, because the bay entrance is still connected to the coastal area. Although Doam Bay does not have estuary banks, dams (including the Jangheung Multipurpose Dam constructed in 2006) have been installed in the upper area of the Tamjin River to control freshwater discharge into the bay. When the water level drops at low tides, the northern waterway in this small mesotidal inlet is blocked from the wider main waterway in the south. In general, the dam discharge is limited by the timing of precipitation and tides. Thus, it is possible to predict the spatiotemporal changes in environmental factors that are important to the estuary ecosystem, such as temperature, water depth, sedimentation, tidal mixing, and salinity. Subsequently, the estuarine ecosystem across the bay will vary with the population sizes of resident organisms [10,11,12,13,14]. Indigenous estuarine species in Korean estuaries are distributed by different geographic factors, such as tidal currents. Previous studies have focused on unexceptional Korean estuaries and revealed that the dominant species was determined by water temperature and salinity gradients [15,16,17,18,19,20]. However, unlike the other estuaries, Doam Bay has distinct geographical features. Despite these noteworthy environmental and geographical features, no ecological studies on zooplankton assemblages inhabiting Doam Bay have been conducted to date.
In most seasons, the zooplankton assemblages of temperate estuaries mostly consist of copepods, and many studies have already been performed on the physical factors affecting copepod distribution [10,11,12,13,14,15,16,17,18,19,20]. Thus, the aims of this study were (1) to determine whether the indigenous copepod assemblages are preserved in Doam Bay, a small mesotidal inlet with limited freshwater inflow and a large tidal influence, and (2) to identify not only physical factors but also other factors that influence the occurrences of brackish copepods in this study area. For this, we analyzed the environmental characteristics of Doam Bay, the geographic occurrences of brackish copepods, and the environmental factors affecting their spatiotemporal distribution. In addition, to understand the adaptation mechanisms of copepods in the mesotidal estuary, biological factors were inferred by comparing the findings with those of previous studies.

2. Materials and Methods

2.1. Study Area

Doam Bay is a small inner inlet and estuary located in the southern region of Korea. The bay has a trumpet shape, with a width to the north of 0.70 km, which increases toward the south, reaching 7.87 km at the entrance of the bay, and a length of 19.50 km (Figure 1). The north of the bay is <1 m deep during neap tides and is connected to the Tamjin River, whereas the entrance of the bay is approximately 20 m deep. In addition, the Tamjin River flows into the north of the bay, showing the characteristics of a salt estuary, whereas the south is connected to the Mado Sea and is identifiable as a coastal environment. The water discharge from Tamjin River is 8 × 10⁷ tons/year. The watershed area is 193 km2, and the watershed extension is 41.0 km2. Since the Jangheung Multipurpose Dam was constructed 34 km upstream from the bay entrance in 2006, 0.074 × 10⁷ tons of water have been discharged daily from the dam for agricultural water and river maintenance. Because the Tamjin River estuary reaches ca. 6 km upstream from the upper region of Doam Bay, the oligohaline and mesohaline regions formed there have a very narrow range. In addition, to the north of Gau Island (located in the center of the bay), the bay forms a generally monotonous and flat seabed, with a depth of 4.4 m or less, whereas in the south of Gau Island, the water column reaches deeper than 20 m [21]. At low tide, the main waterway at the Tamjin River estuary located to the north of Gau Island is cut off from the main waterway south of Gau Island. The tide has semidiurnal cycle, and the tidal range is 3.7 m in a spring tide and 2.7 m in a neap tide. In a flood tide, coastal water inflows into the bay with a tidal speed of 1.3 m/s, whereas in an ebb tide, it flows through the eastern channel with a tidal speed of 0.65 m/s.

2.2. Environmental Factors

A total of 4 surveys were conducted at 24 stations in Doam Bay in May (spring, excluding 5 stations in the Tamjin River estuary due to shallow water depth), August (summer), and November (fall) 2018, as well as February 2019 (winter) (Figure 1). Water temperature, salinity, chlorophyll-a concentration, and turbidity were measured from the surface water using a submersible fluorescence photometer (ASTD 102, JFE Advantech co., Tokyo, Japan). The total number of samples for chlorophyll-a concentration by season was 19 in spring (excluding stations 1–4 and 6) and 24 from summer to winter. To determine the phytoplankton density, 500 mL of seawater from the surface layer of each station was sampled in a polyethylene bottle and fixed with 10 mL Lugol solution. The total number of samples for phytoplankton density by season was 19 in spring (excluding stations 1–4 and 6) and 23 (excluding station 1) from summer to winter. To prevent photooxidation of the sample, the collecting bottle was wrapped with aluminum foil to block light, and then stored in an ice box and transported to the laboratory. For microscopic observations, the sample was precipitated in a precipitation tube for more than 48 h, the supernatant was removed, and the sample was concentrated to 10 mL. After taking 1 mL of the concentrated sample and placing it in a Sedgewick-Rafter chamber, the phytoplankton density was counted by dividing it into total phytoplankton, diatoms, and dinoflagellates using an optical microscope (Eclipse 80i, Nikon, Tokyo, Japan).

2.3. Mesozooplankton Sampling and Identification

Mesozooplankton sampling was started at station 1 of the Tamjin River estuary at high tide. The total number of samples for zooplankton by season was 19 in spring (excluding stations 1–4 and 6 dues to too shallow water depth of less than 0.5 m) and 24 from summer to winter. The depth of the stations where mesozooplankton sampling was performed ranged from 0.5 m to 12 m. The mesozooplankton were obliquely sampled at a water depth lower than 5 m and vertically sampled at a depth higher than 5 m using a conical net (mesh size 220 µm, mouth diameter 45 cm). The vertical collection was repeated two or more times from the bottom to the surface layer. The collected samples were fixed in neutral formalin to a final concentration of 5% solution on the ship. To identify the species composition of the zooplankton and estimate their abundance, the sample was divided to obtain more than 500 individuals using the Folsom type divider. The divided sample was transferred to a UNESCO-style counter chamber with grid lines at 5 mm intervals, and then the species were identified and counted using a stereo microscope (SMZ645, Nikon, Tokyo, Japan). Cladocera, Copepoda, Chaetognatha, and Appendicularia were identified to species level, and other taxa were identified to the level that could be distinguished by Chihara and Murano [22]. When a detailed observation was required for species identification, the appendages were dissected onto a slide glass and observed using a high-magnification optical microscope (Eclipse 80i, Nikon, Tokyo, Japan). The abundance of the zooplankton was converted to the number of individuals per 1 m3 (ind./m3) through the amount of filtered seawater converted from the rotation counter of the flowmeter (438115, HYDRO-BIOS, Altenholz, Germany) attached to the mouth of the net.

2.4. Data Analysis

After transferring the converted abundances (ind./m3) to log (x+1) to normalize the data distribution, the Bray-Curtis similarity distance indices were calculated [23,24]. Hierarchical clustering analyses were performed based on the average linkage group classification for seasonally grouping stations, and the station interrelations were also mapped by non-metric multidimensional scaling (nMDS) [25]. The dendrograms of the nMDS were statistically significant, as the stress value was <0.2 [25]. Similarity percentage (SIMPER) analyses were performed to specify the contribution of each species between/among groups. In addition, a redundancy analysis (RDA) was conducted to examine the relationship between the major species contributing to the group classification seasonally and environmental factors (temperature, salinity, chlorophyll-a concentration, total phytoplankton, diatoms, and dinoflagellates). The significance of the relationship between major species and environmental factors was verified through a Pearson’s correlation analysis. All cluster analyses and statistical analyses were performed using PRIMER 6.0 (Ver 6.1.2, Informer Technologies, Inc., Los Angeles, CA, USA) and the library “vegan” and “ggplot2” in the program R (version 4.1.0; R Development Core Team, http://www.r-project.org/, access date: 10 July 2021) [26,27].

3. Results

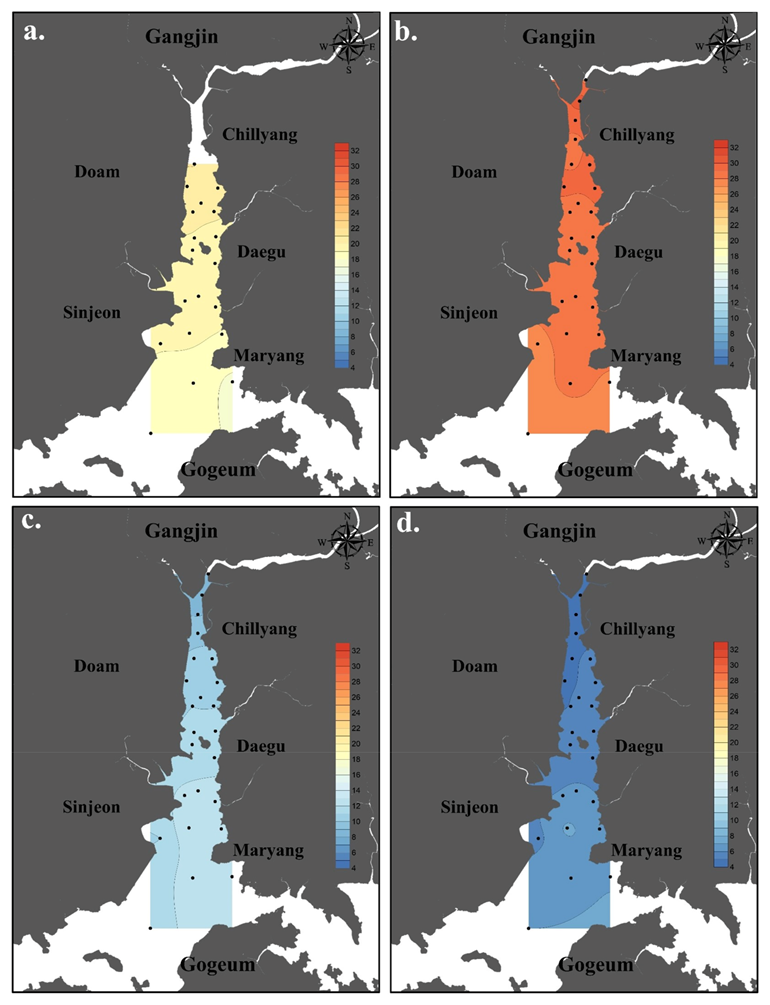
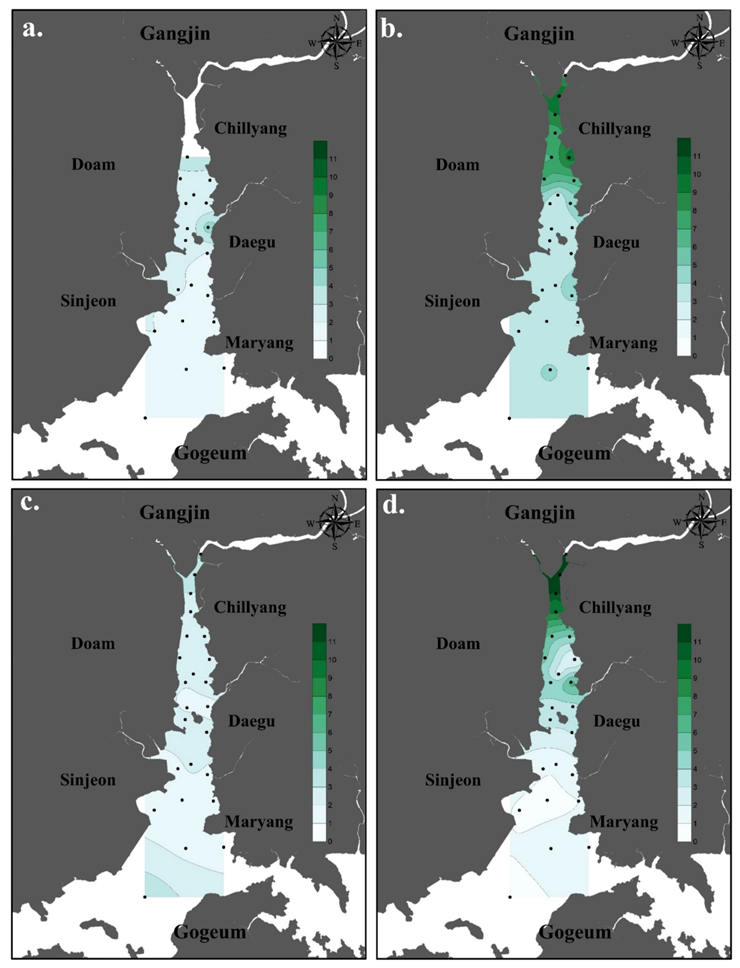
3.1. Environmental Factors

During the study period, the surface water temperature of Doam Bay ranged between 4.6 °C and 30.5 °C, with the lowest in winter and the highest in summer. The difference between stations was <5 °C (Figure 2). In spring and summer, the surface water temperature tended to decrease from the Tamjin River estuary toward the entrance of the bay, whereas in fall and winter, the opposite phenomenon was observed. The salinity of surface water ranged from 4.55 psu to 33.15 psu. The largest difference between stations was 28.08 psu in summer, with a maximum of 28.08 psu, and the smallest difference between stations was in spring, with a minimum of 6.09 psu. In fall and winter, the difference between stations was 7.79 psu and 11.11 psu, respectively. In summer, narrow mesohaline ranges were formed between stations 1 and 2, whereas in other seasons, the salinity was >18.0 psu (Figure 3). In addition, a salinity of >30.0 psu (euhaline zone) appeared from station 9 to the south in spring and summer, whereas it appeared from station 4 to the south in fall and winter. The chlorophyll-a concentration of the surface water ranged from 0.66 µg/L to 18.20 µg/L (Figure 4). The chlorophyll-a concentration ranged from 1.09 µg/L to 4.64 µg/L (mean ± standard deviation (SD) 2.18 ± 0.83 µg/L) in spring, from 2.95 µg/L to 10.23 µg/L (mean ± SD 5.00 ± 2.24 µg/L) in summer, from 1.28 µg/L to 3.89 µg/L (mean ± SD 2.25 ± 0.68 µg/L) in fall, and from 0.66 µg/L to 18.20 µg/L (mean ± SD 4.02 ± 4.08 µg/L) in winter. Particularly, in summer and winter, a chlorophyll-a concentration > 7 µg/L was measured between stations 1 to 7 and decreased toward the entrance of Doam Bay. The total phytoplankton density of the surface water ranged from 0.3 cells/mL to 1827 cells/mL, of which between 79% (summer) and 100% (spring) were diatoms, and between 0% (spring) and 21% (summer) were dinoflagellates (Figure 5a). The diatom density of the surface water ranged from 1.6 cells/mL to 57.6 cells/mL (mean 11.7 ± 13.0 cells/mL) in spring, 50.5 cells/mL to 1827 cells/mL (mean ± SD 600 ± 367.8 cells/mL) in summer, 0.3 cells/mL to 614.4 cells/mL (mean ± SD 45.7 ± 122.8 cells/mL) in fall, and 3.9 cells/mL to 299.1 cells/mL (mean ± SD 58.2 ± 65.2 cells/mL) in winter (Figure 5b). From spring to fall, the diatom density was higher at the entrance of the bay, whereas in winter, it was higher in the upper area of the bay. The dinoflagellate density of the surface water was much lower than the diatom density of the surface water (mean 0.061–0.8 cells/mL) (Figure 5c). Although dinoflagellates appeared in all seasons except for spring, there was no particular trend in their spatiotemporal distribution. The turbidity of the surface water ranged from 15.6 FTU to 32.9 FTU, being the lowest in summer and the highest in spring (Figure 5d). Turbidity was the highest in the upper regions of the bay and decreased toward the entrance of the bay.

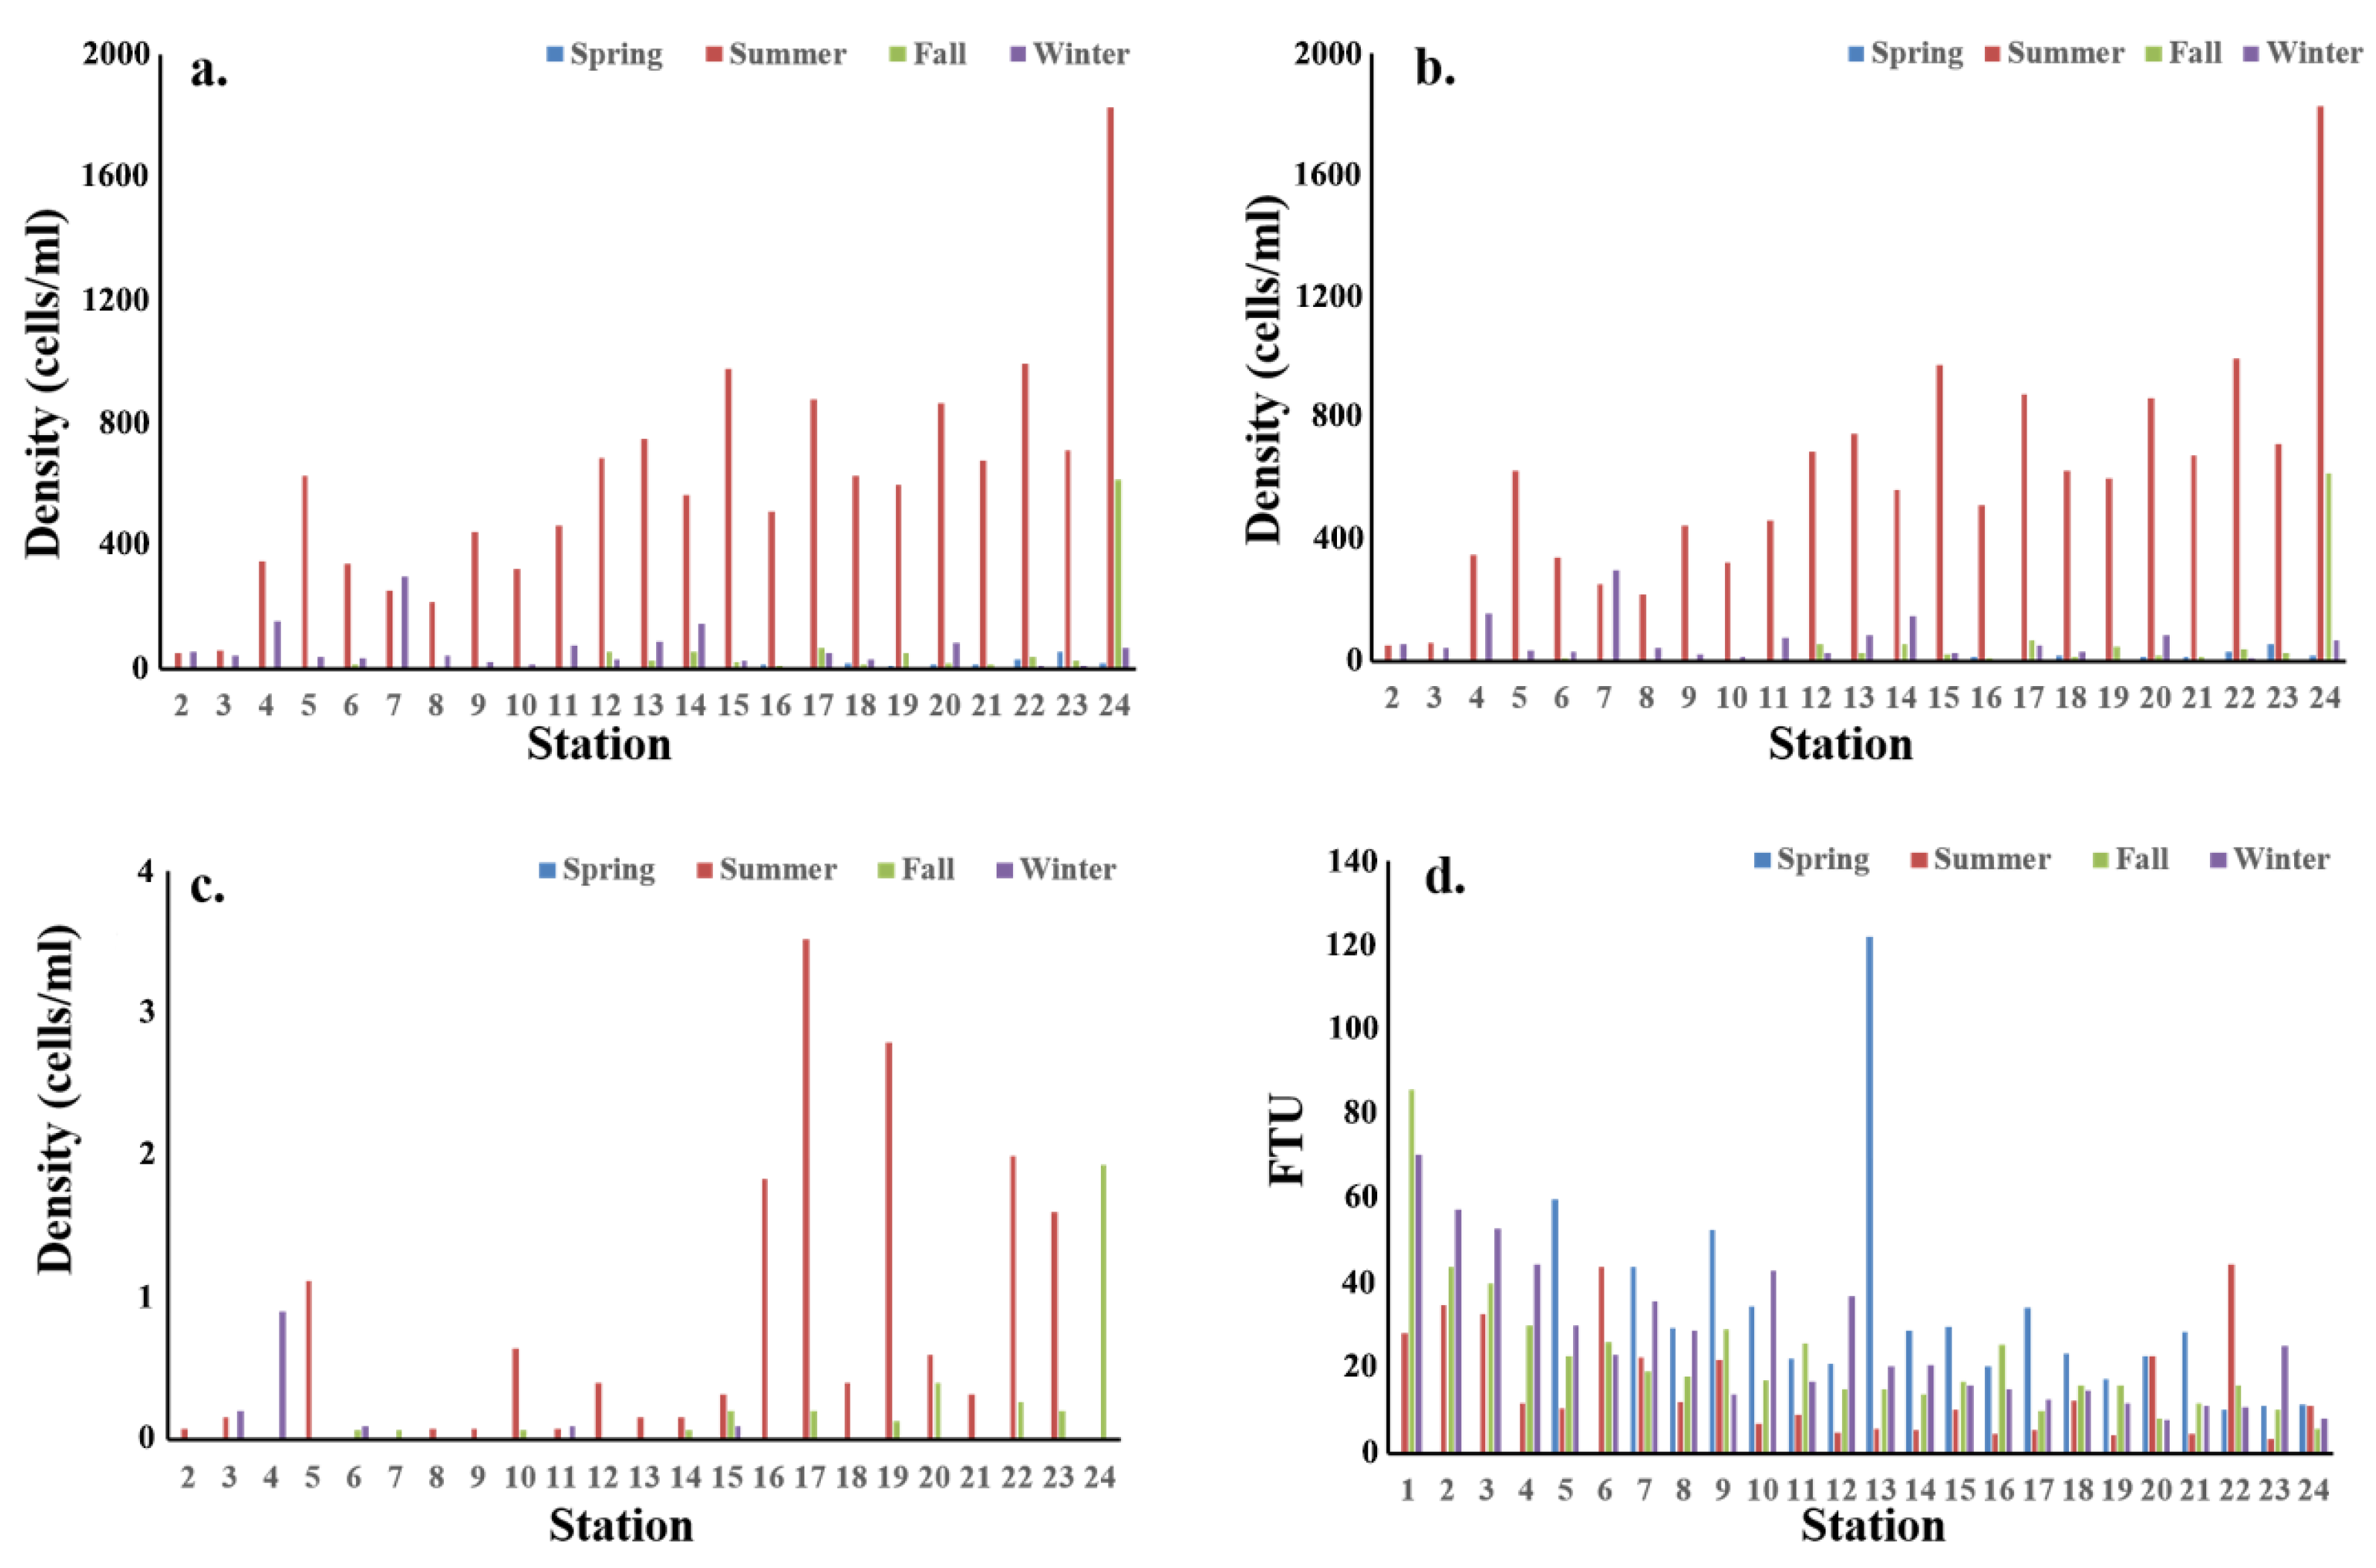
3.2. The Abundance of Mesozooplankton and Copepods

In spring, the abundance of mesozooplankton ranged from 369 ind./m3 (station 5) to 12,456 ind./m3 (station 19), with a mean abundance of 2793 ± 2924 ind./m3 (mean ± SD). Copepods accounted for 72.9% of the total abundance, with their abundance ranging from 258 ind./m3 (station 5) to 9688 ind./m3 (station 19). In summer, the abundance of mesozooplankton ranged from 308 ind./m3 (station 15) to 31,276 ind./m3 (station 21), with a mean abundance of 5578 ± 6469 ind./m3. Copepods accounted for only 28.9% of the total abundance of zooplankton, which was the lowest percentage observed throughout the study period, with abundances ranging from 52 ind./m3 (station 15) to 11,432 ind./m3 (station 3). In contrast, larvae (including barnacle larvae) accounted for 57.4% of the total abundance. In fall, the mean abundance of the mesozooplankton was 1122 ± 2324 ind./m3, ranging from 164 ind./m3 (station 17) to 12,168 ind./m3 (station 6). Copepods accounted for 87.6% of the total abundance, with abundances ranging from 107 ind./m3 (station 17) to 11,691 ind./m3 (station 6). In winter, the abundance of mesozooplankton ranged from 32 ind./m3 (station 22) to 8738 ind./m3 (station 4), with a mean abundance of 2091 ± 2140 ind./m3. Copepods accounted for 93.0% of the total abundance, ranging from 31 ind./m3 (station 22) to 8379 ind./m3 (station 4). The abundance of zooplankton was high at the entrance of the bay in spring, and in the upper area in fall and winter. In summer, high zooplankton abundances were observed at the upper area and the entrance of the bay, whereas the abundance was low in the central part of the bay (Figure 6). The abundance of copepods was also similar to that of the zooplankton, except for an explosive increase at stations 2 and 3 in summer (Figure 7).
In this study, a total of 24 species of mesozooplankton were identified: 1 Cladocera species, 21 Copepoda species, 1 Chaetognatha species, and 1 Appendicularia species (Table 1). Among the copepod species, 14 species appeared in spring, which showed the highest species number (Shannon diversity index: 1.18). Conversely, eight species appeared in winter, which had the lowest species number (Shannon index: 0.17). In summer and fall, 13 species were observed (Shannon index: 1.48, 1.28, respectively). The species diversity was the highest in summer during the sampling period. Spatiotemporally, the number of species tended to decrease from the estuary of the Tamjin River toward the entrance of the bay in spring, whereas the opposite trend occurred in summer. There was no difference between stations in fall and winter.

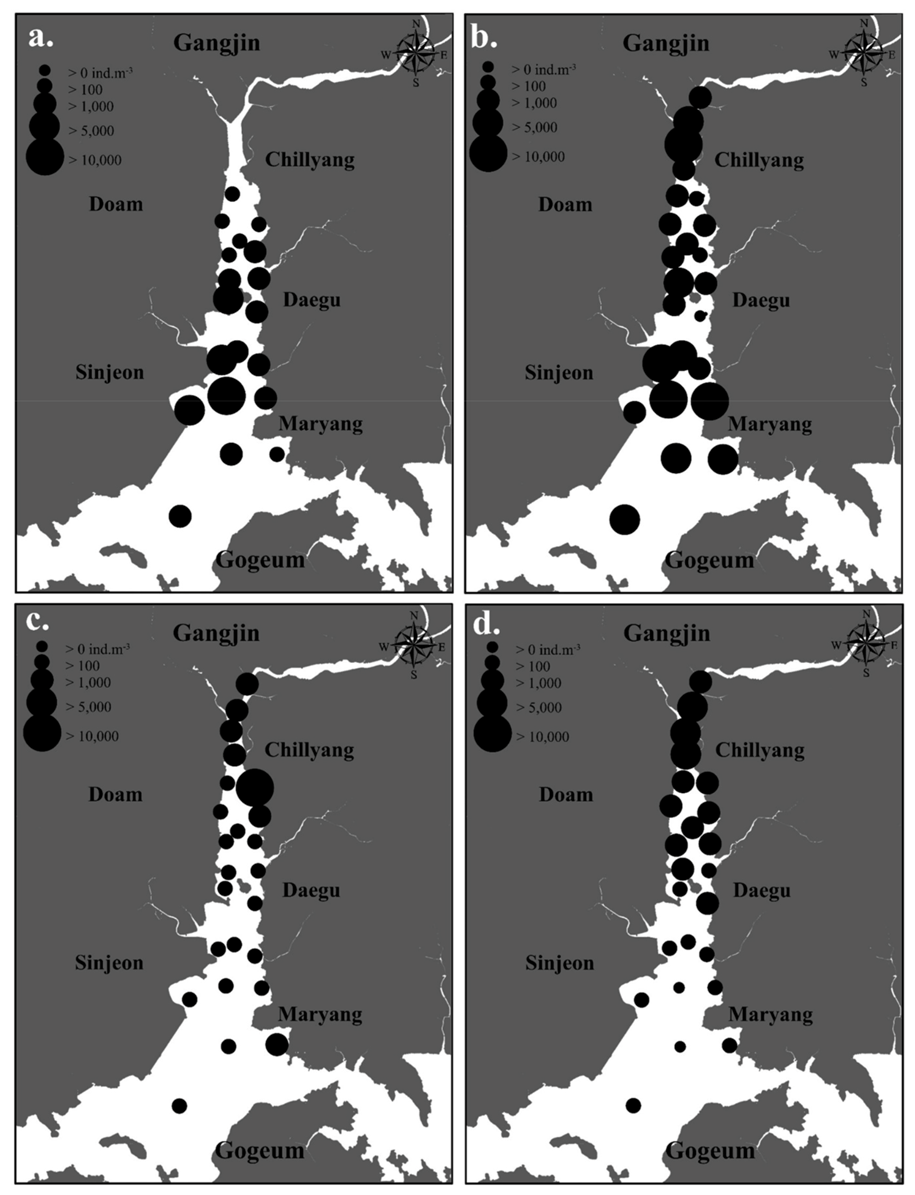
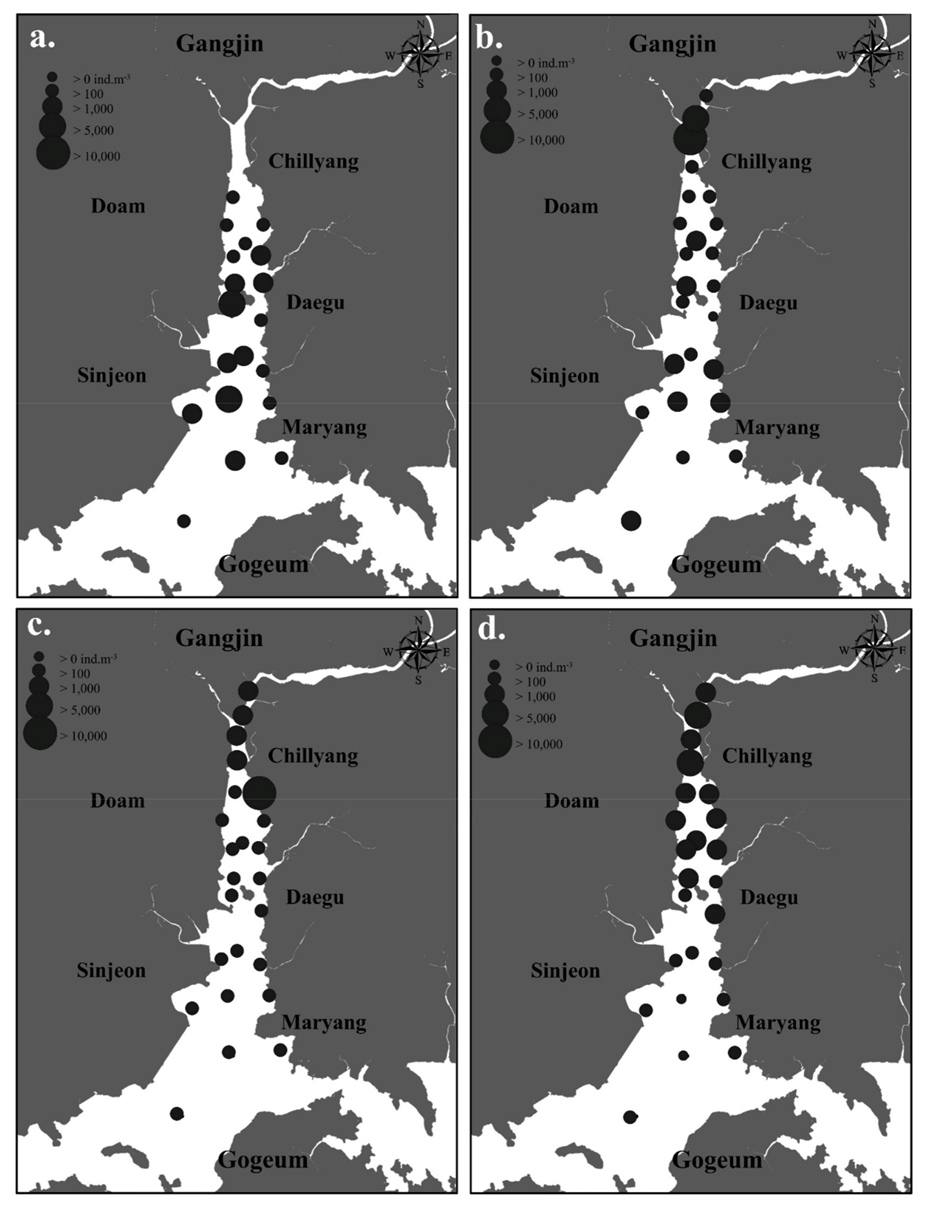
3.3. The Spatiotemporal Distribution of Copepods

In spring, the Copepoda that appeared in Doam Bay included Acartia hongi, A. hudsonica, A. ohtsukai, Calanus sinicus, Calanopia thompsoni, Centropages tenuiremis, Eurytemora pacifica, Labidocera pavo, Paracalanus parvus s. l., Pseudodiaptomus marinus, Tortanus derjugini, T. dextrilobatus, Ditrichocorycaeus affinis, Oithona spp., and unidentified harpacticoids. Of these, A. ohtsukai, T. derjugini, and T. dextrilobatus mainly occurred north of Gau Island. In summer, A. erythraea, A. forticrusa, A. ohtsukai, Bestiolina coreana, Paracalanus parvus s. l., Pseudodiaptomus japonicus, Pseudodiaptomus marinus, T. dextrilobatus, T. forcipatus, and D. affinis appeared in Doam Bay. Among these, A. forticrusa and T. dextrilobatus predominantly appeared in the oligohaline and mesohaline ranges of the Tamjin River estuary, whereas A. ohtsukai, which appeared mainly in the Tamjin River estuary in spring, expanded its distribution to the entrance of the bay. In fall, A. hongi, A. hudsonica, A. ohtsukai, Centropages abdominalis, Paracalanus parvus s. l., Parvocalanus crassirostris, Pseudodiaptomus japonicus, Pseudodiaptomus marinus, T. dextrilobatus, T. forcipatus, D. affinis, Oithona spp., and unidentified harpacticoids occurred in Doam Bay. Acartia forticrusa, which predominated in the Tamjin River estuary, disappeared, and was replaced by A. hudsonica. The abundance of T. dextrilobatus was greatly reduced, whereas A. hongi and Parvocalanus crassirostris were detected for the first time at the entrance of the bay. In winter, A. ohtsukai, Parvocalanus crassirostris, Pseudodiaptomus japonicus, T. dextrilobatus, and T. forcipatus disappeared and Eurytemora pacifica reappeared. Acartia hudsonica dominated the entire bay, and the abundance of A. hongi, Oithona spp., and unidentified harpacticoids increased greatly (Table 1).

3.4. Seasonal Copepod Communities by Cluster Analysis

A cluster analysis was performed based on the abundance of copepod species that appeared in Doam Bay (Figure 8). In spring, Doam Bay stations could be divided into two groups, A and B, with 59.91% similarity. Group A was further subdivided into groups A1 and A2, with a similarity of 60.54% (Figure 8a). Group A1 was the Tamjin River estuary group, with 15 species and an abundance of 1154 ind./m3. The contribution rate within the group was the highest in the order of Pseudodiaptomus marinus, A. hudsonica, A. ohtsukai, and T. derjugini. In group A2, the number of species was seven, which was less than that in group A1. However, the abundance was 4645 ind./m3, which was four-times higher than that in A1 (Figure 9a). The highest contributors to the group (in descending order) were A. hudsonica, A. ohtsukai, and Pseudodiaptomus marinus. The important species for distinguishing between groups A1 and A2 were T. derjugini, A. hudsonica, and A. ohtsukai. The species that contributed the most to the distinction between groups A1 and B and between groups A2 and B was Pseudodiaptomus marinus.
In summer, the stations were divided into two groups, A and B, with a similarity level of 40.79% (Figure 8b). Group A consisted of stations 1 to 4 located in the Tamjin River estuary, and the number of species and the average abundance were eight and 5564 ind./m3, respectively. The highest species contribution rates within the group were A. forticrusa and T. dextrilobatus, followed by A. ohtsukai. Group B consisted of 12 species, which was higher than that of group A, but the average abundance was 889 ind./m3, which was four-times lower than that of group A. The highest species contribution rates within the group were A. ohtsukai and T. forcipatus. Acartia forticrusa, T. dextrilobatus, and A. ohtsukai, followed by T. forcipatus, which were important contributors for distinguishing between groups A and B (Figure 9b).
In fall, two groups (A and B) were distinguished at a similarity level of 56.96%, and at the similarity level of 58.02%, group A was further subdivided into group A1 and A2. Group A1 consisted of the Tamjin River estuary based on Gau Island located in the center of Doam Bay, and group A2 consisted of stations 22 and 23 on the east side of the bay, where a deep channel is connected to the bay. Group B consisted of stations connected to the entrance of the bay (Figure 8c). In group A1, nine species were present, and the average abundance was 1725 ind./m3, whereas the highest species contribution rates (in descending order) were shown by A. hudsonica, Paracalanus parvus s. l., Oithona spp., and A. ohtsukai. In group A2, five species were found, and the average abundance was 542 ind./m3, whereas the highest species contribution rates were shown by Paracalanus parvus s. l., Oithona spp., and then D. affinis. In group B, 10 species were present, and the average abundance was 192 ind./m3 (Figure 9c). The highest species contribution rates within the group were shown by Paracalanus parvus s. l., followed by A. hudsonica. The major species representing groups A1 and A2 were A. hudsonica, A. ohtsukai, and D. affinis. Groups A1 and B were distinguishable by the difference in the contribution of Oithona spp., A. ohtsukai, and A. hudsonica, and groups A2 and B were distinguished by the difference in the contribution of Oithona spp., D. affinis, and A. hudsonica. In winter, the stations were divided into three groups (A, B, and C) at a similarity level of 61.37% (Figure 8d). Group A consisted of stations 1 to 16 from the Tamjin River estuary to the center of the bay, and group C consisted of the outermost stations (23 and 24) at the entrance of the bay. Group B consisted of the stations between groups A and C. In group A, seven species were present, and the average abundance was 767 ind./m3. Among the contributing species within this group, A. hudsonica showed a high contribution rate of more than 50%. Group B had the lowest number of species (four species) and an average abundance of 202 ind./m3 (Figure 9d). The highest contributing species within the group, the unidentified harpacticoids, showed a contribution rate of 45.59%, followed by A. hudsonica and Paracalanus parvus s. l. In group C, seven species were present, and the average abundance was 465 ind./m3. The highest contribution rate was recorded for the unidentified harpacticoids (44.50%), but the second highest contributing species was Paracalanus parvus s. l. Groups A, B, and C were classified according to the contribution rate of A. hudsonica.

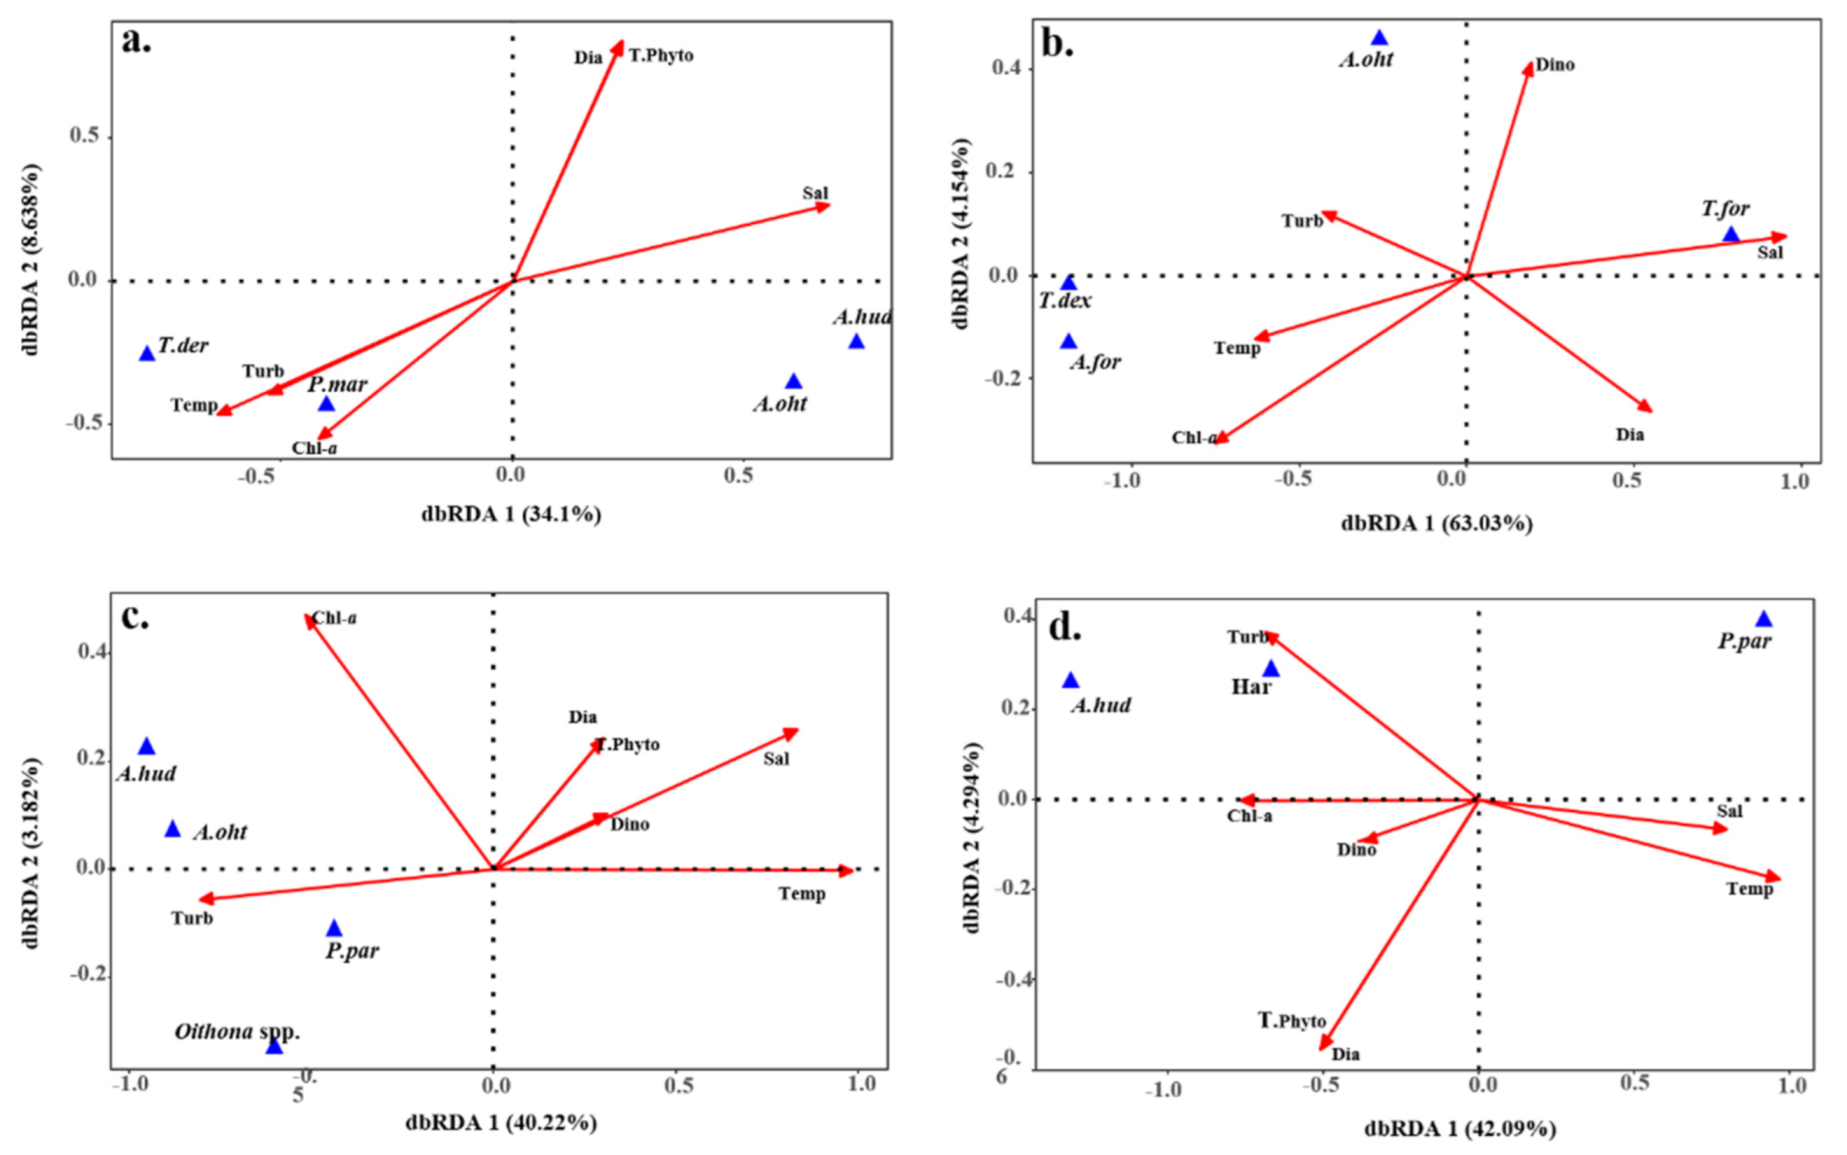
3.5. Seasonal Correlation between Environmental Factors and Major Copepods

To investigate the influence of environmental factors (temperature, salinity, chlorophyll-a concentration, total phytoplankton density, diatom density, and dinoflagellate density) on major species and their contribution to distinction between the stations, an RDA was performed (Figure 10). In spring, the contribution rates of axis 1 and axis 2 to the total data distribution were 34.10% and 8.64%, respectively. Tortanus derjugini, a major contributing species of the A1 group, positively correlated with water temperature and turbidity, and Pseudodiaptomus marinus abundances positively correlated with the chlorophyll-a concentration. Acartia hudsonica and A. ohtsukai, the major contributors to group A2, were positively correlated with salinity (Figure 10a). However, the correlation between these contributing species and the environmental factors was not statistically significant (p > 0.05; Table 2). In summer, the contribution rate of axis 1 and axis 2 was 63.03% and 4.15%, respectively (Figure 10b). Acartia forticrusa and T. dextrilobatus, the major contributing species of group A, showed a significant positive correlation with all environmental factors (p < 0.05 or p < 0.01), except for dinoflagellate density, whereas A. ohtsukai abundance was significantly and positively correlated with dinoflagellates (p < 0.05). Tortanus forcipatus and A. ohtsukai, the major contributors to group B, showed positive and negative correlations with salinity, respectively, but these were not significant (p > 0.05; Table 2). In fall, the contributions of axis 1 and axis 2 were 40.22% and 3.18%, respectively (Figure 10c). Acartia hudsonica, A. ohtsukai, Paracalanus parvus s. l., and Oithona spp. showed positive correlations with the chlorophyll-a concentration and negative correlations with water temperature and salinity. However, as in spring, the correlations were not significant (p > 0.05; Table 2). In winter, the contribution of axis 1 and axis 2 was 42.09% and 4.29%, respectively (Figure 10d). Acartia hudsonica, a major contributing species of group A, showed a significant positive correlation with the chlorophyll-a concentration, dinoflagellate density, and turbidity, whereas it had a significant negative correlation with water temperature and salinity (p < 0.01). The second contributing species of groups B and C, located on the outside of the bay, Paracalanus parvus s. l., showed a negative correlation with all environmental factors, excluding water temperature and salinity, but these correlations were not statistically significant (p > 0.05; Table 2).

4. Discussion

4.1. Environmental Characteristics of Doam Bay

With Gau Island located in the center of the bay as the boundary, the north side is <1 m deep and is connected to the Tamjin River estuary, the south side is >5 m deep, and the east channel of the bay entrance reaches ca. 20 m deep. Since the tidal velocity rapidly moves north at 1.3 m/s in a flood tide, the vertical mixing is active. Therefore, the water temperature is strongly influenced by the seasons rather than daily changes. In spring and summer, the surface water temperature at the Tamjin River estuary was higher than that at the entrance of the bay, whereas in fall and winter, it was higher at the entrance of the bay. Since the construction of a multipurpose dam upstream of the river, the freshwater inflow into Doam Bay has been minimally regulated, while the tidal mixing has become more active, such that the salinity gradient range changed dramatically and was limited in the upper area. In contrast, as seawater was actively supplied from the coast, stations north of Gau Island were mostly polyhaline (ca. 22–30 psu), whereas sites south of the island showed the characteristics of coastal waters (ca. 31–33 psu), except in summer, when the precipitation was relatively higher (average monthly precipitation > 200 mm). Therefore, the oligohaline and/or mesohaline characteristics were only limited to the upper area of Doam Bay (ca. 4–15 psu, stations 1 and 2) in summer. Although the clear freshwater effect is limited to the two northern stations in summer, the horizontal distribution patterns of surface water temperature and salinity in this study area are very similar to the typical patterns of Korean estuaries (for example, the Seomjin River and Gahwa River estuaries) affected by the East Asian monsoon [28].
The surface chlorophyll-a concentration was >10 μg/L in the upper area (stations 1 and 2) in summer and winter). In estuaries, an increase in the chlorophyll-a concentration is closely related to an increase in the nutrient supply [29,30]. In spite of this fact, it is not clear why the chlorophyll-a concentration was high in the upper bay in winter when the precipitation was low (average monthly precipitation < 30 mm) and the water temperature was the lowest [31]. However, we confirmed that there was a significant positive correlation between the chlorophyll-a concentration and turbidity throughout the study period. Delgado et al. [32] reported that approximately 6% of the surface sediments (5 mm depth) were resuspended in areas affected by strong tidal currents and that approximately 11% of chlorophyll-a in these surface sediments was resuspended into the water column. Hence, it could be inferred that the temporary high chlorophyll-a concentration in the upper bay in winter is probably related to the resuspension of sediments and benthic microalgae. To find a more definitive cause of this temporary phenomenon, it is necessary to analyze additional environmental factors, such as surface wind, solar radiation, sediment stability, and nutrients.

4.2. Geographical Distribution Characteristics of Brackish Copepods in Doam Bay

The brackish copepods present in Doam Bay were Acartia hudsonica, A. forticrusa, Labidocera pavo, Pseudodiaptomus japonicus, Tortanus derjugini, and T. dextrilobatus. Of these, A. hudsonica is a particle feeder and an euryhaline species that commonly appears from fall to spring in the western and southern estuaries of Korea ([15,16,20], this study). A particle feeder, A. forticrusa, and a carnivore, T, dextrilobatus, appear predominantly in the mesohaline waters of the southern estuaries of Korea in summer and fall [16,33]. The carnivores L. pavo and T. derjugini were rare in the western and southern estuaries of Korea, whereas the detritus feeder, Pseudodiaptomus japonicus (known as P. koreanus in [15]), was only present in the mesohaline waters of the southern and eastern estuaries of Korea in summer [19,20,34,35]. In particular, the abundance of native brackish species in the Tamjin River and Seomjin River estuaries has greatly decreased despite being well preserved. Many of these species do not occur in the Geum River and Mankyung-Dongjin River estuaries [36,37,38]. The reason might be closely associated with the construction of the estuary bank, that is, the estuarine banks built in the entrance of the bay have changed the species compositions in the area, while the natural conditions of the Tamjin River and Seomjin River estuaries are still maintained.

4.3. Environmental Characteristics and Spatiotemporal Distribution of Major Copepods

Coastal water influxes by tidal currents are actively developed, since the water depth of the bay is shallow, making it an area with very high biological productivity. With these environmental characteristics, Acartia forticrusa, A. hudsonica, A. ohtsukai, Paracalanus parvus s. l., Pseudodiaptomus marinus, Tortanus dextrilobatus, T. derjugini, T. forcipatus, Oithona spp., and unidentified harpacticoids were very important species in Doam Bay that not only reflected estuarine and marine environmental characteristics, but also showed that high secondary production occurred in the bay. In particular, diverse environmental factors, such as temperature, chlorophyll-a concentration, and seafloor topography, in addition to the tide and salinity gradients that are natural characteristics of estuaries, can affect the spatiotemporal distribution of zooplankton, including copepods, in the estuary, with effects differing among species [12,18,20,39,40].
The cluster analysis and nMDS results based on the abundance of copepod species showed that Doam Bay was divided into two or three groups of stations, although there were seasonal differences among the groupings. In spring, T. derjugini contributed the most to separating group A1 and A2, whereas the major contributors to groups A1 and A2 were Pseudodiaptomus marinus and A. hudsonica, respectively. Pseudodiaptomus marinus contributed to the separation of group A and B. Tortanus derjugini is a dominant species in summer in the Mankyung and Dongjin River estuaries in western Korea (identified as T. spinicaudatus by the authors of [15,41]), but it only occurred in spring in the limited northern area of Gau Island located in the center of Doam Bay. The abundance of this species also showed a strong, significant correlation with temperature and weaker, but still significant, correlations with salinity, chlorophyll-a concentration, and turbidity. The reason behind the earlier appearance of T. derjugini in Doam Bay may be that Doam Bay is located in the south of the Mankyung and Dongjin River estuaries in latitude. Therefore, the water temperature rises earlier than later. Conversely, P. marinus, a coastal species, appeared throughout all the examined stations of Doam Bay in spring. The reason may be related to the lack of freshwater inputs into the bay, in conjunction with little differences in salinity throughout the bay (which was generally > 30 psu) due to vigorous mixing by tide.
In summer, Doam Bay was divided into two station groups. Group A consisted of stations 1–4, which showed a salinity gradient, including mesohaline conditions, whereas the other stations comprised group B and had the characteristics of polyhaline estuaries and coastal waters. In group A, the chlorophyll-a concentration was very high. The strongest contributors to group A and B were A. forticrusa and A. ohtsukai, respectively. Acartia forticrusa and T. dextrilobatus contributed to 42% to the separation between the two groups. Acartia forticrusa abundances had strong positive correlations with water temperatures and chlorophyll-a concentrations, a weaker but still significant positive correlation with turbidity, a strong negative correlation with salinity, and weaker but significant negative correlations with diatoms and total phytoplankton abundance. In particular, A. forticrusa occurs in the oligohaline to mesohaline waters of the Seomjin River estuary located in the southern Korea in summer and is the dominant species in mesohaline waters [19,20]. In this study area, A. forticrusa had large populations near mesohaline regions (stations 2–3), where the chlorophyll-a concentration was >7 μg/L and freshwater inflows relatively increased in summer. Conversely, the abundance of A. ohtsukai, which appeared as the highest contributing species of group B, had a significant positive correlation with dinoflagellates. Choi et al. [42] suggested that different Acartia species selectively fed on different-sized prey, allowing their coexistence. In addition, A. forticrusa appeared only in the low-salinity region (stations 1–5) of the Tamjin River estuary, whereas A. ohtsukai appeared throughout the entire Doam Bay, though their main population existed at lower estuary (station 17–20). This suggests that A. forticrusa and A. ohtsukai differ in their adaptation and tolerance of salinity gradients, in addition to differences in food selectivity. Most brackish zooplankton can adjust to maintain populations in estuaries or along salinity gradients in the face of tidal cycles or floods [43,44,45,46]. Acartia forticrusa and T. dextrilobatus, which dominated in the low-salinity area of the Tamjin River in summer, appeared to be representative of species that exhibit population maintenance behaviors via tidal influences, as in the Seomjin River estuary. However, this behavior was not reported in coastal species, such as A. ohtsukai [20]. Unlike brackish species, coastal species lack maintenance or other behavioral responses to the tide, which may be linked to their lack of selective benefit [46].
In fall and winter, Doam Bay was divided into three station groups based on the location of Gau Island. In winter, the group north of Gau Island extended to the entrance of Doam Bay, whereas the central group was reduced and became distinguishable from the group at the bay entrance. In fall and winter, the main contributing species were A. hudsonica, Paracalanus parvus s. l., Oithona spp., and the unidentified Harpacticoida. Of these, A. hudsonica is a typical brackish species appearing in the estuaries of the Pacific and Atlantic oceans and those in southern Korea [15,16,20,33,47,48]. The habitat of A. hudsonica in the Seomjin River estuary of southern Korea was shown to seasonally differ [16,20]. Park et al. [16] reported that the habitat of A. hudsonica appeared in the oligohaline area in fall, dominated in the mesohaline area in winter, and expanded its distribution to the polyhaline area in spring. In temperate estuaries of eastern United States, this species was dominant in various salinity ranges (11–36 psu) during the relatively cold seasons of winter and spring [47,49]. Likewise, in Doam Bay, A. hudsonica maintained large population in the upper region of the bay in fall (stations 1–9) and winter (stations 1–15) where the chlorophyll-a concentration was relatively high, and its distribution extended across the entire bay in spring. This species also showed a significant negative correlation with water temperature and salinity, and a significant positive correlation with the chlorophyll-a concentration, dinoflagellate density, and turbidity in winter. Acartia hudsonica disappeared from Doam Bay during the summer when A. ohtsukai and A. forticrusa dominated because of the high temperature. Acartia hudsonica exhibited relatively a low abundance (49%) by coexisting with A. ohtsukai (12%) during fall but showed the highest abundance (81.6%) in winter, when there were no ecologically similar Acartia species in most stations. In the northern estuary of Narragansett Bay, Rhode Island, USA, before A. tonsa flourished in the summer, A. hudsonica lay diapause eggs and stored them in sediments. These eggs then hatched and grew in fall when the abundance of A. tonsa decreased [47]. Slightly different from this pattern, the habitat segregation of brackish Acartia species co-occurring in Maizuru Bay, Kyoto, Japan, appeared to be moderated by the preference for salinity and interspecific competition [48]. Notably, the wide distribution range of A. ohtsukai in summer was limited to the northern stations (station 1–9, mainly station 6) when A. hudsonica appeared in the whole study area in fall. These facts suggest that not only physical environmental factors, such as water temperature and salinity, but also biological factors, such as interrelationships between organisms, including competition, are major factors determining the appearance and presence of A. hudsonica. In contrast, Paracalanus parvus s. l. did not show a significant correlation with any environmental factors. Paracalanus parvus is known as a common copepod that can inhabit wide salinity and temperature ranges in many temperate estuaries of East Asia, including Korea, Japan, and China [50,51,52]. Moreover, this species is known to have different ecological characteristics depending on the season and sea area [50]. In this study area, this species was found in most stations throughout the year, although the diverse environmental factors differed in the north-south direction. Adaptability to various environments may be the reason for the lack of relation of the distribution of this species to specific environmental factors in fall and winter in Doam Bay. The benthic copepods (i.e., unidentified Harpacticoida), which showed high abundance only in winter, showed a positive correlation to chlorophyll-a concentration and turbidity. This positive correlation suggests that their temporary high abundance may be closely related to the resuspension of the sediments and benthic microalgae by strong tidal currents or surface winds [32].
In conclusion, no strong salinity gradient was formed in Doam Bay, except in summer, but major copepod species differed in their spatiotemporal distribution in relation to Gau Island, which is located in the center of Doam Bay. In particular, the distribution of the brackish species A. forticrusa, A. hudsonica, and T. dextrilobatus was closely related to biological factors in the environment, such as food composition (chlorophyll-a concentration, and diatom and dinoflagellate density) and interspecific competition for food, in addition to physical environmental factors, such as water temperature and salinity. In addition, despite strong tidal currents, their populations were maintained in the Tamjin River estuary, north of Gau Island. In contrast, the spatiotemporal distribution of coastal species, such as A. ohtsukai, Pseudodiaptomus marinus, Paracalanus parvus s. l., and T. forcipatus, did not significantly correlate with environmental variables. This shows that the brackish species in Doam Bay have developed behavioral mechanisms to maintain their populations, similar to the results of previous studies. However, the current study was only conducted at high tide due to the specific features of the study area, meaning that there are limitations to the information gained regarding the characteristics of the observed species, such as the spread of brackish species. Therefore, further surveys of the seafloor are required.

Author Contributions

Conceptualization: M.-H.S., H.-J.K., S.-D.C. and H.-Y.S.; methodology: M.-H.S., S.-J.L., K.-H.H. and H.-Y.S.; formal analysis: S.-Y.K., Y.-H.Y. H.-Y.S., M.-T.K. and H.-J.K.; investigation: M.-H.S., S.-J.L., H.-J.K. and Y.-H.Y.; visualization: S.-Y.K., M.-T.K. and H.-J.K.; resources: K.-H.H., S.-D.C. and H.-Y.S.; writing—original draft preparation: M.-H.S. and H.-J.K.; writing—review and editing: H.-Y.S. and M.-K.J.; supervision: H.-Y.S. and M.-K.J. All authors have read and agreed to the published version of the manuscript.

Funding

This research was a part of the project titled “Research center for fishery resource management based on the information and communication technology” (2021, Grant number 20180384), funded by the Ministry of Oceans and Fisheries, Korea.

Institutional Review Board Statement

Not applicable.

Informed Consent Statement

Not applicable.

Data Availability Statement

Data presented in the study is available on the request from a corresponding author.

Acknowledgments

We would like to thank the anonymous reviewers and the editor who made constructive and invaluable suggestions and comments.

Conflicts of Interest

The authors declare no conflict of interest.

References

  1. Pritchard, D.W. What is an estuary: Physical view point. AAAS 1967, 83, 3–5. [Google Scholar]
  2. Day, J.W.; Kemp, W.M.; Yáñez-Arancibia, A.; Crump, B.C. Estuarine Ecology, 2nd ed.; Wiley-Blackwell: New York, NY, USA, 2012; pp. 1–558. [Google Scholar]
  3. McLusky, D.S.; Elliott, M. The Estuarine Ecosystem: Ecology, Threats and Management; Oxford University Press: Oxford, UK, 2004; pp. 1–209. [Google Scholar]
  4. Rodríguez, G. Some Aspects of the Ecology of Tropical Estuaries. In Tropical Ecological Systems; Golley, F.B., Medina, E., Eds.; Springer: Berlin/Heidelberg, Germany, 1975; pp. 313–332. [Google Scholar]
  5. Grindley, J.R. Estuarine plankton. In Estuarine Ecology with Particular Reference to Southern Africa; Day, J.H., Ed.; Balkema: Cape Town, South Africa, 1981; pp. 117–146. [Google Scholar]
  6. Grindley, J.R. The role of zooplankton in the St. Lucia estuary system. In St. Lucia Research Review; Taylor, R.H., Ed.; Natal Parks Board Symposium: Pietermaritzburg, South Africa, 1982; pp. 88–107. [Google Scholar]
  7. Lam-Hoai, T.; Guiral, D.; Rougier, C. Seasonal change of community structure and size spectra of zooplankton in the Kaw River estuary (French Guiana). Estuar. Coast. Shelf Sci. 2006, 68, 47–61. [Google Scholar] [CrossRef]
  8. Schmitt, F.G.; Devreker, D.; Dur, G.; Souissi, S. Direct evidence of tidally oriented behavior of the copepod Eurytemora affinis in the Seine estuary. Ecol. Res. 2011, 26, 773–780. [Google Scholar] [CrossRef]
  9. Davies, J.L. A morphogenic approach to world shorelines. Z. Geomorphol. 1964, 8, 127–142. [Google Scholar] [CrossRef]
  10. Schlacher, T.A.; Wooldridge, T.H. Ecological responses to reductions in freshwater supply and quality in South Africa’s estuaries: Lessons for management and conservation. J. Coast. Conserv. 1996, 2, 115–130. [Google Scholar] [CrossRef]
  11. Domingues, R.B.; Galvao, H. Phytoplankton and environmental variability in a dam regulated temperate estuary. Hydrobiologia 2007, 586, 117–134. [Google Scholar] [CrossRef]
  12. Morais, P.; Chícharo, M.A.; Chícharo, L. Changes in a temperate estuary during the filling of the biggest European dam. Sci. Total Environ. 2009, 407, 2245–2259. [Google Scholar] [CrossRef]
  13. Wang, L.; Chen, Q.; Han, R.; Wang, B.; Tang, X. Zooplankton community in Yangtze River Estuary and adjacent sea areas after the impoundment of the Three Gorges Reservoir. Ann. Limnol. Int. J. Limnol. 2016, 52, 273–284. [Google Scholar] [CrossRef]
  14. Yen, N.T.M.; Vanreusel, A.; Lins, L.; Thai, T.T.; Nara, B.T.; Quang, N.X. The effect of a dam construction on subtidal nematode communities in the Ba Lai Estuary, Vietnam. Diversity 2020, 12, 1–18. [Google Scholar] [CrossRef] [Green Version]
  15. Suh, H.L. Salinity and distribution of zooplankton in the estuarine system of Mankyong River and Dongjin River. J. Oceanol. Soc. Korea 1991, 26, 181–192. [Google Scholar]
  16. Park, C.; Lee, P.G.; Yang, S.R. Variation of zooplankton distribution in the Seomjin River estuary with respect to season and salinity gradients. Sea 2002, 7, 51–59. [Google Scholar]
  17. Youn, S.H.; Choi, J.K. Distribution pattern of zooplankton in the Han River estuary with respect to tidal cycle. Ocean Sci. J. 2008, 43, 135–146. [Google Scholar] [CrossRef]
  18. Youn, S.H.; Oh, G.S.; Chung, M.H. Zooplankton community structure and copepod production in the Seomjin River Estuary. J. Korean Soc. Mar. Environ. Saf. 2010, 16, 369–379. [Google Scholar]
  19. Park, E.O.; Rahman, M.S.; Seo, M.H.; Kim, J.J.; Soh, H.Y. Distribution patterns of calanoid copepods along the Seomjin River estuary in southern Korea during summer. Korean J. Environ. Biol. 2013, 31, 165–171. [Google Scholar] [CrossRef]
  20. Park, E.O.; Suh, H.L.; Soh, H.Y. Spatio-temporal distribution of Acartia (Copepoda: Calanoida) species along a salinity gradient in the Seomjin River estuary, South Korea. J. Nat. Hist. 2015, 49, 2799–2812. [Google Scholar] [CrossRef]
  21. Hong, J.T.; Na, B.S.; Kim, J.Y.; Koh, Y.K.; Youn, S.T.; Shin, S.E.; Oh, K.H. Sedimentary geochemical characteristics and environmental impact of sediments in Tamjin River and Doam Bay. J. Environ. Impact Assess. 2007, 16, 393–405. [Google Scholar]
  22. Chihara, M.; Murano, M. An Illustrated Guide to Marine Plankton in Japan; Tokai University Press: Tokyo, Japan, 1997; pp. 1–260. [Google Scholar]
  23. Bray, J.R.; Curtis, J.T. An ordination of the upland forest communities of southern Wisconsin. Ecol. Monogr. 1957, 27, 326–349. [Google Scholar] [CrossRef]
  24. Clarke, K.R.; Gorley, R.N.; Somerfield, P.J.; Warwick, R.M. Change in Marine Communities: An Approach to Statistical Analysis and Interpretation, 2nd ed.; Plymouth Marine Laboratory: Plymouth, UK, 2001; pp. 1–262. [Google Scholar]
  25. Clarke, K.R. Non-parametric multivariate analyses of changes in community structure. Aust. Ecol. 1993, 18, 117–143. [Google Scholar] [CrossRef]
  26. Wickham, H.; Chang, W.; Wickham, M.H. Package ‘ggplot2’. Create elegant data visualisations using the grammar of graphics. R Package Version 2016, 2, 1–189. [Google Scholar]
  27. Oksanen, J.; Blanchet, F.G.; Friendly, M.; Kindt, R.; Legendre, P.; McGlinn, D.; Wagner, H. Vegan: Community Ecology Package. R Package Version 2019, 9, 1–287. [Google Scholar]
  28. Kwak, M.T.; Cho, Y.K. Seasonal Variation in Residence Times of Two Neighboring Bays with Contrasting Topography. Estuaries Coast. 2019, 43, 1–13. [Google Scholar] [CrossRef]
  29. Jordan, T.E.; Correll, D.L.; Miklas, J.J.; Weller, D.E. Long-term trends in estuarine nutrients and chlorophyll, and short-term effects of variation in watershed discharge. Mar. Ecol. Prog. Ser. 1991, 75, 121–132. [Google Scholar] [CrossRef]
  30. O’Higgins, T.G.; Wilson, J.G. Impact of the river Liffey discharge on nutrient and chlorophyll concentrations in the Liffey estuary and Dublin Bay (Irish Sea). Estuar. Coast. Shelf Sci. 2005, 64, 323–334. [Google Scholar] [CrossRef]
  31. National Climate Data Center of Korea Meteorological Administration. Available online: https://data.kma.go.kr/data/grnd/selectAsosRltmList.do?pgmNo=36 (accessed on 14 July 2021).
  32. Delgado, M.; de Jonge, V.N.; Peletier, H. Experiments on resuspension of natural microphytobenthos populations. Mar. Biol. 1991, 108, 321–328. [Google Scholar] [CrossRef]
  33. Kim, S. Pre-monsoon dynamics of zooplankton community in the estuary of the Tamjin River, Korea. Korean J. Ecol. Environ. 2015, 33, 19–26. [Google Scholar]
  34. Soh, H.Y.; Kwon, S.W.; Lee, W.; Yoon, Y.H. A new Pseudodiaptomus (Copepoda, Calanoida) from Korea supported by molecular data. Zootaxa 2012, 3368, 229–244. [Google Scholar] [CrossRef] [Green Version]
  35. Im, D.H.; Suh, H.L. Resource utilization of three copepods along salinity gradient in the Seomjin River estuary, revealed by stable isotope analysis. Ocean Sci. J. 2021, 56, 106–116. [Google Scholar] [CrossRef]
  36. Kim, S.W.; Han, M.S.; Lee, K.; Choi, Y.K.; Yoo, K.I. Zooplankton and phytoplankton dynamics with the construction of river mouth dam in Kum River estuary, Korea. Korean J. Ecol. Environ. 2002, 35, 141–144. [Google Scholar] [CrossRef] [Green Version]
  37. Yoo, J.K.; Jeong, J.H.; Nam, E.J.; Jeong, K.M.; Lee, S.W.; Myung, C.S. Zooplankton community and distribution in relation to water quality in the Saemangeum area, Korea: Change in Zooplankton community by the construction of sea Dyke. Ocean Polar Res. 2006, 28, 305–315. [Google Scholar] [CrossRef] [Green Version]
  38. Lee, C.R.; Kang, H.K.; Noh, J.H. Temporal and spatial variation of zooplankton community structure post construction of Saemangeum dyke. Ocean Polar Res. 2009, 31, 327–338. [Google Scholar] [CrossRef]
  39. Wooldridge, T.H. Estuarine zooplankton community structure and dynamics. In Estuaries of South Africa; Allanson, B.R., Baird, D., Eds.; Cambridge University Press: Cambridge, UK, 1999; pp. 141–166. [Google Scholar]
  40. Rose, T.H.; Tweedley, J.R.; Warwick, R.M.; Potter, I.C. Influences of microtidal regime and eutrophication on estuarine zooplankton. Estuar. Coast. Shelf Sci. 2020, 238, 106689. [Google Scholar] [CrossRef]
  41. Soh, H.Y.; Suh, H.L.; Ohtsuka, S.; Yoon, Y.H.; Choi, S.D. Taxonomic studies on brackish copepods in Korean waters—II. Ontogeny and phylogeny of appendages in copepodid stages of Tortanus derjugini Smirnov, 1935 (Copepoda, Calanoida). J. Plankton Res. 2001, 23, 1157–1169. [Google Scholar] [CrossRef]
  42. Choi, S.Y.; Seo, M.H.; Soh, H.Y. Short-term variation in abundance of four Acartia species (Copepoda, Calanoida) in a eutrophic bay. PeerJ 2021, 9, e10835. [Google Scholar] [CrossRef]
  43. Jacobs, J. Animal behavior and water movement as co-determinants of plankton distribution in a tidal system. Sarsia 1968, 34, 355–370. [Google Scholar] [CrossRef]
  44. Wooldridge, T.H.; Erasmus, T. Utilization of tidal currents by estuarine zooplankton. Estuar. Coast. Mar. Sci. 1980, 11, 107–114. [Google Scholar] [CrossRef]
  45. Ueda, H.; Terao, A.; Tanaka, M.; Hibino, M.; Islam, M.S. How can river-estuarine planktonic copepods survive river floods? Ecol. Res. 2004, 19, 625–632. [Google Scholar] [CrossRef] [Green Version]
  46. Kimmerer, W.J.; Gross, E.S.; MacWilliams, M.L. Tidal migration and retention of estuarine zooplankton investigated using a particle-tracking model. Limnol. Oceanogr. 2014, 59, 901–916. [Google Scholar] [CrossRef]
  47. Sullivan, B.K.; McManus, L.T. Factors controlling seasonal succession of the copepods Acartia hudsonica and A. tonsa in Narragansett Bay, Rhode Island: Temperature and resting egg production. Mar. Ecol. Prog. Ser. 1986, 28, 121–128. [Google Scholar] [CrossRef]
  48. Ueda, H. Temporal and spatial distribution of the two closely related Acartia species A. omorii and A. hudsonica (Copepoda, Calanoida) in a small inlet water of Japan. Estuar. Coast. Shelf Sci. 1987, 24, 691–700. [Google Scholar] [CrossRef]
  49. Lawrence, D.; Valiela, I.; Tomasky, G. Estuarine calanoid copepod abundance in relation to season, salinity, and land-derived nitrogen loading, Waquoit Bay, MA. Estuar. Coast. Shelf Sci. 2004, 2004. 61, 547–557. [Google Scholar] [CrossRef]
  50. Lee, E.H.; Seo, M.H.; Yoon, Y.H.; Choi, S.D.; Soh, H.Y. Environmental factors affecting zooplankton community in Gwangyang Bay. Korean J. Environ. Biol. 2017, 2017. 35, 631–639. [Google Scholar] [CrossRef]
  51. Sun, X.H.; Sun, S.; Li, C.L.; Zhang, G.T. Seasonal and spatial variation in abundance and egg production of Paracalanus parvus (Copepoda: Calanoida) in/out Jiaozhou Bay, China. Estuar. Coast. Shelf Sci. 2008, 79, 637–643. [Google Scholar] [CrossRef]
  52. Islam, M.S.; Ueda, H.; Tanaka, M. Spatial and seasonal variations in copepod communities related to turbidity maximum along the Chikugo estuarine gradient in the upper Ariake Bay, Japan. Estuar. Coast. Shelf Sci. 2006, 68, 113–126. [Google Scholar] [CrossRef]
Figure 1. Map showing the sampling stations in Doam Bay, Korea. Light gray shaded regions indicate the shallow areas formed by sedimentation in the bay.
Diversity 13 00389 g001
Figure 2. Horizontal distribution of surface water temperature (°C) during the study period: (a) spring, (b) summer, (c) fall, (d) winter.
Diversity 13 00389 g002
Figure 3. Horizontal distribution of surface salinity (psu) during the study period: (a) spring, (b) summer, (c) fall, (d) winter. The different colors in the figure, from light blue to dark blue, indicate the mesohaline (5–18 psu), polyhaline (18–30 psu), and euhaline (30–40 psu) zones, respectively.
Diversity 13 00389 g003
Figure 4. Horizontal distribution of surface chlorophyll-a concentrations (ug/L) during the study period: (a) spring, (b) summer, (c) fall, (d) winter.
Diversity 13 00389 g004
Figure 5. Horizontal distribution of surface (a) phytoplankton (cells/mL), (b) diatoms (cells/mL), (c) dinoflagellate (cells/mL), and (d) turbidity (FTU) during the study period. Blue columns correspond to spring, red columns correspond to summer, green columns correspond to fall, and purple columns correspond to winter.
Diversity 13 00389 g005
Figure 6. Horizontal distribution of zooplankton abundance (ind./m3) during the study period: (a) spring, (b) summer, (c) fall, (d) winter.
Diversity 13 00389 g006
Figure 7. Horizontal distribution of copepod abundance (ind./m3) during the study period: (a) spring, (b) summer, (c) fall, (d) winter.
Diversity 13 00389 g007
Figure 8. Dendrogram of station similarity from the cluster analysis (left) and ordination plots based on non-metric multidimensional scaling (right) of copepod abundance in Doam Bay: (a) spring, (b) summer, (c) fall, (d) winter. Numbers correspond to the stations within the bay. Capital letters A, B, and C represent groups of stations distinguished based on species similarity. A1 and A2 are subgroups subdivided by species similarity within group A.
Diversity 13 00389 g008
Figure 9. Seasonal differences in the copepod abundance between the station groups classified by the cluster analysis results: (a) spring, (b) summer, (c) fall, (d) winter. A, B, and C represent groups of stations distinguished based on species similarity. A1 and A2 are subgroups subdivided by species similarity within group A. The upper and lower bars in the bar graph represent the range of the maximum and minimum values (excluding the outliers).
Diversity 13 00389 g009
Figure 10. Redundancy analysis (RDA) ordination plot of axes I and II showing major copepods in relation to environmental variables in Doam Bay: (a) spring, (b) summer, (c) fall, (d) winter. Abbreviations: A.for, Acartia forticrusa; A.hud, Acartia hudsonica; A.oht, Acartia ohtsukai; P.mar, Pseudodiaptomus marinus; P.par, Paracalanus parvus s. l.; T.der, Tortanus derjugini; T.dex, Tortanus dextrilobatus; T.for, Tortanus forcipatus; Har, Harpacticoida; Chl-a, Chlorophyll-a concentration; Dia, Diatomeae; Dino, Dinoflagellata; Phyto, Phytoplankton; Sal, Salinity; Temp, Temperature; Turb, Turbidity.
Diversity 13 00389 g010
Table 1. List of the zooplankton living in Doam Bay and their contribution (%) during the study period. In the last two rows of the table, the numbers following the ± mark indicate the standard deviation of the population mean. The asterisks indicate that the contribution rate of a particular taxon is lower than 0.1% but greater than 0. Abbreviation: Unid, unidentified.
Taxon20182019
SpringSummerFallWinter
Trachylinae
Unid. Trachymedusae0.301.34 5.96
Cladocera
Pleopis polyphemoides0.02
Calanoida (Copepoda)
Acartia erythraea 0.40
Acartia hongi0.14 0.150.02
Acartia hudsonica38.97 43.1075.53
Acartia ohtsukai14.086.7510.84
Acartia forticrusa 14.89
Bestiolina coreana 0.14
Calanopia thompsoni0.03
Calanus sinicus0.02
Centropages abdominalis 0.05
Centropages tenuiremis0.010.04
Eurytemora pacifica0.07 0.49
Labidocera pavo0.00 *
Labidocera rotunda 0.04
Paracalanus parvus s. l.1.002.6323.680.68
Parvocalanus crassirostris 0.06
Pseudodiaptomus japonicus 0.030.040.03
Pseudodiaptomus marinus16.550.070.110.87
Tortanus derjugini1.56
Tortanus dextrilobatus0.240.530.85
Tortanus forcipatus 2.030.04
Cyclopoida (Copepoda)
Ditrichocorycaeus affinis0.020.070.260.12
Oithona spp.0.042.128.000.04
Harpacticoida (Copepoda)
Unid. Harpacticoida0.290.180.8714.71
Multicrustacea
Unid. Amphipods0.07 0.03
Unid. Mysids0.03
Unid. Isopods0.280.02
Chaetognatha
Aidanosagitta crassa 0.040.410.09
Larvae
Cirripedia larvae17.8335.933.470.54
Decapoda larvae3.192.830.08
Bivalvia larvae2.503.130.05
Gastropoda larvae1.186.390.020.04
ophiopluteus larvae 8.700.07
Polychaeta larvae0.490.470.410.81
Appendicularia
Oikopleura dioica 11.247.44
Total abundance (ind./m3)2793 ± 29245578 ± 64691122 ± 23242091 ± 2140
Copepoda(ind./m3)2039 ± 23501668 ± 2678988 ± 22741934 ± 2032
Table 2. Correlations between common species and environmental factors across different seasons in Doam Bay (sample size: 88; ** indicates p < 0.01; * indicates p < 0.05). Abbreviations: AF, Acartia forticrusa; AH, Acartia hudsonica; AO, Acartia ohtsukai; PM, Pseudodiaptomus marinus; PP, Paracalanus parvus s. l.; TDER, Tortanus derjugini; TDEX, Tortanus dextrilobatus; TF, Tortanus forcipatus; OS, Oithona spp.; Harp, Harpacticoida; Temp, Temperature; Sal, Salinity; Phyto, Phytoplankton; Dia, Diatomeae; Dino, Dinoflagellata; Turb, Turbidity.
SeasonSpeciesAFAHAOPPPMTDERTDEXTFOSHarpTempSalChl-aPhytoDiaDinoTurb
SpringAcartia hudsonica (AH)-10.848 **-−0.090−0.383----−0.2330.282−0.243−0.021−0.022-−0.241
Acartia ohtsukai (AO)-0.848 **1-−0.119−0.335---−0.2200.265−0.149−0.114−0.115-−0.135
Pseudodiaptomus marinus (PM)-−0.090−0.119-10.479 *----0.160−0.0600.132−0.269−0.268-0.048
Tortanus derjugini (TDER)-−0.383−0.335-0.479 *1----0.582 **−0.513 *0.544 *−0.423−0.420-0.487 *
SummerAcartia ohtsukai (AO)0.120-1---0.1160.194--−0.041−0.015−0.121−0.104−0.1050.426 *−0.044
Acartia forticrusa (AF)1-0.120---0.979 **−0.211--0.578 **−0.851 **0.647 **−0.462 *−0.462 *−0.1950.455 *
Tortanus dextrilobatus (TDEX)0.979 **-0.116---1−0.169--0.493 *−0.751 **0.599 **−0.442 *−0.442 *−0.1860.432 *
Tortanus forcipatus (TF)−0.2110.194---−0.1691--−0.1180.242−0.2130.0890.090−0.041−0.195
FallAcartia hudsonica (AH)-10.989 **0.948 **----0.984 **-−0.328−0.2640.169−0.105−0.105−0.1030.329
Acartia ohtsukai (AO)-0.989 **10.955 **----0.975 **-−0.225−0.1430.112−0.075−0.075−0.0670.224
Paracalanus parvus s. l. (PP)-0.948 **0.955 **1----0.971 **-−0.237−0.1600.095−0.072−0.072−0.0470.187
Oithona spp. (OS)-0.984 **0.975 **0.971 **----1-−0.291−0.2200.122−0.114−0.114−0.1040.274
WinterAcartia hudsonica (AH)-1-−0.125-----0.313−0.580 **−0.746 **0.760 **0.2160.2140.663 **0.656 **
Paracalanus parvus s. l. (PP)-−0.125-1-----−0.0700.3160.359−0.373−0.251−0.250−0.224−0.281
Harpacticoida (Harp)-0.313-−0.070-----1−0.366−0.423 *0.422 *0.3710.3710.0060.442 *
Publisher’s Note: MDPI stays neutral with regard to jurisdictional claims in published maps and institutional affiliations.

