Article

Microbial Community’s Dynamic Response to Fomesafen Usage in Chernozems of Northeast China

1
Engineering Research Center of Agricultural Microbiology Technology, Ministry of Education, Heilongjiang University, Harbin 150800, China
2
Heilongjiang Provincial Key Laboratory of Ecological Restoration and Resource Utilization for Cold Region, School of Life Sciences, Heilongjiang University, Harbin 150800, China
3
Key Laboratory of Microbiology, College of Heilongjiang Province, Harbin 150800, China
*
Author to whom correspondence should be addressed.
Diversity 2021, 13(8), 340; https://doi.org/10.3390/d13080340
Submission received: 6 July 2021 / Revised: 19 July 2021 / Accepted: 22 July 2021 / Published: 26 July 2021
(This article belongs to the Section Microbial Diversity and Culture Collections)

Abstract

:
The main purpose of this study was to explore the effects of the recommended usage level and twice the recommended usage level of the long-acting herbicide fomesafen on the soil enzymes and microbial community structure in chernozems of soybean fields. Culturable microbial biomass and phospholipid fatty acids (PLFA) were used as the main references for this evaluation. The digestion curve of fomesafen in soil conforms to the law of a single exponential function. The activities of four soil enzymes decreased significantly when exposed to twice the recommended amount, and then returned to the control level. The inhibition of the fungal and bacterial biomass section of culturable microorganisms in soil at twice the recommended usage level was greater than that under the recommended usage level, and this dosage also stimulated the rapid recovery of the initial level of fungal biomass before the application of fomesafen. The PLFA analysis showed that the ratio of GN/GP decreased significantly, and soil pressure increased significantly. Compared with the recommended usage level, the effect of twice the recommended usage level of fomesafen on soil microbial community structures was more significant. This provides a reference for environmental location recommendations, environmental safety assessments, and the rational use of herbicides.

Graphical Abstract

1. Introduction

Fomesafen, which is a diphenyl ether herbicide developed by AstraZeneca (UK), is used to remove broadleaf weeds in soybean, fruit tree, and rubber estate fields in China [1]. Fomesafen was first exported to China in 1988, and was first produced in China in 1994, becoming a widely used and effective herbicide by the beginning of the 20th century [2,3]. Since fomesafen is a long-acting residual herbicide with a half-life ranging from 10 days to several months, its residue dynamics in soil should be assessed [4,5,6].
The application of a pesticide can effectively prevent disastrous losses of grain yield and promote economic growth in the agricultural industry, but its degradation is affected by many factors, including soil type, pH, organic matter content and soil microbial communities. We speculate that there is consistency in the effects of fomesafen [7,8]. Previous authors have reported a residual half-life of fomesafen of 133 days when used in a soybean field of anthrosols in Hangzhou, and of 14.2 days when used in a soybean field of anthrosols in Chuzhou [9]. They studied the degradation of fomesafen in Gongzhuling chernozems in the Jilin Province, and observed that the initial slow degradation rate became more rapid on days 60–90, with yielded half-lives of approximately 87 days for applications of both 18.75 mg/kg and 37.5 mg/kg [10]. The degradation of fomesafen in cambisols in Langfang, Hebei Province, has also been studied, and it was found that the half-life of fomesafen here was 84.9 days, 156.3 days and 1453.7 days, following applications of 3.75 mg/kg, 37.5 mg/kg and 375 mg/kg, respectively. Therefore, although fomesafen can be degraded in soil, it still affects the soil’s ecological environment via its long-term residues; in fact, multiple applications will cause serious damage to soil enzyme activity and microbial community structure. This problem has been a widespread source of concern for foreign and domestic researchers and their related institutions. It found that fomesafen altered the microbial community structure and functional diversity of soil collected from Langfang City, Hebei Province, China, and held in large, polyvinyl chloride tanks under experimental conditions for two weeks. These changes did not recover, even after an incubation period of 90 days [3]. Laboratory experiments showed that 0~500 μg/kg of fomesafen had different effects on soil microbial community structures and soil enzyme activity in Taian City, Shandong Province [11]. It has been shown that fomesafen causes changes in urease and invertase activities. These changes were accompanied by significantly decreased bacterial richness and diversity when kept under greenhouse conditions in Gongzhuling City, Jilin Province, China. These four studies show that the effects of fomesafen on enzyme activity and microbial community in different soil types from different areas were different [10].
Soil microorganisms and enzymes participate in the metabolism of soil substances, and are commonly used as a reference to assess soil quality. The changes in the total amount of PLFA in the soil reflect changes in the microorganisms in the soil. However, very little information is available on fomesafen residue’s dynamics and its effect on microbial communities in chernozem soybean fields in northeastern China [12]. The objectives of this study were to determine the effects of fomesafen on soil enzyme activities, culturable microorganisms and phospholipid fatty acids in soybean fields. We hypothesized that (1) multiple applications of fomesafen would increase the residue in chernozems; (2) multiple applications of fomesafen would alter the activities of urease, saccharase, cellulase and catalase in chernozems; and (3) multiple applications of fomesafen can alter the chernozems’ microbial communities.

2. Materials and Methods
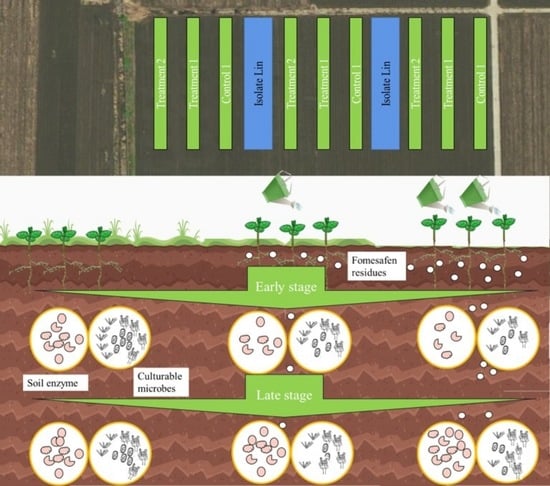
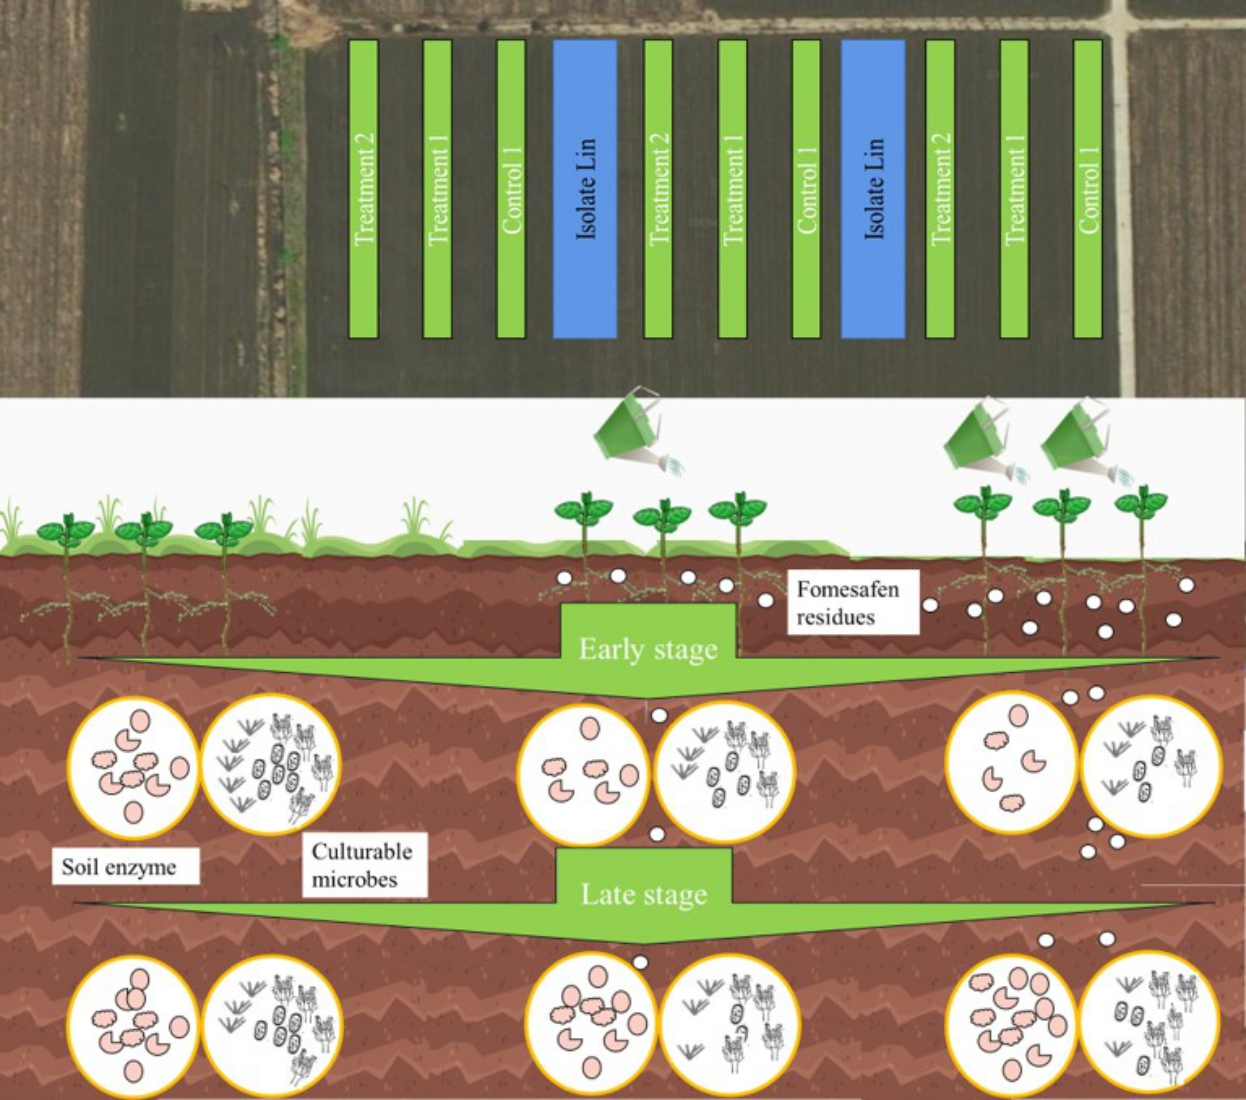
2.1. Soil

Soil samples used were collected from soybean fields in Hulan (45.90° N latitude and 126.58° E longitude) in Heilongjiang Province, China. This area is located in the second accumulated temperate zone, with an annual accumulated temperature of 2500–2700 °C and an annual precipitation of 800 mm in 2020.
The samples were air-dried naturally and passed through a 2 mm sieve for subsequent analysis. The pH was determined via the potassium chloride leaching solution method. The organic matter content was determined via the potassium dichromate heating oxidation method [7]. The whole nitrogen used was potassium borate with copper sulfate as the selenium powder, and the automatic analyzer used was determined by nitrogen analysis. Total phosphorus was determined using sulfuric acid in the perchloric acid digestion and molybdenum anti-colorimetric method. Total potassium was determined via the flame photometric method [13].
The farmland was divided into 9 fields, with an area of 700 square meters (7 m × 100 m) and a length of 100 m. The test site was divided into the control treatment area (Control), the recommended usage level treatment area (Treatment 1) and twice the recommended usage level treatment area (Treatment 2). In the spraying area, soybean plants at the 1–3-leaf stage were treated with fomesafen (25% water agent, purchased from Dalian Songliao Chemical Co., Ltd., Liaoning, China). In accordance with the commercial farmland recommended application level, the soil was treated with 100 mL of 25% fomesafen diluted in 15 L of water and sprayed at 150 L·hm−2 using a manual knapsack sprayer (Treatment 1). Twice the recommended usage level was also applied (Treatment 2). Here, soil samples were collected at the following time points: the day before spraying (day 0), on the day of spraying (day 1), and after spraying (day 7, day 14, day 30, day 60, and day 90). Roots, leaves, weeds and other visible debris were removed from the soil surface before sampling. Samples were collected at 10–20 cm surface layer by the five-point method in 9 treatment areas, and then mixed samples were collected for subsequent experiments. A portion of the sample was used to determine the biomass of culturable microorganisms in the soil. A second portion of the sample was dried at room temperature and then sieved (60 mesh) for the determination of fomesafen residues and enzyme activity. A third portion of the sample was freeze-dried under vacuum, sieved (100 mesh) and stored at −80 °C for PLFA analysis.
To validate the reliability of the soil extraction method and the chromatographic conditions, fomesafen was added to the soil at 2 different concentrations (3.75 mg/kg, 7.5 mg/kg), with 3 replicates per concentration; soil samples without fomesafen were used as a blank (Control). The fomesafen recovery rate was determined as the ratio of the measured and added concentrations. The coefficient of variation was defined as the ratio of the standard deviation and the average recovery rate.

2.2. Soil Fomesafen Residue Assays

The fomesafen was extracted as follows: 8 g of soil sample was added to a 50 mL centrifuge tube and 15 mL of an extraction solvent (hexane: acetone, 1:1) was added. The suspension was then sonicated for 5 min and centrifuged for 5 min at 5000 rpm. The supernatant was moved into a new glass tube and flushed with nitrogen for later use. The solvent extraction process was repeated 4 times in total and the supernatants were pooled and dried under nitrogen after each step. Subsequently, 2 mL of methanol was added to the glass tube and the pooled supernatant was sonicated for 30 s before filtration (0.22 μm) prior to analysis [14].
The fomesafen levels were determined via high-performance liquid chromatography (HPLC: CBM-102, SHIMADZU, Kyoto, Japan) under the following conditions: chromatographic column, inertsil ODS-3 C18 (4.6 mm × 250 mm, 5 μm); column temperature, 40 °C; mobile phase, methanol and water = 3:1 (v/v); detection wave, 230 nm; flow rate, 0.8 mL/min; injection volume, 20 µL. The fomesafen standard was prepared via the dilution of a stock solution (1000 mg/L) to concentrations of 25, 12.5, 6.25, 3.125 and 1.56 mg/L. According to the relationship between the standard concentration and the peak area measured by high-performance liquid chromatography (CBM-102, SHIMADZU, Kyoto, Japan), we deduced the standard curve and regression equation for the calculation of the fomesafen concentration.
The fomesafen residual curves were prepared. The digestion kinetics equation (Equation (1), and the correlation coefficient, R2, were obtained by adding an index trend line. The half-life of the fomesafen in the soybean field was calculated according to Equation (2).
Ct = C0 × e−kt
t1/2 = (ln2)/k
C0 is the initial concentration of fomesafen; Ct is the residual concentration at time t; t1/2 is the half-life, the time required for the concentration to decrease by half, and k is the dissolution rate constant.

2.3. Soil Enzyme Assays

The activities of 4 enzymes—catalase, urease, saccharase, and acid phosphatase—were determined within 15 days of collecting the soil samples. The catalase was assessed via potassium permanganate titration, and the results are expressed as moles of KMnO4 consumed per g of soil per hour [15]. Urease was assessed via urea hydrolysis colorimetry, and the results are expressed as the content (mg) of NH3–N released per g of soil per hour [16]. Saccharase was assessed via 3, 5-double nitro salicylic acid colorimetry, and the results are expressed as the content (mg) of glucose released per g of soil per hour. Acid phosphatase was assessed via phosphate benzene double sodium colorimetry, and the results are expressed as the content (mg) of phenol released per g of soil over 12 h [17].

2.4. Soil Culturable Microbial Analysis

The culturable bacteria, fungi, and actinomycetes were detected via the traditional dilution plate method [18]. A 10 g soil sample was suspended and vortexed in 90 mL of sterile water and diluted 10-fold serially to 10−8-fold. Diluted samples (0.2 mL) were then spread on each of the agar plates containing a beef extract peptone medium for bacteria, a Rose Bengal medium for fungi, and a Gauze No. 1 medium for actinomycetes [19]. Three replicates were prepared for each dilution series. The numbers of colony-forming units (CFU) were counted after incubation for 36 h at 30 °C for bacteria, 48 h at 28 °C for fungi, and 120 h at 30 °C for actinomycetes. The CFU of each microorganism was then calculated per kilogram of soil.

2.5. Soil PLFA Analysis

The PLFA was extracted from soil frozen at −80 °C using chloroform–methanol [20]. The supernatant separated in hexane contained C19:0 fatty acid methyl esters (FAMEs) that were quantified and identified by GC-MS (Agilent 6850N, Agilent Technologies, Inc., Wilmington, DE, USA). In addition, the C19:0 fatty acid methyl esters and 37 component FAMEs were used as the quantitative standard for detection. The GC-MS operating conditions were as follows: HP-5 column (30.0 m × 320 μm × 0.25 μm); injection volume, 2 μL; diversion ratio, 10:1; carrier gas, N2; flow rate, 0.8 mL/min. The separation was carried out at an initial temperature of 140 °C for 3 min, followed by 4 heating stages: 140–190 °C, 4 °C/min maintained for 1 min; 190–230 °C, 3 °C/min maintained for 1 min, 230–250 °C, 2 °C/min maintained for 2 min, and 250–300 °C, 10 °C/min maintained for 1 min. The GC-MS system was fitted with a flame ion detector (FID) and the data were analyzed using the MIDI Sherlock Microbial Identification System 6.0.
The total PLFA was calculated as the sum of all the microbial phospholipids measured via gas chromatography–mass spectrometry (GC-MS). Fungal biomass was assessed by quantifying 18:1ω9c, 18:2ω6, 9c, 16:1ω5c and 18:1ω9t. The bacterial biomass was assessed using 13 fatty acids (14:00, i15:0, a15:0, i16:0, 16:1ω7c, 16:1ω9c, 2OH16:0, 17:00, i17:0, a17:0, cy17:0, 18:1ω7c, and cy19:0). The fungi/bacteria ratio represents the relative changes in the contents of fungi and bacteria in the soil’s microecology. The branched phospholipids 16:1ω5c, 16:1ω7c, 16:1ω9c, 17:1ω8c, cy17:0, 18:1ω7c, 18:1ω9c, and cy19:0 were used as indicators of Gram-negative (GN) bacteria, while the PLFAs i14:0, i15:0, a15:0, i16:0, i17:0, and a17:0 were used as indicators of Gram-positive (GP) bacteria. The GN/GP ratio indicates changes in the relative abundance of these microbial groups. The anaerobic biomass was assessed by quantifying cy17:0 and cy19:0, and the aerobic biomass was assessed by quantifying 16:1ω7c and 18:1ω7c. The stress indicator for the microbial community was calculated from the anaerobic biomass/aerobic biomass ratio [11].

2.6. Statistical Analysis

The fomesafen’s residual dynamics and dissolution curves were constructed with Excel. Soil enzyme activities, the biomass of culturable microorganisms, and the indexes of the PLFA content in the soil were analyzed using Duncan’s homogeneity test of variance for Social Sciences (SPSS 17.0 for Windows) (SPSS Inc., Chicago, IL, USA). 0.01 < p < 0.05, p < 0.01, and p < 0.001 indicate different levels of statistical significance. Principal component analysis (PCA) and partial least square discriminant analysis (PLS-DA) were applied to examine the PLFA community structures in different samples containing multiple variables, via SIMCA-p 11.5 (HJ07405, Umetric Inc., Kinnelon, NJ, USA) [21]. PCA was conducted to compare soil microbial community compositions based on relative concentrations of individual PLFA molecules using Canoco for Windows Version 4.5 (Biometris-Plant Research International, Wageningen, The Netherlands).

3. Results

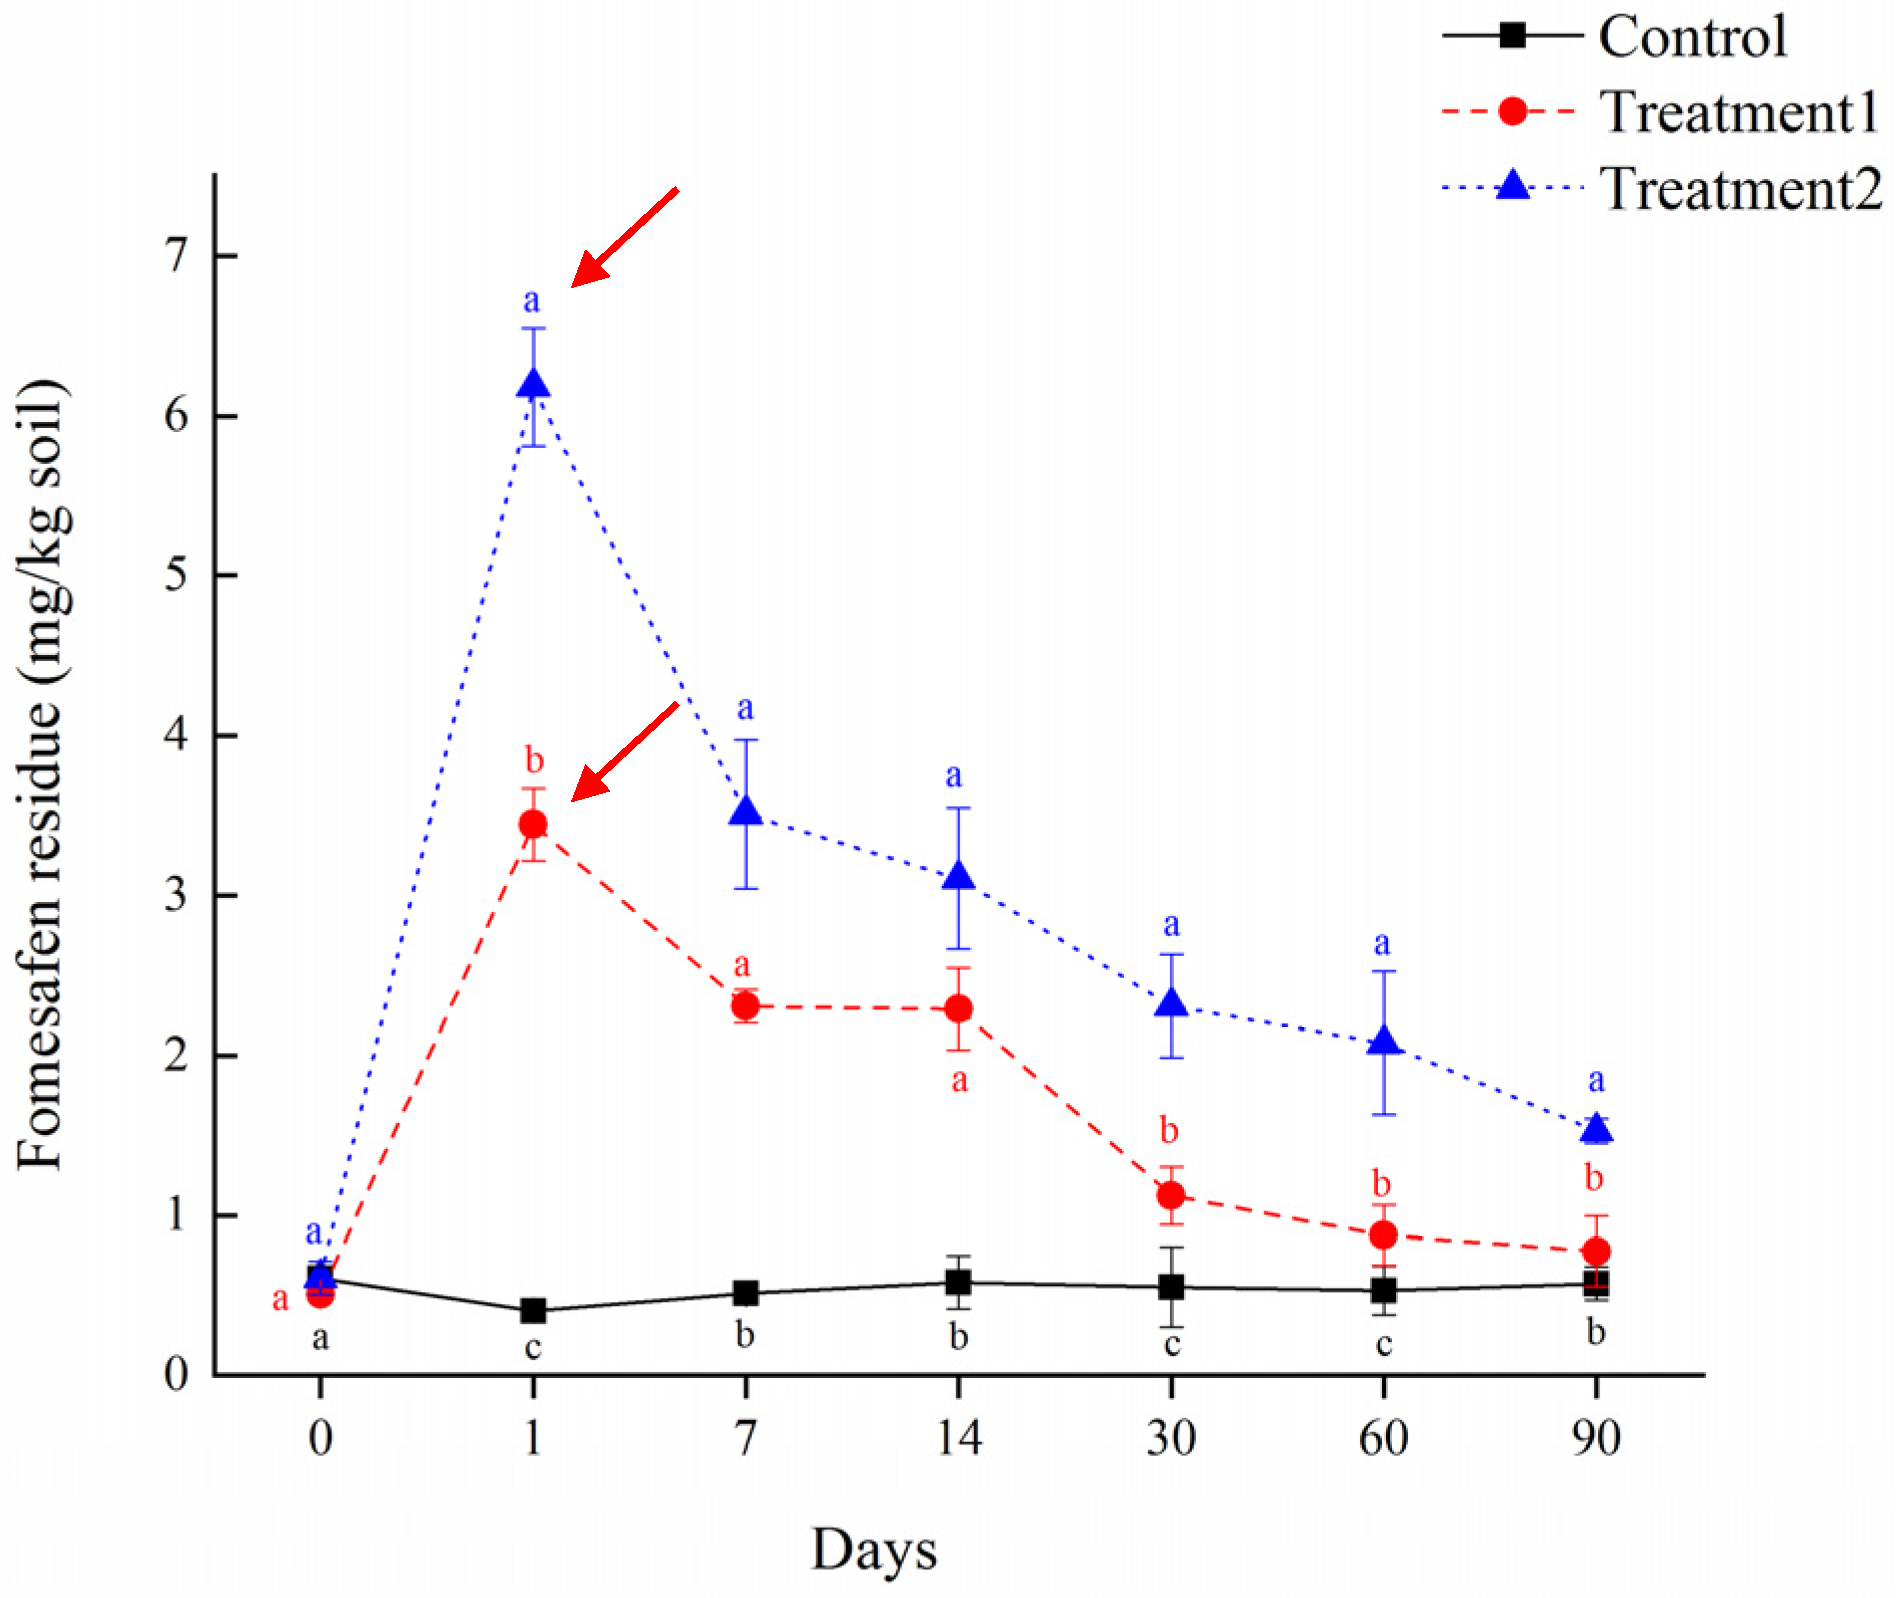
3.1. Soil Characteristics and Fomesafen Residues

The characteristics of the soil samples were as follows: Mollisols, organic matter, 31.2 g/kg; total potassium, 18.77 g/kg; total nitrogen, 1.67 g/kg; total phosphorus, 0.54 g/kg; the pH was 5.6 in the KCl; maximum water holding capacity, 18.31%; clay, 34.26%; powder, 27.31%; and sand, 38.43%;
The average recovery rate of fomesafen in the soil was 85.7–101.9%, with a coefficient of variation between 1.46 and 3.86%, indicating that the extraction method and the testing conditions met the requirements of pesticide residue analysis. The residue dynamics of fomesafen in the soybean field applied at the recommended level and twice the recommended usage level are shown in Figure 1. Following the first day of spraying with the recommended usage level, the content of fomesafen in the soil reached its highest level of 3.44 ± 0.22 mg/kg, and then gradually declined. On day 90, the concentration of pesticide residue was 0.88 ± 0.22 mg/kg, and then the pesticide residue in the treatment group recovered to the level of the control group. Following the application of twice the recommended level, the content of fomesafen in the soil reached its highest level on the first day, which was 6.18 ± 0.37 mg/kg, and then gradually decreased. On day 90, the residual concentration was 1.53 ± 0.08 mg/kg, accounting for 20.37% of the original content in the spray test. The residual concentration on day 90 was still significantly higher than in the control and recommended usage groups (Figure 1).
The residue dynamics of the fomesafen were calculated using to the residue curve. Its degradation is in line with the single exponential function model. According to the values of y = 3.2907 × e−0.031x (R2 = 0.7248) and y = 4.2745 × e−0.012x (R2 = 0.7922), we calculated the digestion dynamics of the fomesafen at the recommended level and twice the recommended level, respectively (Table 1). The results show that the degradation of the fomesafen adhered to the general first-order kinetic process. The half-lives of the recommended application and twice the recommended application were 18.14 and 10.91 days, respectively, and the degradation rate was faster when twice the recommended level was applied.

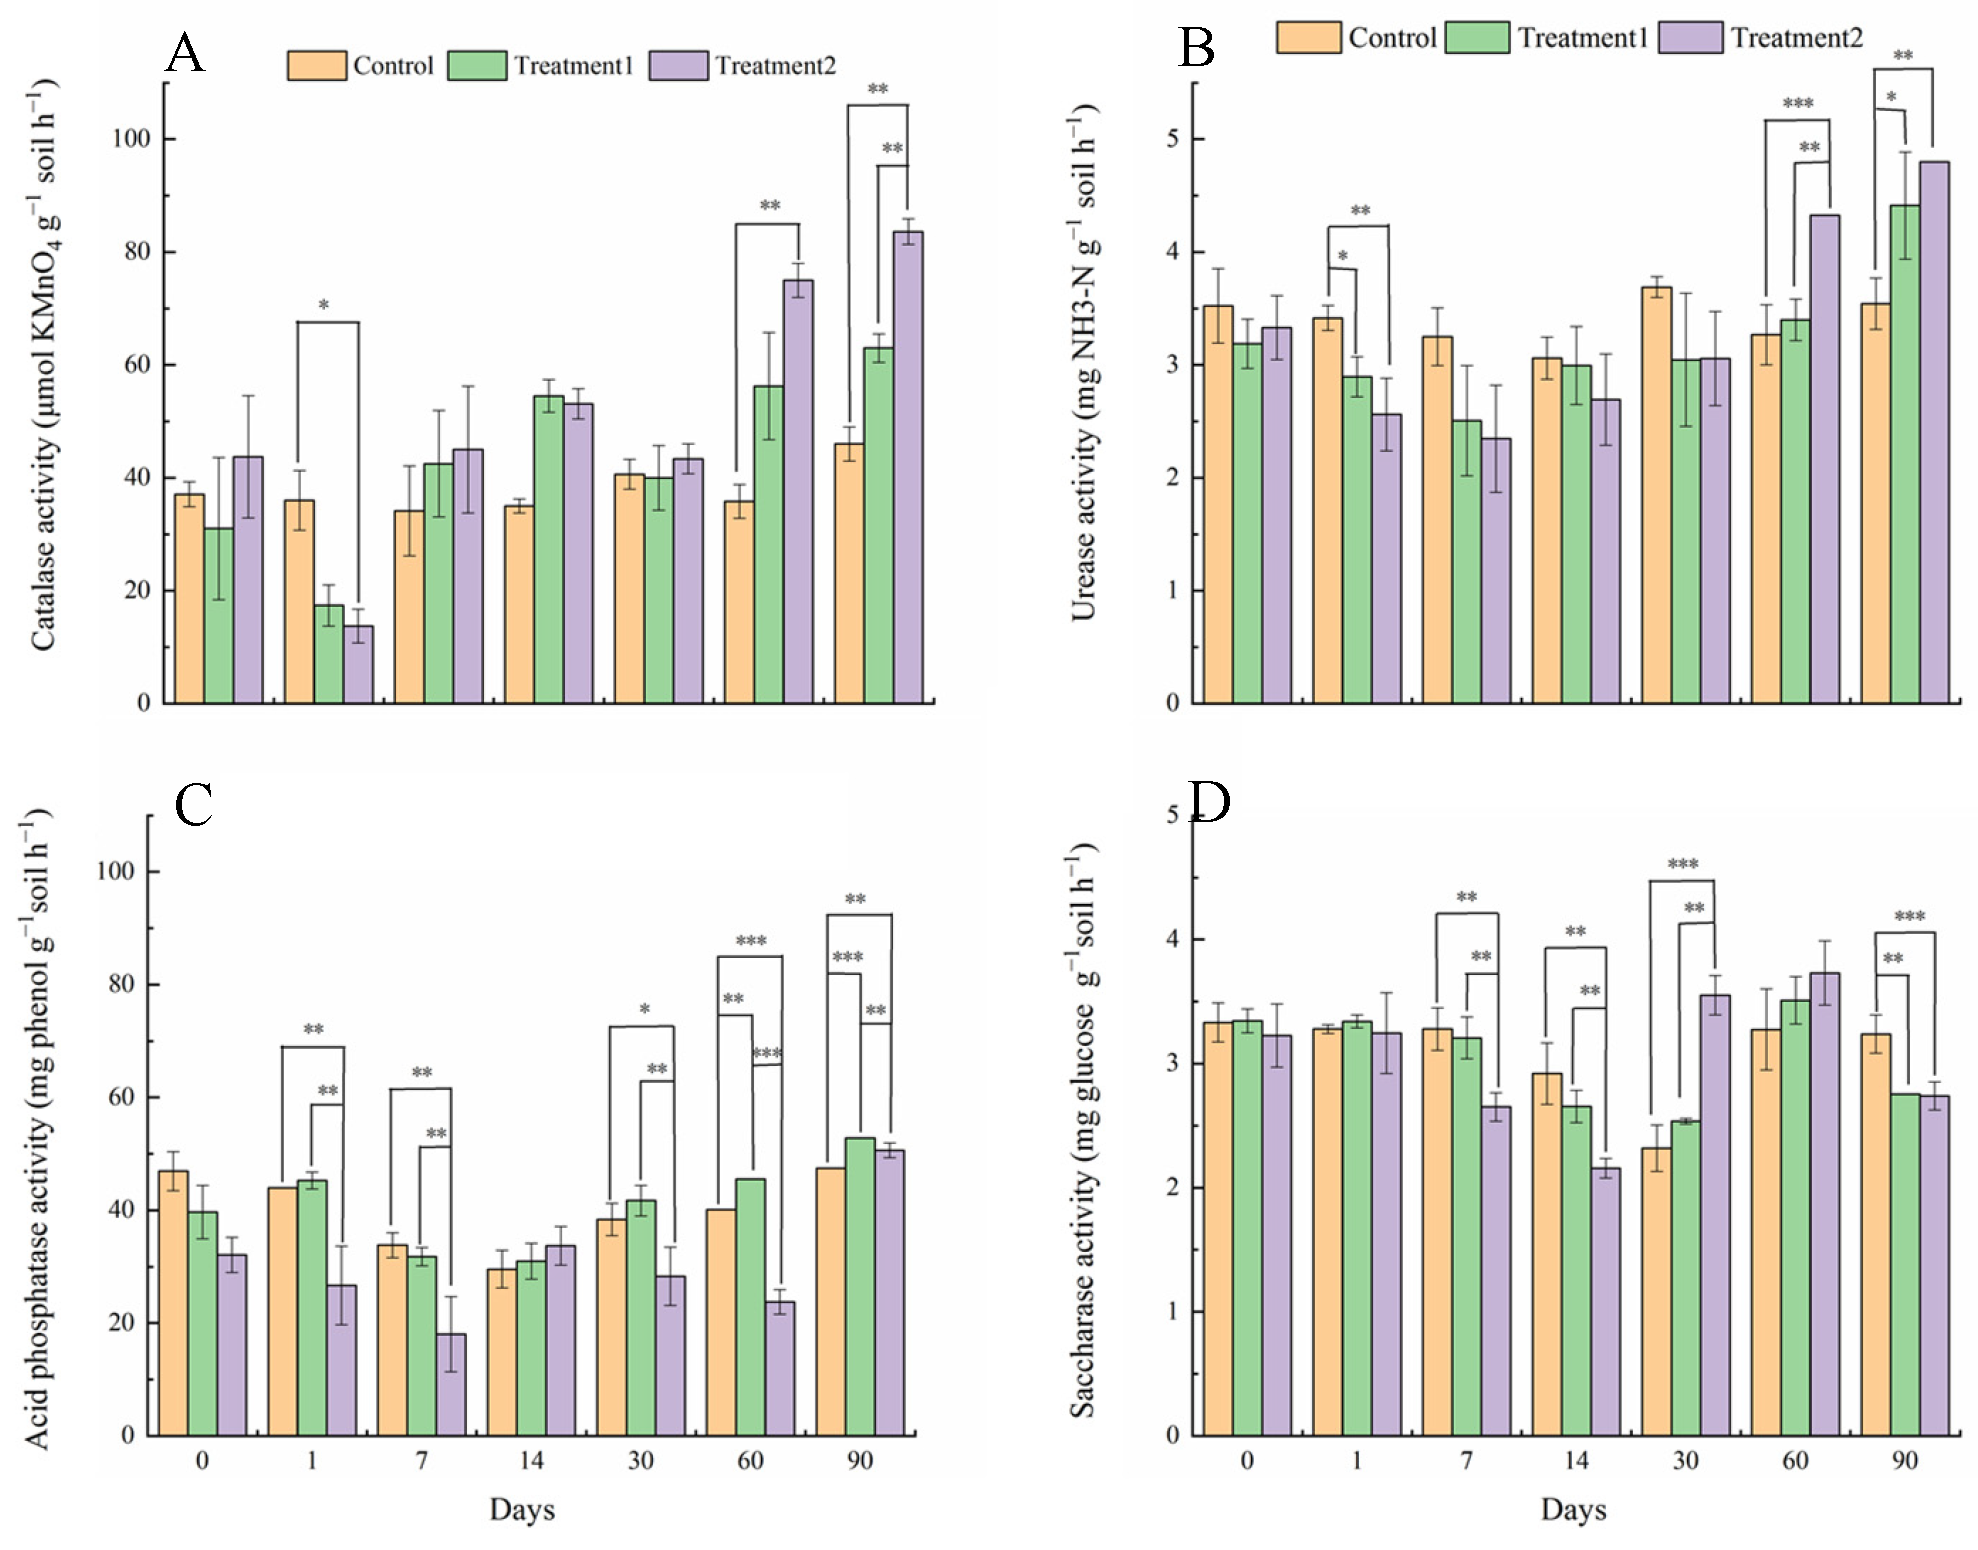
3.2. Soil Enzyme Activities: Catalase, Urease, Saccharase, Acid Phosphatase

On the first day of the application of fomesafen, the catalase activity in the group subjected to twice the recommended level decreased (0.01 < p < 0.05). By day 7, the catalase activity in the treated group had returned to the level measured before the fomesafen treatment. On day 60, the catalase activity in the group subjected to twice the recommended level increased significantly (0.001 < p < 0.01). On day 90, the catalase activity in the groups subjected to the recommended usage level and twice the recommended usage level was significantly higher than in the control group (0.001 < p < 0.01). Compared with before spraying, the activity of the catalase in either group increased 2.0 times and 1.9 times, respectively (Figure 2A). The experimental results show that the catalase activity was inhibited more severely by the application of twice the recommended level of fomesafen than by that of the recommended usage, but the recovery time was shorter.
On the first day of the application of fomesafen, the urease activities in the recommended usage and twice the recommended usage groups were significantly reduced compared to the control group (0.001 < p < 0.05). From day 30 to day 60, the urease activity of the group treated with fomesafen returned to the level before treatment. On day 60, the urease activity in the group subjected to twice the recommended level was significantly higher than in the recommended usage group and the control group (0.001 < p < 0.01). On day 90, the urease activities in the recommended usage and twice the recommended usage groups were significantly increased compared to the control group (0.001 < p < 0.05). Compared with before spraying, the urease activity increased by 38.44% and 44.06%, respectively, in either group (Figure 2B). The results show that the inhibition of the urease activity was more obvious at twice the recommended level than that at the recommended level, but the urease activity recovered faster at twice the recommended level.
At the initial stage of the application of fomesafen, the effect of twice the recommended level on the inhibition of acid phosphatase activity was significantly higher than that of applying the recommended level. In the first 60 days, the activity of acid phosphatase in the group subjected to twice the recommended level was significantly lower than in the recommended usage group and the control group (0.001 < p < 0.01). On day 60, the acid phosphatase activity in the recommended usage group returned to the level measured before the fomesafen treatment, and was significantly increased compared to the control group (0.001 < p < 0.001) and extremely significantly increased compared to the group subjected to double the recommended level (p < 0.001). From day 60 to day 90, the acid phosphatase activity in the group subjected to twice the recommended usage returned to the initial level before spraying, which was significantly higher than that of the control group (0.001 < p < 0.0l). However, the acid phosphatase activity in the group subjected to twice the recommended usage was still significantly lower than that in the recommended usage group (0.001 < p < 0.0l) (Figure 2C). It took longer for the acid phosphatase activity to recover following the application of twice the recommended level.
On day 7, the saccharase activity in the group subjected to twice the recommended usage was significantly decreased compared to the recommended usage group and the control group (0.001 < p < 0.01), and this lasted until the 14th day. At 30 days, the saccharase activity in the group subjected to twice the recommended level returned to the initial level of that before spraying, and was significantly increased compared with the control group (p < 0.001) and the recommended usage group (0.001 < p < 0.001). With the changes in time and season, the saccharase activity of the control group and the recommended usage group also began to increase, and on day 90, the saccharase activity of the control group was significantly increased compared to the recommended level and twice the recommended level groups (Figure 2D).

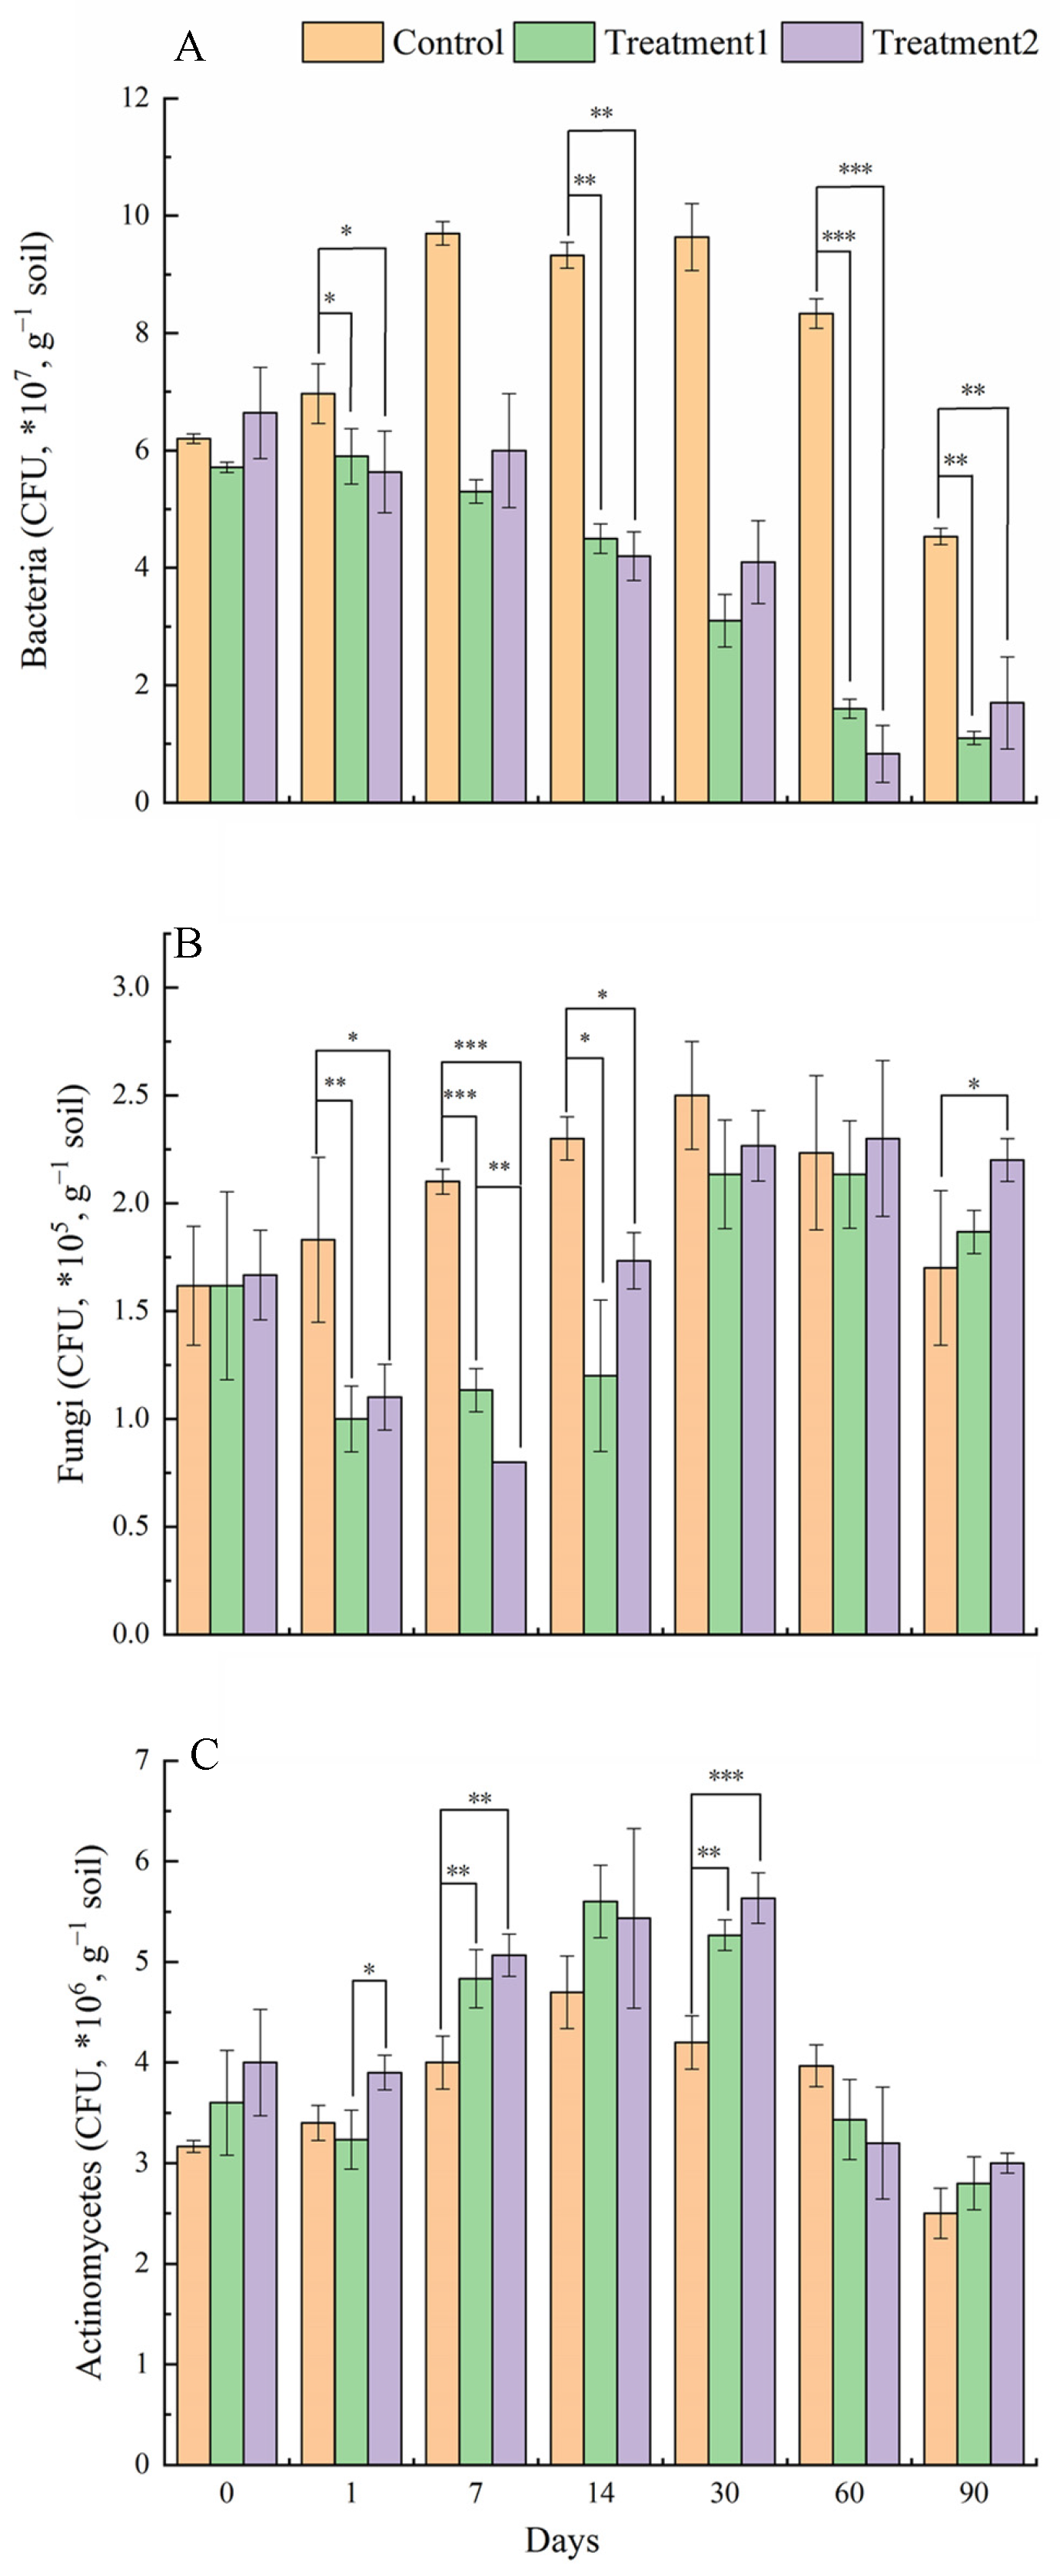
3.3. Soil Culturable Microbes’ Biomass: Bacteria, Fungi and Actinobacteria

The bacterial biomass in the control group fluctuated with the season. The application of fomesafen had an obvious inhibitory effect on the bacterial biomass. From day 1 of the application, the bacterial biomasses of the recommended usage and twice the recommended usage groups were lower than those of the control group (0.01 < p < 0.05). The inhibition effect increased continuously with time. On day 60, the bacterial biomass levels of the recommended usage and twice the recommended usage groups were significantly lower than those of the control group (p < 0.001), and the bacterial biomass of the twice the recommended usage group was the lowest, accounting for 12.54% of the initial bacterial biomass at the time of spraying. On day 90, the bacterial biomass of the twice the recommended usage group began to recover, but the bacterial biomass of the recommended usage group was the lowest, accounting for 19.26% of the initial bacterial biomass at the time of spraying, and the bacterial biomass of the control group decreased with seasonal changes. However, the bacterial biomass levels of the recommended usage group and the twice the recommended usage group were still significantly lower than those of the control group (0.001 < p < 0.01) (Figure 3A). The experimental results show that the inhibitory effect of applying twice the recommended level of fomesafen on the bacterial biomass was more significant than that of applying the recommended level, and the bacterial biomass could not be restored within 90 days.
The application of fomesafen had an obvious inhibitory effect on the fungal biomass in the early stages. From the first day of the fomesafen application, the fungal biomass levels of the recommended usage group and the twice the recommended usage group were significantly lower than those of the control group (0.001 < p < 0.05). The inhibition effect was the most obvious on day 7, at which point the fungal biomass levels of the recommended usage group and the twice the recommended usage group were significantly different from those of the control group (p < 0.001), accounting for 48.00% of the initial fungal biomass at the time of spraying, and there was a significant difference in the fungal biomass between the recommended level group and the twice the recommended level group (0.001 < p < 0.01). The fungal biomass levels of the recommended usage group and the twice the recommended usage group began to recover gradually from the 14th day, but there was still a difference between the recommended usage group and the control group (0.01 < p < 0.05). On day 90, the fungal biomass levels of the recommended usage group and the twice the recommended usage group were higher than those of the control group, and the fungal biomass of the twice the recommended usage group was different from that of the control group (0.01 < p < 0.05) (Figure 3B). The experimental results show that the application of twice the recommended level of fomesafen has a greater inhibitory effect on fungal biomass, but it can also stimulate the recovery of fungal biomass.
The actinomycete biomass in the control group fluctuated with the season. On day 1 after application, the actinomycete biomass levels of the recommended usage group and the twice the recommended usage group decreased compared with the initial level at the spraying stage, but remained higher than those in the control group, and there was a significant difference between the two groups (0.01 < p < 0.05). On day 7, the biomass of actinomycetes treated with fomesafen began to recover, and then increased significantly compared with the control group (0.001 < p < 0.01). The actinomycete biomass increased continuously over the following period, and on day 30, the actinomycete biomass level of the twice the commended usage group was significantly different from that of the control group (p < 0.001). Subsequently, the actinomycete biomass levels of the recommended usage group, the twice the recommended usage group and the control group may have begun to gradually decrease with the season, but the actinomycete biomass level of the fomesafen treatment group was similar to that of the control group. No significant difference was seen (p > 0.05) (Figure 3C). The experimental results show that the application of the recommended level of fomesafen had a more obvious inhibitory effect on the biomass of actinomycetes, but this recovered more quickly.

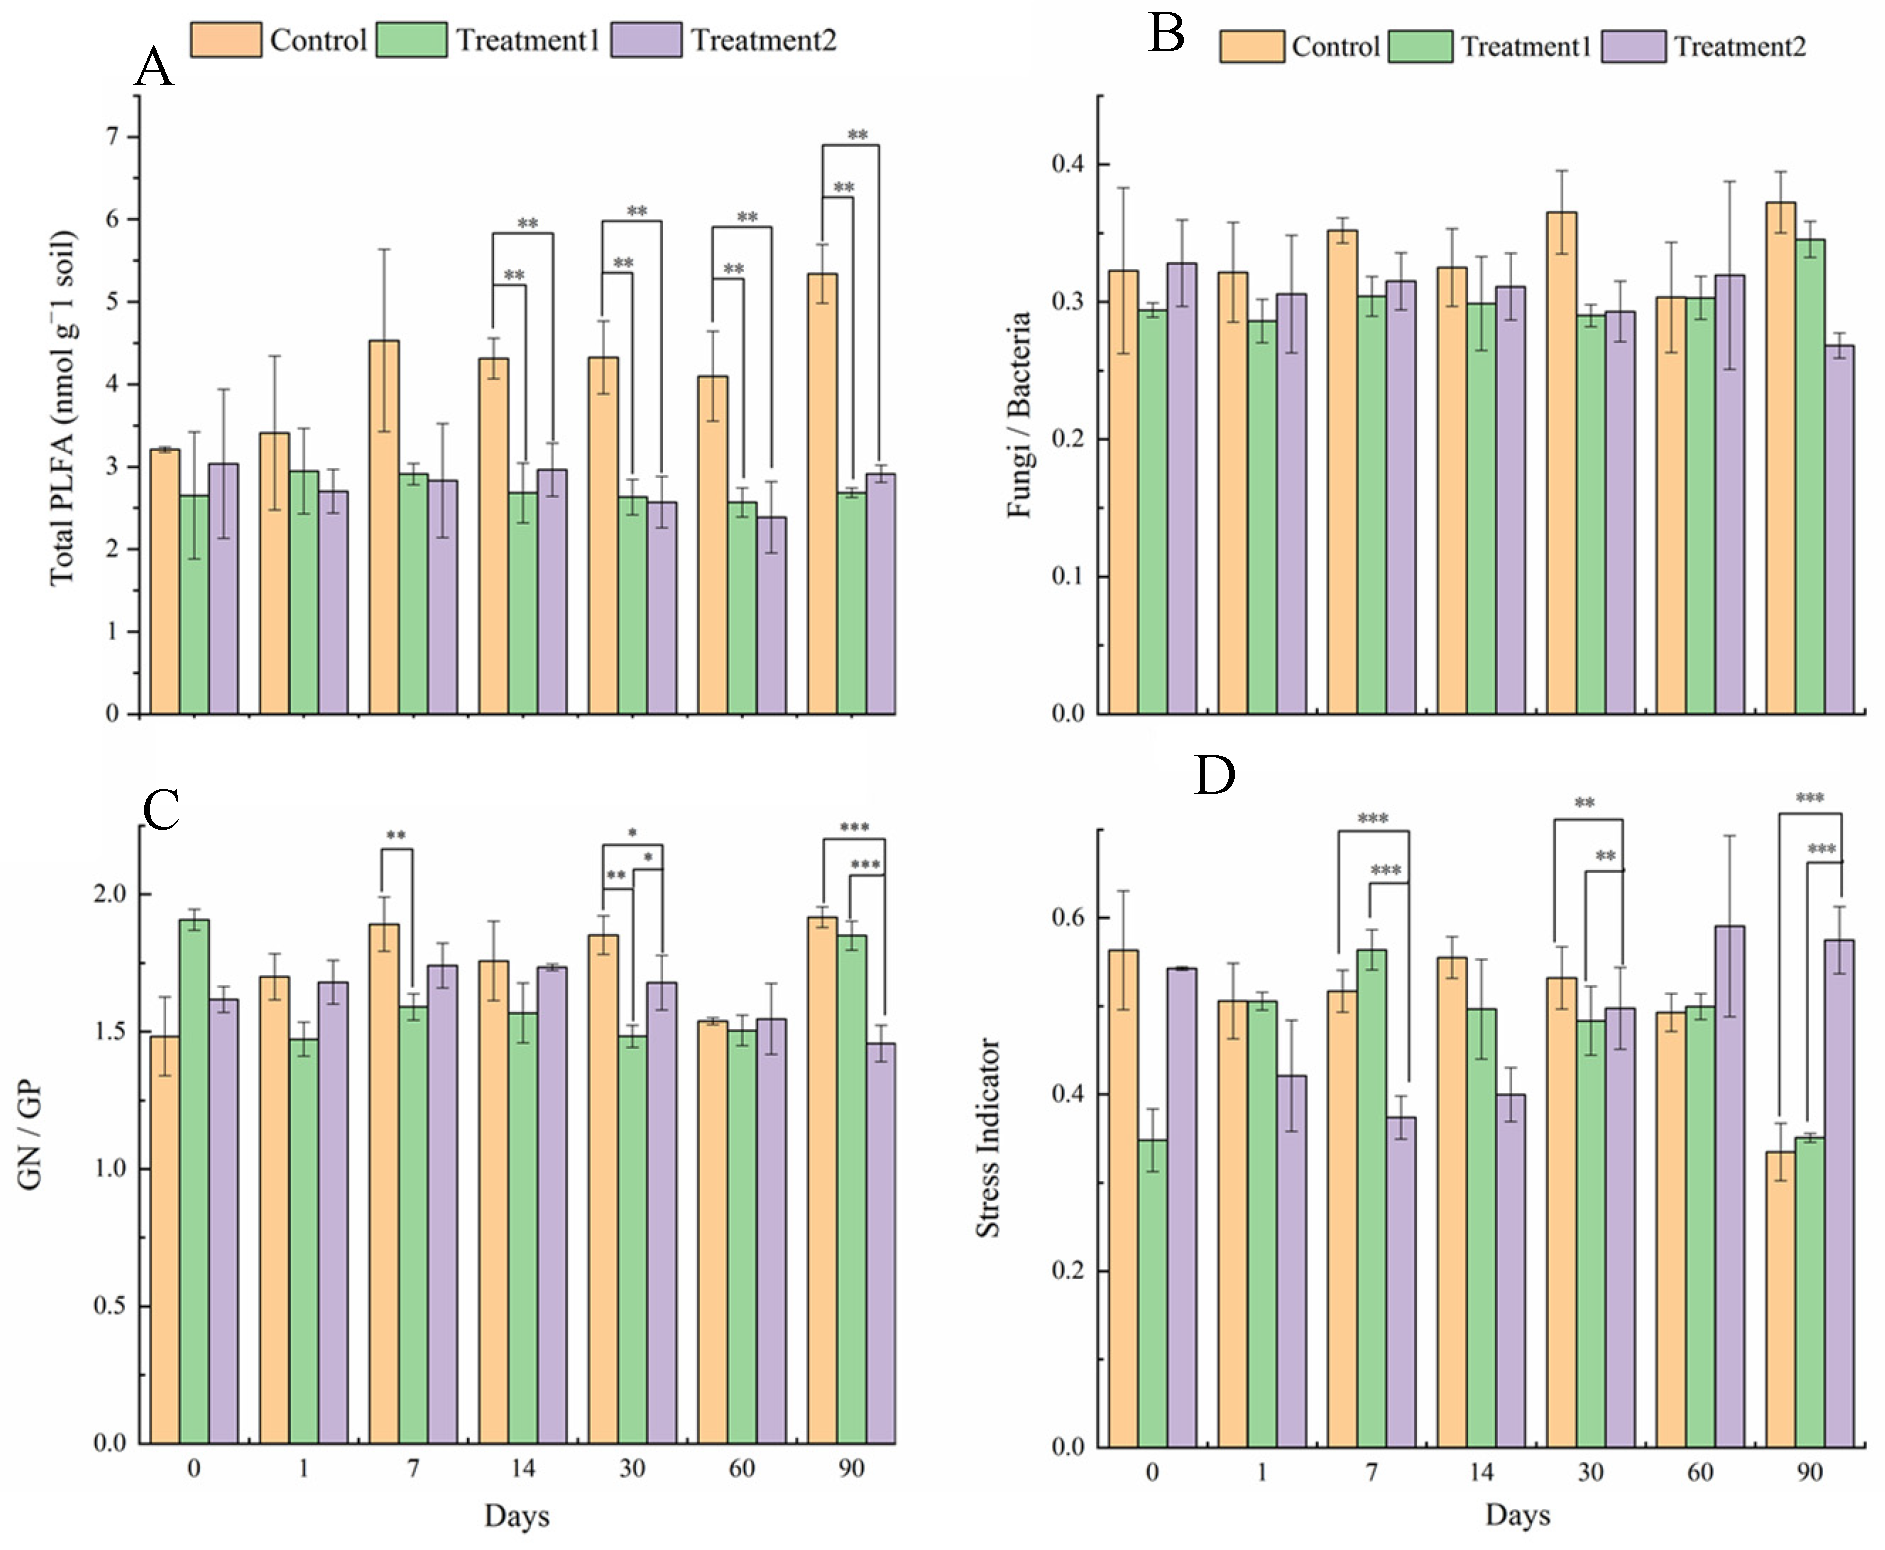
3.4. Soil PLFA Analysis and Microbial Community Structure Reflected by PLFA Patterns

There was no significant inhibitory effect on the total PLFA in the initial stage of the application of fomesafen, and there was no significant difference in the total PLFA content between the fomesafen treatment group and the control group (p > 0.05). On the 14th day of spraying, the total PLFA contents in the recommended usage group and the twice the recommended usage group were significantly different from those of the control group (0.001 < p < 0.01). This inhibitory effect persisted, and the total PLFA of the fomesafen-treated group remained significantly different from that of the control group at day 90 (0.001 < p < 0.01). However, there was no difference in the total PLFA between the recommended usage group and the twice the recommended usage group (p > 0.05) (Figure 4A).
The ratio of fungi to bacteria in soil is used to characterize the relative change in fungal and bacterial content in soil microecology; the higher the ratio, the more stable the soil microecological environment. Although the application of fomesafen did not significantly affect the ratio of fungi to bacteria between the two control groups (p > 0.05) (Figure 4B), the quantities of culturable microbial fungi and bacteria changed to different degrees. As a result of the application of fomesafen, the soil ecological environment was made unstable.
On the seventh day after the administration of fomesafen, the ratio of GN/GP in the recommended usage group was significantly different from that in the control group. On day 30, the ratio of GN/GP in the recommended usage group and the twice the recommended usage group was lower than that in the control group, and the ratio of GN/GP in the recommended usage group was the lowest, which was significantly different from that in the control group (0.001 < p < 0.05). On day 90, the lowest ratio of GN/GP in the twice the recommended usage group was significantly different from that in both the control group and the recommended usage group (p < 0.001) (Figure 4C). The results show that soil microorganisms can adapt to external stress more quickly when the recommended level of fomesafen is applied than when twice the recommended level is applied; however, after 90 days of remediation, the soil subjected to twice the recommended level showed stronger resistance.
On day 7, compared with the control group, the stress indicators in the recommended level group increased, and those in the twice the recommended level group decreased significantly (p < 0.001). After 90 days of application, the stress indicators in the twice the recommended level group increased significantly (p < 0.001) (Figure 4D). The experimental results show that the effects of using the recommended level of fomesafen on soil microbial stress take hold earlier, the soil’s microbial recovery takes place more quickly, and the time of influence is shorter, while the stress effect of using twice the recommended level on soil microorganisms occurs later, and soil recovery may take longer.

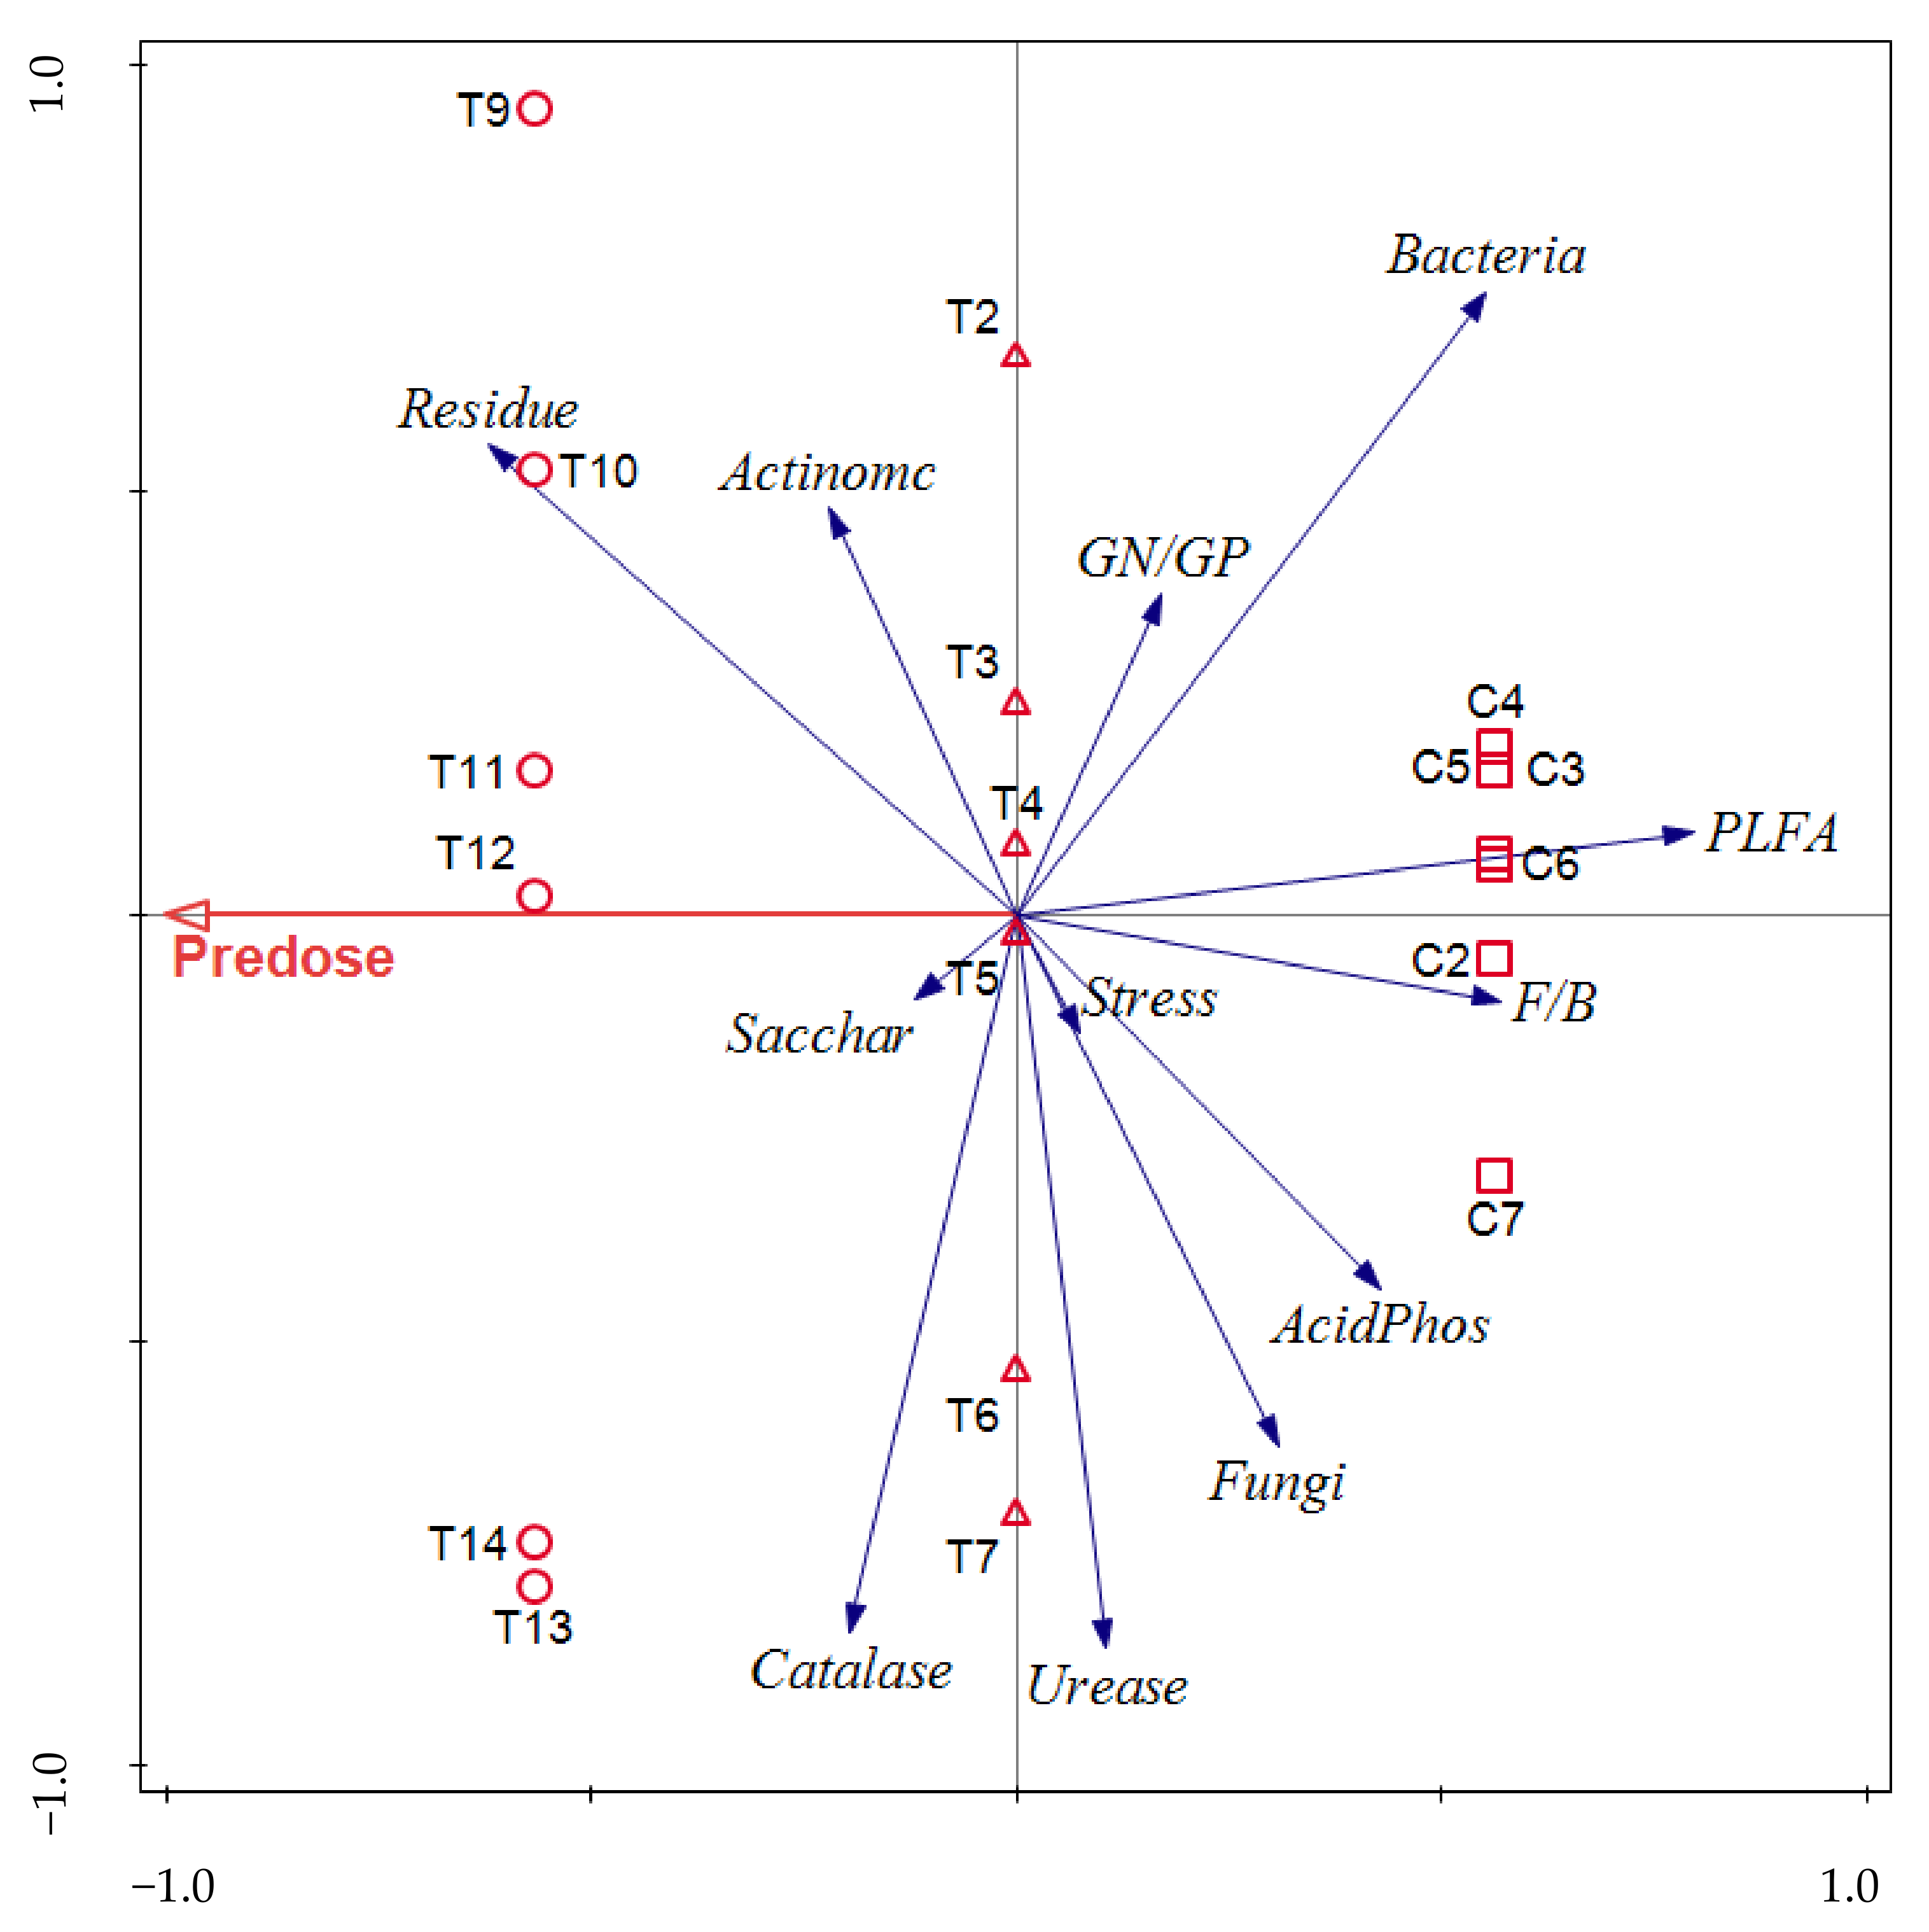
3.5. Correlation between Soil Microbial Community Composition and Environmental Factors

An RDA analysis of applying the recommended level and applying twice the recommended level of the fomesafen showed that the cumulative interpretation rate of the first axis was 23.62%, that of the second axis was 43.92%, and that of the two axes was 67.54% (Figure 5). There were differences between the recommended usage group, the twice the recommended usage group, and the control group when sampling at six time points after the application of fomesafen. Among these, fomesafen residue, actinomycetes, sucrase and catalase were all positively correlated with the initial stage of fomesafen spraying, and the correlation order was as follows: pesticide residue > actinomycetes > catalase > sucrase. Urease, acid phosphatase, fungi, bacteria, total PLFA, soil pressure, fungi/bacteria (F/B) ratio and GN/GP ratio were negatively correlated with the initial stage of fomesafen spraying, and the correlation order was as follows: soil pressure > GN/GP > urease > fungi > acid phosphatase > bacteria > F/B > total PLFA.
The Pearson correlation analysis (Table 2) showed that the stage of the initial application of fomesafen was negatively correlated with acid phosphatase, bacterial biomass, total PLFA and fungi/bacteria, and positively correlated with fomesafen residues and catalase in the soil. Except for the initial spraying stage, the change in fomesafen residue in the soil was negatively correlated with bacterial biomass, fungal biomass, total PLFA, fungi/bacteria ratio and GN/GP ratio, and positively correlated with soil catalase. The analyses of the soil microbial community and soil enzyme activity show that the soil urease activity was negatively correlated with bacterial biomass and actinomycete biomass, and positively correlated with fungal biomass. Soil sucrase and acid phosphatase were negatively correlated with actinomycetes biomass. Catalase was negatively correlated with bacterial biomass, actinomycete biomass and GN/GP.

4. Discussion

4.1. Soil Fomesafen Residue Dynamics

When the recommended level was applied in the field, the effect on weed control was not good. According to traditional farming concepts, we used twice the recommended level so as to improve the efficacy of the herbicides. After application, the change in the levels of herbicide residues in the soil over time adhered to the decreasing law of approximate negative exponential function. In this study, the half-life of the recommended usage level of fomesafen was 18.14 days, while the half-life of twice the recommended usage level was 10.91 days. This result is different from that of Langfang, Hebei province and Gongzhuling, Jilin province [3,10]. Therefore, variations in soil’s physical and chemical properties and microbial communities may explain the differences we observed. In this study, the difference in half-life between the recommended usage and twice the recommended usage may be related to the difference between the initial usage levels and the changes in the soil microbial community structure.

4.2. Effect of Fomesafen on Soil Enzyme Activities

As an important soil enzyme, the activity levels of catalase can be used not only to reflect the level of activity in the soil, but also to characterize the condition of the soil as a result of external factors [22]. Urease is one of the main enzymes in soil, and urease activity directly affects the utilization of urea [5]. Acidic soil phosphatase was selected as a marker in our study because the soil was acidic, and soil phosphatase is involved in the phosphorus metabolism that converts organophosphates into forms that can be utilized by plants. Therefore, phosphatase activity reflects the level of available phosphorus in the soil. Saccharase is an invertase that converts sucrose—which cannot be directly absorbed and utilized by plants and microbes—into glucose and fructose. Therefore, saccharase activity is undoubtedly an important indicator of soil fertility [4].
Therefore, whether using the recommended level or twice the recommended level, there was a strong correlation between the four soil enzymes and the residue of fomesafen. This may be because, in the case of high residual concentrations, fomesafen can inhibit the growth of microorganisms and reduce the secretion of corresponding enzymes. However, with the natural degradation of fomesafen in soil, the low residual concentration can be a carbon and nitrogen source for the growth of some microorganisms, which leads to increases in the corresponding enzyme activities of the microbial biomass.
During the 90-day experimental period, the sucrase activity of the treatment group could not significantly recover in relation to the control group, even when the concentration of the residue was reduced due to natural degradation in the later stage. This may be because fomesafen in this concentration range inhibits the growth of microorganisms that secrete glucosidase, reduces the number of microorganisms and reduces the secretion of corresponding enzymes. When fomesafen was applied, it inhibited the activities of catalase, acid phosphatase and urease to a certain extent, but in the later stage of the experiment, the activities of the three enzymes were all increased, which is consistent with the results of previous studies [11,17,23].

4.3. Effect of Fomesafen on the Biomass of Culturable Bacteria, Fungi, and Actinomycetes in Soil

Soil microorganisms constitute an important part of the soil ecosystem. Soil microbes and enzymes participate jointly in the metabolism and transformation of matter and energy in the soil, and are of great importance to the maintaining of soil health. Regardless of what chemical fertilizers, chemical pesticides or herbicides are applied to the soil, external factors can change the soil microbial communities and soil ecological environment [24].
Bacteria represent the largest component of the microbial community. The vast majority of these bacteria are heterotrophic and beneficial in a field. In the soil ecosystem, bacteria play an important role in the material flow and energy transfer. Therefore, when the soil is stimulated by external factors, changes in the quantity of soil bacteria can be used to characterize soil health [25]. A wide variety of fungal species play an important role in the soil ecosystem. Fungi also play an important role in the growth of plants and the decomposition and utilization of organic substances. As a result, the evaluation of fungi is often used to characterize soil health. The number of actinomycetes in the soil did not exceed the number of bacteria and fungi, although the distribution range was very wide. Actinomycetes play an important role in material transformations in soil microecology, as well as in energy transfers and in providing nutrition to the cells [26].
In conclusion, during the 90-day experimental period, there were no significant differences in the biomass levels of bacteria and actinomycetes between the recommended usage group and the twice the recommended usage group, but there was a significant difference in the level of fungi. Compared with the application of the recommended level, the inhibitory effect of applying twice the recommended level on the biomass of fungi and bacteria was stronger, and the quantity fluctuated more, which may be due to the greater concentration of fomesafen at the initial spraying stage and the greater inhibitory effect on microbial enzymes. The microbial biomass was shown to be related to microbial activity, with released carbohydrates as the main source of energy. After the application of fomesafen, the rhizosphere microbial community in the soybean field became more sensitive to chemicals. The microbial biomass decreased significantly. With the gradual degradation of the fomesafen, this change in concentration may lead to the excessive production of organic compounds, resulting in an increase in microbial biomass [27].

4.4. Soil PLFA Analysis and Microbial Community Structure Reflected by PLFA Patterns

Phospholipids are an important component of biological membranes. Almost all living cell membranes contain phospholipids, and they account for approximately 5% of the dry cell weight. The lipids and levels of PLFAs vary between different microbes. The phospholipid content and the structure of the microorganism are characteristic of the species, and can be used as biomarkers of particular microorganisms [19]. Based on this principal, we analyzed the PLFAs to determine changes in the soil microbial community’s structure. The total quantity of PLFAs in the soil reflects the total quantity of microorganisms in the soil. Thus, the changes in the PLFA content in the soil following the application of fomesafen can also be used to evaluate the changes in the total quantity of microbes in the soil [28].
The ratio of fungi to bacteria is used to characterize relative changes in the fungal and bacterial contents in soil microecology. Changes in the contents of fungi and bacteria, caused by external influences, can lead to changes in the ratio of fungi to bacteria [29].
Because of their unique cell structure, Gram-positive bacteria are more resistant to external damage than Gram-negative bacteria, and are therefore relatively stable in a soil system. The GN/GP ratio can be used to characterize changes in the soil microbial communities [30]. Environmental pressure refers mainly to chemical pollution, drought, sudden changes in temperature, hunger, high oxygen levels and extremes of pH, all of which affect the physiological status of the microorganisms. On the other hand, microbes adapt to environmental stress by improving their physiological conditions. The pressure index in the soil is used to characterize the strength of the influence of external factors on the soil microbial community. An increase in the pressure index denotes the influence of external factors.
During the 90-day experiment, the total PLFA content of the treatment group treated with the recommended usage and twice the recommended usage of fomesafen was significantly lower than that of the control group, and the ratio of GN/GP decreased significantly compared with the recommended usage. At the same time, the soil pressure increased significantly, and there was no significant difference in the fungi/bacteria ratio between the treatment group and the control group. The results show that the residue of a high concentration of fomesafen reduced the quantities of PLFA, GP and GN, but increased microbial stress. Fomesafen thus had a certain effect on the soil microecological environment, significantly changing the microbial community structure in the soil and stimulating the soil’s ability to resist external stress, which was consistent with the results of the soil enzyme activity, culturable microorganisms and PLFA comparisons.

5. Conclusions

This study clearly shows that the inhibitory effect of using twice the recommended level of fomesafen on four soil enzymes was significantly higher than that of using the recommended level. After the 90th day of the experiment, the four soil enzymes in the treatment group returned to their initial level at the time of spraying, and all activity levels except for that of saccharase were significantly higher than those in the control group. The inhibitory effect of the recommended level on actinomycetes was higher than that of twice the recommended usage, but the inhibitory effect of twice the recommended usage on fungal and bacterial biomass was higher than that of the recommended usage, and it was also seen that the fungal biomass could return more quickly to its level before the application of the fomesafen, and increased significantly. Applying twice the recommended level and the recommended level had no significant effects on the total PLFA or fungal/bacterial ratio, but after 90 days of recovery, the GN/GP ratio decreased significantly, and soil pressure increased significantly under twice the recommended usage. In summary, the effect of fomesafen on soil microbial community structure was more obvious when using twice the recommended level.

Author Contributions

Conceptualization, F.Y and W.Z.; methodology, F.Y. and W.Z.; software, Y.W. (Yanbo Wang) and Y.H.; validation, Y.W. (Yanbo Wang), Y.H., Y.W. (Yuning Wei), C.L., H.F. and F.Y.; formal analysis Y.W. (Yanbo Wang), Y.H. and Y.W. (Yuning Wei); investigation C.L. and Y.H.; resources, C.L. and Y.H.; data curation, Y.W. (Yanbo Wang), Y.H. and Y.W. (Yuning Wei); writing—original draft preparation, Y.H. and H.F.; writing—review and editing, Y.W. (Yanbo Wang), H.F. and W.Z.; visualization, Y.W. (Yanbo Wang) and M.Y.; supervision, C.L.; project administration, Y.H. and C.L.; funding acquisition, F.Y. All authors have read and agreed to the published version of the manuscript.

Funding

This research was funded by National Key Research and Development Program of China (grant number 2017YFD0201703), Heilongjiang Natural Science Project (grant number C2018051), and University Nursing Program for Young Scholars with Creative Talents in Heilongjiang Province (grant number UNPYSCT 2017119).

Institutional Review Board Statement

Not applicable.

Data Availability Statement

The data presented in this study are openly available on FigShare at doi:10.6084/m9.figshare.15034866.

Conflicts of Interest

The authors declare no conflict of interest.

References

  1. Everman, W.J.; Clewis, S.B.; York, A.C.; Wilcut, J.W. Weed control and yield with flumioxazin, fomesafen, and s-metolachlor systems for glufosinate-resistant cotton residual weed management. Weed Technol. 2017, 23, 391–397. [Google Scholar] [CrossRef]
  2. Costa, A.I.G.; Queiroz, M.E.L.R.; Neves, A.; De Assis, R.C.; Dos Soares, C.E.S.; Da Silva, A.A.; D’Antonino, L.; De Oliveira, A.F.; Bellato, C.R. Mobility and persistence of the herbicide fomesafen in soils cultivated with bean plants using SLE/LTP and HPLC/DAD. Environ. Sci. Pollut. Res. 2015, 22, 3457–3466. [Google Scholar] [CrossRef]
  3. Williams, M.M.; Nelson, R.L. Vegetable soybean tolerance to bentazon, fomesafen, imazamox, linuron, and sulfentrazone. Weed Technol. 2014, 28, 601–607. [Google Scholar] [CrossRef]
  4. Zhang, W.; Zhang, M.; An, S.; Xiong, B.; Li, H.; Cui, C.Z.; Lin, K.F. Ecotoxicological effects of decabromodiphenyl ether and cadmium contamination on soil microbes and enzymes. Ecotoxicol. Environ. Saf. 2012, 82, 71–79. [Google Scholar] [CrossRef]
  5. Guo, H.; Yao, J.; Cai, M.; Qian, Y.; Yue, G.; Richnow, H.H.; Blake, R.E.; Doni, S.; Ceccanti, B. Effects of petroleum contamination on soil microbial numbers, metabolic activity and urease activity. Chemosphere 2012, 87, 1273–1280. [Google Scholar] [CrossRef]
  6. Di Prima, S.; Rodrigo-Comino, J.; Novara, A.; Iovino, M.; Pirastru, M.; Keesstra, S.; Cerdà, A. Soil physical quality of citrus orchards under tillage, herbicide, and organic managements. Pedosphere 2018, 28, 463–477. [Google Scholar] [CrossRef] [Green Version]
  7. Chen, Y.; Liang, T.; Wu, K.; Wang, Y. Shifts in indigenous microbial communities during the anaerobic degradation of pentachlo rophenol in upland and paddy soils from southern China. Environ. Sci. Pollut. Res. Int. 2016, 23, 1–11. [Google Scholar] [CrossRef]
  8. Han, D.; Yan, D.; Wang, Q.; Fang, W.; Wang, X.; Li, J.; Ouyang, C.B.; Cao, A.C. Effects of soil type, temperature, moisture, appli cation dose, fertilizer and organic amendments on chemical and bio-degradation of dimethyl disulfide in soil. Land Degrad. Dev. 2018, 29, 4282–4290. [Google Scholar] [CrossRef]
  9. Guo, J.F.; Lu, Y.T.; Sun, J.H. Residue dynamics of fomesafen in peanut and soybean fields. Agroenviron. Prot. 2000, 2, 82–84. (In Chinese) [Google Scholar]
  10. Hu, H.Y.; Zhou, H.; Zhou, S.X.; Li, Z.J.; Wei, C.J.; Yu, Y.; Hay, A.G. Fomesafen impacts bacterial communities and enzyme activities in the rhizosphere. Environ. Pollut. 2019, 253, 302–311. [Google Scholar] [CrossRef]
  11. Zhang, Q.M.; Zhu, L.S.; Wang, J.; Xie, H.; Wang, J.H.; Wang, F.H.; Sun, F.X. Effects of fomesafen on soil enzyme activity, microbial population, and bacterial community composition. Environ. Monit. Assess. 2014, 186, 2801–2812. [Google Scholar] [CrossRef]
  12. IUSS Working Group WRB. World Reference Base for Soil Resources 2014 International Soil Classification System for Naming Soils and Creating Legends for Soil Maps; Food and Agriculture Organization of the United Nations: Rome, Italy, 2014. [Google Scholar]
  13. Ma, M.; Baskin, C.C.; Yu, K. Wetland drying indirectly influences plant community and seed bank diversity through soil pH. Ecol. Indic. 2017, 80, 186–195. [Google Scholar] [CrossRef]
  14. Paramasivam, M.; Banerjee, H. Simultaneous determination of flubendiamide its metabolite desiodo flubendiamide residues in cabbage, tomato and pigeon pea by HPLC. Bull. Environ. Contam. Toxicol. 2011, 7, 452–456. [Google Scholar] [CrossRef]
  15. Che, J.M.; Liu, B.; Zhang, Y.; Hu, G.P.; Huang, Q.L.; Chen, Z.D.; Weng, B.Q. Effect of edible fungus residue on the ecological characteristics of microorganism fatty acids in the rhizosphere of ryegrass. Pratacultural Sci. 2016, 33, 1942–1950. (In Chinese) [Google Scholar]
  16. Lyu, N.; Yin, F.H.; Chen, Y.; Gao, Z.J.; Liu, Y.; Shi, L. Effects of elevated atmospheric CO2 and nitrogen application on cotton biomass, nitrogen utilization and soil urease activity. Ying Yong Sheng Tai Xue Bao 2015, 26, 3337–3344. (In Chinese) [Google Scholar]
  17. Zhang, W.; Lin, K.F.; Yang, S.S.; Zhang, M. Enzyme activities in perfluorooctanoic acid (PFOA)-polluted soils. Pedosphere 2013, 23, 120–127. [Google Scholar] [CrossRef]
  18. Li, Y.L.; Chen, J.X.; Zhou, Y.T.; Yang, Z.; Wang, Y.G.; Zhang, J.Y.; Yue, L. Diversity and distribution of culturable microbial communities of semiarid desert steppe and cultivated land in Northwestern China. J. Agric. Resour. Environ. 2016, 33, 244–252. (In Chinese) [Google Scholar]
  19. Chen, L.H.; Zheng, J.H.; Shao, X.H. Effects of Trichoderma harzianum T83 on Suaeda salsa L. in coastal saline soil. Ecol. Eng. 2016, 91, 58–64. [Google Scholar] [CrossRef]
  20. Liu, N.; Zhou, J.; Han, L. Characterization of lignocellulosic compositions’ degradation during chicken manure composting with added biochar by phospholipid fatty acid (PLFA) and correlation analysis. Sci. Total Environ. 2017, 586, 1003–1011. [Google Scholar] [CrossRef]
  21. Guo, Y.L.; Song, W.F.; Li, M. Environmental behavior of herbicide fomesafen in different soil types. J. Ecol. 2014, 33, 429–432. (In Chinese) [Google Scholar]
  22. Sebiomo, A.; Ogundero, V.W.; Bankole, S.A. Effect of four herbicide on microbial population, soil organic matter and dehydrogenase activity. Afr. J. Biotechnol. 2011, 10, 770–778. [Google Scholar]
  23. Zhou, S.X.; Wei, C.J.; Hu, H.Y.; Gao, B.J.; Li, Z.J. Effect of fomesafen on soil microorganism and enzyme activity in soybean rhizosphere and its degradation in rhizosphere. J. Plant Nutr. Fertil. 2018, 24, 203–211. (In Chinese) [Google Scholar]
  24. Lahl, K.; Unger, C.; Emmerling, C.; Broer, I.; Thiele-Bruhn, S. Response of soil microorganisms and enzyme activities on the decomposition of transgenic cyanophycin producing potatoes during overwintering in soil. Eur. J. Soil Biol. 2012, 53, 1–10. [Google Scholar] [CrossRef]
  25. Jacoby, R.; Peukert, M.; Succurro, A.; Koprivova, A.; Kopriva, S. The role of soil microorganisms in plant mineral nutrition—Current knowledge and future directions. Front. Plant Sci. 2017, 8, 1617. [Google Scholar] [CrossRef] [Green Version]
  26. Shentu, J.L.; He, Z.L.; Zeng, Y.Y.; He, S.Y.; Du, S.T.; Shen, D.S. Microbial biomass and PLFA profile changes in rhizosphere of pakchoi (Brassica chinensis L.) as affected by external cadmium loading. Pedosphere 2014, 24, 553–562. [Google Scholar] [CrossRef]
  27. Piutti, S.; Marchand, A.-L.; Lagacherie, B.; Martin-Laurent, F.; Soulas, G. Effect of cropping cycles and repeated herbicide applications on the degradation of diclofop-methyl, bentazone, diuron, isoproturon and pendimethalin in soil. Pest Manag. Sci. 2002, 58, 303–312. [Google Scholar] [CrossRef]
  28. Wu, X.H.; Zhang, Y.; Du, P.Q.; Xu, J.; Dong, F.S.; Liu, X.G.; Zheng, Y.Q. Impact of fomesafen on the soil microbial communities in soybean fields in Northeastern China. Ecotoxicol. Environ. Saf. 2018, 148, 169–176. [Google Scholar] [CrossRef] [PubMed]
  29. Banks, M.L.; Kennedy, A.C.; Kremer, R.J.; Eivazi, F. Soil microbial community response to surfactants and herbicide in two soils. Appl. Soil Ecol. 2014, 74, 12–20. [Google Scholar] [CrossRef]
  30. Patrnogic, J.; Leclerc, V. The serine protease homolog spheroide is involved in sensing of pathogenic Gram-positive bacteria. PLoS ONE 2017, 12, e0188339. [Google Scholar]
Figure 1. Residue dynamics of fomesafen at the recommended level and double the recommended level. Note: the red arrow indicates the date of application. Data represent the mean ± SD of each soil sample selected at each time point. The UNIANOVA with Duncan’s homogeneity test was per-formed between the control group and the treatment group, with different letters indicating sig-nificance.
Diversity 13 00340 g001
Figure 2. Effect of fomesafen on enzyme activities in soil in the recommended level and twice recommended level group. Data represent the mean ± SD of each soil sample selected at each time point. *, ** and *** represent a significance level of 0.05, 0.01 and 0.001, respectively; without an * indicates that the difference was not significant according to UNIANOVA with Duncan’s homogeneity test. Treatment 1 represents the recommended usage group, and Treatment 2 represents the twice the recommended usage group. (A) Catalase; (B) urease; (C) acid phosphatase; (D) saccharase.
Diversity 13 00340 g002
Figure 3. Effect of fomesafen on the biomass of bacteria, fungi, and actinomycetes in soil in the recommended usage and the twice recommended usage groups. Data represent the mean ± SD of each soil sample selected at each time point. *, ** and *** represent the significance levels of 0.05, 0.01 and 0.001, respectively; without * indicates that the difference is not significant according to UNIANOVA with Duncan’s homogeneity test. Treatment 1 represents the recommended usage group, and Treatment 2 represents the twice the recommended usage group. (A) Bacteria; (B) fungi; (C) actinomycetes.
Diversity 13 00340 g003
Figure 4. Effect of fomesafen on soil PLFA in the recommended usage and double the recommended usage groups. Data represent the mean ± SD of each soil sample selected at each time point. *, ** and *** represent the significance levels of 0.05, 0.01 and 0.001, respectively; without * indicates that the difference is not significant according to UNIANOVA with Duncan’s homogeneity test. Treatment 1 represent the recommended usage group, and Treatment 2 represents the twice the recommended usage group. (A) Total PLFA; (B) fungi/bacteria; (C) GN/GP; (D) stress indicator.
Diversity 13 00340 g004
Figure 5. RDA analysis was carried out to determine the effects of the initial stage of fomesafen application on microbial community structure. □: Control; △: the recommended usage; ○: double the recommended usage.
Diversity 13 00340 g005
Table 1. Kinetic parameters of fomesafen degradation in soil applied at the recommended level and twice the recommended level.
TreatmentC0(mg·kg−1)AkR2t1/2 (d)
Recommended level3.753.29070.0310.724818.14
Twice the recommended level7.504.27450.0120.792210.91
Fomesafen degradation in the soil was described by the single exponential model C(t) = A × e(−k × t), where C(t) = fomesafen concentration at time t, A = constants, k = dissipation kinetic constants for the first component of the curve, and t = half-life or time required for a 50% dissipation of the initial fomesafen concentration (C0). R2 = correlation coefficient for the first component of the curve.
Table 2. Pearson coefficients of correlation between soil PLFA index and environmental factors.
Catalase
Activity
Acid Phosphatase
Activity
Urease
Activity
Saccharase ActivityBacteriaFungiActinomycetesFungi/BacteriaGN/GPStress IndicatorTotal PLFAResiduePredose
Catalase activity1
Acid phosphatase activity0.1571
Urease activity0.600 **0.518 **1
Saccharase activity−0.11−0.0670.0641
Bacteria−0.552 **−0.247−0.436 **−0.1031
Fungi0.2150.1830.435 **−0.046−0.0681
Actinomycetes−0.117−0.447 **−0.391 **−0.448 **0.257−0.1311
Fungi/Bacteria−0.0540.020.133−0.1070.244−0.068−0.0771
GN/GP−0.329 *−0.197−0.096−0.0140.306 *−0.1630.0320.490 **1
Stress Indicator0.068−0.10.114−0.0140.0880.2620.079−0.396 **−0.471 **1
Total PLFA−0.2090.132−0.047−0.0250.579 **0.272 *−0.0160.317 *0.275 *−0.0921
Residue0.273 *−0.001−0.075−0.198−0.321 *−0.2340.344 *−0.448 **−0.369 **0.123−0.362 **1
Predose0.323 *−0.358**−0.0420.116−0.589 **−0.1720.146−0.392 **−0.119−0.065−0.665 **0.559 **1
** and * mean the correlation was significant at the level of 0.01 and 0.05 (double-tailed), respectively. Each value represents the mean ± SD (n = 3).
Publisher’s Note: MDPI stays neutral with regard to jurisdictional claims in published maps and institutional affiliations.

