Article

Characterizing the Influence of Domestic Cats on Birds with Wildlife Rehabilitation Center Data

by
K. Grace Demezas
and
W. Douglas Robinson
*
Department of Fisheries, Wildlife and Conservation Sciences, 104 Nash Hall, Oregon State University, Corvallis, OR 97331, USA
*
Author to whom correspondence should be addressed.
Diversity 2021, 13(7), 322; https://doi.org/10.3390/d13070322
Submission received: 18 June 2021 / Revised: 11 July 2021 / Accepted: 13 July 2021 / Published: 15 July 2021
(This article belongs to the Special Issue 2021 Feature Papers by Diversity’s Editorial Board Members)

Abstract

:
Depredation of birds by domestic cats is hypothesized to be one of many significant sources of mortality leading to global bird declines. Direct observations are relatively rarely documented compared with large numbers of birds hypothesized to be killed or wounded by cats. We analyzed data from two wildlife rehabilitation centers located in Salem and Grants Pass, Oregon USA, to understand which species were most likely to interact with a cat, and the species traits associated with cat interactions and habitats (urban vs. rural) of rescued birds. Interaction with a cat was the second-most commonly reported cause of admission, representing 12.3% of 6345 admissions. Half to two-thirds of birds were rescued from cats in urban settings and were usually species foraging on or near the ground. Most species were admitted to rehabilitation centers in direct proportion to their regional abundance. An exception was the absence of common species weighing less than 70 g, which we conclude is an effect of sampling bias. We conclude that cats most often interact with regionally common near-ground-dwelling bird species in both urban and rural habitats. Wildlife rehabilitation centers can provide valuable sources of data for cat-bird interactions but potential sources of uncertainty and bias in their data need to be considered carefully.

1. Introduction

Recent reports of widespread declines of birds have elevated interest in sources of mortality, particularly anthropogenic sources [1,2]. Depredation by domestic cats (Felis catus), both owned and feral, and collisions with buildings, automobiles, wind turbines, and power lines and communication towers have been identified as the primary mortality sources [3]. Domestic cats kill an estimated 1.3 to 4.0 billion birds each year in the United States alone [4], a number much greater than the estimated 365 to 988 million birds killed from collisions with buildings [5], or 89 million to 340 million killed in collisions with automobiles [6].
Despite the apparent impacts of cats on bird populations, important information gaps continue to present challenges. For example, several basic aspects of cat–bird interactions remain poorly described in most locations, including which species are most often captured, the role of habitat differences in determining the identities of species attacked by cats, whether year-round residents or migrants are more susceptible, and which other traits (e.g., body size, propensity to forage on or near the ground) might influence the likelihood of birds being attacked by cats [7]. Furthermore, current estimates of cat-influenced mortality have been generated from a number of variables difficult to measure accurately. Statistics estimating proportions of households owning cats, rates at which owned cats are allowed outdoors and the rate at which free-roaming cats kill wildlife have all been estimated but exhibit high levels of uncertainty in most studies [4].
Estimating feral (non-owned) cat population sizes is also difficult [4]. Rates of cat ownership are often measured via survey [8], which may bias estimates if cat owners are more or less likely to respond to such surveys [9,10]. Cat owners’ likelihood to allow their cats to roam outdoors is also influenced by a complex variety of factors, such as whether the cat was adopted or found as a stray or how long the cat has lived with that owner [11]. The rate at which free-roaming cats kill wildlife has also been difficult to estimate, as cats do not bring all prey items home, so it may be common to underestimate true impact [9]. Finally, quantification of effects of feral cats requires estimates of feral cat population size [12], and the relative rates at which feral versus owned cats kill wildlife. All of these differences are further complicated by the diversity of domestic cat ownership behavior, which ranges from owned cats not allowed outdoors to cats allowed to fully access the outdoors [13]. Some of these uncertainties are being addressed using rapidly improving technology. For instance, video cameras have been used to better quantify predation by free-roaming cats without the need to retrieve prey [14]. However, data gathered from existing, perhaps under-utilized, sources may provide an efficient and more cost-effective way to gain additional information on interactions between birds and domestic cats [15,16,17,18].
Wildlife rehabilitation centers provide a relatively untapped source of data on cat–bird interactions because people regularly bring birds injured by cats into centers [19]. Such data provide information on species (and therefore traits that may predict vulnerability to cats as well), location of the cat–bird interaction, and even potential for successful rehabilitation after treatment. Although the data have limitations [20,21], their availability in coordinated databases such as WILD-ONe (Wildlife Center of Virginia, Waynesboro, Virginia, USA) and the tens of thousands of animals admitted each year provide a potentially unique source of information on cat–bird interactions [22]. For example, concerns over bird losses sometimes focus on Neotropical migratory birds, a group known to be declining overall [1]. Most Neotropical migratory species are found in rural instead of urban areas [23], so if most cats occupy urban landscapes where their owners live, then cats may interact less with sensitive Neotropical migrants than they do with common species tolerant of human modification of landscapes.
Here, we analyzed data from two wildlife rehabilitation centers in western Oregon, USA. Our objectives were to: (1) understand what proportion of birds admitted were hypothesized or known to be admitted as a result of interacting with a cat; (2) enumerate the species most commonly delivered to rehabilitation centers after interactions with cats; (3) identify traits of bird species correlated with numbers of admissions to the centers; (4) evaluate the relationship between indices of species’ abundances and the numbers of admissions; and (5) compare the sources of cat-influenced admissions across urban versus rural habitats. If admissions to wildlife rehabilitation centers reflect trends in interactions between birds and cats, the information gained from our analyses could help predict which species are most at risk from cat interactions and in what habitats, guiding conservation, management and outreach actions aimed at reducing influence of domestic cats on avian mortality.

2. Materials and Methods

2.1. Data Sources

We used data on cat–bird interactions archived in WILD-ONe, an online database for wildlife rehabilitators and researchers. We selected two Oregon wildlife rehabilitation centers included in the database for inclusion in our study. The first, Turtle Ridge Wildlife Center, is located in Salem, a city of approximately 174,000 people [24] located in Marion County. The second, Wildlife Images Rehabilitation and Education Center, is in Grants Pass, a city of approximately 37,000 people [25] in Josephine County. Both centers draw admissions of injured, presumed injured, ill and presumed orphaned animals from across urban and rural habitats generally characterized as patchworks of woodland, agricultural areas and grasslands. We used data from November, 2014, when the two centers began submitting data to WILD-ONe, through the end of 2018. We extracted data on species admitted, location of rescue, and cause of admission. We chose the two centers because of the large number of admissions, the sampling of both urban and rural habitats and our familiarity with the regional avifauna.

2.2. Determination of Cause of Admission

We focused on records of birds whose admission documentation indicated contact with a cat. In such cases, we included the record whether the contact had been directly observed or reported as suspected to have happened, the latter of which typically occurred when cats were observed in the vicinity of injured birds. Some records listed multiple potential reasons for admission. We therefore included records when another primary cause of admission was listed in documentation, but when interaction with a cat was also indicated. Finally, records indicating that the bird was rescued due to immediate danger from a cat, or suspicion thereof, were included. Additional details on admission procedures and definitions of cat interactions as a cause of admission are in Appendix A.

2.3. Identification of Locations and Habitats

We categorized the location of each cat–bird interaction as occurring in urban (including suburban and moderate to high density of dwellings and/or impermeable surface cover) or rural sites (low density of dwellings and/or impermeable surface, typically Quercus oak and Pseudotsuga fir woodlands or grasslands). All classifications were made using Google Maps (maps.google.com, accessed on 18 June 2021), with the address of the site of rescue located and placed in the center of a circle with a diameter of approximately 300 m. The dominant land cover type within each area was identified. As all classifications included only two options, whichever classification better fit greater than 50% of the visible area was used. To be conservative, we utilized such broad categories because no information to independently verify the exact locations at which injured birds were obtained was available in the wildlife rehabilitation center databases. We excluded any record for which the site of rescue was not provided or was too vague (i.e., reported at the city or county level only) to allow for classification.

2.4. Species Traits

2.4.1. Species and Species Groups

We assumed that bird species reported in the database were identified correctly, except for a few cases involving out-of-range rarities where we concluded the identification was likely incorrect. For example, a few reports of “blue jay”, unlikely to refer to the eastern North American species Blue Jay Cyanocitta cristata (see Table S1 for all scientific names), were probably misreported California Scrub-Jay Aphelocoma californica or Steller’s Jay Cyanocitta stelleri, both commonly found in western Oregon. In a few cases, we combined similarly appearing congeners into one “species group” (e.g., Sphyrapicus sapsuckers and Spinus goldfinches; Appendix A).

2.4.2. Body Mass

We included mean body mass of each species [26]. For species with sexual dimorphism or large geographic variation in mass, we selected data from the site nearest Oregon and used the smallest mean mass (e.g., male raptor masses instead of females). To focus on the subset of species likely to interact with cats as potential prey, we removed all species with an average adult mass >200 g [27,28], as well as aquatic species. A list of species and their characteristics is in Table S2.

2.4.3. Residency Status

We categorized species based on their presence in the study sites year-round (primarily non-migratory residents) or their absence in some months of the year (migratory). Some migratory species were absent during the winter (e.g., flycatchers), whereas others were absent during the summer (e.g., Varied Thrush Ixoreus naevius). We treated both as migrants. A few species could be found in very small numbers year-round (e.g., Wilson’s Snipe Gallinago delicata) but if their abundances changed dramatically owing to migration of most individuals out of the region, we treated them as migrants.

2.4.4. Aquatic or Non-Aquatic

We categorized species as primarily aquatic or non-aquatic and filtered out the aquatic species from our analyses because cats rarely attack aquatic species unless they are on land. We called ducks, geese, rails and Marsh Wren Cistothorus palustris aquatic species. Most ducks and geese are too large as adults to be attacked, but small offspring are sometimes admitted to rehabilitation centers, presumably having been attacked while on land. Because we did not know the mass of these immature individuals when admitted to rehabilitation centers, we excluded them from analyses.

2.4.5. Terrestrial or Not

Cats forage mostly on or near the ground, so we categorized each species as foraging mostly on or within 1 m of the ground versus foraging mostly well above the ground. Some individuals of nearly all species may occasionally be found on the ground, particularly fledglings.

2.4.6. Feeder Use

We also categorized species into one of two groups: those species expected to occasionally or commonly visit bird feeders versus rarely or never visiting bird feeders, based on our own experience.

2.5. Indices of Bird Abundance

We used eBird data [29] to create an index of avian abundance in the counties where birds were admitted to each rehabilitation center. Species were rank-ordered from most to least common based on the proportion of complete eBird checklists on which each species was included. Checklists were contributed by birders from 2011 through 12 November 2020 in Marion (N = 39,255 checklists; Turtle Ridge) and Josephine (N = 11,644; Wildlife Images) counties. Because of the large sample size, inclusion of multiple years, and alignment with our own experiences surveying birds in western Oregon [30], we assumed the ranks were positively correlated with abundance and we used the ranks as indices of relative abundance. Our analyses of habitat cover around recovery locations indicated birds were rarely delivered from neighboring counties. Even so, we inspected species ranked orders on eBird checklists in the counties adjacent to each center’s home county and found them to be all highly correlated (r > 0.9). To evaluate influence of potential errors in the relationships between abundance and ranked order of species occurrences on checklists, we analyzed data with both the raw ranked information from eBird and with ranks categorized into ten intervals. All results associating variables with raw rank-ordered data and categorical ranks were qualitatively similar.
We quantified differences in ranks of species in eBird lists versus in the species involved in cat-influenced admissions to the two centers. Our objective was to identify species that were under- or over-represented in the center admissions and to discover potential correlates between discrepancies in the ranks and traits, such as mass (Figure 1).

2.6. Data Analyses

We used non-parametric statistics because of uncertainty in the distributional shapes of variables, driven by occasional lack of clarity in the reliability of reported values in the rehabilitation center data and to be cautious in our use of eBird data when generating indices of relative abundance. For example, current protocols at the rehabilitation centers provide no independent checks of most information, such as species identification, confirmation of locations where birds were obtained prior to transport to rehabilitation centers, or identification of admission causes. Although we screened the data for obvious or potential errors, without independent verification of the accuracy of such data, we elected to compare ranks to discover patterns in most of the data. When comparing proportions of species obtained in urban versus rural environments, we used Chi-square tests when sample sizes permitted, and Fisher’s Exact tests when sample sizes were fewer than five individuals in each habitat type. When assessing associations with habitat types, we determined the expected values by randomly choosing locations (N = 55) from the dataset after excluding admissions noted to involve or potentially involve interaction with a cat. We assumed that if cat-interacted birds were brought to centers in proportion to admissions from all other causes, then the proportion of urban versus rural sites in the entire dataset would be the appropriate expected values. In Salem, those values were 63% urban and 37% rural, and they were similar in Grants Pass, at 68% urban and 32% rural. We assumed that each admission was an independent event. For comparisons of species ranks, we used Wilcoxon tests. All analyses were performed using JMP [31].

3. Results

Of the 6345 animals admitted to the two rehabilitation centers, birds comprised one-quarter to one-third of admissions once use of the WILD-ONe database became consistent in 2016 (Table 1). A slightly higher proportion of birds admitted came from Turtle Ridge in Salem (51.9%; N = 3293) than from Wildlife Images in Grants Pass (48.1%, N = 3052).
The top ten most frequently admitted bird species comprised 53.0% and 42.7% of the total bird admissions at Turtle Ridge and Wildlife Images, respectively. Seven species (Mallard Anas platyrynchos, European Starling Sturnus vulgaris, American Crow Corvus brachyrhynchos, California Scrub-Jay, American Robin Turdus migratorius, Eurasian Collared-Dove Streptopelia decaocto, Mourning Dove Zenaida macroura, and Red-tailed Hawk Buteo jamaicensis) were in the top ten at both centers (Table 2). Turtle Ridge, in a larger city, received more Rock Pigeons Columba livia and Vaux’s Swifts Chaetura vauxi, while Wildlife Images, in a smaller city, received more Western Screech-Owls Megascops kennicottii and Canada Geese Branta canadensis. Several of the bird species admitted were large-bodied, such as Red-tailed Hawk, frequently admitted after being struck by vehicles, and waterfowl. Although information was inconsistently recorded in the database, many waterfowl admitted were juveniles.
Birds were admitted for a wide variety of reasons, approximately one-quarter of which were undetermined (Table 3). Cat interactions accounted for the second-highest fraction of reports (12.3%), behind ‘orphaned’ and ‘behavioral stranding’, which we interpret as being synonymous (Table 3). Nearly one-quarter of admissions had unreported causes.
Turtle Ridge admitted 55 bird species after cat interactions, with 36 species (64%) having fewer than ten individuals admitted during the study period. Wildlife Images admitted 61 species; 30 (49%) had fewer than ten individuals admitted (Table S1).
Birds admitted to a wildlife rehabilitation center after interacting with a cat were generally representative of birds admitted for any cause, although species with a larger adult body mass (> 200 g) that were in the top ten most admitted species for any cause were not found on the top ten species admitted to each center after interaction with a cat (Table 4). The exception to this was the American Crow, which would be the tenth most frequently admitted species at Turtle Ridge due to interaction with a cat.

3.1. Rescue Location

The proportions of urban versus rural rescue locations for all admission records were similar between Turtle Ridge and Wildlife Images, with approximately two-thirds of admissions being reported as originating from urban locations (Table 5). Birds admitted at Turtle Ridge due to interaction with a cat were more likely than the overall average to come from urban areas than from rural areas, while at Wildlife Images, these birds were nearly equally likely to come from a rural versus urban environment. However, especially at Wildlife Images, a sufficiently high fraction (16.9%) of admissions were from unknown locations to obscure potential differences in origination habitat.
When data from both centers were combined, cat-influenced admissions appeared to be more common from urban locations (57%) than rural locations (31%) but 11% of reports did not include address information.
Proportions of urban versus rural rescue locations differed significantly from expected proportions for only a few species at each rehabilitation center (Table S3). At Turtle Ridge, California Scrub-Jays were more likely to have interactions with cats in urban areas (n = 53, χ2 = 10.91, p < 0.001), as were European Starlings (n = 27, χ2 = 10.14, p = 0.0014). American Crows tended to be more likely to come from urban areas (N = 12, Fisher’s Exact p = 0.093). At Wildlife Images, Spotted Towhees Pipilo maculatus were more likely to interact with a cat in rural areas (N = 9, Fisher’s Exact p = 0.009).

3.2. Species Traits

3.2.1. Indices of Abundance

The rank orderings of species in the bird communities based on eBird data in Marion (Turtle Ridge) and Josephine (Wildlife Images) Counties were significantly correlated (R2 = 0.424, p < 0.0001, Table S1). The rank orderings of species by frequency of cat-interacted admissions to wildlife rehabilitation centers were positively correlated to the eBird indices of abundances in both Marion (R2 = 0.303, p = 0.0406) and Josephine Counties (R2 = 0.272, p < 0.0001). Thus, species interacting with cats were admitted to rehabilitation centers directly in proportion to their indices of abundance in the counties served by each center. An important exception was the absence of several common species with small (<70 g) body mass.

3.2.2. Body Mass

We found no difference in masses among species that were admitted after interaction with a cat (N = 61) and species that were not noted to have been involved in interactions with a cat (N = 56, t = 0.77, df = 55, 
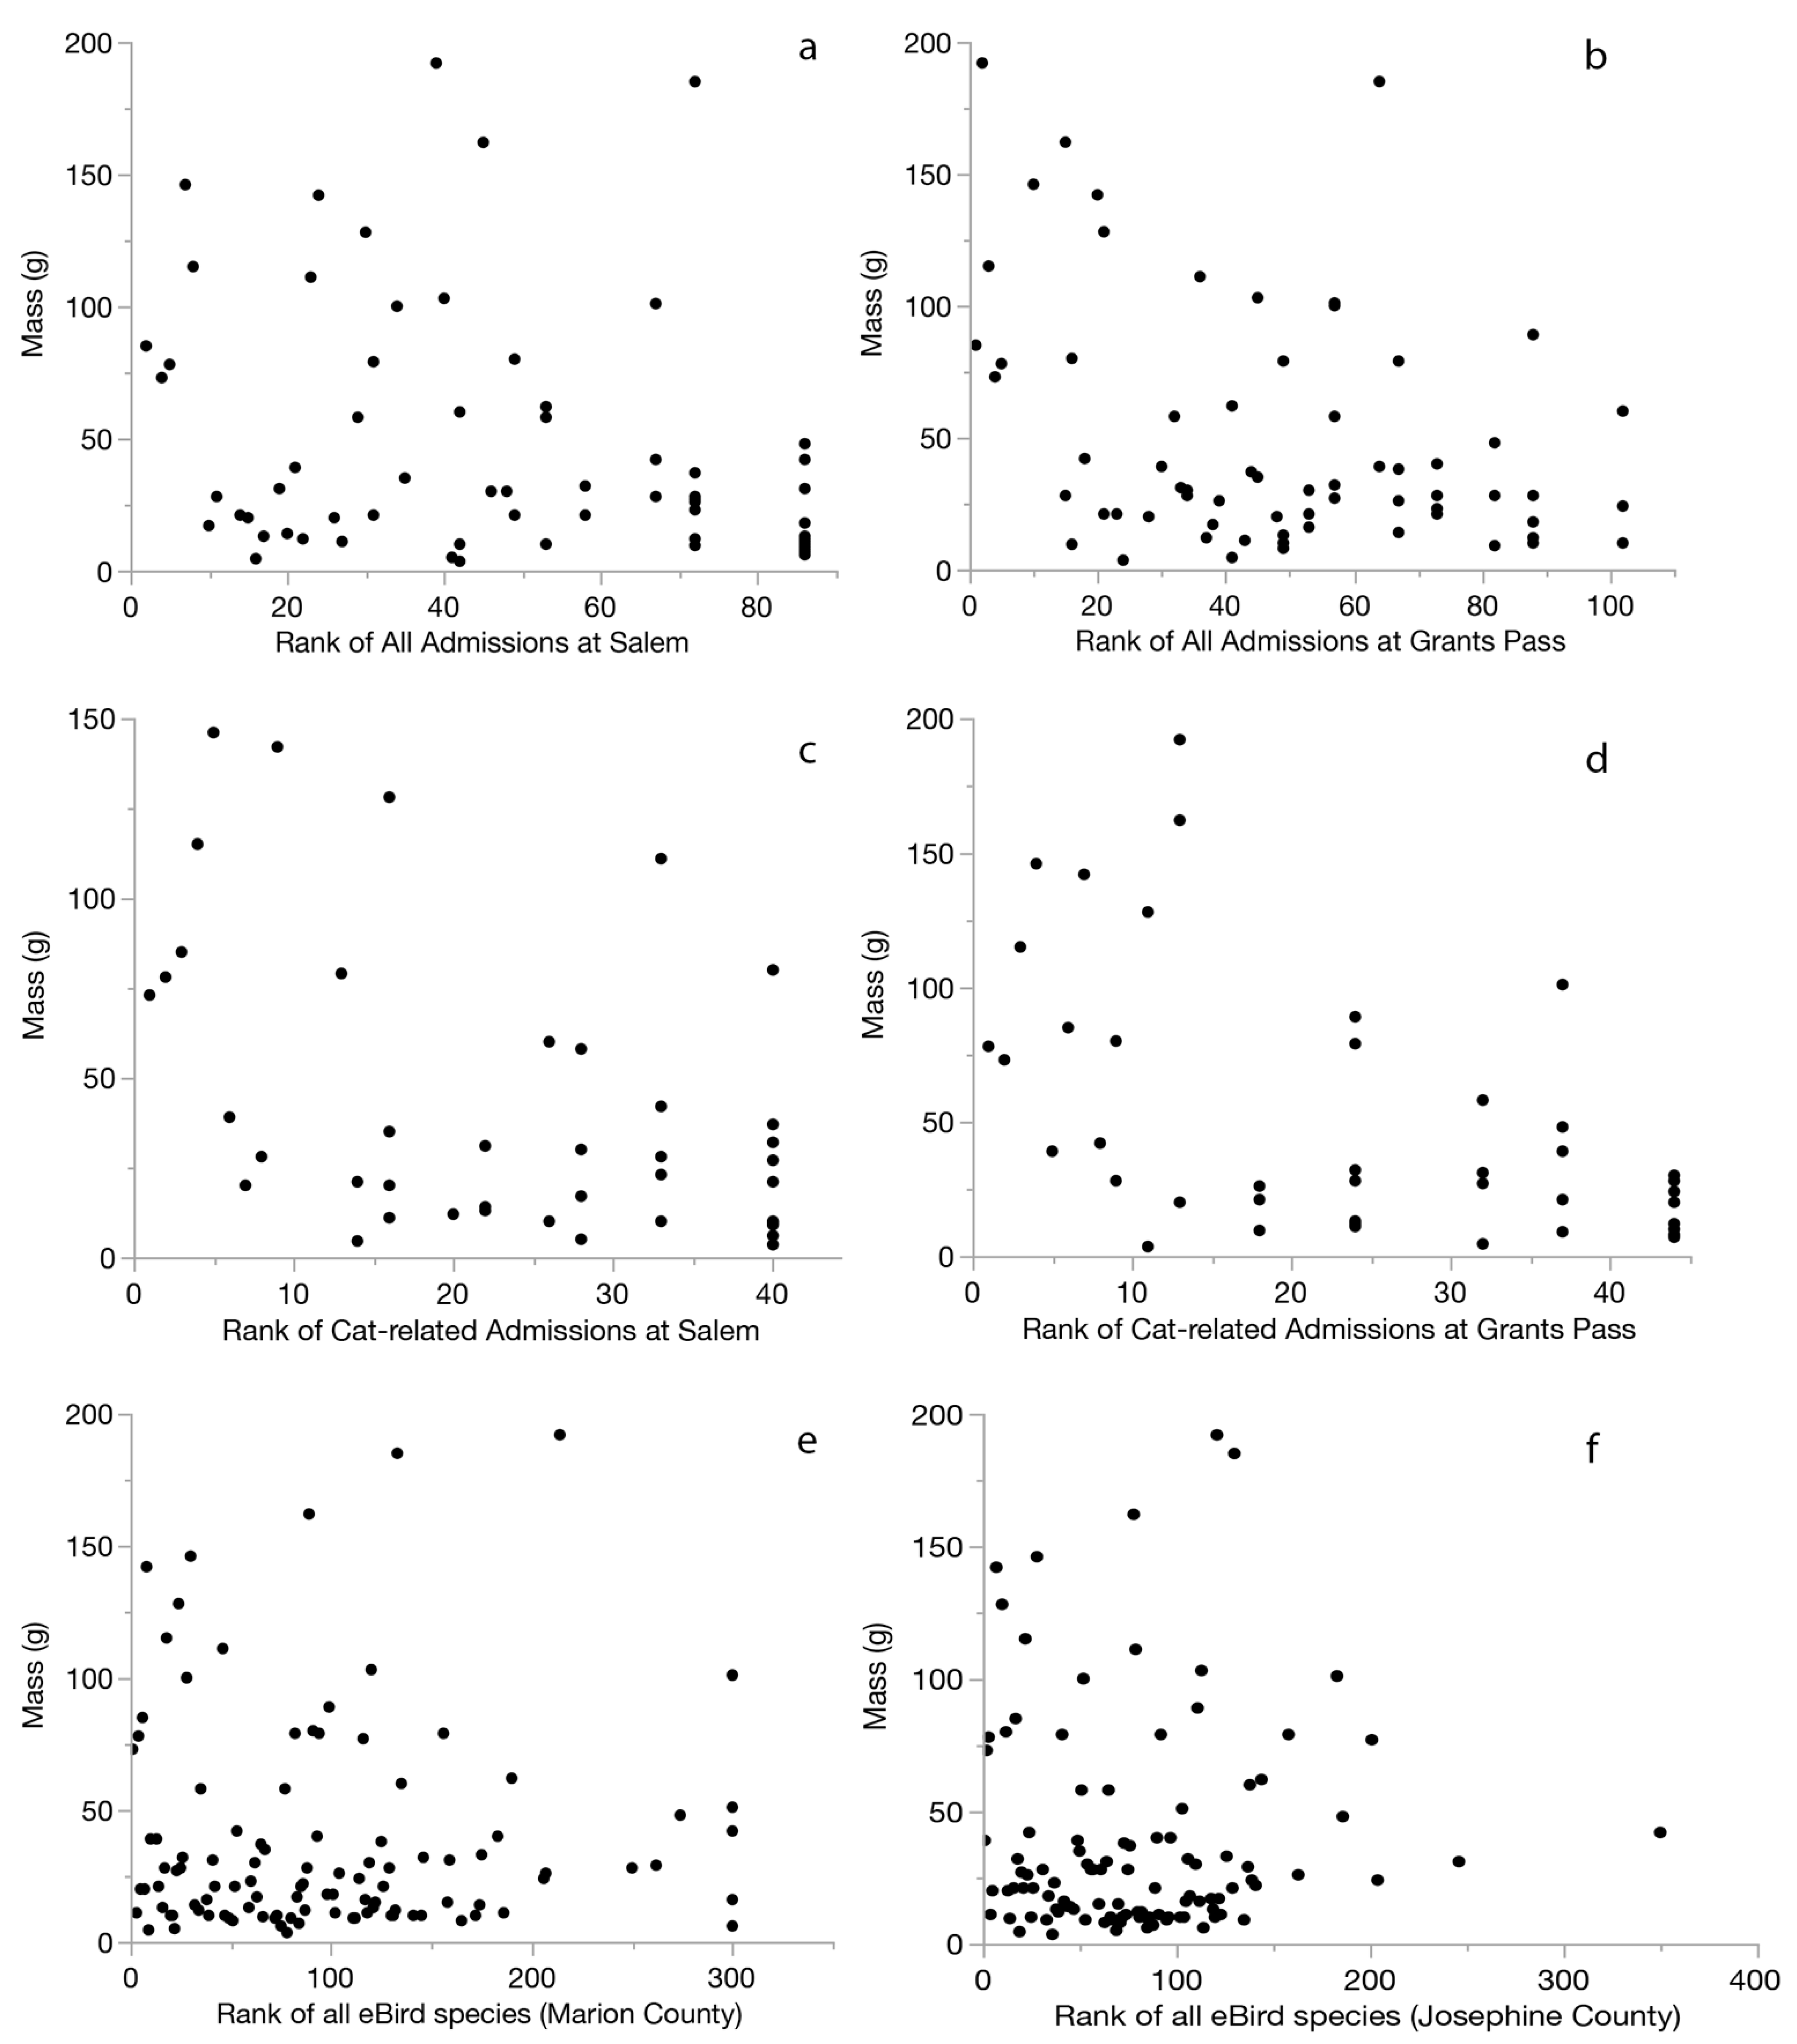
p < 0.22). The relationships between species’ mass and their rank-ordered abundances were best fit by quadratic functions (Turtle Ridge: R2 = 0.265, p < 0.0016; Wildlife Images: R2 = 0.297, p < 0.0006). At both centers, species with a higher mean adult mass were disproportionately represented among the top five species admitted after interaction with a cat (Table 4). At Turtle Ridge mass of the top five species admitted ranged from 70 to 140 g and at Wildlife Images it ranged from 70 to 150 g. The list of top ten species under 200 g admitted after interaction with a cat was also highly correlated between the centers (R2 = 0.279, p = 0.0027). Common species below 70 g were under-represented from lists of cat-related admissions at both centers.
While there was not a significant relationship between body mass and our index of eBird abundance (that is, small species are common just as often as they are uncommon) in either the Salem or Grants Pass datasets, smaller birds (less than 70 g) were less likely to be brought into wildlife rehabilitation centers for any reason (Turtle Ridge R2 = 0.104, p = 0.0073, Wildlife Images R2 = 0.191, p = 0.0373, Figure 2).

3.2.3. Feeder Use

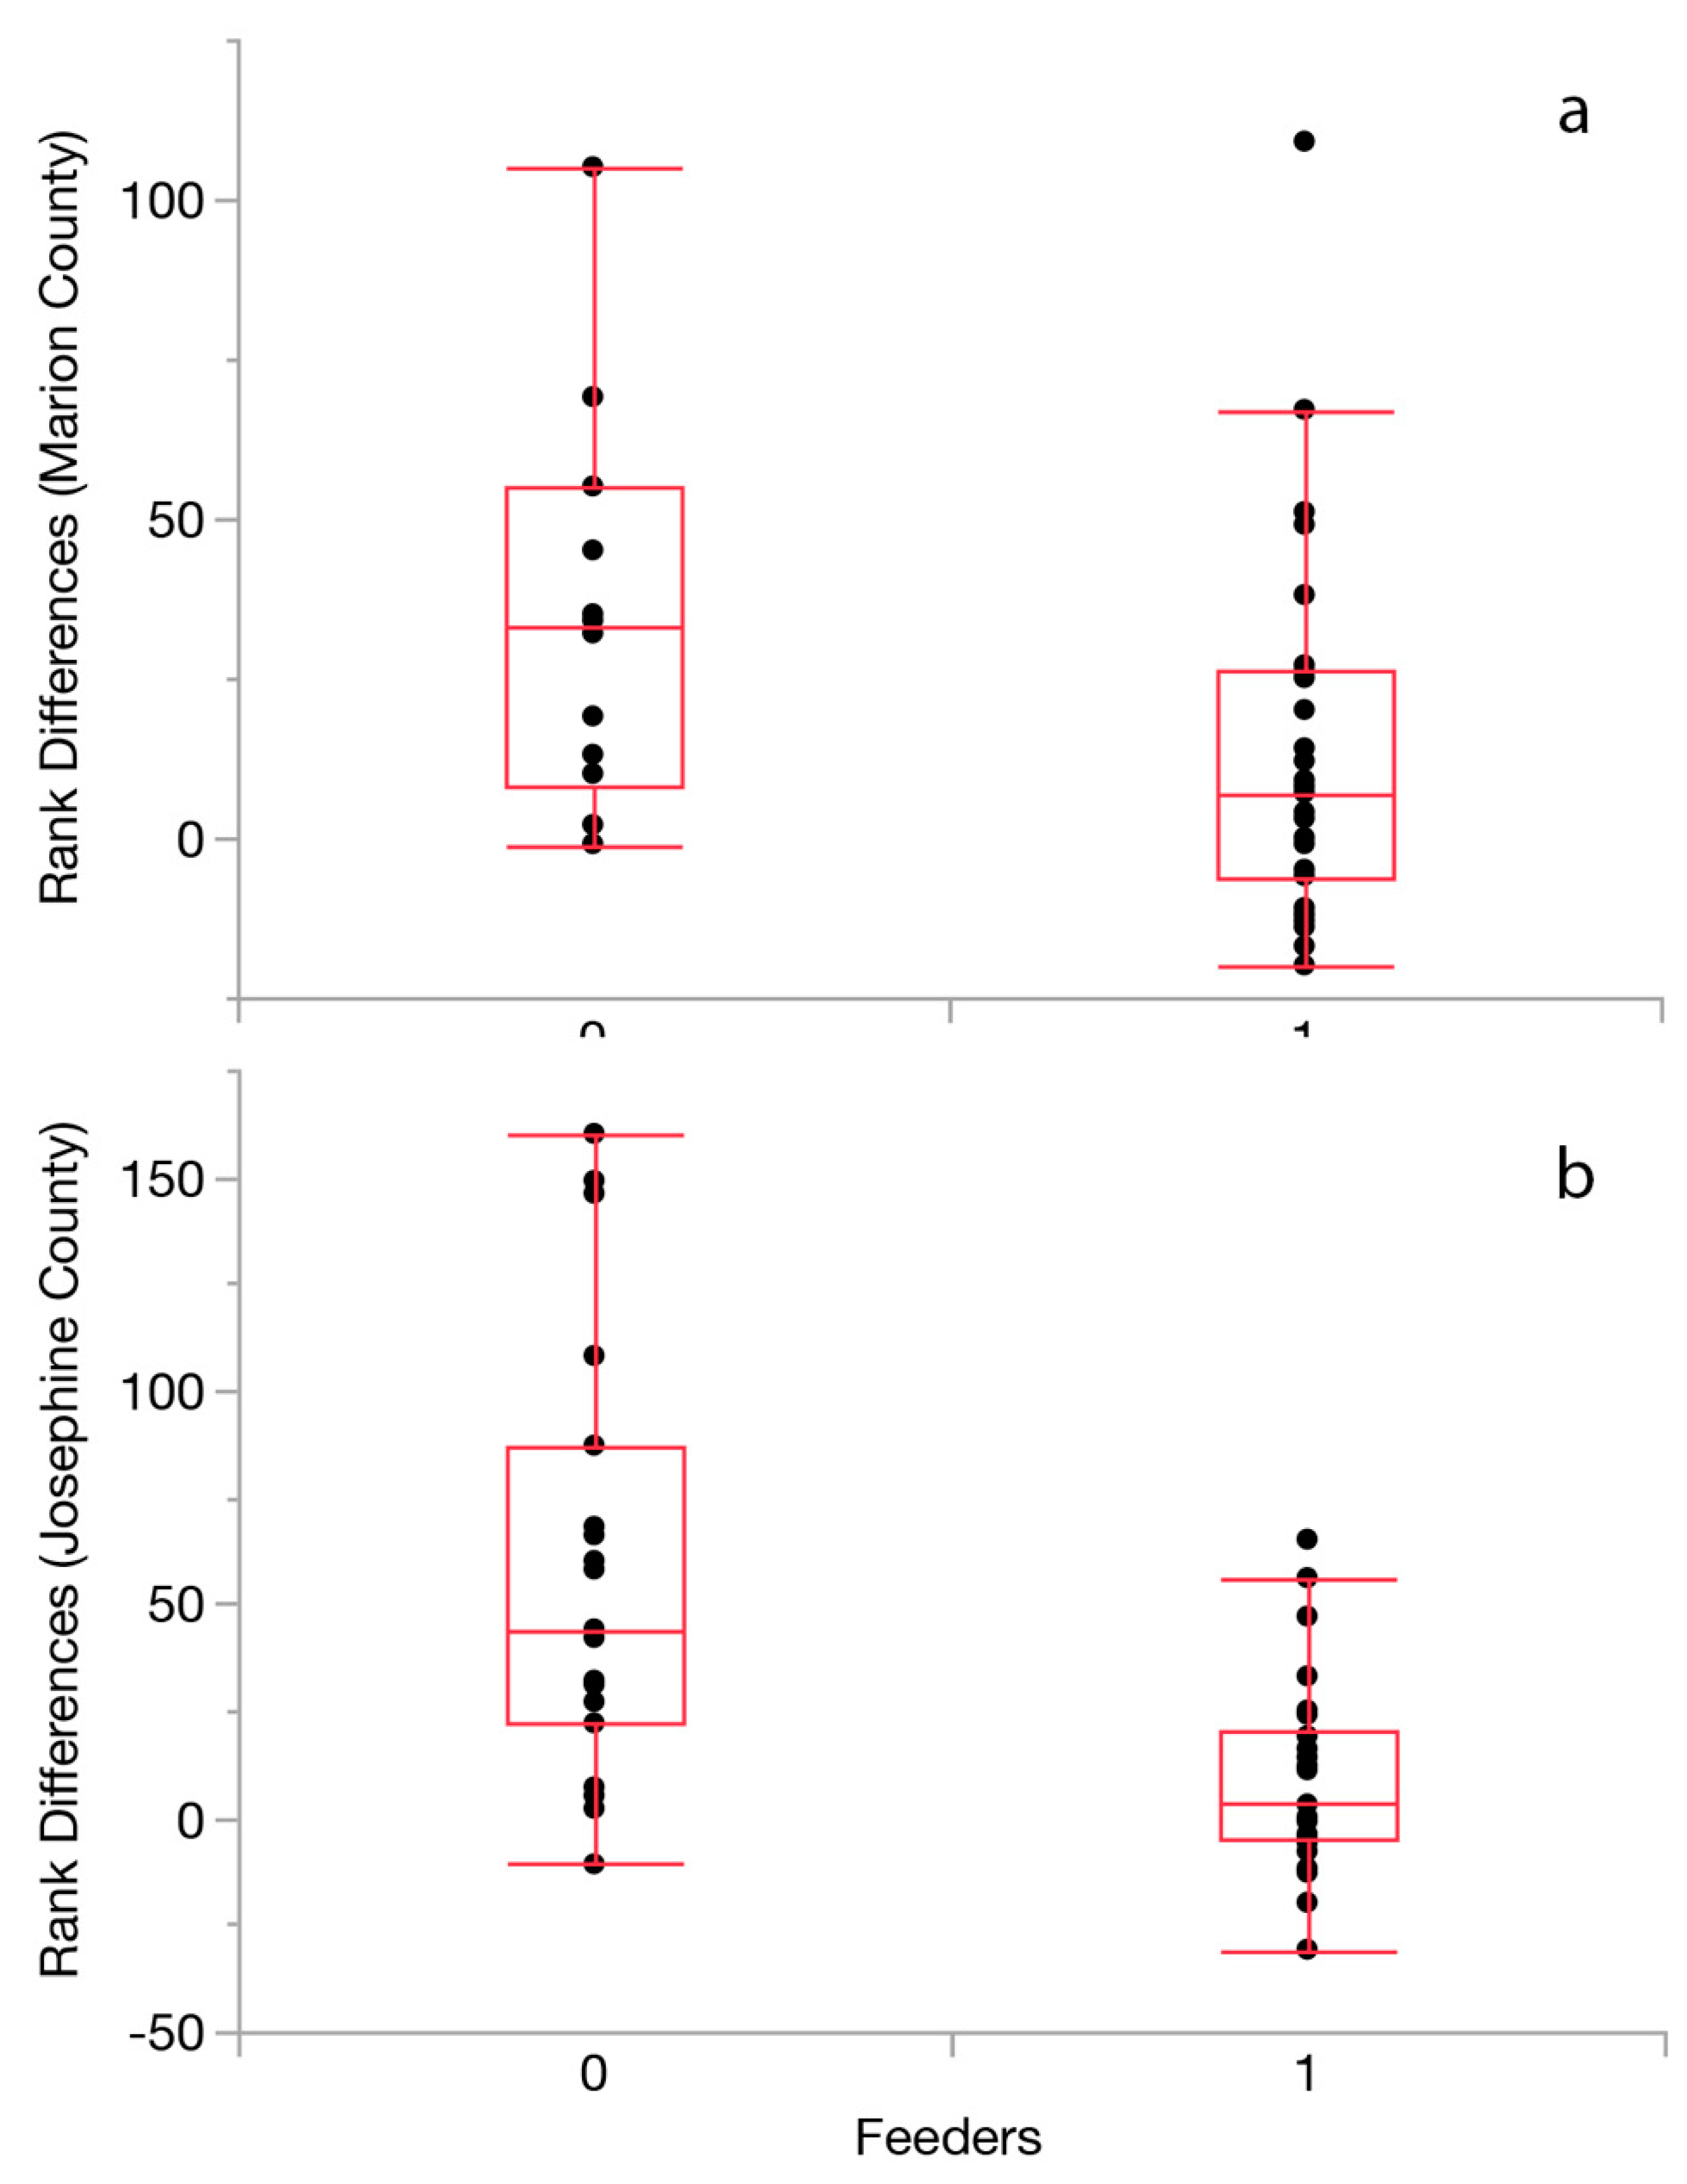
Species regularly using feeders had a higher-ranking index of abundance in both Marion (z = −4.81, p < 0.0001) and Josephine (z = −4.65, p < 0.0001) counties and species regularly using feeders were delivered to rehabilitation centers in proportions expected from their indices of regional abundance (Figure 3). At Wildlife Images in Josephine County, there was a significant relationship between ranked index of abundance of species using feeders and admission due to interaction with a cat (z = 3.35, p = 0.0008). However, the relationship was much weaker for Turtle Ridge in Marion County (z = 1.34, p = 0.179).

3.2.4. Residency

Resident species outnumbered migrants at both rehabilitation centers. We found no significant differences from expected proportions of residents and migrants admitted to the rehabilitation centers, either as a whole or limited to species noted to have interacted with cats.

3.2.5. Terrestrial Species

Birds that forage on or near the ground were more likely to rank high on the list of species reported to have interacted with a cat in the Salem area (z = −3.42, p = 0.0006) but not in Grants Pass (z = 1.55, p = 0.12).

4. Discussion

Of reported causes of bird admissions to wildlife rehabilitation centers, cat-related interactions were second behind orphaned/behavioral stranding and accounted for 12.3% of all admissions. Admissions of bird species generally reflected local species abundances. We found strong positive correlations between rank orderings of species on eBird checklists and in lists of species admitted because of cat interactions. Residency versus migratory status did not influence likelihood of cat interactions. While species admissions were correlated with our indices of local abundance, species with an adult body mass of 70 g or less were distinctly under-represented in rehabilitation center data. The absence of such species was not limited to presumed cat interactions, meaning their absences were indicative of a general source of bias where small, injured birds were infrequently detected, rescued or delivered to rehabilitation centers relative to their regional abundance. Perhaps unsurprisingly, species more likely to have been reported as injured by a cat tended to be terrestrial species, but associations with use of bird feeders was equivocal with a significant positive association at one study site but not the other. Both total admissions and cat-related admissions came more from urban than rural areas. Overall, the sample included more terrestrial and near-terrestrial species than species foraging higher above ground, species larger than 70 g but less than the 200 g typical upper range of size cats regularly attack [27], and species with higher indices of relative abundance.
The proportion of cat-related causes of admission at Turtle Ridge (12.4%) and Wildlife Images (12.2%) aligned closely to most previous reports from centers in the United States, including 5% in Maine [17], 8% in Ohio [21], 9.8% in Wisconsin [19], 13.7% in Virginia [22] and 25.4% in Florida [18], but was lower than a Tennessee study [15] reporting 48.3% admissions owing to cat interactions. Cat interaction was the second-most frequently identified admission reason at each center, following “orphaned” (34%) at Turtle Ridge and “behavioral stranding” (13%) at Wildlife Images. Wildlife Images had much higher rates for “behavioral stranding” and “abduction with intent to rescue”, which likely overlapped with Turtle Ridge’s use of “orphaned,” reasonably placing cat interaction as the second most common form of reported reason at both centers. Despite possible differences in use of admission categories at the two centers, we conclude that cat interactions were a common reason for admission at both centers. Some uncertainty is involved, however, for two reasons. First, rehabilitation center data did not provide independently verifiable information of cat interactions. They relied on reports of the people who rescued each animal. Second, the rate at which birds interacting with cats were delivered to rehabilitation centers also remains obscured because approximately 23% of admissions did not include a reason for admission in the WILD-ONe database. The authors in [21] found similar results with no cause of admission being reported in 20% of cases. Thus, our average of 12.3% may be a low estimate if we conclude the importance of undetermined causes of admission outnumber incorrect reports of cat-related interactions. At a minimum, hundreds of birds per year were brought to the two rehabilitation centers after rescuers determined involvement of a cat was likely.
Despite uncertainty in the rates of cat-related admissions, it is clear that the most common bird species, especially those foraging on or near the ground, were admitted most often. The two centers sampled from largely similar bird communities, sharing eight of the top ten most frequently admitted species. A few regional and habitat-related differences in species composition and abundances were apparent. At both sites, bird species tended to be admitted at rates reflecting their local abundances. That is, when rank-ordered from most to least common, common species were also the most commonly admitted after cat interactions. Common species also comprised the majority of birds admitted due to interaction with a cat at the Wildlife Center of Virginia [22] and throughout North America [21].
While admission rates appeared to reflect local abundance, species with an adult body mass of under 70 g were under-represented in rehabilitation center admissions for any cause, including interaction with a cat. These common species included Anna’s Hummingbirds Calypte anna, Black-capped Chickadees Poecile atricapillus, Dark-Eyed Juncos Junco hyemalis, and Spotted Towhees in both Salem and Grants Pass, as well as Song Sparrows Melospiza melodia in Salem. We hypothesize that small-bodied birds may be under-represented because they are less likely to survive traumatic events, to be found if they do survive injuries, or to be transported successfully to rehabilitation centers. An additional explanation could involve identification challenges. Rehabilitation center volunteers might confuse species, such as sparrows, with other similar species and dilute the rate at which individual species are reported relative to sparrows or some other similarly appearing species as a whole. We do not think the low rates of admission for species under 70 g can be explained by higher rates of cat-caused mortality instead of injury because this class of small birds was absent from all admissions regardless of indicated cause of admission.
Birds were more likely to be rescued from urban areas than from rural areas, even as evaluated with our coarse categorization of habitat type. The trend for more admissions from urban areas was seen in all admissions, although it was much less pronounced for admissions due to interaction with a cat at Wildlife Images, where birds were nearly equally likely to come from an urban or rural area. This contrasts with admissions at Turtle Ridge, where birds admitted for cat-related reasons were more likely to have come from urban areas than for all other admission reasons. Wildlife Images is located near a much smaller city than Turtle Ridge, which may affect where birds are found and rescued. Only a few species were more strongly associated with urban or rural rescue locations when cause of admission was interaction with a cat. In Salem, these species included California Scrub-Jays, European Starlings and, to a lesser extent, American Crows. These three species were found to be associated with urban areas. In Grants Pass, Spotted Towhees were more likely to have come from rural environments. Overall, significant differences were uncommon because samples sizes of most individual species were small. Our study region included two cities of moderate size, neither of which abutted protected natural areas. A South African study of cat–bird interactions in an urbanized landscape using video footage from cat-borne cameras found cats caught few non-native species in urbanized areas and suggested cats whose home ranges adjoin natural areas near urbanized areas could post greater risks for native species [32]. Thus, landscape context can influence the species most at risk of predation from free-ranging cats.
Our interpretation of the results requires consideration of assumptions associated with use of rehabilitation center data. We consider several caveats and offer recommendations for improving the scientific value of data collected at wildlife rehabilitation centers and archived in the WILD-ONe database. Several points of uncertainty in wildlife rehabilitation data stem from admission procedures and circumstances of rescue. Patient intake procedures vary between rehabilitation centers, and the quality of information collected at admission can vary at each center. Rehabilitation centers are often run by a combination of staff and volunteers and may experience high volunteer turnover leading to a low level of experience by those completing admissions. Information collected at the time of admission may also be incomplete, due to incorrect use of admission forms or because the person bringing in the animal may have incorrect or incomplete information about the circumstances of rescue. An undetermined cause of admission, for example, was noted in 23% of cases at the western Oregon centers. When thousands of patients are admitted each year, this represents a substantial number of cases for which an admission cause was not determined. Although we screened data for records indicating interactions with cats, the empirical evidence for such interactions is sparse, and not well documented on admission forms either at time of admission or after inspection by rehabilitation personnel. The rate at which cat interactions occurred could be under-estimated because of the large proportion of admissions owing to undetermined causes or even over-estimated if rescuers incorrectly attribute animal injuries to cats.
Some centers may prioritize recording of certain causes of admission over others. While it is possible to enter multiple causes of admission just as it is possible to list multiple injury details, employees or volunteers may need to prioritize the most apparent cause, or the cause that will require the most aggressive treatment. When birds are potentially injured by cats, for example, it is common practice to treat them immediately with antibiotics [33], a step not normally taken if injuries may have resulted from a collision. The accuracy of diagnoses, therefore, certainly influences the interpretation of proportion of admissions to centers as a function of presumed causes. Diagnoses vary between centers as well. For example, from the different distributions of admission causes at Turtle Ridge and Wildlife Images it appears that the rescue of fledglings was coded quite differently, orphaned at one center and as behavioral stranding or abduction with intent of rescue at the other.
Beyond uncertainty in cause of admission, other data collected from wildlife rehabilitation centers may be incorrect or incomplete. We found several instances of probable misidentification of species, as well as suspected misidentifications. When identifications are clearly wrong, they are normally easy to correct (for example, correcting a presumed erroneous identification or data entry mistake from Eastern to Western Bluebird). In other cases, the identifications of similarly appearing species do cause uncertainty in data. To reduce these effects, we combined similar species into species groups (e.g., Sphyrapicus sapsuckers and Spinus goldfinches), but other potential misidentifications are difficult to detect. A step that could reduce such uncertainty could be to require pictures of each patient be uploaded into the WILD-ONe database and available for independent verification. We recognize that this step may not always be convenient because of the degree of injuries, need for expediency of treatment, or other sensitive situations. Given the scientific utility of rehabilitation center data, however, getting the species identifications correct should be a top priority. It is probably unreasonable to expect rehabilitation center staffs, characterized by high turnover of volunteers, to be skilled at species levels identifications of all potential patients, particularly when many of those patients may be fledglings or juveniles in unfamiliar plumages. The difficulty of proper identification of species may also justify more flexibility on the part of data collection services. While WILD-ONe currently provides an option to categorize species as an “undetermined bird,” more potential levels of identification, such as genera or species groups, may benefit both rehabilitation centers and researchers. Using the same species taxonomy as iNaturalist, for example, and submitting to iNaturalist pictures of admissions for which species identity is uncertain could provide an opportunity to connect with the artificial intelligence programs and supporting assembly of taxonomic experts that identify species for iNaturalist.
Overall, wildlife rehabilitation centers provide an important opportunity to gather scientific data of relevance to conservation biology, but do need improvements that could increase the scientific rigor of data collected [19,22]. Future efforts to address uncertainties associated with rehabilitation center data should target both the centers and the database management service collecting the data (Table 6). Wildlife rehabilitation centers vary widely in size and funding, which will cause variation in the ability of individual rehabilitators or centers to meet these recommendations, some of which require significant financial or professional resources. Training of center personnel to transfer more complete accounting of potential explanations for injuries onto admission forms could reduce the fraction of records with undetermined causes. Although widespread training may be impractical given the characteristics of most volunteer-based rehabilitation centers, training focused on centers most interested in collaborating with scientific research groups might be productively implemented. A network of well-funded centers with lower turnover of human resources might be identified and adjustments in intake and data collection procedures could be implemented to maximize the scientific reliability of information gathered from admitted patients.
Determination of which bird species are more likely to have interactions with a cat matters because these birds often die, even after being admitted to a wildlife rehabilitation center. The authors of [20] found a 78% mortality rate for birds brought to a wildlife rehabilitation center after having been attacked by a cat. This number did not include birds that died immediately during the interaction, but included birds that died during transport, or died or were euthanized at the rehabilitation center. The authors of [15] found that 71.3% of birds admitted to a wildlife hospital in Tennessee for a cat-related reason either died or were euthanized. The authors of [21] noted that 68% of birds admitted to wildlife rehabilitation centers due to interaction with a cat died or were euthanized, and only 24% were released. These high rates indicate that even birds injured and escaping (or being rescued from) cats are likely to die, suggesting that estimates of cat-caused bird deaths extrapolated from data on rates at which cats deliver prey back to their homes are low. At the least, our data corroborate the concern that estimating the impacts of cats on bird populations is a complex problem.

5. Conclusions

Despite our concerns of possible biases in the rehabilitation center data, several conclusions from our analyses should be robust to such issues. First, cat-related interactions are an important source of injured birds being delivered to rehabilitation centers. The general proportions of such causes at the centers we studied align closely with such proportions at other centers. Second, hundreds of birds per year per center are injured by cats and rescued by the public. Third, cat interactions occurred most often with the commonest species in each region, being largely in direct proportion to each species’ prevalence on checklists in the eBird database. Fourth, species foraging on or near the ground were most often admitted to the rehabilitation centers. Finally, small (<70 g) common birds were under-represented, probably resulting from sampling biases associated with discovering the birds when they were injured.
Wildlife rehabilitation centers provide important services to the public and to wildlife generally [17,19]. The data they collect, when shared through structured databases such as WILD-ONe, can provide useful information on sources of mortality, rehabilitation success, and locations of high-risk areas for wildlife [22]. Additional steps to improve the ability to verify data taken at time of admission will increase the value of the data even more.

Supplementary Materials

The following are available online at https://www.mdpi.com/article/10.3390/d13070322/s1, Table S1: Percentages and total numbers (N) of admissions for each species; Table S2: Names and characteristics of bird species included in this study; Table S3: Table of all species with at least one cat interaction record.

Author Contributions

Conceptualization, K.G.D. and W.D.R.; methodology, K.G.D. and W.D.R.; validation, K.G.D. and W.D.R.; formal analysis, K.G.D. and W.D.R.; writing—original draft preparation, K.G.D.; writing—review and editing, K.G.D. and W.D.R. All authors have read and agreed to the published version of the manuscript.

Funding

This research received no external funding.

Institutional Review Board Statement

Not applicable.

Data Availability Statement

The data in this study are available in Tables and Supplementary Tables.

Acknowledgments

We thank WILD-ONe and the Wildlife Center of Virginia for providing these data, as well as Turtle Ridge Wildlife Center, and Wildlife Images Rehabilitation and Education Center. B. Dugger and S. Dunham provided feedback on an earlier draft. Tara Kate Designs assisted with figures.

Conflicts of Interest

The authors declare no conflict of interest.

Appendix A

Appendix A.1. Defining Interaction with a Cat

We necessarily used a broad definition of interaction with a cat because admission data report observations made by rescuers and are not independently verifiable. The interactions range from the abduction or rescue of birds due to concern of a potential interaction with a cat (e.g., fledglings being rescued to protect them from cats) to direct interactions where the bird was rescued from the mouth of a cat. Our choice to use a broad definition results from the difficulty in confirming the level of interaction that has occurred when detailed information is not taken at the time of admission.
Center admission forms contain basic information (date, time of intake, contact name and address of the rescuer, address where the animal was rescued) requested from the rescuer. The forms from our centers also requested information on possible cause of injury, listing common causes that might be quickly noted by the intake personnel (e.g., car hit, window hit, orphaned, contact with a cat). The forms also include space to list intake procedures undertaken, typically without any prompts to direct the personnel toward particular information, and the disposition of the animal after its admission.

Appendix A.2. Handling of Potential Species Identification Issues

Staff and volunteers at wildlife rehabilitation centers are often not experts in species identification. In many cases, animals are not adults (e.g., fledgling birds), making identification even more difficult.
In two cases, we combined species into a single category.
Sapsuckers (Sphyrapicus spp.) include three species that hybridize and pose identification challenges even for experienced observers. Thus, we combined all sapsuckers into one group.
American Goldfinches (Spinus tristis) and Lesser Goldfinches (Spinus psaltria) were combined into a single category, Goldfinches. The two species of goldfinch were combined because of complexities of correctly identifying them, particularly in the cases of juveniles, females, and non-breeding males.

References

  1. Rosenberg, K.V.; Dokter, A.M.; Blancher, P.J.; Sauer, J.R.; Smith, A.C.; Smith, P.A.; Stanton, J.C.; Panjabi, A.; Helft, L.; Parr, M.; et al. Decline of the North American Avifauna. Science 2019, 366, 120–124. [Google Scholar] [CrossRef]
  2. Inger, R.; Gregory, R.; Duffy, J.P.; Stott, I.; Voříšek, P.; Gaston, K.J. Common European Birds Are Declining Rapidly While Less Abundant Species’ Numbers Are Rising. Ecol. Lett. 2015, 18, 28–36. [Google Scholar] [CrossRef] [Green Version]
  3. Loss, S.R.; Will, T.; Marra, P.P. Direct Mortality of Birds from Anthropogenic Causes. Annu. Rev. Ecol. Evol. Syst. 2015, 46, 99–120. [Google Scholar] [CrossRef] [Green Version]
  4. Loss, S.R.; Will, T.; Marra, P.P. The Impact of Free-Ranging Domestic Cats on Wildlife of the United States. Nature Communications 2013, 4, 1396. [Google Scholar] [CrossRef] [Green Version]
  5. Loss, S.R.; Marra, P.P. Bird-Building Collisions in the United States: Estimates of Annual Mortality and Species Vulnerability. Condor 2014, 16, 8–23. [Google Scholar] [CrossRef] [Green Version]
  6. Loss, S.R.; Marra, P.P. Estimation of Annual Bird Mortality from Vehicle Collisions on U.S. Roads. J. Wildl. Manag. 2014, 78, 763–771. [Google Scholar] [CrossRef]
  7. Woinarski, J.C.Z.; Murphy, B.P.; Legge, S.M.; Garnett, S.T.; Lawes, M.J.; Comer, S.; Dickman, C.R.; Doherty, T.S.; Edwards, G.; Nankivell, A.; et al. How Many Birds Are Killed by Cats in Australia? Biol. Conserv. 2017, 214, 76–87. [Google Scholar] [CrossRef]
  8. Lepczyk, C.; Mertig, A.G.; Liu, J. Landowners and Cat Predation across Rural-to-Urban Landscapes. Biol. Conserv. 2003, 115, 191–201. [Google Scholar] [CrossRef]
  9. Dauphine, N.I.C.O.; Cooper, R.J. Impacts of free-ranging domestic cats (Felis catus) on birds in the United States: A review of recent research with conservation and management recommendations. In Proceedings of the Fourth International Partners in Flight Conference: Tundra to Tropics; Partners in Flight: McAllen, Texas, USA, 2008; pp. 205–219. [Google Scholar]
  10. Baker, P.J.; Bentley, A.J.; Ansell, R.J.; Harris, S. Impact of Predation by Domestic Cats Felis Catus in an Urban Area. Mammal Review 2005, 35, 302–312. [Google Scholar] [CrossRef]
  11. Clancy, E.A.; Moore, A.S.; Bertone, E.R. Evaluation of Cat and Owner Characteristics and Their Relationships to Outdoor Access of Owned Cats. J. Am. Vet. Med Assoc. 2003, 222, 1541–1545. [Google Scholar] [CrossRef]
  12. Lepczyk, C.A.; Duffy, D.C. Feral cats. In Ecol. Manag. Terr. Invasive Species; CRC Press: Boca Raton, FL, USA, 2018; pp. 267–285. [Google Scholar]
  13. Crowley, S.L.; Cecchetti, M.; McDonald, R.A. Diverse Perspectives of Cat Owners Indicate Barriers to and Opportunities for Managing Cat Predation of Wildlife. Front. Ecol. Environ. 2020, 18, 544–549. [Google Scholar] [CrossRef]
  14. Loyd, K.A.T.; Hernandez, S.M.; Carroll, J.P.; Abernathy, K.J.; Marshall, G.J. Quantifying Free-Roaming Domestic Cat Predation Using Animal-Borne Video Cameras. Biol. Conserv. 2013, 160, 183–189. [Google Scholar] [CrossRef] [Green Version]
  15. Schenk, A.N.; Souza, M.J. Major Anthropogenic Causes for and Outcomes of Wild Animal Presentation to a Wildlife Clinic in East Tennessee, USA, 2000-2011. PLoS ONE 2014, 9, e93517. [Google Scholar] [CrossRef] [PubMed]
  16. Molina-Lopez, R.A.; Mañosa, S.; Torres-Riera, A.; Pomarol, M.; Darwich, L. Morbidity, Outcomes and Cost-Benefit Analysis of Wildlife Rehabilitation in Catalonia (Spain). PLoS ONE 2017, 12, e0181331. [Google Scholar] [CrossRef] [PubMed]
  17. Duffy, M.M. Wildlife Rehabilitation Datasets as an Underutilized Resource to Understand Avian Threats, Mortality, and Mitigation Opportunities; University of Maine: Orono, ME, USA, 2020. [Google Scholar]
  18. Kratter, A.W.; Steadman, D.W. Mortality in Birds from Florida Wildlife Rehabilitation Clinics. Fla. Field Nat. 2020, 48, 147–166. [Google Scholar]
  19. Long, R.B.; Krumlauf, K.; Young, A.M. Characterizing Trends in Human-Wildlife Conflicts in the American Midwest Using Wildlife Rehabilitation Records. PLoS ONE 2020, 15, e0238805. [Google Scholar] [CrossRef] [PubMed]
  20. Baker, P.; Thompson, R.; Grogan, A. Survival Rates of Cat-Attacked Birds Admitted to RSPCA Wildlife Centres in the UK: Implications for Cat Owners and Wildlife Rehabilitators. Anim. Welf. 2018, 27, 305–318. [Google Scholar] [CrossRef]
  21. Loyd, K.A.T.; Hernandez, S.M.; McRuer, D.L. The Role of Domestic Cats in the Admission of Injured Wildlife at Rehabilitation and Rescue Centers. Wildl. Soc. Bull. 2017, 41, 55–61. [Google Scholar] [CrossRef]
  22. McRuer, D.L.; Gray, L.C.; Horne, L.-A.; Clark Jr., E. E. Free-Roaming Cat Interactions with Wildlife Admitted to a Wildlife Hospital. J. Wildl. Manag. 2017, 81, 163–173. [Google Scholar] [CrossRef]
  23. Stratford, J.A.; Robinson, W.D. Distribution of Neotropical Migratory Bird Species across an Urbanizing Landscape. Urban Ecosyst 2005, 8, 59–77. [Google Scholar] [CrossRef]
  24. U. S. Census Bureau. ACS Total Popul. Salem City, Oregon. Table B01003; United States Government Printing Office: Washington, DC, USA, 2019.
  25. U. S. Census Bureau. ACS Total Popul. Grants Pass City, Oregon. Table B01003; United States Government Printing Office: Washington, DC, USA, 2018.
  26. Dunning, J.B. CRC Handbook of Avian Body Masses; CRC Press: Boca Raton, FL, USA, 2008. [Google Scholar]
  27. Dickman, C.R. Overview of the Impacts of Feral Cats on Australian Native Fauna; Australian Nature Conservation Agency: Canberra, Australia, 1996. [Google Scholar]
  28. Fleming, P.A.; Crawford, H.M.; Auckland, C.H.; Calver, M.C. Body Size and Bite Force of Stray and Feral Cats—Are Bigger or Older Cats Taking the Largest or More Difficult-to-Handle Prey? Animals 2020, 10, 707. [Google Scholar] [CrossRef] [Green Version]
  29. Sullivan, B.L.; Wood, C.L.; Iliff, M.J.; Bonney, R.E.; Fink, D.; Kelling, S. EBird: A Citizen-Based Bird Observation Network in the Biological Sciences. Biol. Conserv. 2009, 142, 2282–2292. [Google Scholar] [CrossRef]
  30. Robinson, W.D.; Hallman, T.A.; Curtis, J.R. Benchmarking the Avian Diversity of Oregon in an Era of Rapid Change. Northwestern Nat. 2020, 101, 180–193. [Google Scholar] [CrossRef]
  31. JMP, Version 18; SAS Institute, Inc.: Cary, NC, USA, 2018.
  32. Seymour, C.L.; Simmons, R.E.; Morling, F.; George, S.T.; Peters, K.; O’Riain, M.J. Caught on Camera: The Impacts of Urban Domestic Cats on Wild Prey in an African City and Neighbouring Protected Areas. Glob. Ecol. Conserv. 2020, 23, e01198. [Google Scholar] [CrossRef]
  33. Gage, L.J.; Duerr, R.S. Hand-Rearing Birds; Wiley-Blackwell Publishing: Hoboken, NJ, USA, 2007. [Google Scholar]
Figure 1. Schematic for evaluating differences among species admitted to the rehabilitation centers in their ranked abundances from the eBird data and the cat interaction data. When species ranked approximately the same in each list, the differences in ranks are near zero and those species are hypothesized to be admitted after cat interactions in approximately the same proportion to their abundance in the study areas. Species uncommonly reported in eBird (i.e., lower position in a ranked list, so higher numerical value for ranking) than in the rehabilitation center data are hypothesized to be species admitted to centers in higher numbers than expected based on their abundance alone. Species commonly included in eBird lists but much less often admitted to rehabilitation centers are hypothesized to be under-represented in cat interaction data relative to their abundance in the study areas.
Diversity 13 00322 g001
Figure 2. Species with a mean adult mass of less than 70 g were much less likely than larger species to be admitted for any reason to a wildlife rehabilitation center in Salem (a) and Grant Pass (b). This was also true for birds admitted after interacting with a cat in Salem (c) and Grants Pass (d). Local abundances, based on eBird checklists, did not show the same pattern in either Marion County (e) or Josephine County (f).
Diversity 13 00322 g002
Figure 3. Rank differences between species using feeders (1) and species that do not use feeders (0) as related to their indices of abundance in Marion (a) and Josephine (b) Counties.
Diversity 13 00322 g003
Table 1. Total annual admissions to the rehabilitation centers (N) and the percentages of those admissions that were birds.
Percentage (N) Total Admissions
YearTurtle RidgeWildlife ImagesCombined
20140.03 (1)0.3 (10)0.2 (11)
20152.3 (76)26.3 (802)13.8 (878)
201628.0 (922)21.0 (642)24.6 (1564)
201732.6 (1073)24.4 (744)28.6 (1817)
201837.1 (1221)28.0 (854)32.7 (2075)
Total100 (3293)100 (3052)100 (6345)
Table 2. Ten most frequently admitted avian species at each wildlife center, regardless of presumed cause; Turtle Ridge, Salem, and Wildlife Images, Grants Pass, Oregon.
Turtle RidgeWildlife Images
SpeciesPercentage (N) Total AdmissionsSpeciesPercentage (N) Total Admissions
Mallard 11.0 (361)European Starling 5.3 (162)
European Starling 8.5 (279)Mourning Dove 4.8 (146)
American Crow 6.5 (214)Western Screech-Owl 4.8 (146)
California Scrub-Jay 5.1 (169)California Scrub-Jay 4.7 (144)
American Robin 4.9 (162)American Robin4.4 (135)
Rock Pigeon 4.3 (143)Canada Goose4.2 (128)
Eurasian Collared-Dove 3.6 (117)American Crow3.8 (116)
Mourning Dove3.3 (109)Red-tailed Hawk3.8 (116)
Red-tailed Hawk 3.1 (103)Mallard3.7 (113)
Vaux’s Swift2.9 (97)Eurasian Collared-Dove3.6 (110)
Table 3. Percentages and numbers of total admissions for the ten most frequently reported causes of admission from both wildlife rehabilitation centers, as well as frequency of undetermined cause of admission.
Percentage (N) of Admissions
CauseTurtle RidgeWildlife ImagesBoth Centers
Orphaned34.0 (1120)8.3 (252)21.6 (1372)
Interaction with a cat12.4 (409)12.2 (373)12.3 (782)
Collision with a car, truck, or motorcycle7.0 (228)10.9 (333)8.8 (561)
Nest/habitat disturbance or destruction6.7 (222)7.0 (213)6.9 (435)
Behavioral stranding0.4 (12)13.0 (396)6.4 (408)
Abduction with intent of rescue0.0 (0)10.2 (311)4.9 (311)
Collision with a wall or window4.2 (141)5.5 (169)4.9 (310)
Interaction with a dog1.7 (56)2.7 (81)2.2 (137)
Failure to thrive/maladaptation0.4 (13)3.3 (102)1.8 (115)
Interaction with a non-domestic animal of another species1.8 (60)1.7 (52)1.8 (112)
Undetermined27.7 (911)18.7 (570)23.3 (1481)
Table 4. Top ten species at each center admitted after interacting with a cat. One species (American Crow) with an adult body mass > 200 g was excluded. Percentages are calculated from all cat-related admissions at each center.
Turtle RidgeWildlife Images
SpeciesPercentage (N) AdmissionsSpeciesPercentage (N) Admissions
California Scrub-Jay13.0 (53)American Robin 11.8 (44)
American Robin11.2 (46)California Scrub-Jay 11.0 (41)
European Starling 6.8 (28)Mourning Dove8.0 (30)
Mourning Dove 6.1 (25)Eurasian Collared-Dove 6.2 (23)
Eurasian Collared-Dove 5.6 (23)Spotted Towhee3.2 (12)
Spotted Towhee 4.9 (20)European Starling3.2 (12)
Dark-eyed Junco 3.9 (16)Northern Flicker2.9 (11)
House Sparrow3.7 (15)Black-headed Grosbeak2.9 (11)
Northern Flicker3.2 (13)Acorn Woodpecker2.7 (10)
Varied Thrush2.7 (11)House Sparrow2.7 (10)
Table 5. Percentage of bird admissions coming from urban or rural locations. Records involving interaction with a cat do not add up to 100%, as some records from this category had incomplete location information. Records from other causes of admission were not included in analysis of location information if this information was incomplete.
Cat InteractionOther Admission Causes
Rescue LocationTurtle RidgeWildlife ImagesCombinedTurtle RidgeWildlife ImagesCombined
Percent (N) Urban70.9 (290)42.6 (159)57.4 (449)63.0 (17)67.9 (19)65.5 (36)
Percent (N) Rural22.5 (92)40.5 (151)31.1 (243)37.0 (10)32.1 (9)34.5 (19)
Percent (N) Unknown6.6 (27)16.9 (63)11.5 (90)---
Total100 (409)100 (373)100 (782)100.0 (27)100.0 (28)100.0 (55)
Table 6. Recommendations for wildlife rehabilitators and database designers to improve accuracy and scientific utility of data collected by wildlife rehabilitation centers.
Wildlife Rehabilitators or CentersDatabase Designers and Operators
Consistent training on admission procedures
Designing admissions paperwork to reflect database requirements
Access to individuals trained in species identification for all species groups admitted by the rehabilitator
Consistent procedures with paperwork, including disposition information
Greater flexibility with species information
Allowing less specific information pertaining to injury/illness
Readily available definitions of all terms used
Publisher’s Note: MDPI stays neutral with regard to jurisdictional claims in published maps and institutional affiliations.

