Article

Genetic, but Not Behavioral, Evidence Supports the Distinctiveness of the Mealy Amazon Parrot in the Brazilian Atlantic Forest

by
Dominique L. Hellmich
1,*,
Andre B. S. Saidenberg
2 and
Timothy F. Wright
1
1
Department of Biology, New Mexico State University, Las Cruces, NM 88003, USA
2
Department of Veterinary Pathology, University of Sao Paulo, Sao Paulo 05508-060, SP, Brazil
*
Author to whom correspondence should be addressed.
Diversity 2021, 13(6), 273; https://doi.org/10.3390/d13060273
Submission received: 11 May 2021 / Revised: 8 June 2021 / Accepted: 12 June 2021 / Published: 17 June 2021

Abstract

:
The presence of unidentified cryptic species within a species complex can obscure demographic trends of vulnerable species, impacting potential species conservation and management decisions. Previous work identified a taxonomic split between Central and South American populations of the mealy amazon (Amazona farinosa) that subsequently resulted in the elevation of these two populations to full species status (Amazona guatemalae and A. farinosa, respectively). In that study, however, a third, geographically disjunct population from the Brazilian Atlantic Forest was insufficiently sampled, limiting the ability of researchers to fully evaluate its genetic distinctiveness. Given that significant levels of biodiversity and endemism are found in this region, we aimed to use genetic and behavioral data to determine if the Atlantic Forest population of A. f. farinosa represents a third cryptic species within the complex. We sequenced 6 genes (4 mitochondrial and 2 nuclear introns) from the Atlantic Forest population of A. f. farinosa to measure the genetic relationships between this population and all other recognized species and subspecies of the mealy amazon. In addition, we use spectrographic cross-correlation and an analysis of 29 acoustic parameters to determine whether the taxa diverge in their learned contact call structure and if the degree of vocal differentiation correlates to genetic structure. We found that the Atlantic Forest population of A. f. farinosa was genetically distinct from that of the greater Amazon basin, but the degree of differentiation was less than that separating the Central and South American taxa. Acoustic analysis revealed substantial variation in contact call structure within each clade. This variation created substantial overlap in acoustic space between the clades. In all, the degree of call divergence between clades did not correspond to the degree of genetic divergence between the same clades. The results suggest that in taxa with substantial geographic variation in learned calls, such as the mealy amazon, vocalizations may not be a useful tool in the identification of cryptic species that are lifelong vocal learners. While these results do not support the elevation of the Brazilian Atlantic Forest population of the mealy amazon to full species status, given current trends of habitat loss in the Atlantic Forest as well as the imperiled status of large parrot species globally, we argue that this population nonetheless warrants special conservation and management consideration as a pool of unique genetic diversity within the southern mealy amazon species.

1. Introduction

A primary challenge for conservationists and wildlife managers is understanding the demographic trends of vulnerable species. This task is complicated if the basic taxonomic relationships between species are not well understood. This issue commonly arises within species complexes that contain unidentified cryptic species: morphologically indistinguishable but genetically distinct species that are mistakenly classified under a single species name [1,2]. The presence of unidentified cryptic species can lead to artificially low assessments of overall biodiversity and inflated estimations of the health or distribution of species of special conservation concern [3,4,5]. Historically, species delineations were made primarily using morphological features [2], but the current widespread availability of genetic sequencing technologies has given researchers new insight into the level of genetic diversity that exists within many of these morphologically defined species. Ideally, a combination of morphological, ecological, behavioral, and genetic data are used to describe potential cryptic species, as this integrative approach reduces subjective biases and allows for more informed conservation decisions [1].
The quantification of behavioral variation within a species complex may be a particularly powerful component of cryptic species identification, as these data can be collected remotely and at significantly lower cost than most traditional trapping methods [6,7]. Specifically, variation in acoustic signals was found to correlate with genetic divergence in a variety of taxa, including bats [8,9], primates [10], insects [11], anurans [12], and birds [13,14,15,16]. Learned or culturally derived vocalizations in particular might facilitate speciation, as these signals can rapidly accumulate mutations through the transmission process both within and between generations, leading to increases in assortative mating [6,17]. However, evidence for the impact of learning on the speciation process is variable and contradictory [18,19,20]. This association may be particularly complicated in species with lifelong vocal plasticity, such as humans [21], some parrots [22], and bats [23]. Individuals with open-ended vocal learning are able to modify their vocalizations into adulthood and may do so to serve a variety of social functions (e.g., pair formation and maintenance, social group integration) [24]. This flexibility poses the question: If individual vocalizations are not wedded to the underlying population genetic structure, can we use the vocalizations of these open-ended vocal learners to identify cryptic species within a species complex?
Parrots (Order Psittaciformes) are an interesting group with which to study the relationship between the acoustic and genetic variation found within a cryptic species complex. Nearly 43% of known species are considered threatened with extinction [25], primarily due to habitat loss and poaching for the pet trade [26,27], making them a primary conservation concern. In addition, parrots are open-ended vocal learners with many members of the group displaying patterns of geographic variation (i.e., vocal dialects) in their socially learned contact calls [24,28]; these dialects may or may not correlate to patterns of genetic differentiation within a species [29,30,31,32]. Finally, there are numerous examples of species with cryptic genetic diversity within the parrot order [33,34,35], including the focus of our study, the mealy amazon (Amazona farinosa) [36].
The mealy amazon is a large-bodied (540–700 g) parrot in the Genus Amazona that ranges widely through Central and South America. It was long classified as a single species, Amazona farinosa, with five recognized subspecies [37]. Wenner and colleagues used DNA sequence data from several regions of mitochondrial and nuclear genomes to examine the geographic patterns of genetic variation within the species [36]. Based on the evidence of deep splits between the Central and South American subspecies the nominate mealy amazon species was formally reclassified into the northern mealy amazon (A. guatemalae) containing the guatemalae and virenticeps subspecies, and the southern mealy amazon (A. farinosa) containing the farinosa, inornata, and chapmani subspecies [38]. Subsequently, in 2014 the IUCN Red List up-listed both newly split species to Near Threatened from Least Concern [25]. Then, in 2018, the government of the Brazilian state of São Paulo listed local populations of the Atlantic Forest A. f. farinosa, the largest surviving populations in the region, as critically endangered [39]. With populations of both species continuing to decline, there is an urgent need to fully understand the taxonomic divisions within this species complex to inform future conservation decisions. Here, we look to rectify a sampling gap from the original [36] study, namely the lack of substantial genetic data from the disjunct Brazilian Atlantic Forest population of the southern mealy amazon subspecies A. f. farinosa.
The Atlantic Forest is the second largest rainforest system in South America, stretching across a broad strip of Brazil’s southeastern Atlantic coastline, and is a hotspot of endemic biodiversity in the Neotropics [40]. Currently, the Atlantic Forest is separated from the greater Amazon basin by the dry Caatinga region to the northeast, the upland, wooded savanna of the Cerrado region to the north/northwest, and from the Andean forests to the west by the lowland, arid Chaco region of central South America [41]. Historically, this forest has undergone several periods of connection and separation from these other major forest regions, leading to the isolation of some species over both short (e.g., 10,000–20,000 years ago) and long (e.g., >3 million years ago) time scales [41,42]. This dynamic evolutionary history has created a region rich with endemism and cryptic species complexes [43,44,45,46,47] that is threatened today by high levels of habitat loss and fragmentation [48]. For this reason, the Atlantic Forest is an area of upmost concern for biodiversity conservation [48,49].
We aimed to address two main questions. First, is the Atlantic Forest population of A. f. farinosa a cryptic species within the mealy amazon species complex? Given the possible timeframes when the Atlantic Forest population of A. f. farinosa could have been separated from the larger Amazon basin population of A. f. farinosa, we hypothesize that it is as genetically dissimilar from the other southern mealy amazon subspecies as the northern species is from the southern species. Second, can we use the vocalizations of an open-ended vocal learner to identify potential cryptic species? If so, we hypothesize that the degree of divergence in contact call structure between and within the mealy amazon species, subspecies, and the Atlantic Forest population of A. f. farinosa will correlate with the genetic distance between these groups. To measure genetic differentiation, we expanded on the original dataset from [36] by sequencing six gene regions from newly sampled individuals of the Atlantic Forest population of A. f. farinosa to create both a phylogeny and a haplotype network that includes this group. The similarity of contact calls within and between groups, as well as their relationship to the genetic distance between groups, was then assessed using 29 acoustic parameter measurements and spectrographic cross-correlation values. We predicted that our genetic and behavioral (i.e., contact call) measures will show related degrees of differentiation, with the Atlantic Forest population of A. f. farinosa falling out as divergent from the Amazon basin population of A. f. farinosa and the southern mealy amazon species as a whole. These results will inform the study and preservation of this geographically distinct population of the mealy amazon.

2. Materials and Methods

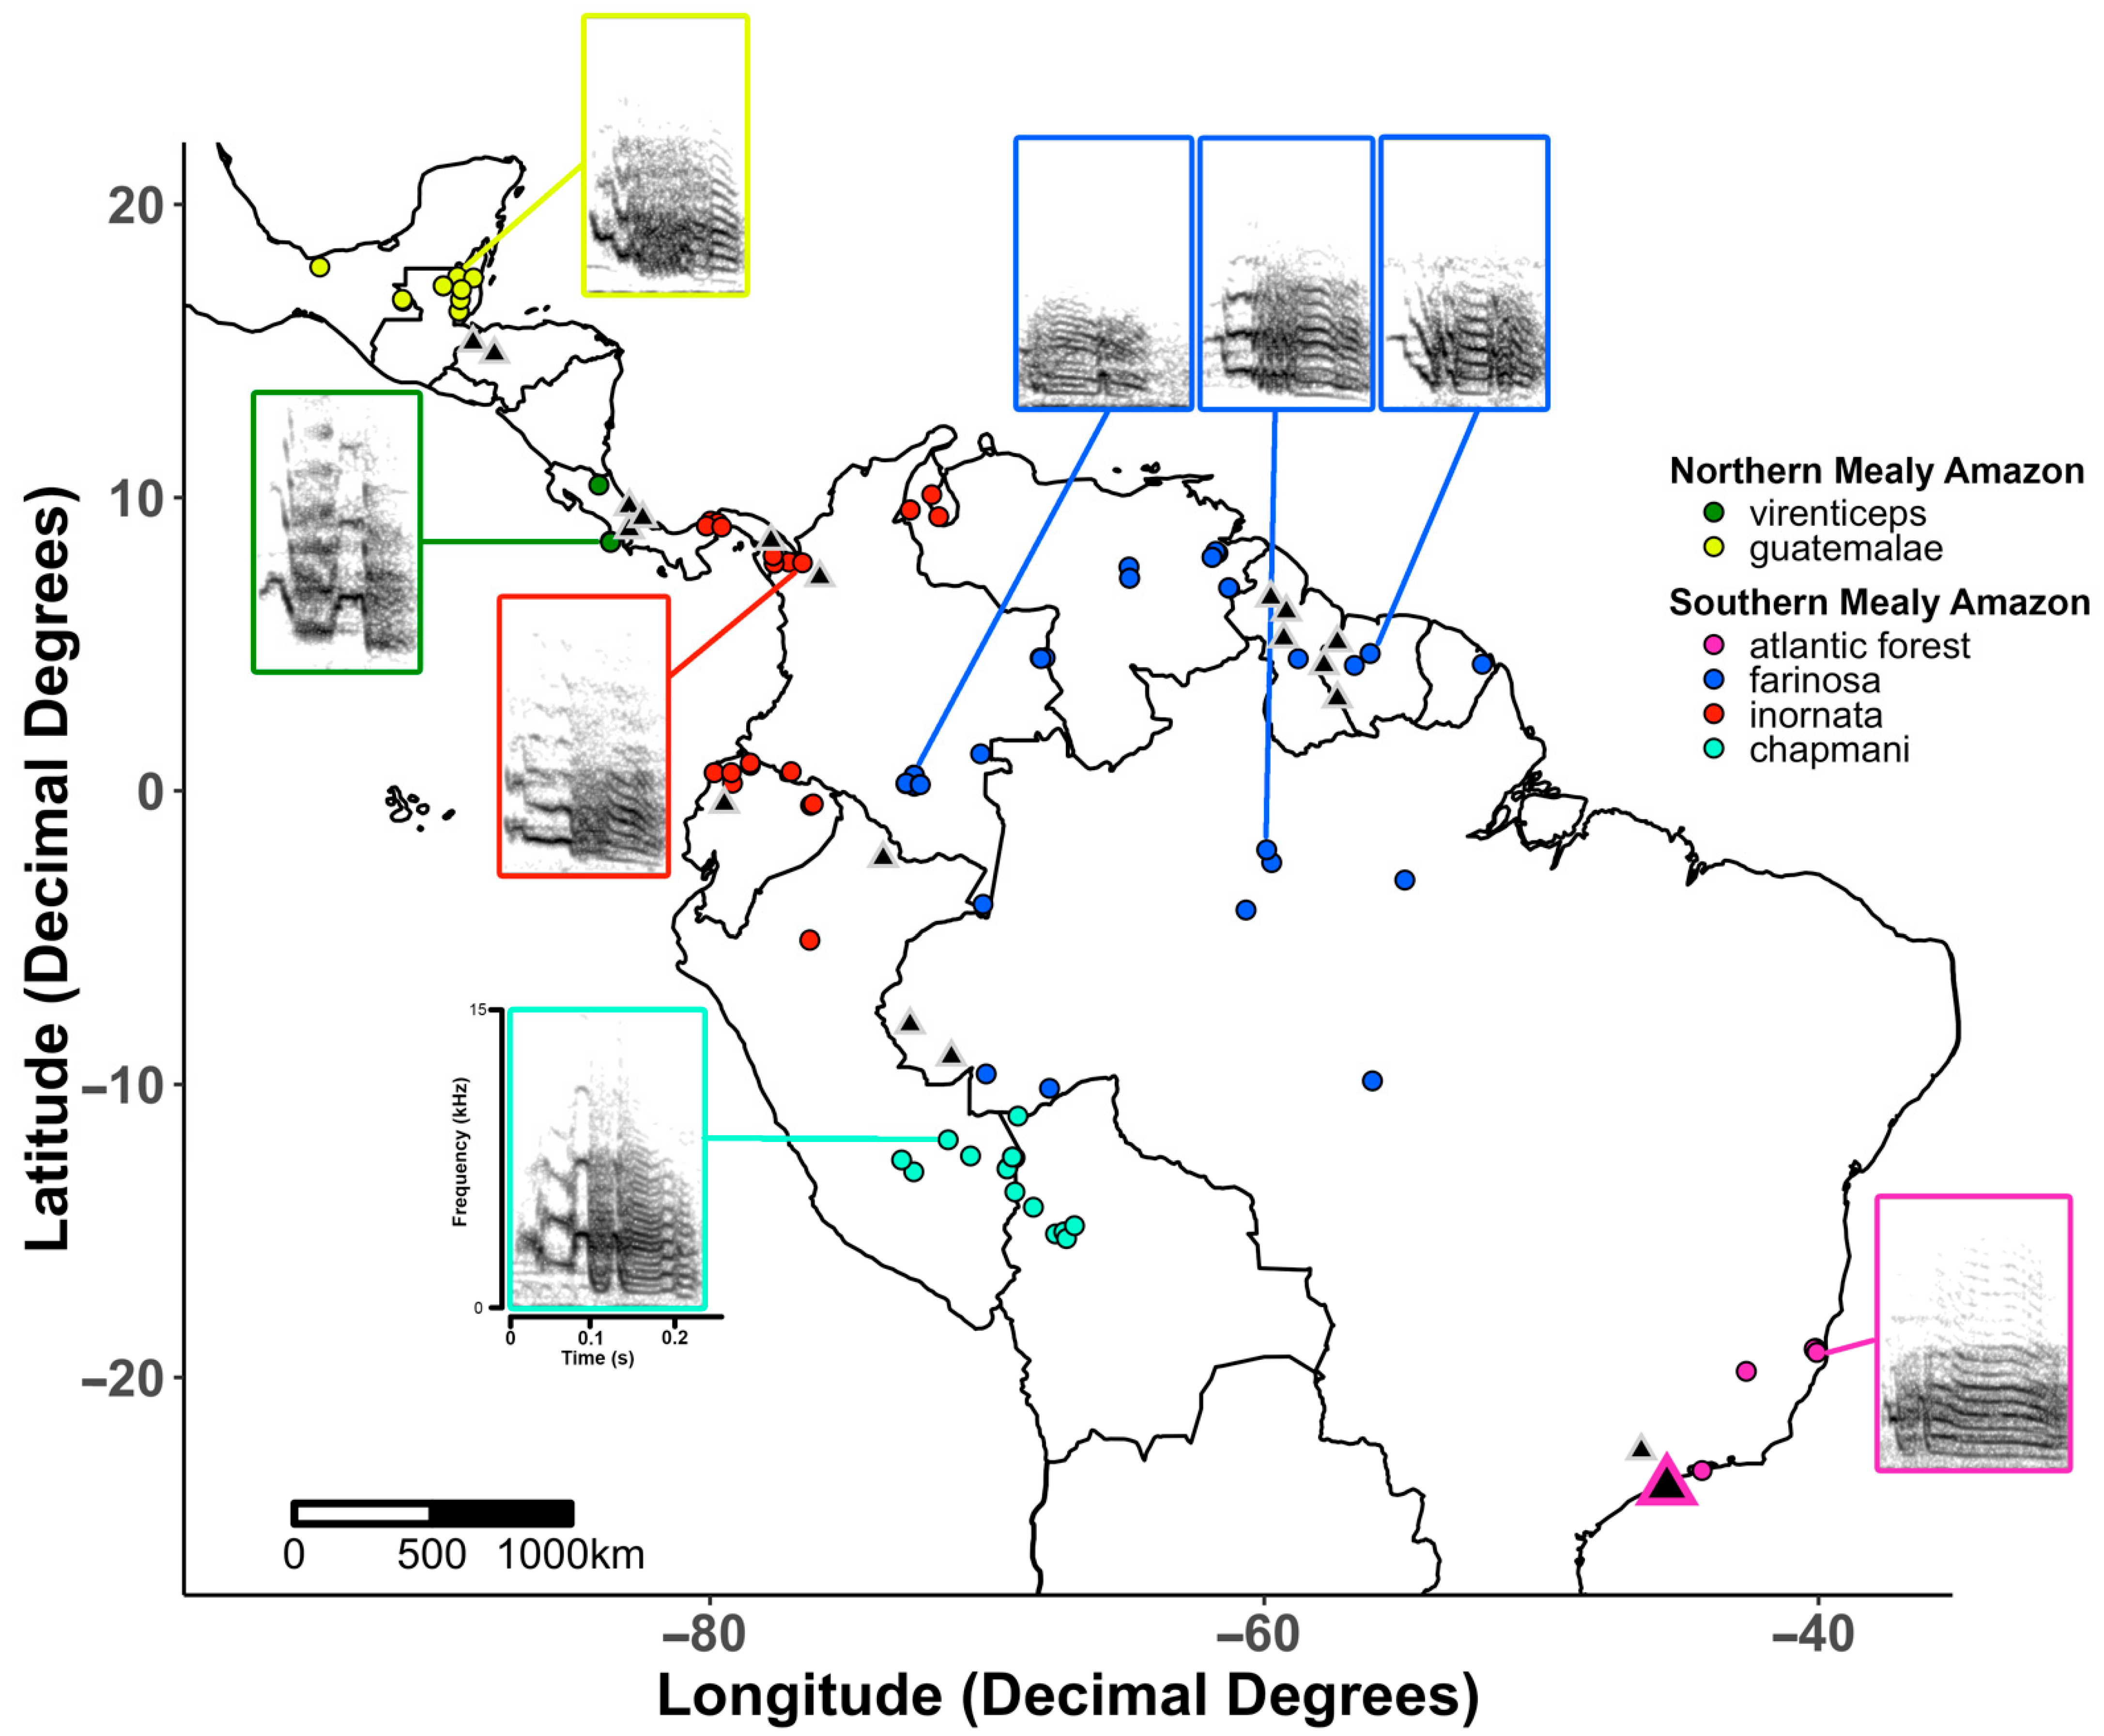
2.1. Study Species and Data Summary

The mealy amazon species complex includes two recognized species and five subspecies. The northern mealy amazon A. guatemalae (including the virenticeps and guatemalae subspecies) ranges from southern Mexico to central Panama, while the southern mealy amazon A. farinosa is distributed in three geographically distinct locations: (1) the inornata subspecies extends from southern Panama through western Ecuador and eastern Colombia, (2) the chapmani and farinosa subspecies range from eastern Ecuador, eastern Peru, and northern Bolivia through the greater Amazon Basin, and (3) in an isolated population of the farinosa subspecies along Brazil’s Atlantic coast [38] (Figure 1). Seven samples from the Atlantic Forest population of A. f. farinosa were unique to this study as all other clades within the species complex were sampled adequately by [36]; see Table S1 for details on the origins of the genetic samples.
Recordings of contact calls from individuals of all subspecies and the Atlantic Forest population of A. f. farinosa were obtained from the Macaulay library (Cornell Laboratory of Ornithology, Ithaca, NY, U.S.) and Xeno-canto (Xeno-canto Foundation for Nature Sounds, Netherlands). We used 148 high-quality sound files from 1954 to 2019 in our analysis; sound file metadata can be found in Table S2.

2.2. Phylogenetic Analysis and Haplotype Network

Blood samples were collected, according to SISBIO permit #71978-1 protocols following Brazilian environmental legislation, on Whatman FTA elute micro cards from seven individuals being held in captivity at the ASM Cambaquara rescue center on the island of Ilhabela, São Paulo, Brazil, after seizure as illegal pets or after being found injured in the wild. These individuals represent a single Atlantic Forest A. f. farinosa population (for complete sample metadata see Table S1). For each sample, genomic DNA was isolated and then PCR amplification was performed for the four mitochondrial and two nuclear intron gene fragments previously used in [36]: 12S rDNA (12S), 16S rDNA (16S), Cytochrome oxidase subunit I (COI), cytochrome b (CytB), tropomyosin alpha-subunit intron 5 (TROP), and transforming growth factor β-2 intron I (TGFB2). An additional mitochondrial gene fragment for NADH dehydrogenase 2 (ND2) was amplified for both the [36] samples and the new A. f. farinosa Atlantic Forest samples. A complete description of the number of individuals sampled from each population, the genes sequences per individual, GenBank accession numbers, and primers can be found in Tables S1, S3 and S4. All PCR products were directly sequenced at the University of Texas at El Paso’s Border Biomedical Research Center genomic analysis core facility with the same primers used for PCR. Bidirectional reads were screened for quality, assembled to an Amazona reference sequence (Table S3), and trimmed to the appropriate length to enable gene alignment using Sequencher v5.4.6 (Gene Codes Corporation, Ann Arbor, MI, U.S.). The individual gene alignments were concatenated into a supermatrix using the Bio.Nexus module from the Biopython project v1.76 [50]. Three outgroups used in the [36] analysis—A. kawalli, A. auropalliata, and A. amazonica—were included to root our phylogenetic tree and to provide a measure of relative genetic distance with which to compare recognized Amazona species to the clades within the mealy amazon species complex.
A maximum-likelihood phylogenetic analysis with rapid bootstrapping was performed on the concatenated gene alignment using RAxML-HPC v8.2.12 [51] and a GTRCAT model on XSEDE through the Cipres Science Gateway v3.3 [52]. The maximum likelihood, majority rule, best tree results and bootstrap values were visualized using FigTree v1.4.4 [53].
Two median joining haplotype networks [54] were constructed and visualized using PopART v1.7 [55]. The first network includes all of the available mitochondrial genes (12S, 16S, CytB, ND2) because we were able to obtain sequence data for both recognized species, at least four of the five subspecies (all minus virenticeps), and Atlantic Forest population of A. f. farinosa. The second network was created using only CytB data, as this most closely resembles the data set used by [36].

2.3. Genetic Differentiation

To quantify inter- and intraspecific genetic variation we calculated the between group mean genetic distance (i.e., the average number of nucleotide substitutions between clades) using the concatenated gene alignment and a p-distance model in MEGA X [56,57].

2.4. Acoustic Analysis

High-quality (i.e., low background noise, no signal overlap) contact calls were manually selected from the sound files using Raven Pro v1.5.0 (Cornell Laboratory of Ornithology, Ithaca, NY, U.S.). The accurate documentation of caller ID was lacking in most sound files with multiple calling individuals; therefore, only one call from one individual was randomly selected per call file. In call files where the researcher was able to identify more than one individual from counter-calling (i.e., the repeated, predictable response of a second individual to the calls of a first), one call was randomly selected from up to two individuals. In all, only one randomly selected high-quality (i.e., determined by each database to be “A” quality out of an A–F rating scale) call per individual was used in all downstream analyses. After call selection, the warbleR package v1.1.19 [58] in R v3.6.2 (The R Foundation) was used to perform additional quality control and data processing. Individual spectrograms were created with the ‘specreator’ function using a window length of 510 samples, a 90% overlap between windows, and a frequency limit of 0 kHz to 9kHz to reassess call quality. Poorly selected calls (i.e., calls where the temporal coordinates being read by a function did not match the actual start and end times of the calls) were reselected using the ‘seltailor’ function.
Differences in contact call structure between all populations were assessed both quantitatively and qualitatively. First, 26 acoustic parameter measurements—including various frequency and duration characteristics, entropy, skew, and kurtosis—were calculated for each call using the warbleR ‘specan’ function with a 90% overlap between windows and a bandpass filter from 0 kHz to 7 kHz (Table S5). The extracted data were then used in a principal component analysis performed with the ‘prcomp’ function from the base stats R package. The first two principal components were plotted to visualize the clustering patterns of calls by population. Next, the ‘xcorr’ function of the warbleR package was used to create a spectrographic cross-correlation matrix of all the calls. This matrix was transformed into distance measurements so that a multidimensional scaling analysis using the stats base package in R could be used to visualize the clustering patterns of calls by clade.
A Mantel test was performed using the vegan package v2.5-6 in R to determine whether the degree of genetic differentiation (measured as the average number of sequence differences) between clades correlates with vocal differentiation (measured as the average cross-correlation dissimilarity values).

3. Results

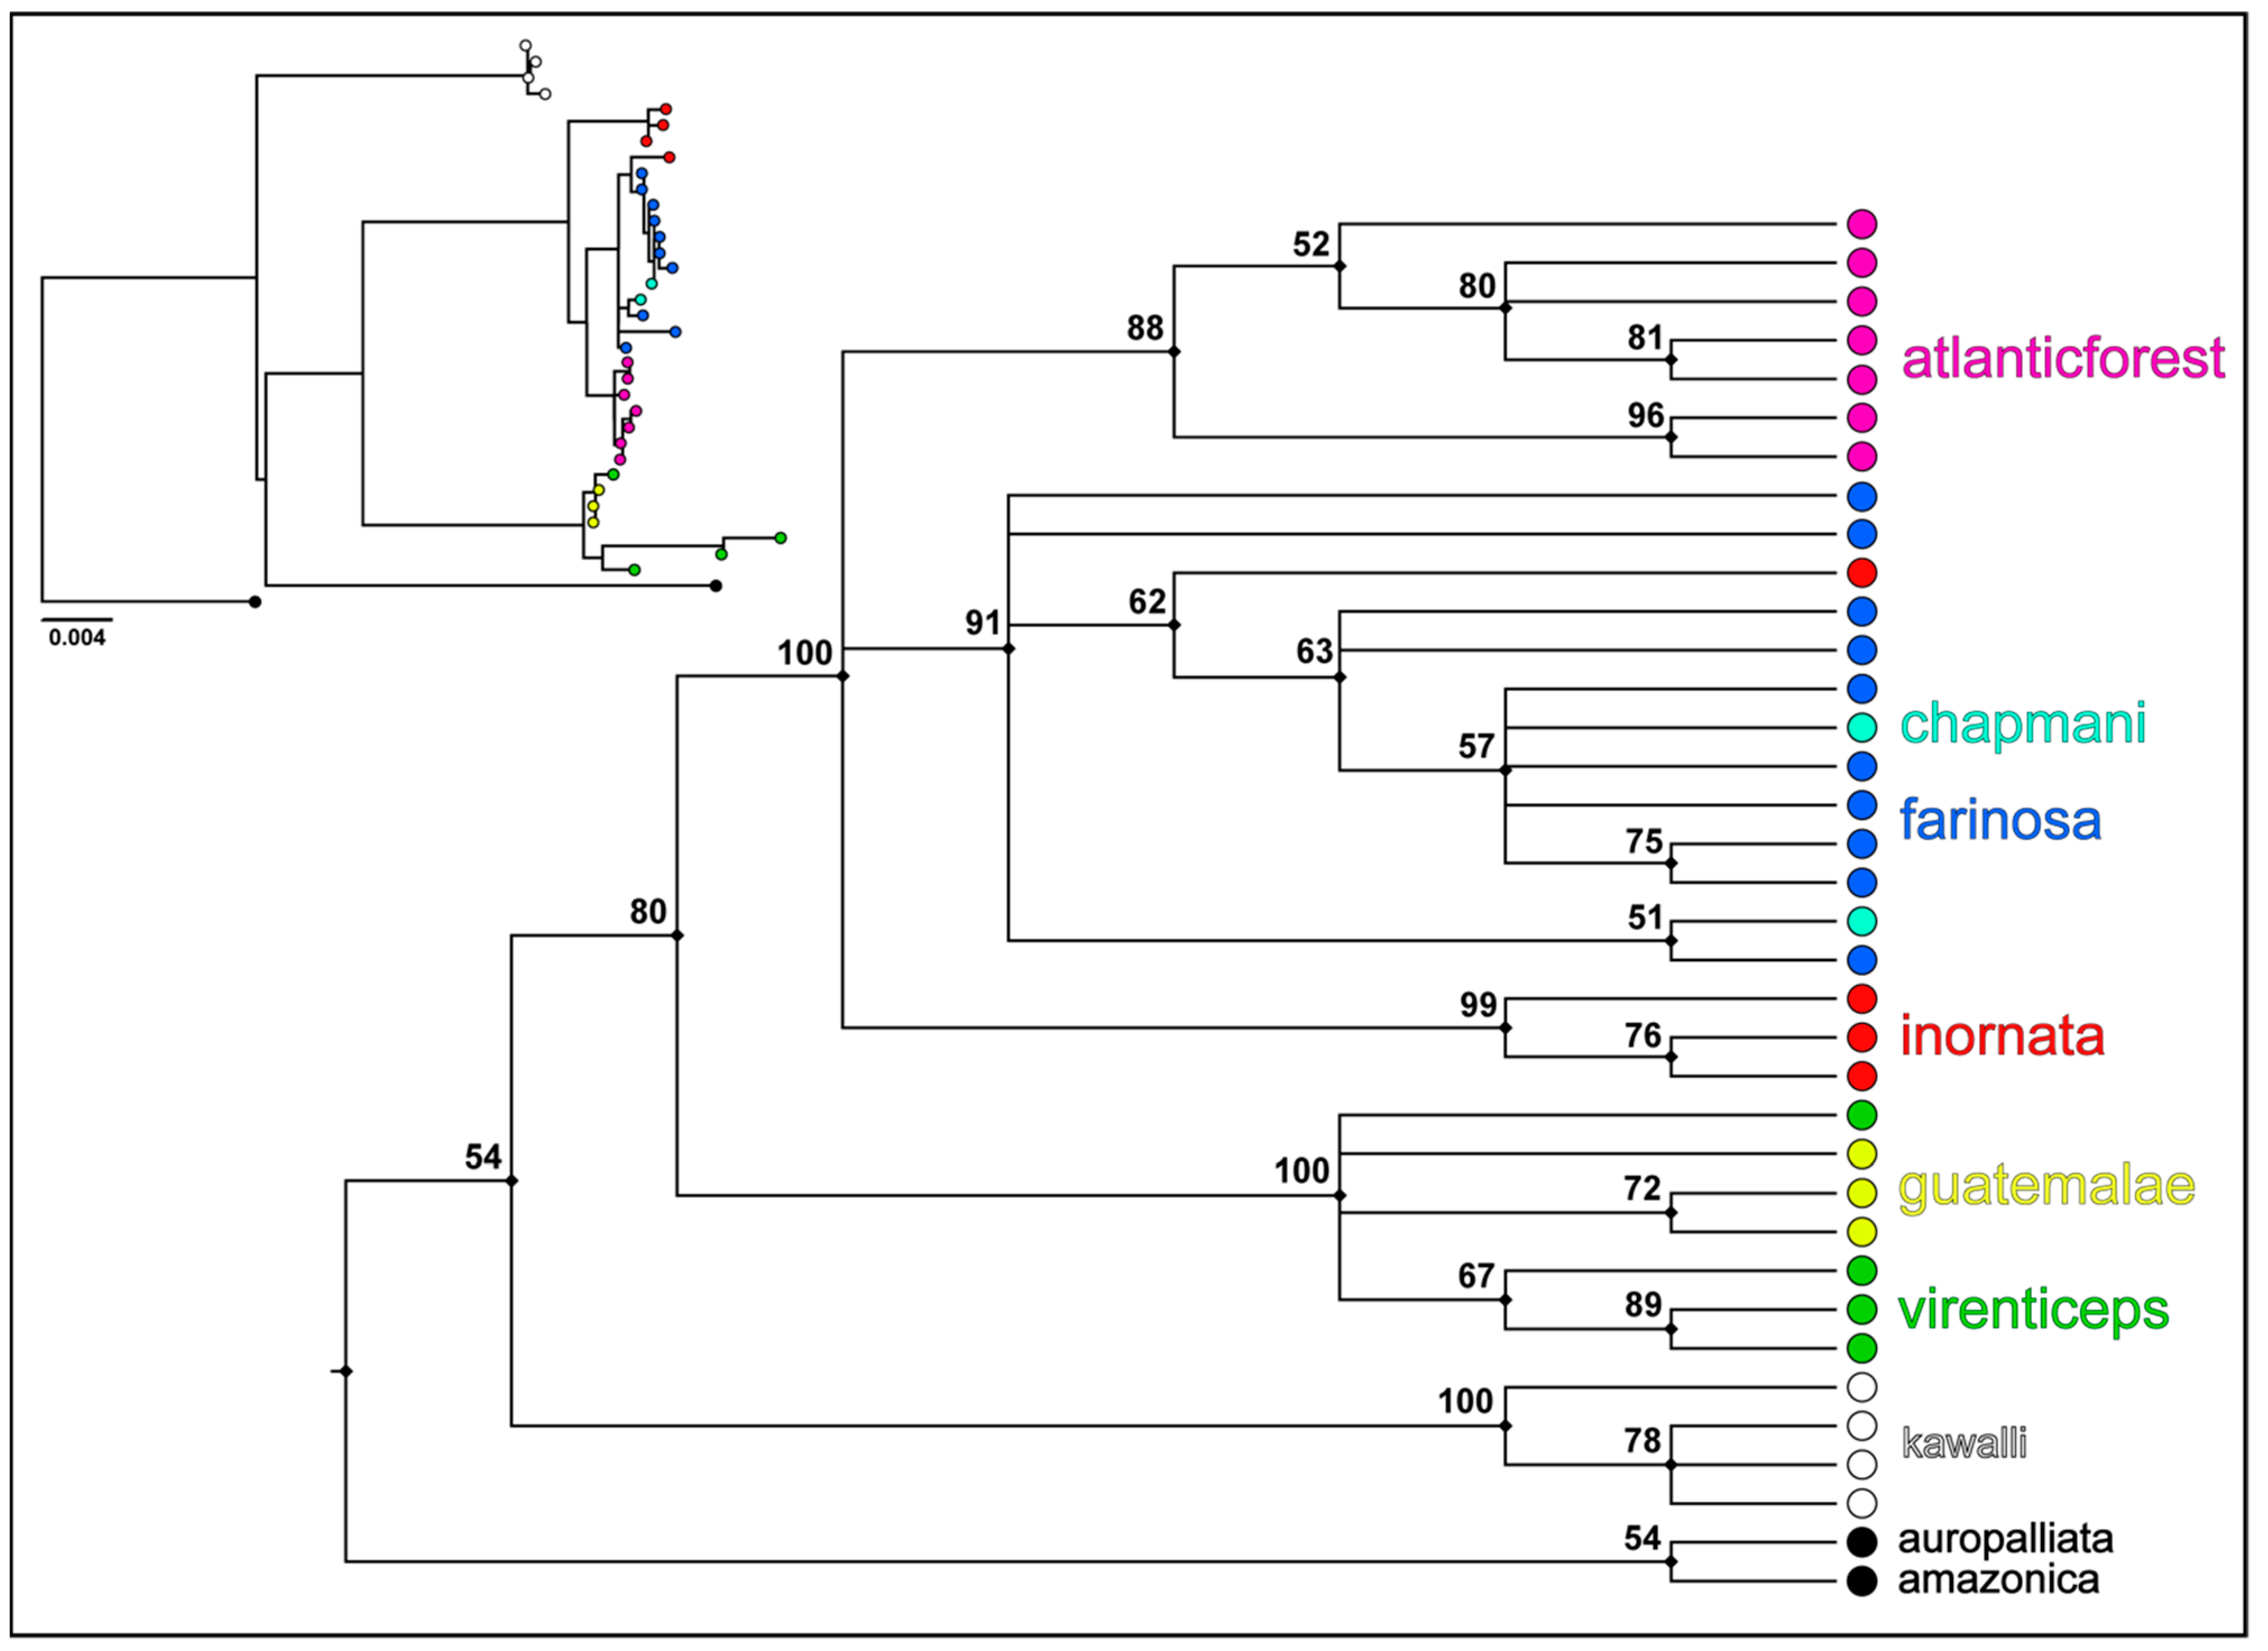
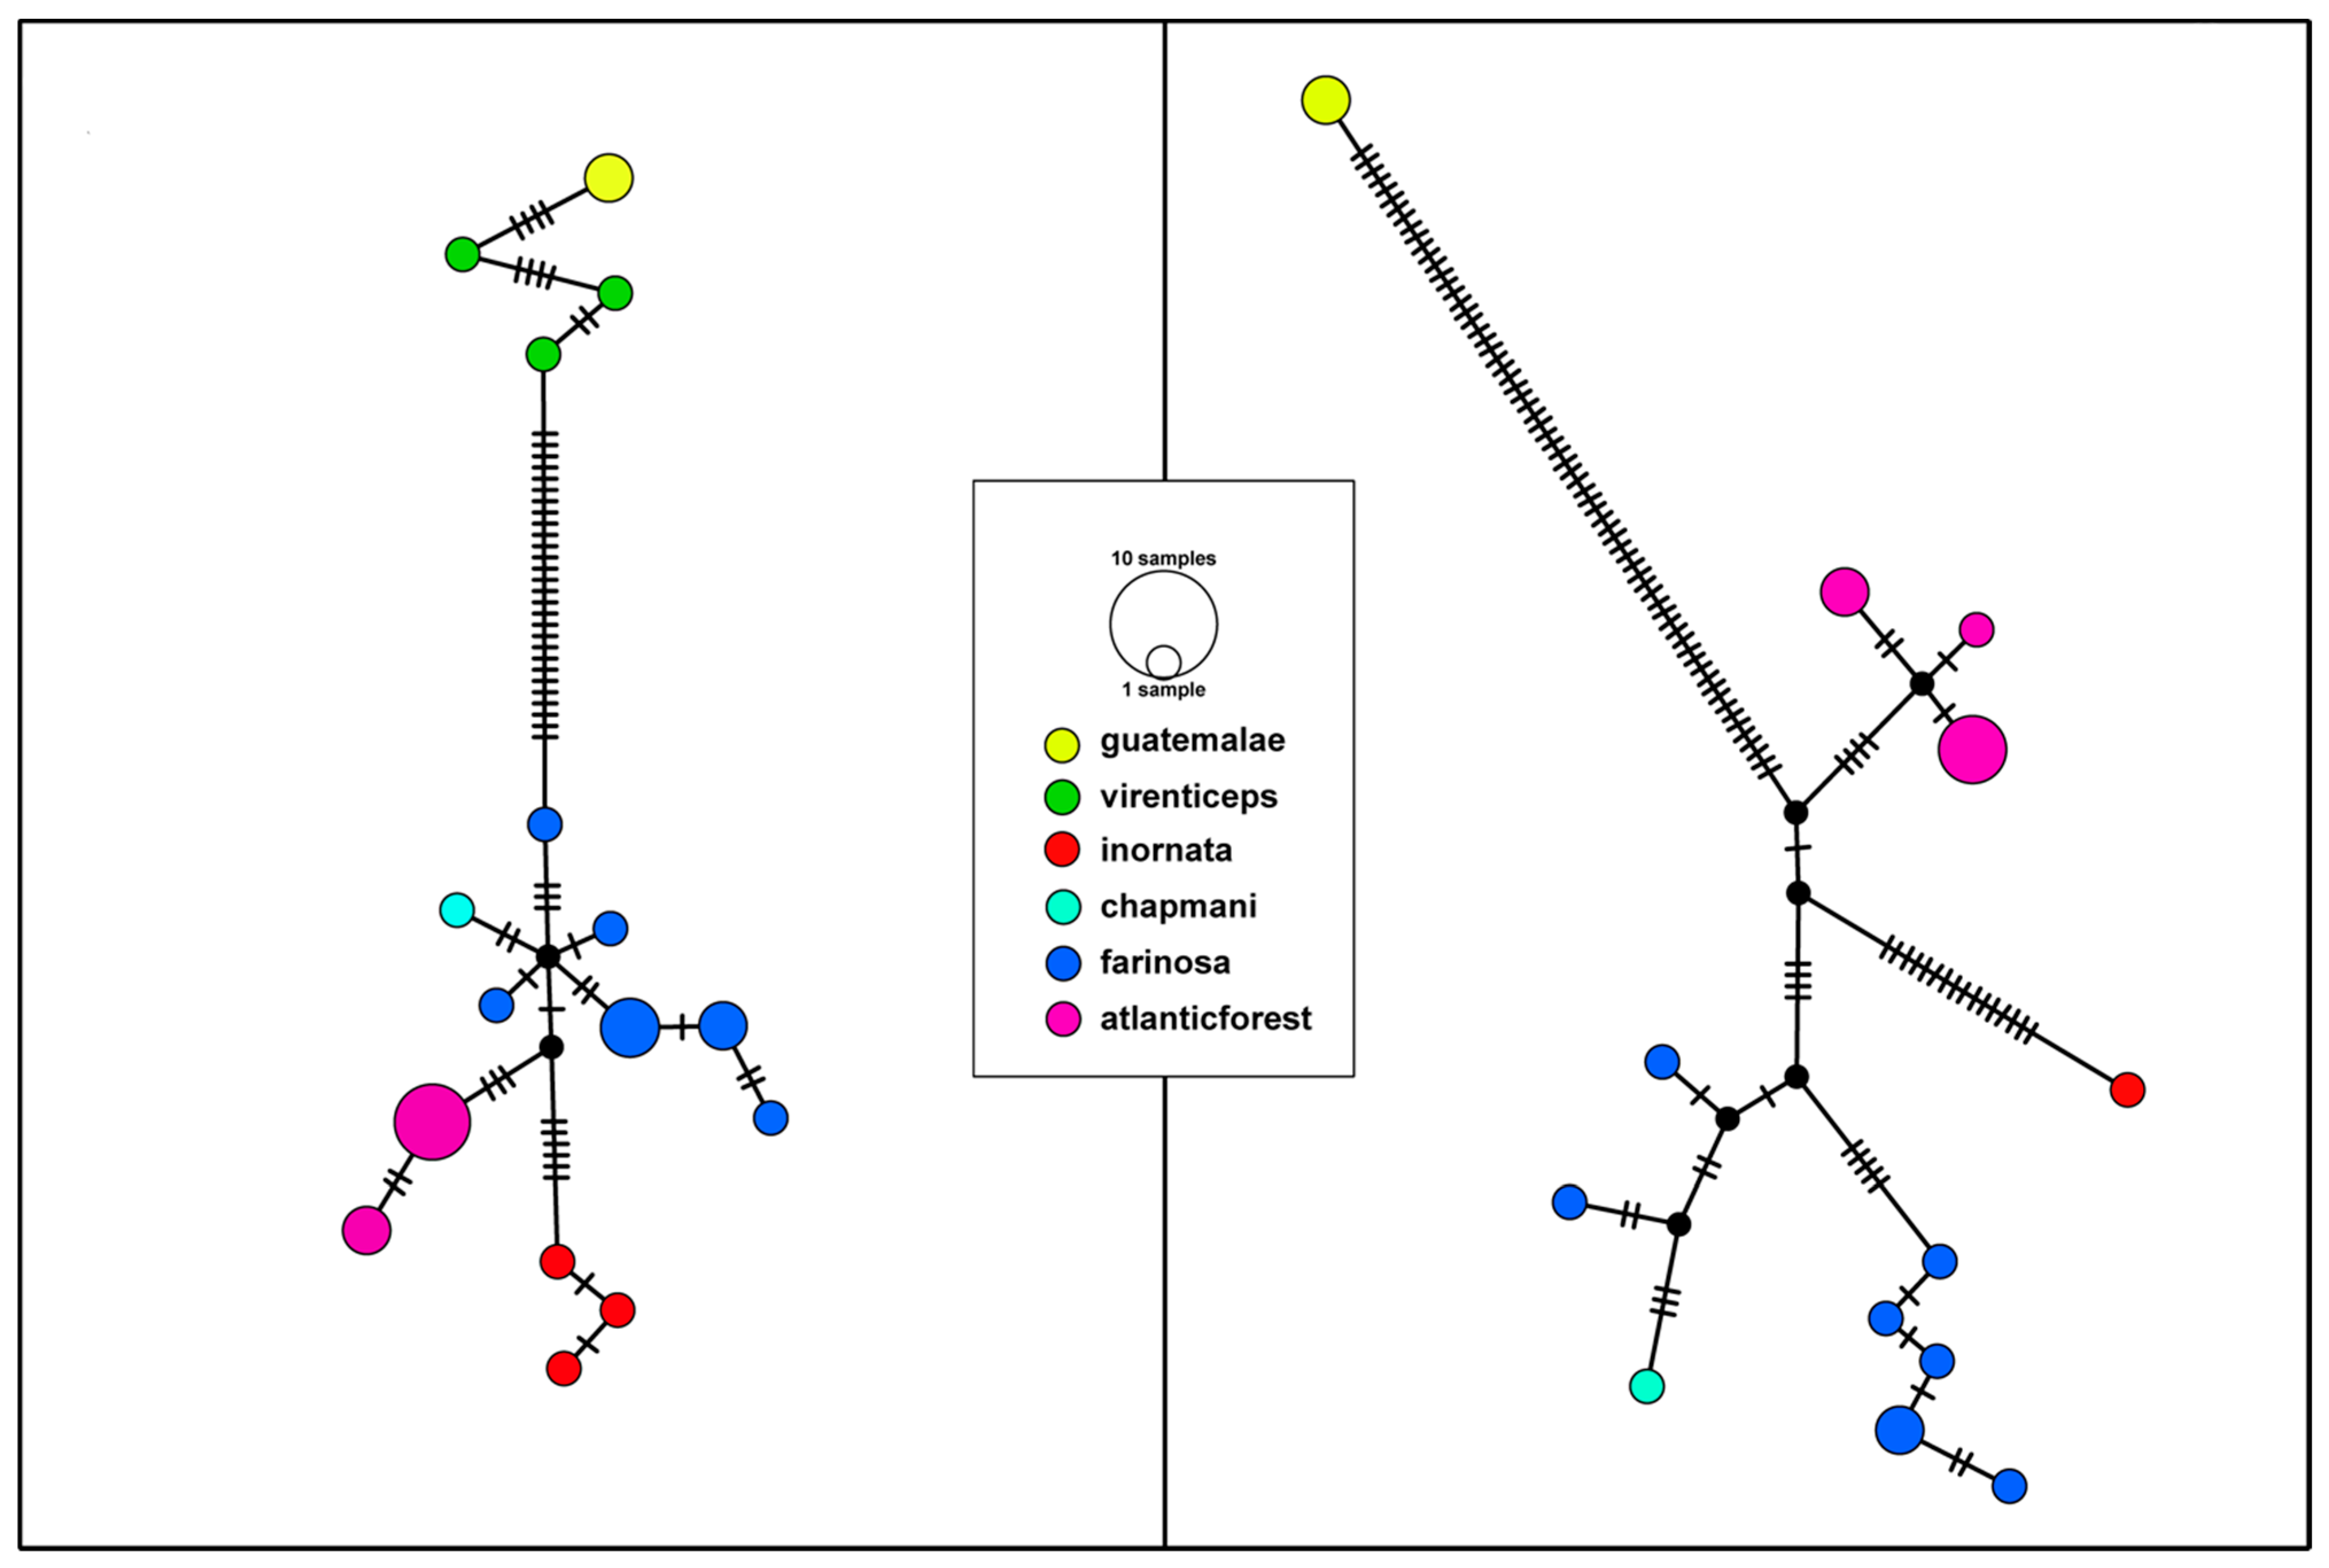
3.1. Phylogenetic Tree and Haplotype Network

A total of 3444 bp from 6 genes (393 bp of 12S, 525 bp of 16S, 868 bp of CytB, 510 bp of ND2, 625 bp of TGFB2, 523 bp of TROP) were included in the maximum-likelihood phylogenetic analysis, though not all genes were able to be sequenced for every individual; see Table S3 for a complete list genes per individual. Notably, the forward reads for COI failed to sequence for all of the Atlantic Forest A. f. farinosa samples, so this gene was removed from the analysis. With the addition of the ND2 mtDNA sequence and the exclusion of the COI mtDNA sequence, the topology of our maximum likelihood majority rule consensus tree is nearly identical to the phylogeny reported by the original [36] study for taxa included in both studies (Figure 2). The Atlantic Forest population of A. f. farinosa is recovered as a monophyletic group sister to the assemblage that includes the three recognized subspecies of A. farinosa (A. f. inornata, A. f. chapmani, and A. f. farinosa). This group does not, however, show the same level of genetic differentiation as the two currently recognized species of mealy amazon (A. guatemalae and A. farinosa; see insert of Figure 2).
The median joining haplotype network created using the CytB data returned a total of 16 haplotypes, with 28 sequence differences between the northern and southern species and 5 sequence differences between the Atlantic Forest populations of A. f. farinosa and their closest Amazon basin A. f. farinosa relative (Figure 3). In addition, the Atlantic Forest populations form a distinct cluster within the greater southern mealy amazon cluster. The haplotype network created with the reduced dataset of the four mitochondrial genes shows a similar pattern. Thirteen haplotypes were recovered, with 67 sequence differences separating the northern and southern mealy amazon species haplotypes and 10 sequence differences separating the Atlantic Forest populations of A. f. farinosa from their closest relative from the Amazon basin population of A. f. farinosa (Figure 3). This network lacks a representative of the A. g. virenticeps northern mealy amazon subspecies (Table S3) due to an insufficient amount of sequence data for the analysis software. However, we assume any virenticeps individuals would be closely related to the other northern mealy amazon subspecies A. g. guatamalae based on the topology of the CytB network. Together, these results consistently show that the Atlantic Forest population is a distinct group when compared to the other A. farinosa subspecies, albeit one that lacks the genetic distinctiveness of previously recognized full species.

3.2. Genetic Differentiation

Between-group mean genetic distances based on data from all genes included in this study indicate 2.9% average sequence divergence between northern and southern mealy amazon subspecies, compared to 0.4% average sequence divergence between southern mealy amazon subspecies (including the Atlantic Forest population of A. f. farinosa) and 0.3% average sequence divergence between northern mealy amazon subspecies.

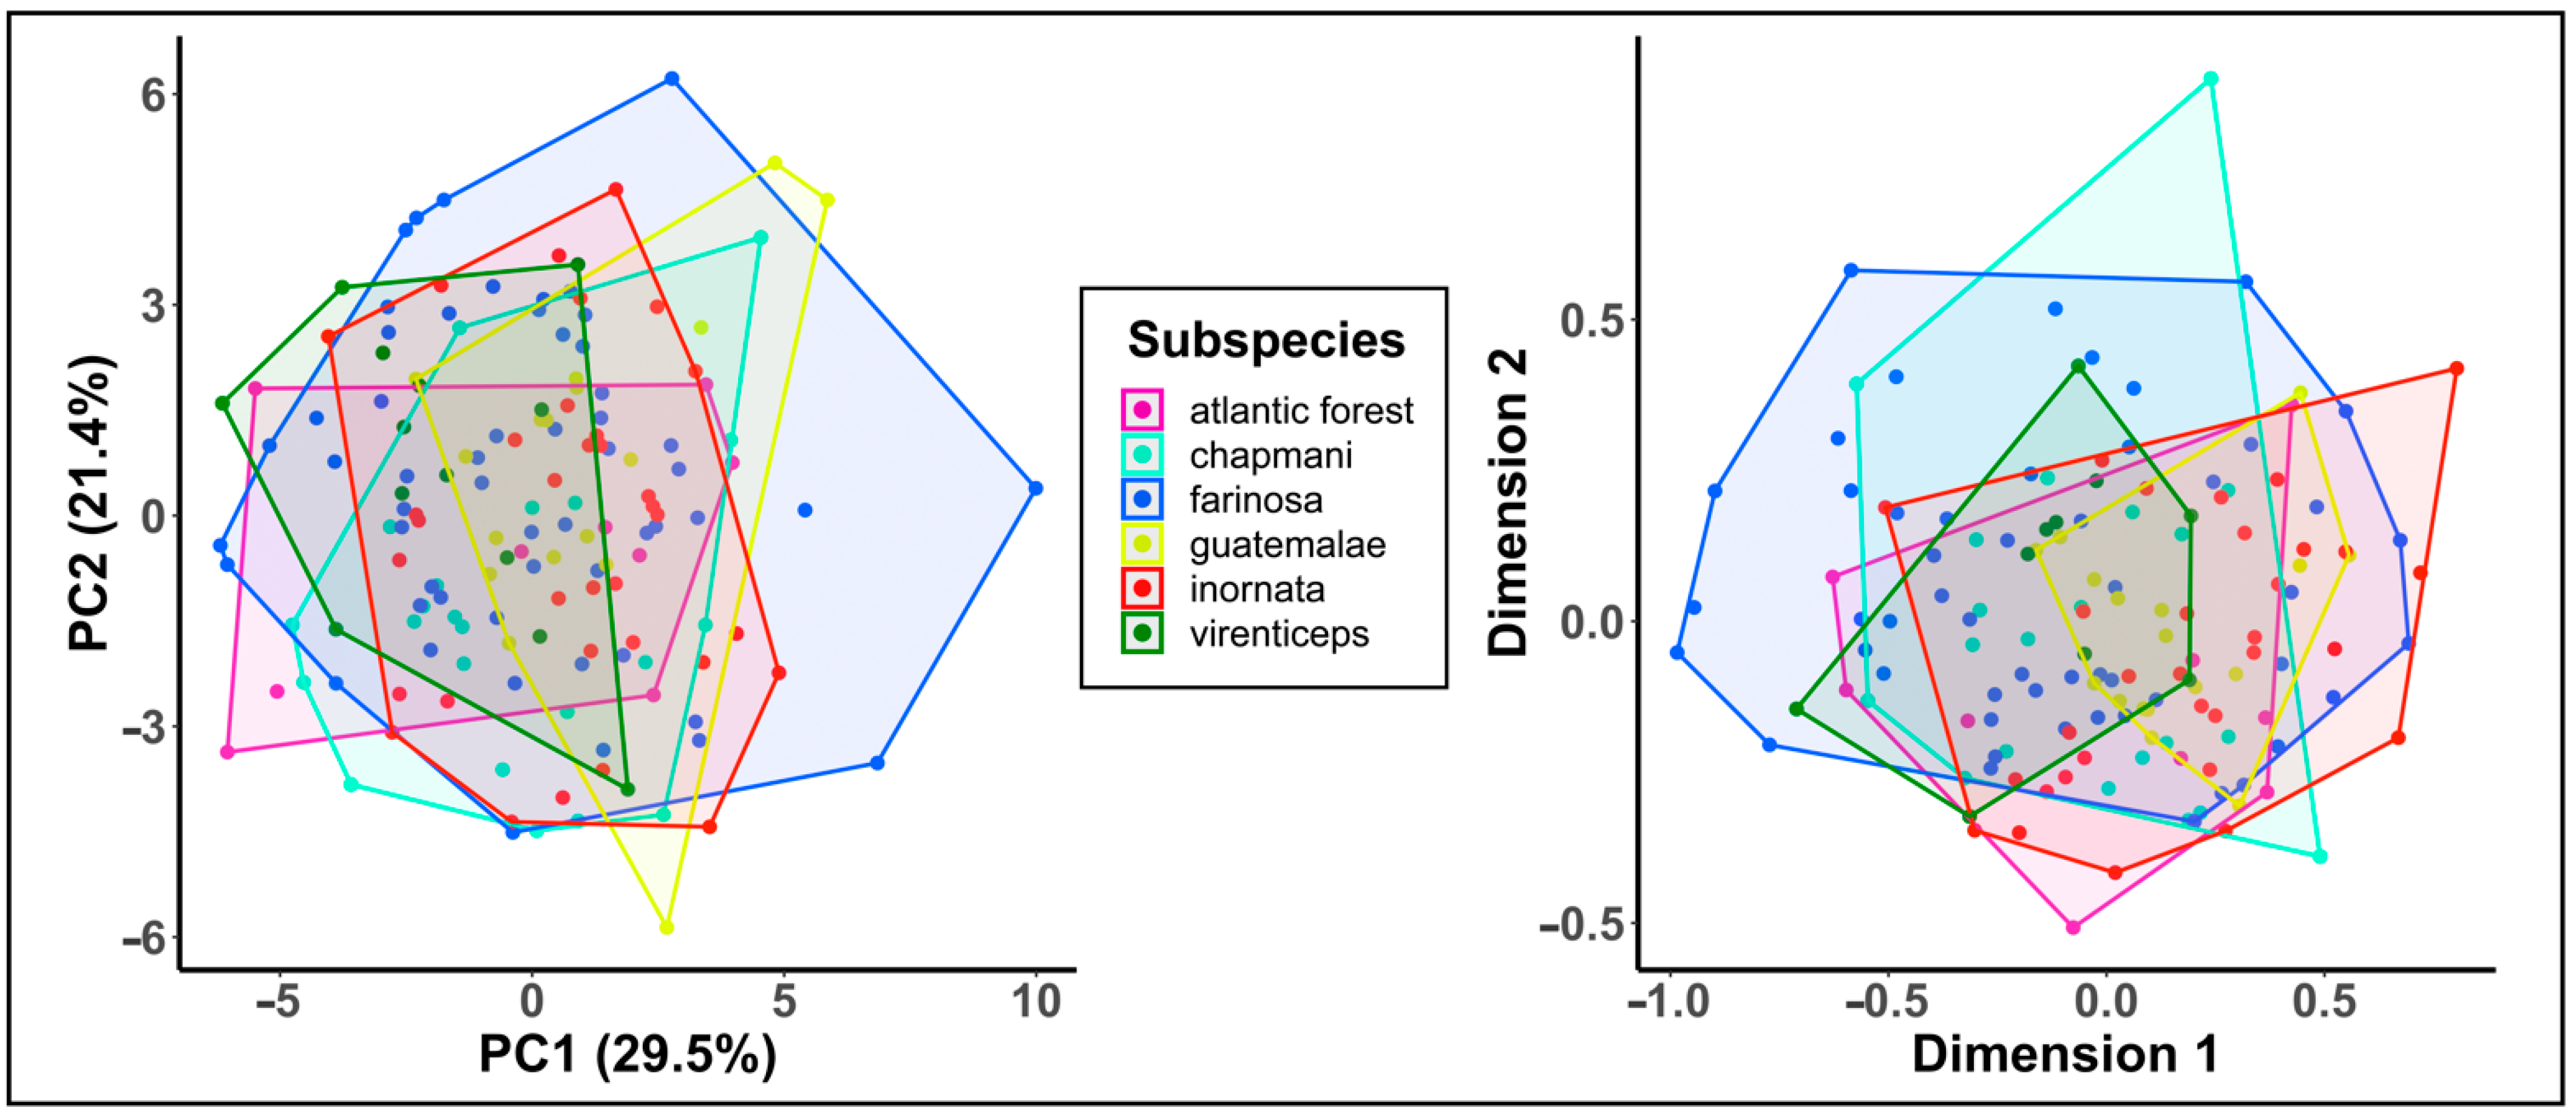
3.3. Call Similarity between Subspecies

A total of 150 calls (110 from the Macaulay Library and 40 from Xeno-canto) were used in our analysis of call similarity between the 5 recognized mealy amazon subspecies and the Atlantic Forest population of A. f. farinosa. Sampling locations and spectrograms of representative calls from each subspecies are shown in Figure 1. An initial visual inspection of the call spectrograms suggested there is some variation in the structure of contact calls between subspecies (Figure 1), however, plots of the first two components from a principal component analysis of acoustic parameter measurements and a multidimensional scaling analysis of the spectrographic cross-correlation matrix did not reveal distinct clusters of calls among the subspecies. Instead, we saw significant overlap of each clades’ calls in acoustic space (Figure 4) due to a large amount of variation in calls within each subspecies. This pattern suggests that (a) substantial structural differences exist across each subspecies’ range (e.g., the three example spectrograms of the A. f. farinosa subspecies of southern mealy amazon in Figure 1), and (b) variation within a subspecies is as great as variation among subspecies (Figure 4).

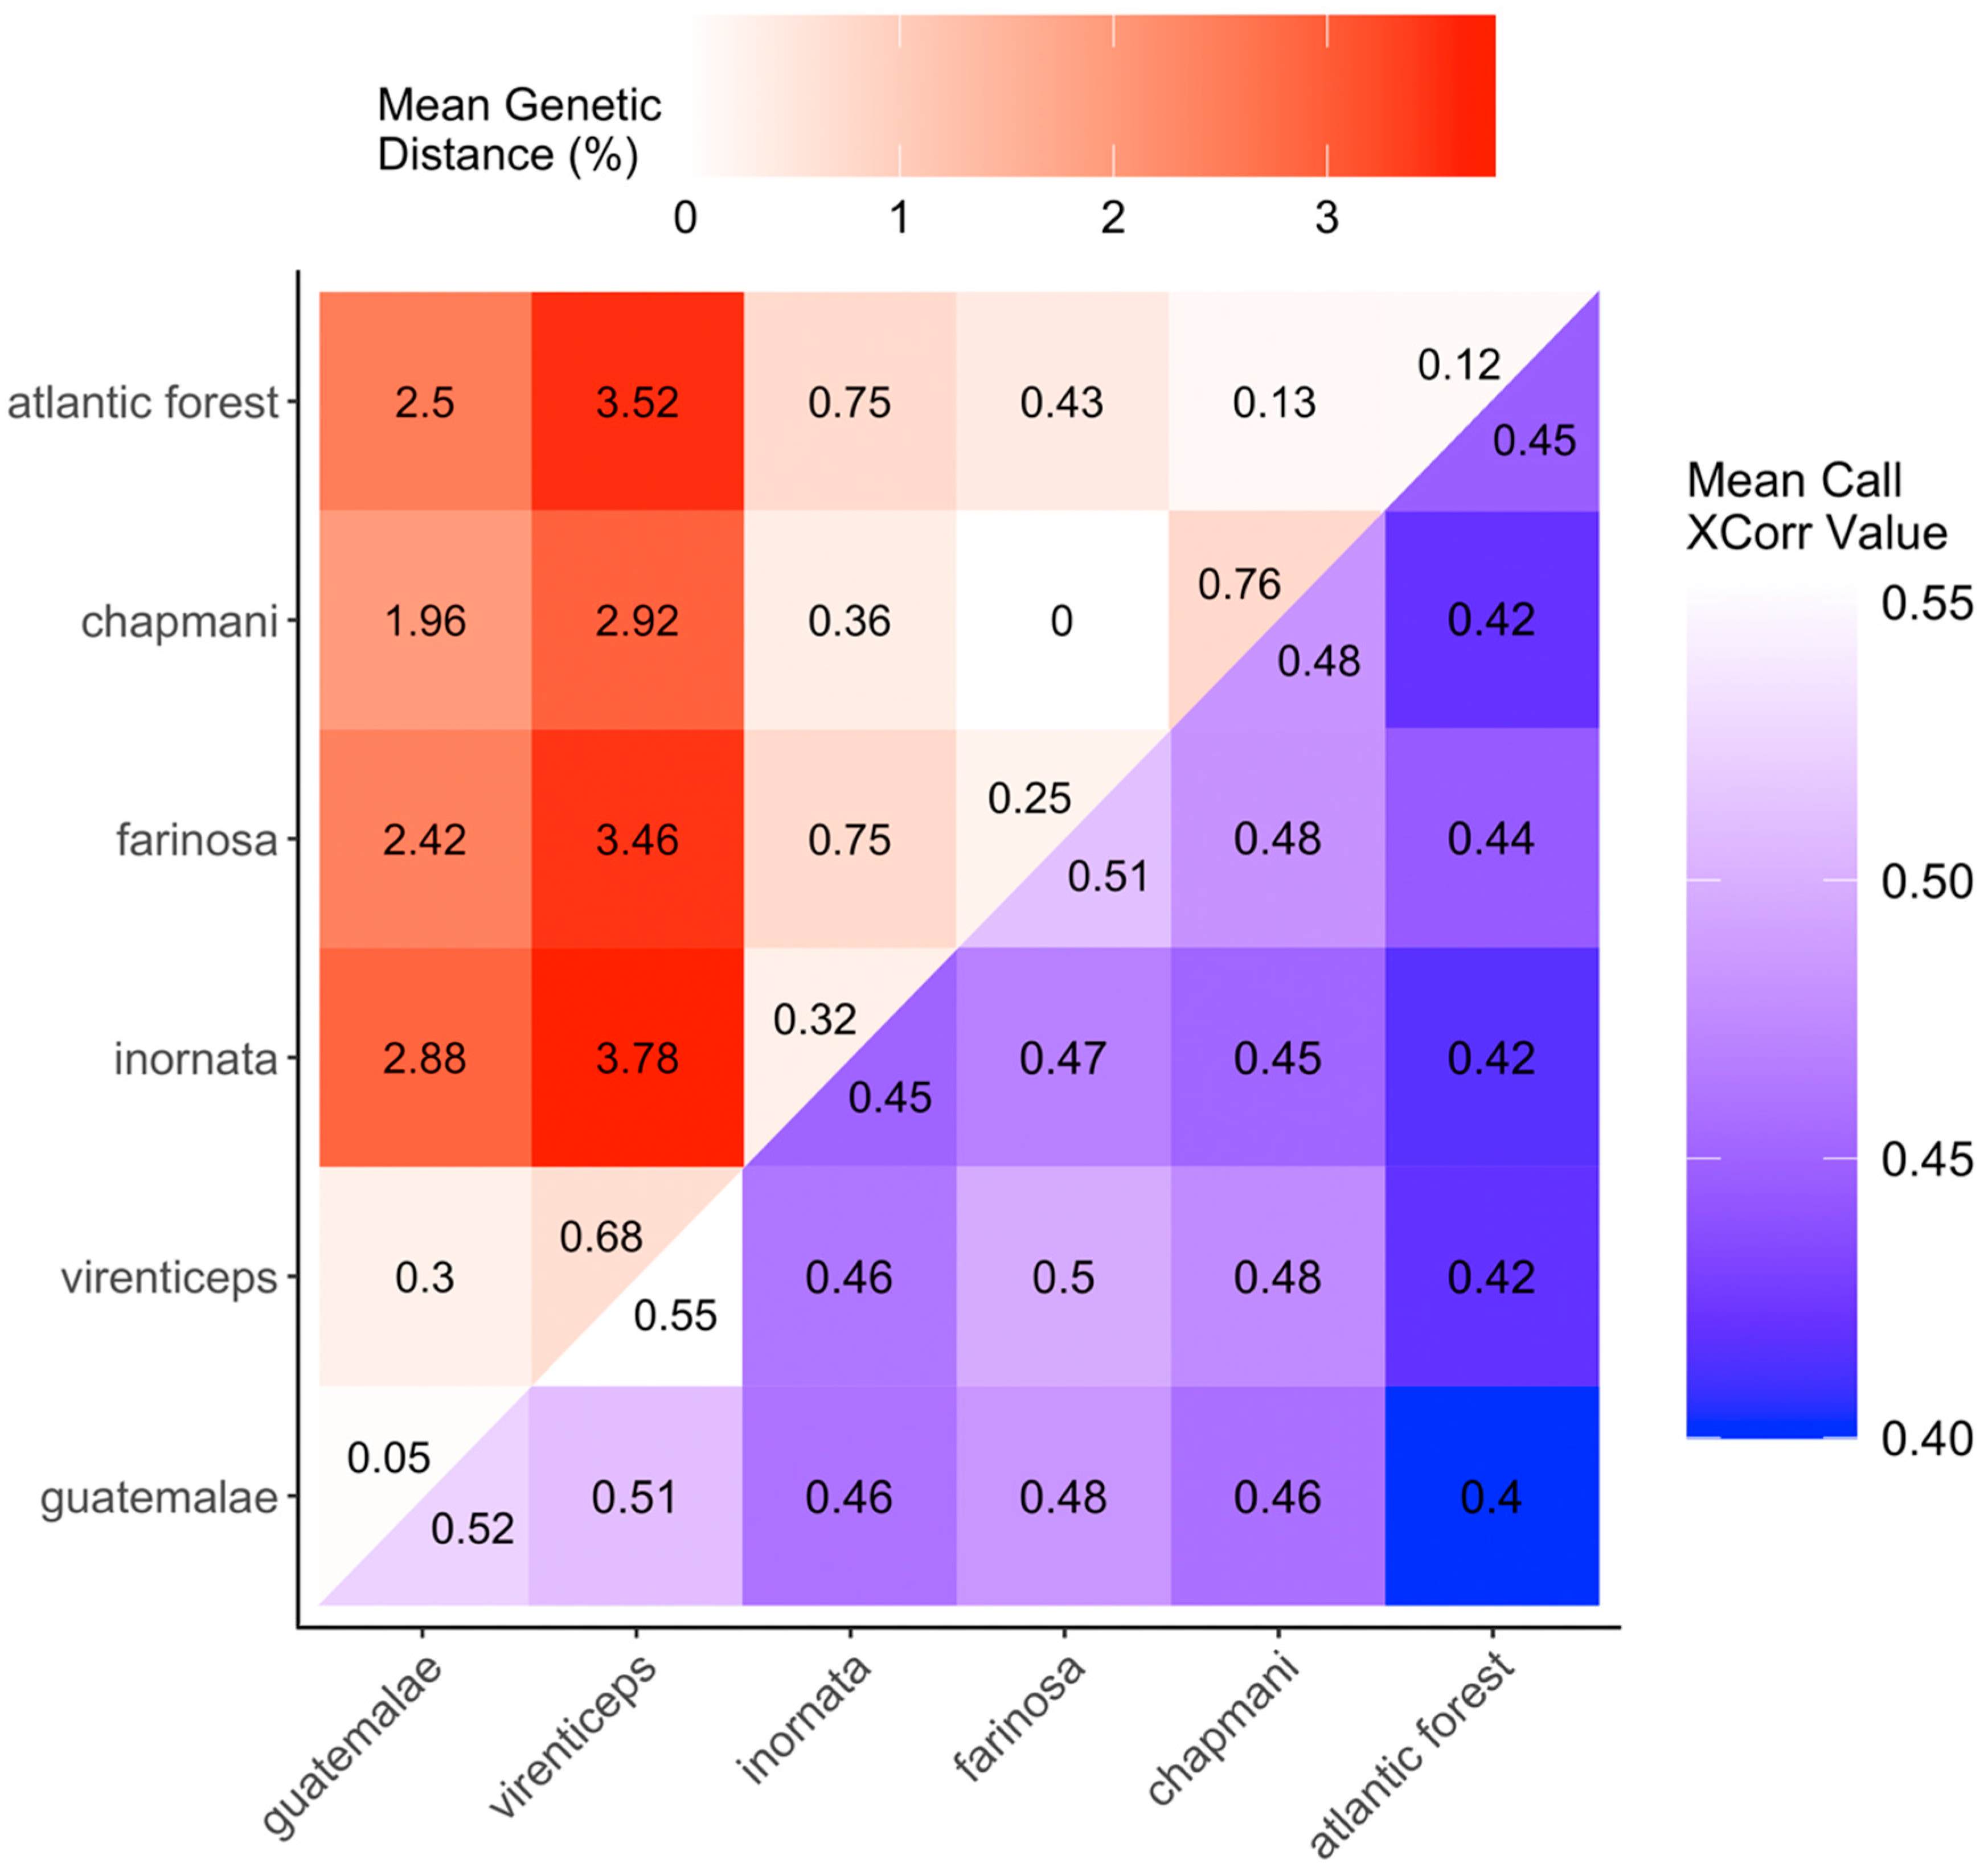
3.4. Assessment of Genetic Distance and Vocal Divergence

A qualitative assessment of the relationship between group mean genetic distance and average cross-correlation vocal similarity among clades of A. farinosa and A. guatemalae (Figure 5) showed no clear pattern of association. This apparent lack of a correlation between vocal and genetic differentiation was supported by the Mantel test, which did not detect any statistical association between the two matrices (Mantel test: r = −0.012, matrix size = 6 clades, p = 0.451).

4. Discussion

We expanded upon a genetic dataset representing all recognized subspecies of the mealy amazon species complex to examine their relationships to the disjunct Atlantic Forest population of A. f. farinosa. In addition, we examined contact call similarity within and between these groups to determine if variation in this behavioral trait was correlated with underlying genetic structure. We found that while the Atlantic Forest population is recovered as a distinct clade, the degree of genetic differentiation between this population and the Amazon basin population of A. f. farinosa is substantially less than the degree of separation between the recognized northern and southern mealy amazon species. We also found that variation in a learned behavioral trait did not correlate to underlying genetic population structure. We discuss these results and their conservation implications in more detail below.

4.1. Genetic Relationships of the Mealy Amazon Clades

Our phylogeny and haplotype networks suggest that while the Brazilian Atlantic Forest population of A. f. farinosa is genetically and geographically distinct from other populations and subspecies of A. farinosa, it is not genetically distant enough to be considered a third cryptic species within the mealy amazon species complex. Specifically, the between-group genetic distances for the three recognized southern mealy amazon subspecies and Atlantic Forest population had a range of 0.13–0.75% compared to genetic distances with a range of 1.9–3.8% between the northern and southern mealy amazon subspecies. Based on the magnitude of difference between the recently reclassified northern and southern mealy amazon species, we conclude that the Atlantic Forest population is best considered a genetically distinct population warranting formal recognition as a subspecies within the A. farinosa species.
Other studies aiming to identify potential cryptic species in parrots have employed comparable thresholds at which a genetically distinct clade should be considered a new subspecies or full cryptic species. In studies of three populations of the Cuban parrot subspecies Amazona leucocephala bahamensis, researchers concluded that sequence differences of 1.7–2.2% in the CR1 region warranted a subspecies designation for the Abaco phylogenetic species [33]. In the mulga parrot Psephotellus varius, an average sequence difference of 1.9% in the majority of the mitogenome (~84%) between the eastern and western populations was also justification for an elevation of the populations to separate subspecies [34]. The same conclusion was reached for northern and southern subspecies of the scarlet macaw (Ara macao) showing a 1.8% average sequence difference in a combined dataset of 12S, 16S, COI, and CytB [59], and for three recognized species within the Amazona ochrocephala complex with only 2% sequence differences in a combined dataset of ATP synthase 6 and 8, COI, ND2, and CytB despite their varied morphology [60]. In contrast, the authors of a study finding 4.4–5.1% sequence divergence in CytB between eastern and western populations of the ground parrot (Pezoporus wallicus) concluded that the western population should be reclassified as a new, cryptic species [35]. While the results of these studies are not directly comparable due to the various genes and analysis models used, the relative sequence differences serve as useful benchmarks when we consider the threshold at which a genetically distinct population is assigned a new taxonomic status. We should note that the range of genetic distances between the Atlantic Forest population of A. f. farinosa and all other A. farinosa subspecies for the CytB gene alone (0.76–0.99%) is equivalent to the interspecific ranges previously calculated for CytB in 88 avian genera [61]. However, given our more extensive data set and the established level of sequence divergence between the northern and southern mealy amazon species, we do not believe the Atlantic Forest population merits classification as a full species.
While it is likely our results represent the true phylogenetic relationship between the Atlantic Forest and Amazon basin populations of A. f. farinosa, there is a possibility our data suffer from a lack of geographic sampling diversity from the Atlantic Forest population (i.e., all individuals sampled originated from the same location). Wider geographic sampling of the mealy amazon across the Atlantic Forest may reveal additional genetic structure between populations within the Atlantic Forest (e.g., between the north-eastern region of the Atlantic Forest, often referred to as the Pernambuco Center of Endemism, and the southern or central regions of the Atlantic Forest) as well as between A. f. farinosa populations in the Amazon basin and Atlantic Forest. Patterns of intraspecific genetic differentiation within the Atlantic Forest are seen in other avian [62,63,64] and non-avian taxa [65] within the Atlantic Forest, and may be driven by the historic expansion of species from the Amazon basin to the central Atlantic Forest through gallery forests of the Cerrado region [42,66,67] or the relative stability and connectivity of the central and western regions of the Atlantic Forest in relation to historical climate patterns [68,69].

4.2. Utility of Behavioral Variation for Detecting Cryptic Species

The second goal of our study was to evaluate the potential utility of vocalization data in the identification of cryptic species. Given that behavioral data can often be collected with relative ease and at a very low cost, we aimed to determine whether variation in call structure correlated with genetic variation among groups. Such a relationship has been observed for a number of songbird species such as the variable antshrike (Thamnophilus caertulescens), red crossbill (Loxia curvirostra), and greenish warbler (Phylloscopus trochiloides) [13,14,15,16]. However, parrots and other open-ended vocal learners are able to alter their calls into adulthood, a phenomenon that may potentially lead to rapid call divergence or convergence irrespective of the underlying genetic structure of a population. For example, individually distinct call signatures may promote the recognition of social group members in fission–fusion societies and lead to a wide distribution of calls across the available acoustic space of a species or population [70]. Alternatively, because convergence on local call types (i.e., vocal dialects) signals group membership, the increased flexibility provided by open-ended learning may facilitate social integration throughout an individual’s lifetime, especially after dispersal to unrelated populations [24], leading to an overall reduction in the total number of call types in a species or population.
Our results do not indicate a high degree of differentiation in contact call structure amongst groups. Cluster plots of each subspecies calls indicate substantial overlap of call structure and call features in acoustic space, and no correlation of call similarity with genetic structure (e.g., average cross-correlation similarity value for the Atlantic Forest population of A. f. farinosa and closely related A. f. chapmani is nearly identical, 0.419, to the similarity value of the Atlantic Forest population of A. f. farinosa and A. g. virenticeps, 0.418, from the northern species). Similarly, in yellow-naped amazons (Amazona auropalliata), a species well known for its regionally distinct vocal dialects, call diversity is unlinked to the underlying population genetic structure, indicating a strong preference of individuals to conform to local call types after dispersal or movement across dialect boundaries [71]. In contrast, the crimson rosella (Platycercus elegans) is one parrot species that shows clinal variation in their vocalizations and microsatellite genetic data [72]. Songbirds such as the white-crowned sparrow (Zonotrichia leucophrys) and suboscine passerines such as the variable antshrike (Thamnophilus caerulescens), which use innate vocalizations, also show greater correlation between acoustic and genetic variation [15,73,74], though this is not a consistent trend amongst all species (e.g., [65]).
Potential methodological limitations to our current study include inconsistencies in the quality and quantity of the available data from citizen science databases (e.g., lack of standardized recording protocols, variation in the type of recording equipment used, the unequal spatial distribution of sampling across each population’s range). In addition, the call data were collected over a substantial timeframe (1950s to 2010s). Both factors may mask patterns of variation at the regional versus the subspecies level if call structures have changed over the decades or if information was lost in poor-quality recordings. These issues might be remedied by more aggressive pre-analysis filtering of the available data; however, attempting to apply stricter quality standards to our study led to a severe reduction in sample size that would have inhibited our current analyses. Overall, we suggest that vocalizations may be less useful as tools in the identification of cryptic species when those species are open-ended vocal learners, though further study is warranted.

4.3. Conservation Implications

Typically, conservation action is focused at the species level, creating a critical need for understanding the true relationship of disjunct and vulnerable populations to the species as a whole. In the case of the Atlantic Forest population of A. f. farinosa, our results do not support an elevation in species status but do indicate this population represents a unique pool of genetic diversity within the mealy amazon species complex. Currently, it is estimated that 7–16% of historic Atlantic Forest cover remains, and rates of habitat degradation or destruction have increased significantly in the past three decades [48,49], leading to restrictions in the ranges of local mealy amazon populations and increased conflict with humans (A. Saidenberg, unpublished data). Shrinking refuges could further endanger a population that, like most large parrot species, is already facing substantial threats from poaching and harvest for the pet trade [26,27]. For these reasons, we advocate for the special consideration of the Atlantic Forest population of mealy amazons in conservation and management decisions for the species, including the formal recognition of this population as a subspecies of the southern mealy amazon. Finally, we strongly encourage the continued study of parrot species complexes to help identify additional taxonomic groups warranting classification and protection.

Supplementary Materials

The following are available online at https://www.mdpi.com/article/10.3390/d13060273/s1, Table S1: Metadata and gene regions sequenced of the samples used in this study. Table S2: Metadata for the sound files used in this study. Table S3: Primer sequences used to amplify and sequence the gene regions used in this study. Table S4: Genbank accession numbers for new Atlantic forest A. f. farinosa gene sequences used in this study. Table S5: Acoustic parameters generated by the ‘specan’ function and used in our principal component analysis.

Author Contributions

Conceptualization, T.F.W. and A.B.S.S.; methodology, T.F.W. and D.L.H.; formal analysis, D.L.H.; resources, T.F.W. and A.B.S.S.; data curation, D.L.H.; writing—original draft preparation, D.L.H.; writing—review and editing, D.L.H., T.F.W., and A.B.S.S.; funding acquisition, T.F.W. All authors have read and agreed to the published version of the manuscript.

Funding

This research was funded by the World Parrot Trust.

Institutional Review Board Statement

Not applicable.

Informed Consent Statement

Not applicable.

Data Availability Statement

The data presented in this study are available in the article and supplementary materials file.

Acknowledgments

The authors would like to thank C. Campos for lab training, A. Betancourt and N. Joffe for sequencing and troubleshooting, and S. Davino and P. Melero from ASM Cambaquara for their help and logistical support.

Conflicts of Interest

The authors declare no conflict of interest. The funders had no role in the design of the study; in the collection, analyses, or interpretation of data; in the writing of the manuscript, or in the decision to publish the results.

References

  1. Struck, T.H.; Feder, J.L.; Bendiksby, M.; Birkeland, S.; Cerca, J.; Gusarov, V.I.; Kistenich, S.; Larsson, K.H.; Liow, L.H.; Nowak, M.D.; et al. Finding evolutionary processes hidden in cryptic species. Trends Ecol. Evol. 2018, 33, 153–163. [Google Scholar] [CrossRef] [Green Version]
  2. Bickford, D.; Lohman, D.J.; Sodhi, N.S.; Ng, P.K.L.; Meier, R.; Winker, K.; Ingram, K.K.; Das, I. Cryptic species as a window on diversity and conservation. Trends Ecol. Evol. 2007, 22, 148–155. [Google Scholar] [CrossRef] [PubMed]
  3. Angulo, A.; Icochea, J. Cryptic species complexes, widespread species and conservation: Lessons from Amazonian frogs of the Leptodactylus marmoratus group (Anura: Leptodactylidae). Syst. Biodivers. 2010, 8, 357–370. [Google Scholar] [CrossRef]
  4. Davidson-Watts, I.; Walls, S.; Jones, G. Differential habitat selection by Pipistrellus pipistrellus and Pipistrellus pygmaeus identifies distinct conservation needs for cryptic species of echolocating bats. Biol. Conserv. 2006, 133, 118–127. [Google Scholar] [CrossRef]
  5. Delić, T.; Trontelj, P.; Rendoš, M.; Fišer, C. The importance of naming cryptic species and the conservation of endemic subterranean amphipods. Sci. Rep. 2017, 7, 1–12. [Google Scholar] [CrossRef]
  6. Wilkins, M.R.; Seddon, N.; Safran, R.J. Evolutionary divergence in acoustic signals: Causes and consequences. Trends Ecol. Evol. 2013, 28, 156–166. [Google Scholar] [CrossRef] [PubMed]
  7. Jones, G. Acoustic signals and speciation: The roles of natural and sexual selection in the evolution of cryptic species. Adv. Study Behav. 1997, 26, 317–354. [Google Scholar] [CrossRef]
  8. Thabah, A.; Rossiter, S.J.; Kingston, T.; Zhang, S.; Parsons, S.; Mya, K.M.; Akbar, Z.; Jones, G. Genetic divergence and echolocation call frequency in cryptic species of Hipposideros larvatus s.l. (Chiroptera: Hipposideridae) from the Indo-Malayan region. Biol. J. Linn. Soc. 2006, 88, 119–130. [Google Scholar] [CrossRef] [Green Version]
  9. Kingston, T.; Lara, M.C.; Jones, G.; Akbar, Z.; Kunz, T.H.; Schneider, C.J. Acoustic divergence in two cryptic Hipposideros species: A role for social selection? Proc. R. Soc. B Biol. Sci. 2001, 268, 1381–1386. [Google Scholar] [CrossRef] [Green Version]
  10. Braune, P.; Schmidt, S.; Zimmermann, E. Acoustic divergence in the communication of cryptic species of nocturnal primates (Microcebus ssp.). BMC Biol. 2008, 6, 9–11. [Google Scholar] [CrossRef] [Green Version]
  11. Henry, C.S.; Brooks, S.J.; Duelli, P.; Johnson, J.B. Discovering the true Chrysoperla carnea (Insecta: Neuroptera: Chrysopidae) using song analysis, morphology, and ecology. Ann. Entomol. Soc. Am. 2006, 95, 172–191. [Google Scholar] [CrossRef] [Green Version]
  12. Funk, C.W.; Caminer, M.; Ron, S.R. High levels of cryptic species diversity uncovered in Amazonian frogs. Proc. R. Soc. B Biol. Sci. 2012, 279, 1806–1814. [Google Scholar] [CrossRef] [PubMed] [Green Version]
  13. Irwin, D.E.; Alström, P.; Olsson, U.; Benowitz-Fredericks, Z.M. Cryptic species in the genus Phylloscopus (Old World leaf warblers). Ibis (Lond. 1859) 2001, 143, 233–247. [Google Scholar] [CrossRef]
  14. Groth, J.G. Resolution of cryptic species in Appalachian red crossbills. Condor 1988, 90, 745–760. [Google Scholar] [CrossRef]
  15. Isler, M.L.; Isler, P.R.; Brumfield, R.T. Clinal variation in vocalizations of an antbird (Thamnophilidae) and implications for defining species limits. Auk 2005, 122, 433–444. [Google Scholar] [CrossRef]
  16. Irwin, D.E.; Thimgan, M.P.; Irwin, J.H. Call divergence is correlated with geographic and genetic distance in greenish warblers (Phylloscopus trochiloides): A strong role for stochasticity in signal evolution? J. Evol. Biol. 2008, 21, 435–448. [Google Scholar] [CrossRef]
  17. Lachlan, R.F.; Servedio, M.R. Song learning accelerates allopatric speciation. Evolution (N. Y.) 2004, 58, 2049–2063. [Google Scholar] [CrossRef]
  18. Olofsson, H.; Frame, A.M.; Servedio, M.R. Can reinforcement occur with a learned trait? Evolution (N. Y.) 2011, 65, 1992–2003. [Google Scholar] [CrossRef]
  19. Verzijden, M.N.; ten Cate, C.; Servedio, M.R.; Kozak, G.M.; Boughman, J.W.; Svensson, E.I. The impact of learning on sexual selection and speciation. Trends Ecol. Evol. 2012, 27, 511–519. [Google Scholar] [CrossRef]
  20. Mason, N.A.; Burns, K.J.; Tobias, J.A.; Claramunt, S.; Seddon, N.; Derryberry, E.P. Song evolution, speciation, and vocal learning in passerine birds. Evolution (N. Y.) 2017, 71, 786–796. [Google Scholar] [CrossRef] [Green Version]
  21. Doupe, A.J.; Kuhl, P.K. Birdsong and human speech: Common themes and mechanisms. Annu. Rev. Neurosci. 1999, 22, 567–631. [Google Scholar] [CrossRef] [Green Version]
  22. Farabaugh, S.M.; Linzenbold, A.; Dooling, R.J. Vocal plasticity in budgerigars (Melopsittacus undulatus): Evidence for social factors in the learning of contact calls. J. Comp. Psychol. 1994, 108, 81–92. [Google Scholar] [CrossRef] [PubMed]
  23. Genzel, D.; Desai, J.; Paras, E.; Yartsev, M.M. Long-term and persistent vocal plasticity in adult bats. Nat. Commun. 2019, 10, 1–12. [Google Scholar] [CrossRef]
  24. Sewall, K.B.; Young, A.M.; Wright, T.F. Social calls provide novel insights into the evolution of vocal learning. Anim. Behav. 2016, 120, 163–172. [Google Scholar] [CrossRef] [Green Version]
  25. IUCN The IUCN Red List of Threatened Species. Available online: https://www.iucnredlist.org (accessed on 15 May 2020).
  26. Berkunsky, I.; Quillfeldt, P.; Brightsmith, D.J.; Abbud, M.C.; Aguilar, J.M.R.E.; Alemán-Zelaya, U.; Aramburú, R.M.; Arce Arias, A.; Balas McNab, R.; Balsby, T.J.S.; et al. Current threats faced by Neotropical parrot populations. Biol. Conserv. 2017, 214, 278–287. [Google Scholar] [CrossRef] [Green Version]
  27. Wright, T.F.; Toft, C.A.; Enkerlin-Hoeflich, E.; Gonzalez-Elizondo, J.; Albornoz, M.; Rodríguez-Ferraro, A.; Rojas-Suárez, F.; Sanz, V.; Trujillo, A.; Beissinger, S.R.; et al. Nest poaching in Neotropical parrots. Conserv. Biol. 2001, 15, 710–720. [Google Scholar] [CrossRef]
  28. Wright, T.F.; Dahlin, C.R. Vocal dialects in parrots: Patterns and processes of cultural evolution. Emu Austral Ornithol. 2018, 118, 50–66. [Google Scholar] [CrossRef] [PubMed]
  29. Slabbekoorn, H.; Smith, T.B. Bird song, ecology and speciation. Philos. Trans. R. Soc. B Biol. Sci. 2002, 357, 493–503. [Google Scholar] [CrossRef] [PubMed] [Green Version]
  30. Rendell, L.; Mesnick, S.L.; Dalebout, M.L.; Burtenshaw, J.; Whitehead, H. Can genetic differences explain vocal dialect variation in sperm whales, Physeter macrocephalus? Behav. Genet. 2012, 42, 332–343. [Google Scholar] [CrossRef]
  31. Keighley, M.V.; Heinsohn, R.; Langmore, N.E.; Murphy, S.A.; Peñalba, J.V. Genomic population structure aligns with vocal dialects in Palm Cockatoos (Probosciger aterrimus); evidence for refugial late-Quaternary distribution? Emu 2019, 119, 24–37. [Google Scholar] [CrossRef]
  32. Nevo, E.; Heth, G.; Beiles, A.; Frankenberg, E. Geographic dialects in blind mole rats: Role of vocal communication in active speciation. Proc. Natl. Acad. Sci. USA 1987, 84, 3312–3315. [Google Scholar] [CrossRef] [Green Version]
  33. Russello, M.A.; Stahala, C.; Lalonde, D.; Schmidt, K.L.; Amato, G. Cryptic diversity and conservation units in the Bahama parrot. Conserv. Genet. 2010, 11, 1809–1821. [Google Scholar] [CrossRef]
  34. McElroy, K.; Beattie, K.; Symonds, M.R.E.; Joseph, L. Mitogenomic and nuclear diversity in the Mulga Parrot of the Australian arid zone: Cryptic subspecies and tests for selection. Emu Austral Ornithol. 2018, 118, 22–35. [Google Scholar] [CrossRef]
  35. Murphy, S.A.; Joseph, L.; Burbidge, A.H.; Austin, J. A cryptic and critically endangered species revealed by mitochondrial DNA analyses: The western Ground Parrot. Conserv. Genet. 2011, 12, 595–600. [Google Scholar] [CrossRef]
  36. Wenner, T.J.; Russello, M.A.; Wright, T.F. Cryptic species in a Neotropical parrot: Genetic variation within the Amazona farinosa species complex and its conservation implications. Conserv. Genet. 2012, 13, 1427–1432. [Google Scholar] [CrossRef]
  37. Juniper, T.; Parr, M. Parrots: A Guide to Parrots of the World, 1st ed.; Yale University Press: New Haven, CT, USA, 1998; ISBN 978-0300074536. [Google Scholar]
  38. Collar, N.; del Hoyo, J.; Bonan, A.; Kirwan, G.M.; Boesman, P.F.D. Mealy Parrot (Amazona farinosa); Version 1; Billerman, S.M., Keeney, B.K., Rodewald, P.G., Schulenberg, T.S., Eds.; Cornell Lab of Ornithology: Ithaca, NY, USA, 2020. [Google Scholar]
  39. Government of São Paulo. Decree on the Declaration of the Species of Wild Fauna in the State of São Paulo Regionally Extinct, Those Threatened with Extinction, Those Almost Threatened and Those with Insufficient Data for Evaluation. Available online: https://www.al.sp.gov.br/repositorio/legislacao/decreto/2018/decreto-63853-27.11.2018.html (accessed on 27 November 2018).
  40. Ribeiro, M.C.; Martensen, A.C.; Metzger, J.P.; Tabarelli, M.; Scarano, F.; Fortin, M.-J. The Brazilian Atlantic Forest: A Shrinking Biodiversity Hotspot. Biodiversity Hotspots, 1st ed.; Springer: Berlin, Germany, 2011. [Google Scholar]
  41. Silva, J.M.C.; Casteleti, C.H.M. Status of the biodiversity of the Atlantic Forest of Brazil. In The Atlantic Forest of South America: Biodiversity Status, Threats, and Outlook; Galindo-Leal, C., de Gusmão Câmara, I., Eds.; Island Press: Washington, DC, USA, 2003; pp. 43–59. [Google Scholar]
  42. Batalha-Filho, H.; Fjeldså, J.; Fabre, P.H.; Miyaki, C.Y. Connections between the Atlantic and the Amazonian forest avifaunas represent distinct historical events. J. Ornithol. 2013, 154, 41–50. [Google Scholar] [CrossRef]
  43. Fusinatto, L.A.; Alexandrino, J.; Haddad, C.F.B.; Brunes, T.O.; Rocha, C.F.D.; Sequeira, F. Cryptic genetic diversity is paramount in small-bodied amphibians of the genus Euparkerella (Anura: Craugastoridae) endemic to the Brazilian Atlantic forest. PLoS ONE 2013, 8, 1–12. [Google Scholar] [CrossRef] [PubMed] [Green Version]
  44. Costa, W.J.E.M.; Amorim, P.F. Delimitation of cryptic species of Notholebias, a genus of seasonal miniature killifishes threatened with extinction from the Atlantic Forest of outh-eastern Brazil (Cyprinodontiformes: Rivulidae). Ichthyol. Explor. Freshwaters 2013, 24, 63–72. [Google Scholar]
  45. Mata, H.; Fontana, C.S.; Maurício, G.N.; Bornschein, M.R.; de Vasconcelos, M.F.; Bonatto, S.L. Molecular phylogeny and biogeography of the eastern Tapaculos (Aves: Rhinocryptidae: Scytalopus, Eleoscytalopus): Cryptic diversification in Brazilian Atlantic Forest. Mol. Phylogenet. Evol. 2009, 53, 450–462. [Google Scholar] [CrossRef]
  46. Forlani, M.C.; Tonini, J.F.R.; Cruz, C.A.G.; Zaher, H.; de Sá, R.O. Molecular and morphological data reveal three new cryptic species of Chiasmocleis (Mehely 1904) (Anura, Microhylidae) endemic to the Atlantic Forest, Brazil. PeerJ 2017, 2017, 1–43. [Google Scholar] [CrossRef] [Green Version]
  47. Nemésio, A.; Engel, M.S. Three new cryptic species of Euglossa from Brazil (Hymenoptera, apidae). Zookeys 2012, 222, 47–68. [Google Scholar] [CrossRef]
  48. Ribeiro, M.C.; Metzger, J.P.; Martensen, A.C.; Ponzoni, F.J.; Hirota, M.M. The Brazilian Atlantic Forest: How much is left, and how is the remaining forest distributed? Implications for conservation. Biol. Conserv. 2009, 142, 1141–1153. [Google Scholar] [CrossRef]
  49. Tabarelli, M.; Pinto, L.P.; Silva, J.M.C.; Hirota, M.; Bedê, L. Challenges and opportunities for biodiversity conservation in the Brazilian Atlantic forest. Conserv. Biol. 2005, 19, 695–700. [Google Scholar] [CrossRef]
  50. Cock, P.J.A.; Antao, T.; Chang, J.T.; Chapman, B.A.; Cox, C.J.; Dalke, A.; Friedberg, I.; Hamelryck, T.; Kauff, F.; Wilczynski, B.; et al. Biopython: Freely available Python tools for computational molecular biology and bioinformatics. Bioinformatics 2009, 25, 1422–1423. [Google Scholar] [CrossRef]
  51. Stamatakis, A. RAxML version 8: A tool for phylogenetic analysis and post-analysis of large phylogenies. Bioinformatics 2014, 30, 1312–1313. [Google Scholar] [CrossRef] [PubMed]
  52. Miller, M.A.; Pfeiffer, W.; Schwartz, T. Creating the CIPRES Science Gateway for inference of large phylogenetic trees. 2010 Gatew. Comput. Environ. Work. GCE 2010 2010. [Google Scholar] [CrossRef] [Green Version]
  53. FigTree; Version 1.4.4; A Graphical Viewer of Phylogenetic Trees; Andrew Rambaut: Edinburgh, UK, 2007.
  54. Bandelt, H.-J.; Forster, P.; Röhl, A. Median-joining networks for inferring intraspecific phylogenies. Mol. Biol. Evol. 1999, 16, 37–48. [Google Scholar] [CrossRef]
  55. Leigh, J.W.; Bryant, D. POPART: Full-feature software for haplotype network construction. Methods Ecol. Evol. 2015, 6, 1110–1116. [Google Scholar] [CrossRef]
  56. Kumar, S.; Stecher, G.; Li, M.; Knyaz, C.; Tamura, K. MEGA X: Molecular evolutionary genetics analysis across computing platforms. Mol. Biol. Evol. 2018, 35, 1547–1549. [Google Scholar] [CrossRef]
  57. Stecher, G.; Tamura, K.; Kumar, S. Molecular Evolutionary Genetics Analysis (MEGA) for macOS. Mol. Biol. Evol. 2020, 37, 1237–1239. [Google Scholar] [CrossRef]
  58. Araya-Salas, M.; Smith-Vidaurre, G. warbleR: An R package to streamline analysis of animal acoustic signals. Methods Ecol. Evol. 2016, 184–191. [Google Scholar] [CrossRef]
  59. Schmidt, K.L.; Aardema, M.L.; Amato, G. Genetic analysis reveals strong phylogeographical divergences within the Scarlet Macaw Ara macao. Ibis 2020, 162, 735–748. [Google Scholar] [CrossRef]
  60. Eberhard, J.R.; Bermingham, E. Phylogeny and biogeography of the Amazona ochrocephala (Aves: Psittacidae) complex. Auk 2004, 121, 318–332. [Google Scholar] [CrossRef]
  61. Johns, G.C.; Avise, J.C. A comparative summary of genetic distances in the vertebrates from the mitochondrial cytochrome b gene. Mol. Biol. Evol. 1998, 15, 372–382. [Google Scholar] [CrossRef] [PubMed] [Green Version]
  62. Bocalini, F.; Bolívar-Leguizamón, S.D.; Silveira, L.F.; Bravo, G.A. Comparative phylogeographic and demographic analyses reveal a congruent pattern of sister relationship between bird populations of the northern and south-central Atlantic Forest. Mol. Phylogenet. Evol. 2020, 154, 106973. [Google Scholar] [CrossRef]
  63. Capurucho, J.M.G.; Ashley, M.V.; Ribas, C.C.; Bates, J.M. Connecting Amazonian, Cerrado, and Atlantic forest histories: Paraphyly, old divergences, and modern population dynamics in tyrant-manakins (Neopelma/Tyranneutes, Aves: Pipridae). Mol. Phylogenet. Evol. 2018, 127, 696–705. [Google Scholar] [CrossRef]
  64. Cabanne, G.S.; d’Horta, F.M.; Sari, E.H.R.; Santos, F.R.; Miyaki, C.Y. Nuclear and mitochondrial phylogeography of the Atlantic forest endemic Xiphorhynchus fuscus (Aves: Dendrocolaptidae): Biogeography and systematics implications. Mol. Phylogenet. Evol. 2008, 49, 760–773. [Google Scholar] [CrossRef]
  65. Costa, L.P. The historical bridge between the Amazon and the Atlantic Forest of Brazil: A study of molecular phylogeography with small mammals. J. Biogeogr. 2003, 30, 71–86. [Google Scholar] [CrossRef] [Green Version]
  66. Trujillo-Arias, N.; Calderón, L.; Santos, F.R.; Miyaki, C.Y.; Aleixo, A.; Witt, C.C.; Tubaro, P.L.; Cabanne, G.S. Forest corridors between the central Andes and the southern Atlantic Forest enabled dispersal and peripatric diversification without niche divergence in a passerine. Mol. Phylogenet. Evol. 2018, 128, 221–232. [Google Scholar] [CrossRef]
  67. Lavinia, P.D.; Barreira, A.S.; Campagna, L.; Tubaro, P.L.; Lijtmaer, D.A. Contrasting evolutionary histories in Neotropical birds: Divergence across an environmental barrier in South America. Mol. Ecol. 2019, 28, 1730–1747. [Google Scholar] [CrossRef]
  68. Carnaval, A.C.; Moritz, C. Historical climate modelling predicts patterns of current biodiversity in the Brazilian Atlantic forest. J. Biogeogr. 2008, 35, 1187–1201. [Google Scholar] [CrossRef]
  69. Cheng, H.; Sinha, A.; Cruz, F.W.; Wang, X.; Edwards, R.L.; D’Horta, F.M.; Ribas, C.C.; Vuille, M.; Stott, L.D.; Auler, A.S. Climate change patterns in Amazonia and biodiversity. Nat. Commun. 2013, 4. [Google Scholar] [CrossRef]
  70. Smith-Vidaurre, G.; Araya-Salas, M.; Wright, T.F. Individual signatures outweigh social group identity in contact calls of a communally nesting parrot. Behav. Ecol. 2021, 31, 448–458. [Google Scholar] [CrossRef]
  71. Wright, T.F.; Wilkinson, G.S. Population genetic structure and vocal dialects in an amazon parrot. Proc. R. Soc. B Biol. Sci. 2001, 268, 609–616. [Google Scholar] [CrossRef] [PubMed] [Green Version]
  72. Ribot, R.F.H.; Buchanan, K.L.; Endler, J.A.; Joseph, L.; Bennett, A.T.D.; Berg, M.L. Learned vocal variation is associated with abrupt cryptic genetic change in a parrot species complex. PLoS ONE 2012, 7, 1–9. [Google Scholar] [CrossRef] [PubMed] [Green Version]
  73. MacDougall-Shackleton, E.A.; MacDougall-Shackleton, S.A. Cultural and genetic evolution in mountain white-crowned sparrows: Song dialects are associated with population structure. Evolution (N. Y.) 2001, 55, 2568–2575. [Google Scholar] [CrossRef]
  74. Lipshutz, S.E.; Overcast, I.A.; Hickerson, M.J.; Brumfield, R.T.; Derryberry, E.P. Behavioural response to song and genetic divergence in two subspecies of white-crowned sparrows (Zonotrichia leucophrys). Mol. Ecol. 2017, 26, 3011–3027. [Google Scholar] [CrossRef] [PubMed]
Figure 1. Map of vocal sampling locations. Spectrograms of representative calls from each clade are shown at their corresponding recording location. Spectrograms were created using the ‘spec_param’ and ‘specreator’ functions in warbler to optimize the visualization parameters (overlap = 90, window length = 475, color levels = (−50, 0, 5)). Genetic samples from the [36] study are indicated by grey-outlined triangles on the map. The location of the new genetic samples used in our study is indicated by the purple-outlined triangle.
Diversity 13 00273 g001
Figure 2. Maximum likelihood majority rule consensus tree (cladogram) and median joining haplotype networks. Maximum likelihood majority rule consensus tree based on an analysis of the combined nuclear and mtDNA from all northern and southern mealy amazon clades. Numbers to the left of each node are bootstrap consensus values. The insert to the left of the consensus tree is a phylogram of the best tree recovered from the same maximum likelihood search and illustrates the deep split in the evolutionary timeline of the northern and southern species, as well as the relatively shallow split between the Atlantic Forest clade and the other southern mealy amazon clades. The relative branch lengths of the phylogram represent sequence divergence.
Diversity 13 00273 g002
Figure 3. (Left panel) Median joining haplotype network based on CytB data. Size of each circle corresponds to the number of individuals sharing that haplotype and color to each clade. Ticks on each branch represent the number of sequence differences between each haplotype. (Right panel) Median joining haplotype network based on 4 mitochondrial genes (CytB, ND2, 12S, 16S). Size of each circle corresponds to the number of individuals sharing that haplotype and color to each clade. Ticks on each branch represent the number of sequence differences between each haplotype.
Diversity 13 00273 g003
Figure 4. Acoustic variation in call data. Plots of acoustic variation in contact calls based on principle components analysis of 27 call measures (left) and a multidimensional scaling of spectrogram cross-correlation values (right). The points represent individual calls, and the polygons represent the total area of occupied by each clade’s set of calls in acoustic space.
Diversity 13 00273 g004
Figure 5. Matrix comparing net between group genetic distance with mean call cross-correlation values. For both sets of values, darker colors indicate greater dissimilarity between clades and lighter colors indicate greater similarity between clades. ‘Mean genetic distance’ is the numeric average of all pairwise distances (i.e., number of nucleotide substitutions) between clades, computed with the Kimura 2-parameter distance estimation model.
Diversity 13 00273 g005
Publisher’s Note: MDPI stays neutral with regard to jurisdictional claims in published maps and institutional affiliations.

