
Allele Surfing and Holocene Expansion of an Australian Fig (Ficus—Moraceae)


Abstract
:1. Introduction
2. Material and Methods
2.1. Sampling Strategy
2.2. Genome Scans and Data Analysis
3. Results
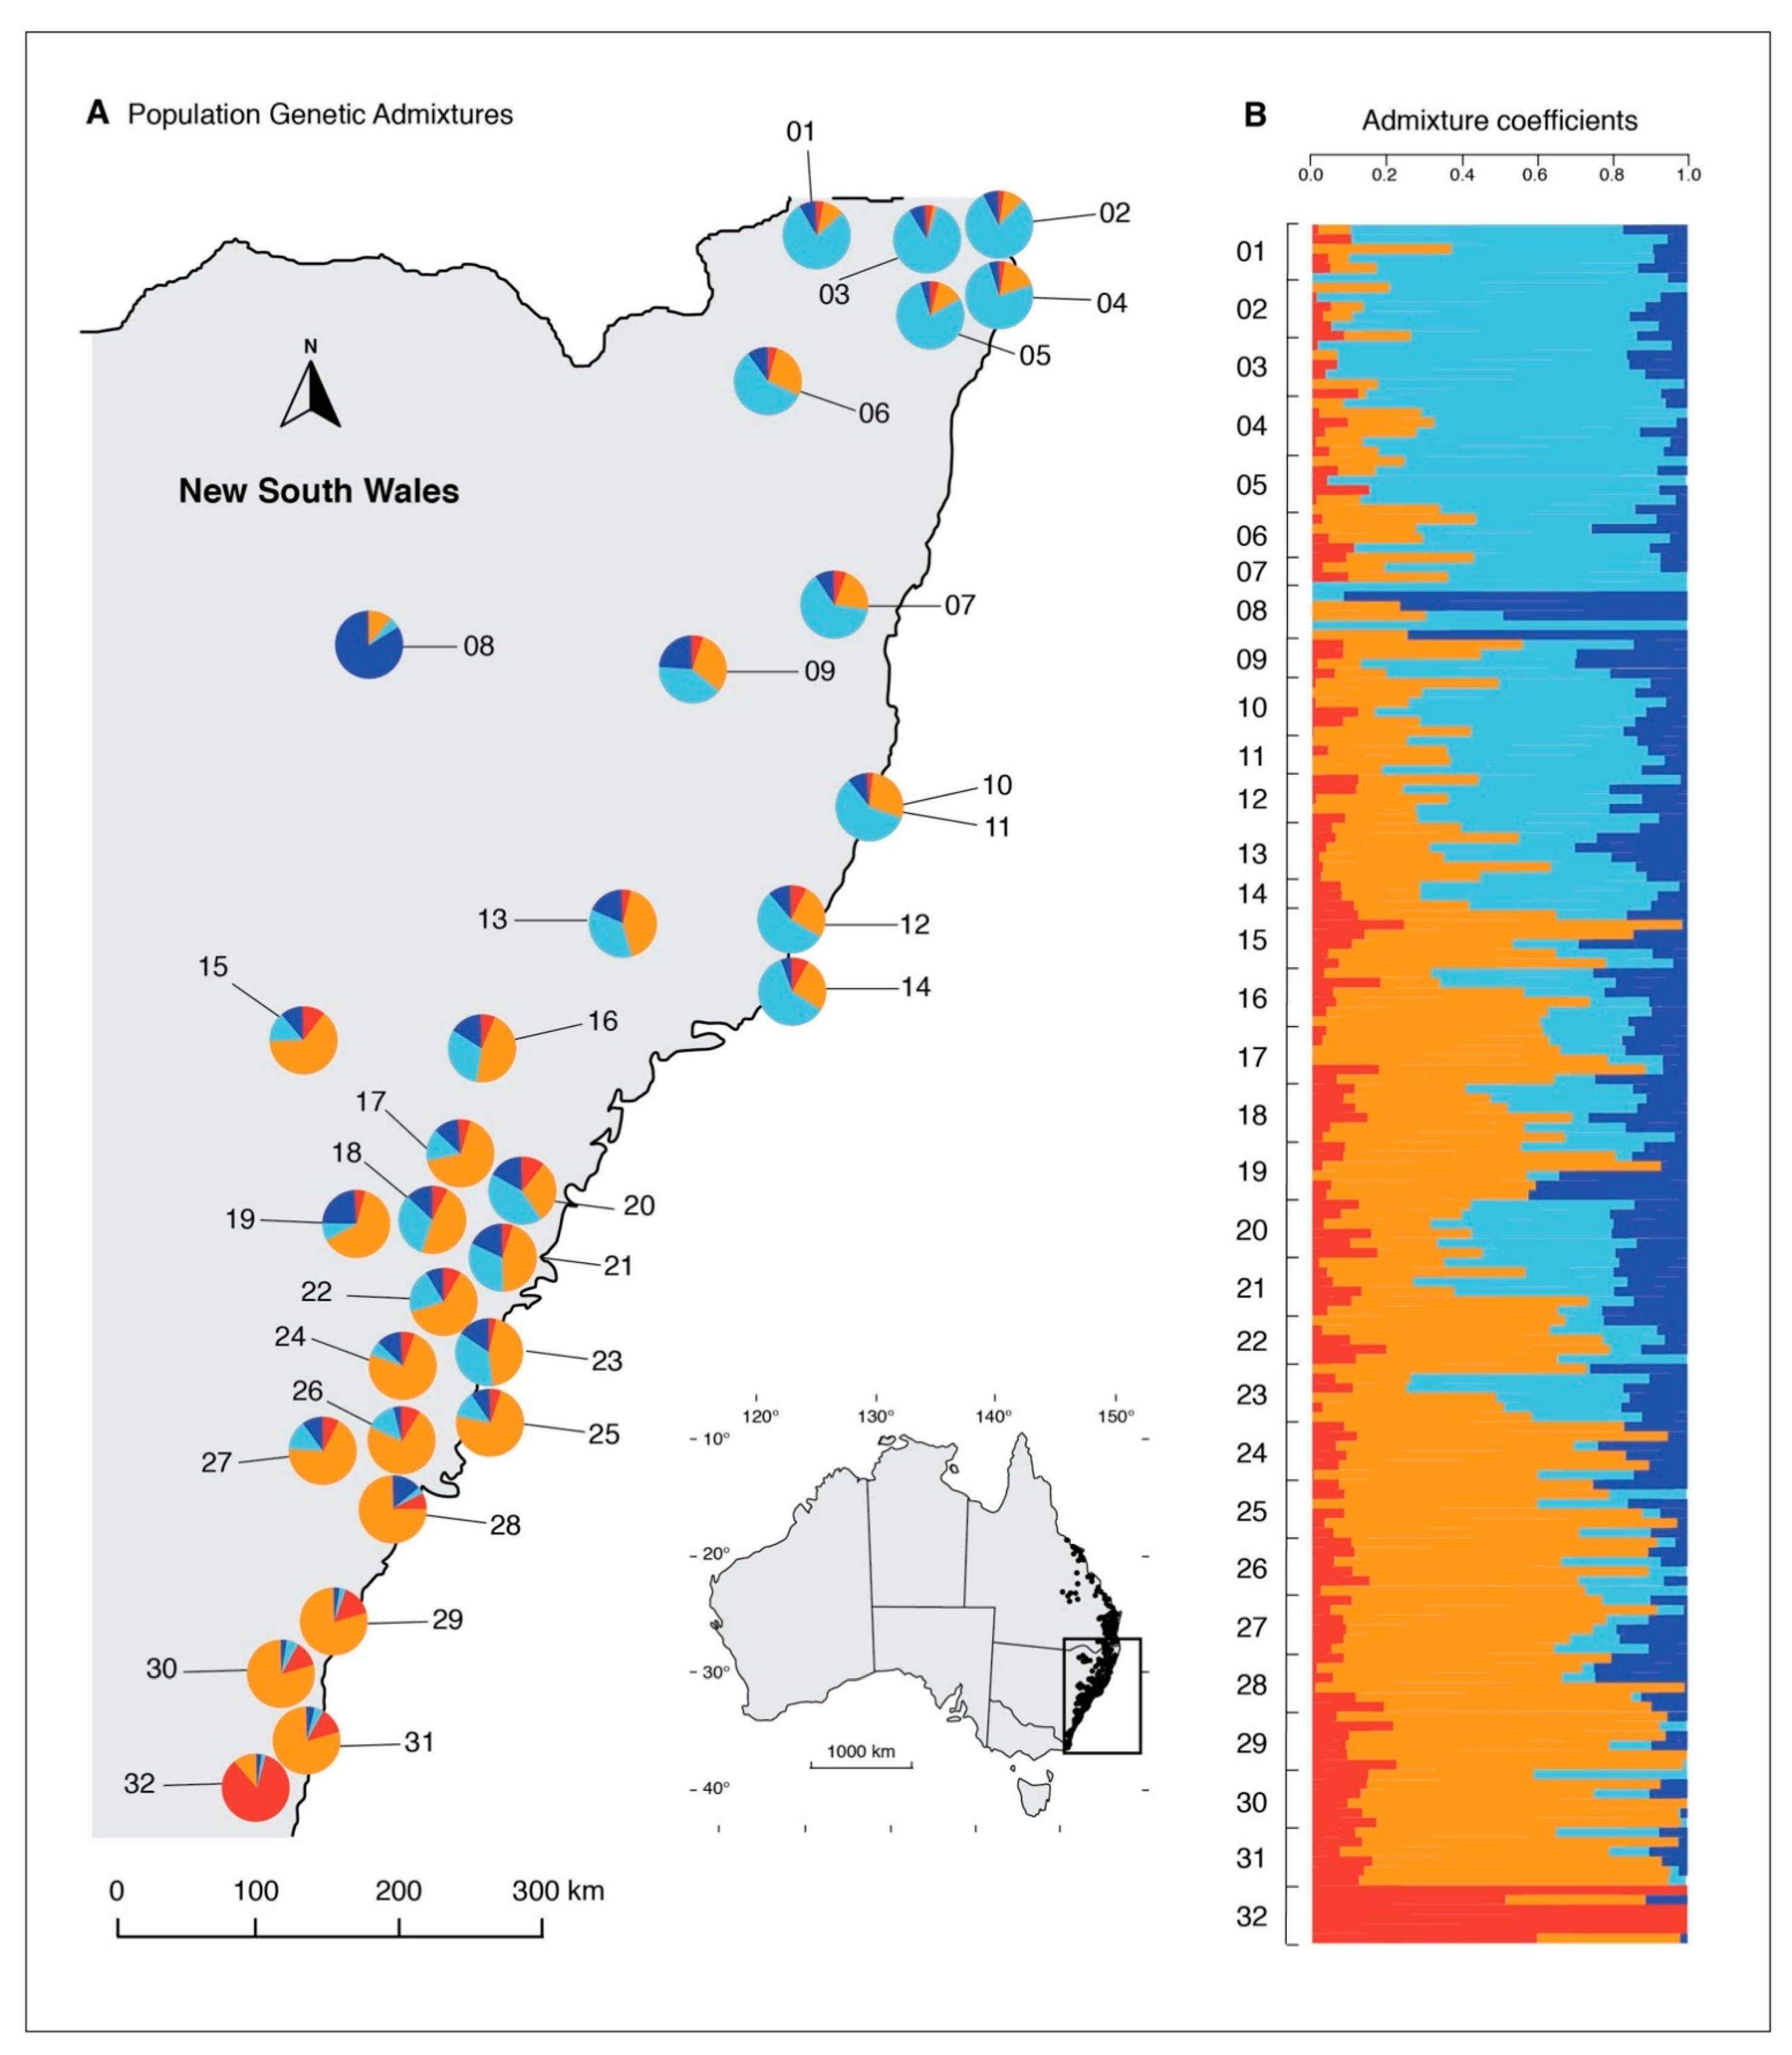
Genetic Structure
4. Discussion
5. Conclusions
Author Contributions
Funding
Institutional Review Board Statement
Informed Consent Statement
Data Availability Statement
Acknowledgments
Conflicts of Interest
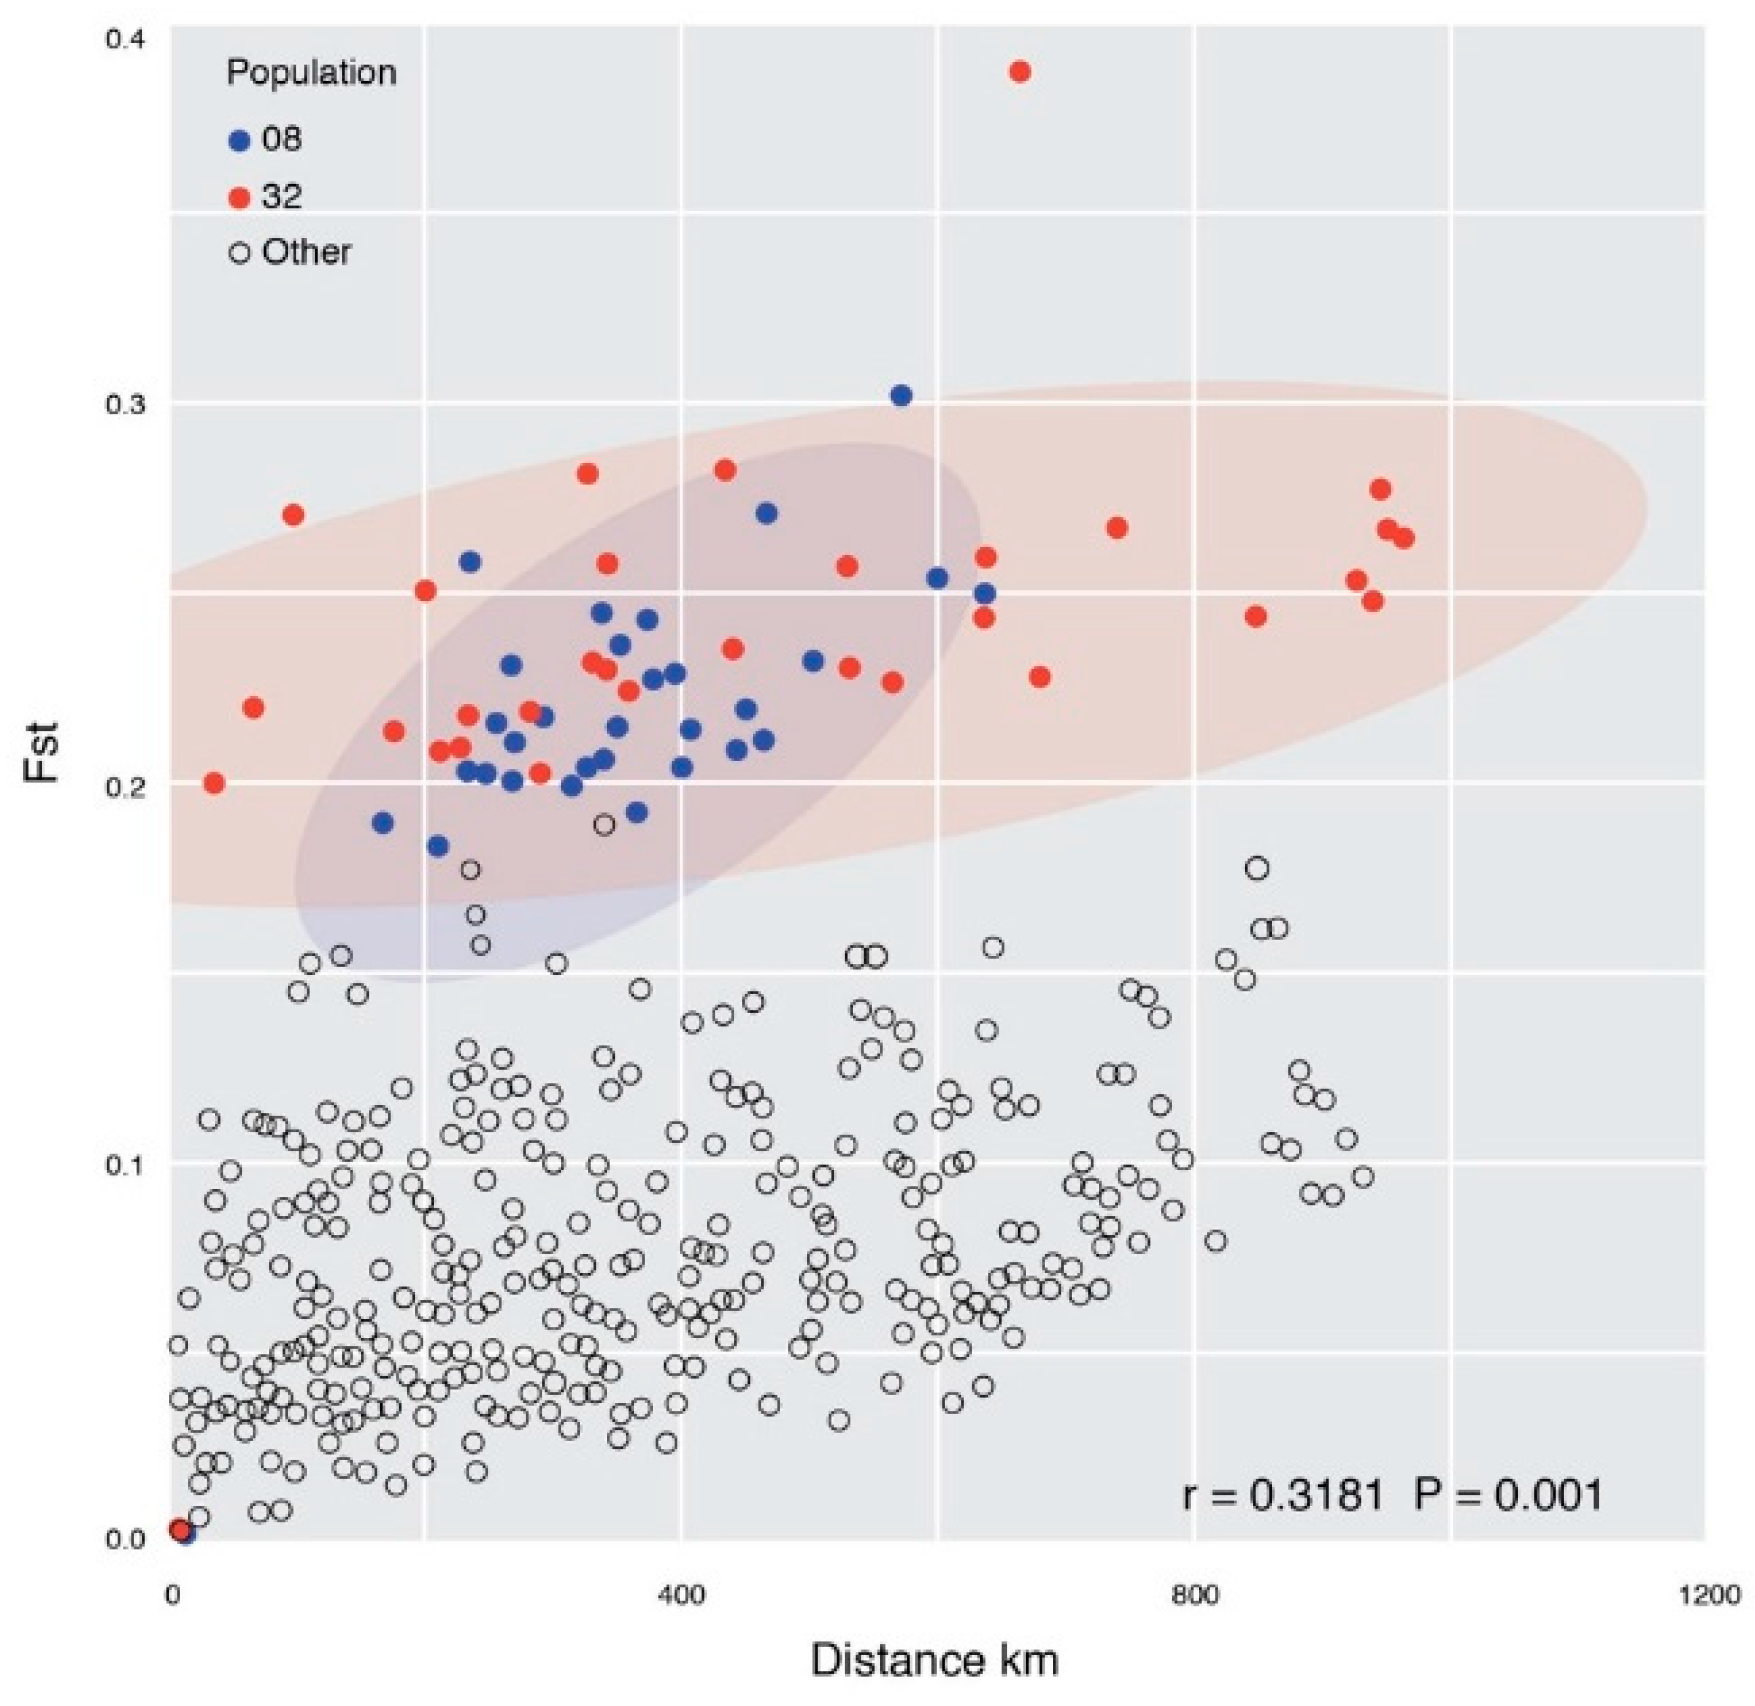
Appendix A. IBD and FST Pairwise Heatmaps

Appendix B. PCA for Ficus coronata and Two Closely Related Species


| Voucher | Species | Latitude | Longitude |
|---|---|---|---|
| D0274341 | Ficus aculeata | −15.6463 | 136.7555 |
| D0272678 | Ficus aculeata | −17.7832 | 137.8992 |
| D0232704 | Ficus aculeata | −16.4274 | 129.6194 |
| D0264264 | Ficus aculeata | −14.3511 | 129.8836 |
| NSW1025125 | Ficus fraseri | −33.0026 | 151.7286 |
| NSW1031234 | Ficus fraseri | −32.0763 | 152.5320 |
| NSW1031390 | Ficus fraseri | −32.4393 | 152.5372 |
| NSW1031387 | Ficus fraseri | −32.0764 | 152.5312 |
References
- Davis, M.B.; Shaw, R.G. Range shifts and adaptive responses to quaternary climate change. Science 2001, 292, 673–679. [Google Scholar] [CrossRef] [Green Version]
- Baird, A.H.; Sommer, B.; Madin, J.S. Pole-ward range expansion of Acropora spp. along the east coast of Australia. Coral Reefs 2012, 31, 1063. [Google Scholar] [CrossRef]
- Normand, S.; Ricklefs, R.E.; Skov, F.; Bladt, J.; Tackenberg, O.; Svenning, J.C. Postglacial migration supplements climate in determining plant species ranges in Europe. Proc. R. Soc. B Biol. Sci. 2011, 278, 3644–3653. [Google Scholar] [CrossRef]
- Yap, J.Y.S.; van der Merwe, M.; Ford, A.J.; Henry, R.J.; Rossetto, M. Biotic exchange leaves detectable genomic patterns in the Australian rain forest flora. Biotropica 2020, 52, 627–635. [Google Scholar] [CrossRef]
- Hewitt, G.M. The genetic legacy of the Quaternary ice ages. Nature 2000, 405, 907–913. [Google Scholar] [CrossRef] [PubMed]
- Bryant, L.M.; Krosch, M.N. Lines in the land: A review of evidence for eastern Australia’s major biogeographical barriers to closed forest taxa. Biol. J. Linn. Soc. 2016, 119, 238–264. [Google Scholar] [CrossRef] [Green Version]
- Hewitt, G.M. Some genetic consequences of ice ages, and their role in divergence and speciation. Biol. J. Linn. Soc. 1996, 58, 247–276. [Google Scholar] [CrossRef]
- Buckley, J.; Bridle, J.R.; Pomiankowski, A. Novel variation associated with species range expansion. BMC Evol. Biol. 2010, 10, 382. [Google Scholar] [CrossRef] [Green Version]
- Mastrantonio, V.; Porretta, D.; Urbanelli, S.; Crasta, G.; Nascetti, G. Dynamics of mtDNA introgression during species range expansion: Insights from an experimental longitudinal study. Sci. Rep. 2016, 6, 1–8. [Google Scholar] [CrossRef] [Green Version]
- Petit, R.J.; Aguinagalde, I.; De Beaulieu, J.L.; Bittkau, C.; Brewer, S.; Cheddadi, R.; Ennos, R.; Fineschi, S.; Grivet, D.; Lascoux, M.; et al. Glacial refugia: Hotspots but not melting pots of genetic diversity. Science 2003, 300, 1563–1565. [Google Scholar] [CrossRef] [Green Version]
- Hardy, O.J. Estimation of pairwise relatedness between individuals and characterization of isolation-by-distance processes using dominant genetic markers. Mol. Ecol. 2003, 12, 1577–1588. [Google Scholar] [CrossRef]
- Wright, S. Isolation by distance. Genetics 1943, 28, 114–138. [Google Scholar] [CrossRef]
- Ishida, Y. Sewall wright and gustave malécot on isolation by distance. Philos. Sci. 2009, 76, 784–796. [Google Scholar] [CrossRef] [Green Version]
- Wright, S. Isolation by distance under diverse systems of mating. Genetics 1946, 31, 39–59. [Google Scholar] [CrossRef]
- Yap, J.Y.S.; Rossetto, M.; Costion, C.; Crayn, D.; Kooyman, R.M.; Richardson, J.; Henry, R. Filters of floristic exchange: How traits and climate shape the rain forest invasion of Sahul from Sunda. J. Biogeogr. 2018, 45, 838–847. [Google Scholar] [CrossRef]
- Binks, R.M.; Gibson, N.; Ottewell, K.M.; Macdonald, B.; Byrne, M. Predicting contemporary range-wide genomic variation using climatic, phylogeographic and morphological knowledge in an ancient, unglaciated landscape. J. Biogeogr. 2019, 46, 503–514. [Google Scholar] [CrossRef]
- McPherson, H.; van der Merwe, M.; Delaney, S.K.; Edwards, M.A.; Henry, R.J.; McIntosh, E.; Rymer, P.D.; Milner, M.L.; Siow, J.; Rossetto, M. Capturing chloroplast variation for molecular ecology studies: A simple next generation sequencing approach applied to a rainforest tree. BMC Ecol. 2013, 13, 8. [Google Scholar] [CrossRef] [Green Version]
- Rossetto, M.; Mcpherson, H.; Siow, J.; Kooyman, R.; van der Merwe, M.; Wilson, P.D. Where did all the trees come from? A novel multispecies approach reveals the impacts of biogeographical history and functional diversity on rain forest assembly. J. Biogeogr. 2015, 42, 2172–2186. [Google Scholar] [CrossRef]
- Joyce, E.M.; Pannell, C.M.; Rossetto, M.; Yap, J.Y.S.; Thiele, K.R.; Wilson, P.D.; Crayn, D.M. Molecular phylogeography reveals two geographically and temporally separated floristic exchange tracks between Southeast Asia and Northern Australia. J. Biogeogr. 2021, 48, 1213–1227. [Google Scholar] [CrossRef]
- Nei, M.; Maruyama, T.; Chakraborty, R. The Bottleneck Effect and Genetic Variability in Populations. Evolution 2012, 29, 1–10. [Google Scholar] [CrossRef]
- Dodd, R.S.; Afzal-Rafii, Z. Selection and dispersal in a multispecies oak hybrid zone. Evolution 2004, 58, 261–269. [Google Scholar] [CrossRef] [PubMed]
- Graham, C.H.; Moritz, C.; Williams, S.E. Habitat history improves prediction of biodiversity in rainforest fauna. Proc. Natl. Acad. Sci. USA 2006, 103, 632–636. [Google Scholar] [CrossRef] [Green Version]
- Nevill, P.G.; Bossinger, G.; Ades, P.K. Phylogeography of the world’s tallest angiosperm, Eucalyptus regnans: Evidence for multiple isolated Quaternary refugia. J. Biogeogr. 2010, 37, 179–192. [Google Scholar] [CrossRef]
- Das, S.; Baumgartner, J.B.; Esperon-Rodriguez, M.; Wilson, P.D.; Yap, J.Y.S.; Rossetto, M.; Beaumont, L.J. Identifying climate refugia for 30 Australian rainforest plant species, from the last glacial maximum to 2070. Landsc. Ecol. 2019, 34, 2883–2896. [Google Scholar] [CrossRef]
- Fahey, M.; Rossetto, M.; Wilson, P.D.; Ho, S.Y.W. Habitat preference differentiates the Holocene range dynamics but not barrier effects on two sympatric, congeneric trees (Tristaniopsis, Myrtaceae). Heredity 2019, 123, 532–548. [Google Scholar] [CrossRef]
- van der Merwe, M.; Yap, J.Y.S.; Bragg, J.G.; Cristofolini, C.; Foster, C.S.P.; Ho, S.Y.W.; Rossetto, M. Assemblage accumulation curves: A framework for resolving species accumulation in biological communities using DNA sequences. Methods Ecol. Evol. 2019, 10, 971–981. [Google Scholar] [CrossRef]
- De Almeida Vieira, F.; Novaes, R.M.L.; Fajardo, C.G.; Dos Santos, R.M.; De Souza Almeida, H.; De Carvalho, D.; Lovato, M.B. Holocene southward expansion in seasonally dry tropical forests in South America: Phylogeography of Ficus bonijesulapensis (Moraceae). Bot. J. Linn. Soc. 2015, 177, 189–201. [Google Scholar] [CrossRef] [Green Version]
- Yu, H.; Nason, J.D. Nuclear and chloroplast DNA phylogeography of Ficus hirta: Obligate pollination mutualism and constraints on range expansion in response to climate change. New Phytol. 2013, 197, 276–289. [Google Scholar] [CrossRef]
- Lin, R.C.; Yeung, C.K.L.; Li, S.H. Drastic post-LGM expansion and lack of historical genetic structure of a subtropical fig-pollinating wasp (Ceratosolen sp. 1) of Ficus septica in Taiwan. Mol. Ecol. 2008, 17, 5008–5022. [Google Scholar] [CrossRef]
- Chen, Y.; Compton, S.G.; Liu, M.; Chen, X.Y. Fig trees at the northern limit of their range: The distributions of cryptic pollinators indicate multiple glacial refugia. Mol. Ecol. 2012, 21, 1687–1701. [Google Scholar] [CrossRef] [PubMed]
- Berg, C.C.; Corner, E.J.H. Flora Malesiana, Series I, Volume 17/Part 2: Moraceae (Ficus); National Herbarium of the Netherlands: Leiden, The Netherlands, 2005. [Google Scholar]
- Rønsted, N.; Weiblen, G.D.; Clement, W.L.; Zerega, N.J.C.; Savolainen, V. Reconstructing the phylogeny of figs (Ficus, Moraceae) to reveal the history of the fig pollination mutualism. Symbiosis 2008, 45, 45–55. [Google Scholar]
- Wilde, B.C.; Rutherford, S.; Merwe, M.; Murray, M.L.; Rossetto, M. First example of hybridisation between two Australian figs (Moraceae). Aust. Syst. Bot. 2020, 33, 436–445. [Google Scholar] [CrossRef]
- Shanahan, M.; Harrison, R.; Yamuna, R.; Boen, W.; Thornton, I. Colonization of an island volcano, Long Island, Papua New Guinea, and an emergent island, Motmot, in its caldera lake. V. Colonization by figs (Ficus spp.), their dispersers and pollinators. J. Biogeogr. 2003, 28, 1365–1377. [Google Scholar] [CrossRef] [Green Version]
- Parry-Jones, K.; Augee, M.L. Food selection by grey-headed flying foxes (pteropus poliocephalus) occupying a summer colony site near gosford, New South Wales. Wildl. Res. 1991, 18, 111–124. [Google Scholar] [CrossRef]
- Roberts, B.J.; Catterall, C.P.; Eby, P.; Kanowski, J. Latitudinal range shifts in Australian flying-foxes: A re-evaluation. Austral Ecol. 2012, 37, 12–22. [Google Scholar] [CrossRef]
- Rossetto, M.; Bragg, J.; Kilian, A.; McPherson, H.; van der Merwe, M.; Wilson, P.D. Restore and Renew: A genomics-era framework for species provenance delimitation. Restor. Ecol. 2019, 27, 538–548. [Google Scholar] [CrossRef] [Green Version]
- Wilde, B.C. Restore and Renew: A Specimen Collecting App for Android and IOS Version 1.19. Available online: https://apps.apple.com/au/app/restore-renew/id1481538802 (accessed on 17 November 2020).
- Frichot, E.; François, O. LEA: An R package for landscape and ecological association studies. Methods Ecol. Evol. 2015, 6, 925–929. [Google Scholar] [CrossRef]
- Venables, B.; Hornik, K. Oz: Plot the Australian Coastline and States. R Package Version 1.0–21. 2016. Available online: https://cran.r-project.org/web/packages/oz/index.html (accessed on 17 November 2020).
- Gerritsen, H. Mapplots: Data Visualisation on Maps. R Package Version 1.5.1. 2018. Available online: https://CRAN.R-project.org/package=mapplots (accessed on 17 November 2020).
- Jombart, T. Adegenet: A R package for the multivariate analysis of genetic markers. Bioinformatics 2008, 24, 1403–1405. [Google Scholar] [CrossRef] [Green Version]
- Jombart, T.; Ahmed, I. adegenet 1.3-1: New tools for the analysis of genome-wide SNP data. Bioinformatics 2011, 27, 3070–3071. [Google Scholar] [CrossRef] [Green Version]
- Weir, B.S.; Hill, W.G. Estimating F statistics. Annu. Rev. Genet. 2002, 36, 721–750. [Google Scholar] [CrossRef] [Green Version]
- Zheng, X.; Levine, D.; Shen, J.; Gogarten, S.M.; Laurie, C.; Weir, B.S. A high-performance computing toolset for relatedness and principal component analysis of SNP data. Bioinformatics 2012, 28, 3326–3328. [Google Scholar] [CrossRef] [Green Version]
- Oksanen, A.J.; Blanchet, F.G.; Kindt, R.; Legen-, P.; Minchin, P.R.; Hara, R.B.O.; Simpson, G.L.; Solymos, P.; Stevens, M.H.H. Community Ecology Package. Ecol. Packag. 2013, 2, 263. [Google Scholar]
- Keenan, K.; Mcginnity, P.; Cross, T.F.; Crozier, W.W.; Prodöhl, P.A. DiveRsity: An R package for the estimation and exploration of population genetics parameters and their associated errors. Methods Ecol. Evol. 2013, 4, 782–788. [Google Scholar] [CrossRef] [Green Version]
- Kamvar, Z.N.; Tabima, J.F.; Grünwald, N.J. Poppr: An R package for genetic analysis of populations with clonal, partially clonal, and/or sexual reproduction. PeerJ 2014, 2014, 1–14. [Google Scholar] [CrossRef] [Green Version]
- Peter, B.M.; Slatkin, M. Detecting range expansions from genetic data. Evolution 2013, 67, 3274–3289. [Google Scholar] [CrossRef] [Green Version]
- Falistocco, E. Presence of triploid cytotypes in the common fig (Ficus carica L.). Genome 2009, 52, 919–925. [Google Scholar] [CrossRef]
- Linck, E.; Battey, C.J. Minor allele frequency thresholds strongly affect population structure inference with genomic data sets. Mol. Ecol. Resour. 2019, 19, 639–647. [Google Scholar] [CrossRef]
- Cobos, M.E.; Townsend Peterson, A.; Barve, N.; Osorio-Olvera, L. Kuenm: An R package for detailed development of ecological niche models using Maxent. PeerJ 2019, 7, 1–15. [Google Scholar] [CrossRef] [Green Version]
- Phillips, S.J.; Dudík, M.; Schapire, R.E. A maximum entropy approach to species distribution modeling. In Proceedings of the Twenty-First International Conference on Machine Learning, Banff, AB, Canada, 4–8 July 2004; pp. 655–662. [Google Scholar] [CrossRef] [Green Version]
- Aiello-Lammens, M.E.; Boria, R.A.; Radosavljevic, A.; Vilela, B.; Anderson, R.P. spThin: An R package for spatial thinning of species occurrence records for use in ecological niche models. Ecography 2015, 38, 541–545. [Google Scholar] [CrossRef]
- Hijmans, R.J. Raster: Geographic Data Analysis and Modeling. R Package Version 3.4–5. Available online: https://CRAN.R-project.org/package=raster (accessed on 15 November 2020).
- Karger, D.N.; Conrad, O.; Böhner, J.; Kawohl, T.; Kreft, H.; Soria-Auza, R.W.; Zimmermann, N.E.; Linder, H.P.; Kessler, M. Climatologies at high resolution for the earth’s land surface areas. Sci. Data 2017, 4, 1–20. [Google Scholar] [CrossRef] [Green Version]
- Fordham, D.A.; Saltré, F.; Haythorne, S.; Wigley, T.M.L.; Otto-Bliesner, B.L.; Chan, K.C.; Brook, B.W. PaleoView: A tool for generating continuous climate projections spanning the last 21 000 years at regional and global scales. Ecography 2017, 40, 1348–1358. [Google Scholar] [CrossRef]
- Brown, J.; Hill, D.; Dolan, A.; Carnaval, A.; Haywood, A. PaleoClim, high spatial resolution paleoclimate surfaces for global land areas. Sci. Data 2018, 5, 180254. [Google Scholar] [CrossRef] [Green Version]
- Escobar, L.E.; Lira-Noriega, A.; Medina-Vogel, G.; Townsend Peterson, A. Potential for spread of the white-nose fungus (Pseudogymnoascus destructans) in the Americas: Use of Maxent and NicheA to assure strict model transference. Geospat. Health 2014, 9, 221–229. [Google Scholar] [CrossRef]
- Zhou, H.P.; Chen, J. Spatial genetic structure in an understorey dioecious fig species: The roles of seed rain, seed and pollen-mediated gene flow, and local selection. J. Ecol. 2010, 98, 1168–1177. [Google Scholar] [CrossRef]
- Klopfstein, S.; Currat, M.; Excoffier, L. The fate of mutations surfing on the wave of a range expansion. Mol. Biol. Evol. 2006, 23, 482–490. [Google Scholar] [CrossRef] [Green Version]
- Hallatschek, O.; Hersen, P.; Ramanathan, S.; Nelson, D.R. Genetic drift at expanding frontiers promotes gene segregation. Proc. Natl. Acad. Sci. USA 2007, 104, 19926–19930. [Google Scholar] [CrossRef] [Green Version]
- Excoffier, L.; Foll, M.; Petit, R.J. Genetic consequences of range expansions. Annu. Rev. Ecol. Evol. Syst. 2009, 40, 481–501. [Google Scholar] [CrossRef]
- Peischl, S.; Dupanloup, I.; Bosshard, L.; Excoffier, L. Genetic surfing in human populations: From genes to genomes. Curr. Opin. Genet. Dev. 2016, 41, 53–61. [Google Scholar] [CrossRef]
- Barton, N.H.; Etheridge, A.M.; Kelleher, J.; Véber, A. Genetic hitchhiking in spatially extended populations. Theor. Popul. Biol. 2013, 87, 75–89. [Google Scholar] [CrossRef]
- Hofer, T.; Ray, N.; Wegmann, D.; Excoffier, L. Large allele frequency differences between human continental groups are more likely to have occurred by drift during range expansions than by selection. Ann. Hum. Genet. 2009, 73, 95–108. [Google Scholar] [CrossRef]
- Streicher, J.W.; McEntee, J.P.; Drzich, L.C.; Card, D.C.; Schield, D.R.; Smart, U.; Parkinson, C.L.; Jezkova, T.; Smith, E.N.; Castoe, T.A. Genetic surfing, not allopatric divergence, explains spatial sorting of mitochondrial haplotypes in venomous coralsnakes. Evolution 2016, 70, 1435–1449. [Google Scholar] [CrossRef] [PubMed]
- Evans, P.D.; Gilbert, S.L.; Mekel-Bobrov, N.; Vallender, E.J.; Anderson, J.R.; Vaez-Azizi, L.M.; Tishkoff, S.A.; Hudson, R.R.; Lahn, B.T. Microcephalin, a gene regulating brain size, continues to evolve adaptively in humans. Science 2005, 309, 1717–1720. [Google Scholar] [CrossRef]
- Pickrell, J.K.; Coop, G.; Novembre, J.; Kudaravalli, S.; Li, J.Z.; Absher, D.; Srinivasan, B.S.; Barsh, G.S.; Myers, R.M.; Feldman, M.W.; et al. Signals of recent positive selection in a worldwide sample of human populations. Genome Res. 2009, 19, 826–837. [Google Scholar] [CrossRef] [Green Version]
- Van der Merwe, M.; Mcpherson, H.; Siow, J.; Rossetto, M. Next-Gen phylogeography of rainforest trees: Exploring landscape-level cpDNA variation from whole-genome sequencing. Mol. Ecol. Resour. 2014, 14, 199–208. [Google Scholar] [CrossRef] [PubMed]


| Population | Location | Latitude | Longitude | Samples |
|---|---|---|---|---|
| 01 | Brunby Plains | −28.4874 | 152.6518 | 6 |
| 02 | Billinudgel | −28.4976 | 153.5372 | 6 |
| 03 | Montecollum | −28.5919 | 153.4546 | 6 |
| 04 | Nightcap Ridge | −28.6113 | 153.3647 | 6 |
| 05 | Lismore | −28.8034 | 153.2809 | 6 |
| 06 | Washpool | −29.4724 | 152.3302 | 5 |
| 07 | Dorrigo | −30.3947 | 152.7459 | 2 |
| 08 | Mount Kaputar National Park | −30.5970 | 150.2961 | 6 |
| 09 | Oxley Wild Rivers National Park | −30.7429 | 152.0148 | 4 |
| 10 | Port Macquarie | −31.4597 | 152.9213 | 6 |
| 11 | Sea Acres National Park | −31.4641 | 152.9304 | 4 |
| 12 | Red Head | −32.0438 | 152.5324 | 5 |
| 13 | Barrington Tops | −32.0662 | 151.6635 | 6 |
| 14 | Cellito Beach | −32.3782 | 152.5283 | 3 |
| 15 | Fern Tree Gully | −32.6595 | 150.0347 | 6 |
| 16 | Putty Road | −32.7304 | 150.9415 | 6 |
| 17 | Colo River | −33.4319 | 150.8311 | 6 |
| 18 | Yarramundi Reserve | −33.6098 | 150.7142 | 6 |
| 19 | Govetts Leap, Blue Mountains | −33.6291 | 150.3168 | 6 |
| 20 | Berowra River | −33.6654 | 151.0811 | 6 |
| 21 | Depot Beach | −33.7960 | 151.0681 | 6 |
| 22 | Royal National Park | −34.1535 | 151.0286 | 5 |
| 23 | Stanwell Tops | −34.2270 | 150.9805 | 6 |
| 24 | Macquarie Pass | −34.5731 | 150.5731 | 6 |
| 25 | Minnamurra Forest | −34.6349 | 150.7246 | 6 |
| 26 | Kangaroo Valley | −34.7607 | 150.6161 | 6 |
| 27 | Bungonia National Park | −34.7995 | 150.1387 | 6 |
| 28 | Wandandian Creek | −35.0982 | 150.5032 | 6 |
| 29 | Mount Agony | −35.7278 | 150.1973 | 6 |
| 30 | Deua National Park | −35.9640 | 149.9360 | 6 |
| 31 | Gulaga National Park | −36.3179 | 150.0741 | 6 |
| 32 | Brogo | −36.5569 | 149.8180 | 6 |
| Population | AR | HE | HO | FIS | PA |
|---|---|---|---|---|---|
| 01 | 1.458 | 0.274 | 0.265 | H 0.018 | H 154 |
| 02 | 1.449 | 0.271 | L 0.260 | H 0.020 | H 222 |
| 03 | 1.451 | 0.268 | 0.266 | −0.006 | H 150 |
| 04 | 1.430 | 0.257 | 0.265 | −0.038 | 115 |
| 05 | H 1.470 | H 0.276 | 0.274 | −0.006 | H 149 |
| 06 | 1.455 | 0.271 | 0.266 | 0.001 | 149 |
| 07 | *L 1.368 | *L 0.208 | 0.266 | *L −0.290 | *L 28 |
| 08 | L 1.347 | L 0.196 | L 0.236 | L −0.183 | 51 |
| 09 | 1.446 | 0.261 | 0.269 | −0.047 | 69 |
| 10 | 1.452 | 0.264 | 0.273 | −0.039 | 146 |
| 11 | 1.451 | 0.261 | H 0.277 | −0.078 | 95 |
| 12 | H 1.472 | H 0.275 | H 0.276 | −0.020 | 71 |
| 13 | H 1.474 | H 0.278 | H 0.276 | −0.006 | 61 |
| 14 | 1.417 | L 0.236 | 0.272 | L −0.159 | 67 |
| 15 | 1.421 | 0.242 | 0.269 | L −0.108 | 59 |
| 16 | 1.466 | 0.273 | 0.276 | −0.022 | 101 |
| 17 | 1.460 | 0.271 | 0.266 | 0.000 | 73 |
| 18 | 1.465 | 0.269 | 0.273 | −0.028 | 87 |
| 19 | 1.438 | 0.248 | 0.271 | −0.086 | 52 |
| 20 | 1.438 | 0.256 | 0.275 | −0.065 | 69 |
| 21 | H 1.470 | H 0.275 | 0.270 | H 0.005 | 67 |
| 22 | 1.461 | 0.271 | 0.274 | −0.028 | 56 |
| 23 | 1.465 | 0.274 | 0.275 | −0.017 | 77 |
| 24 | 1.460 | 0.271 | 0.269 | −0.004 | 54 |
| 25 | 1.464 | 0.272 | 0.268 | −0.001 | 69 |
| 26 | 1.462 | 0.273 | 0.264 | H 0.008 | 58 |
| 27 | L 1.415 | 0.244 | L 0.243 | −0.012 | 46 |
| 28 | 1.463 | 0.266 | H 0.277 | −0.045 | L 39 |
| 29 | L 1.413 | L 0.234 | L 0.261 | −0.105 | L 33 |
| 30 | 1.442 | 0.258 | 0.267 | −0.043 | L 44 |
| 31 | 1.446 | 0.261 | 0.261 | −0.012 | 51 |
| 32 | L 1.329 | L 0.177 | L 0.259 | L −0.34 | L 30 |
Publisher’s Note: MDPI stays neutral with regard to jurisdictional claims in published maps and institutional affiliations. |
© 2021 by the authors. Licensee MDPI, Basel, Switzerland. This article is an open access article distributed under the terms and conditions of the Creative Commons Attribution (CC BY) license (https://creativecommons.org/licenses/by/4.0/).
Share and Cite
Wilde, B.C.; Rutherford, S.; Yap, J.-Y.S.; Rossetto, M. Allele Surfing and Holocene Expansion of an Australian Fig (Ficus—Moraceae). Diversity 2021, 13, 250. https://doi.org/10.3390/d13060250
Wilde BC, Rutherford S, Yap J-YS, Rossetto M. Allele Surfing and Holocene Expansion of an Australian Fig (Ficus—Moraceae). Diversity. 2021; 13(6):250. https://doi.org/10.3390/d13060250
Chicago/Turabian StyleWilde, Brendan C., Susan Rutherford, Jia-Yee S. Yap, and Maurizio Rossetto. 2021. "Allele Surfing and Holocene Expansion of an Australian Fig (Ficus—Moraceae)" Diversity 13, no. 6: 250. https://doi.org/10.3390/d13060250