Article

High Differentiation among Populations of Green Foxtail, Setaria viridis, in Taiwan and Adjacent Islands Revealed by Microsatellite Markers

1
Department of Agronomy, National Taiwan University, Taipei 10617, Taiwan
2
Endemic Species Research Institute, Council of Agriculture, Nantou 552203, Taiwan
3
Headquarter, World Vegetable Center, Shanhua, Tainan 741005, Taiwan
*
Author to whom correspondence should be addressed.
Diversity 2021, 13(4), 159; https://doi.org/10.3390/d13040159
Submission received: 16 March 2021 / Revised: 30 March 2021 / Accepted: 1 April 2021 / Published: 7 April 2021
(This article belongs to the Special Issue Weed Ecology and Diversity)

Abstract

:
Setaria viridis (L.) Beauv., or green foxtail, is native to Eurasia and is the putative ancestor of foxtail millet. Due to the advantageous genetic characteristics of S. viridis, it is a model species for C4 plants. However, S. viridis has seriously spread to the agricultural system around the world because of its wide adaptability. This study is aimed to understand the distribution of S. viridis in Taiwan, and also to investigate the genetic diversity and relationships among different wild populations. A total of 141 S. viridis collected at 10 sites with sampling sizes ranging from 8 to 24 plants in Taiwan were analyzed by 13 highly polymorphic SSR markers, and 6.1 alleles per locus were detected in our study. The relationships of collected S. viridis mostly corresponded to its distribution in different parts of Taiwan revealed by PCoA and phylogenetic tree. Similarly, the results for population structure showed the significance of collecting site or geographical factors. Finally, the extent of gene flow was studied with the genetic differentiation (FST) and Nm values, and two S. viridis populations were found to significantly contain the existence of gene-flow events. In conclusion, S. viridis showed a pattern of low diversity and heterozygosity within a population, but high differentiation among populations because of its selfing attribute and the barriers of sea and mountain range for gene flow. In addition, the founder effect may be the other reason for this pattern of population genetic structure.

1. Introduction

Setaria viridis (L.) Beauv., or green foxtail, belongs to the grass family Poaceae, and is native to Eurasia [1,2,3]. It is the putative ancestor of foxtail millet, Setaria italica (L.) Beauv., which was domesticated and selected by farmers in northern China about 10,500 years ago, based on archeological evidence [4,5,6,7]. Currently, foxtail millet is a minor crop cultivated in India, China and Taiwan for food, and in Europe for birdseed mainly [8]. The world production of millet was around 31 million tons in 2018, and foxtail millet is the largest crops among millets [9]. The cytogenetic study of GISH [10] and the phylogenetic relationship analyzed with chloroplast and nuclear genes [11,12] showed that the genome difference between S. italica and S. viridis was slightly distinguishable, which is concordant with the fact that few different morphological traits can be observed between them [5,13,14]. Furthermore, there was about 22% of SNP variation detected in both S. viridis and S. italica in the genome-wide data [15].
Due to its small stature, short lifecycle (6–8 weeks), small genome size (~510 Mb), diploidy (2n = 18), self-pollination, efficient C4 photosynthesis and transformability, S. viridis has been recommended as a model species for the research of C4 plants, which also include switchgrass, maize and sorghum [1,16,17,18,19]. In addition, a new genomic resource of S. viridis was released by de novo assembly recently [15]. On the other hand, the whole-genome sequencing of foxtail millet has been released [16,20], and it makes S. italica important in model systems as well [17]. Recombinant inbred lines (RILs) of S. italica x S. viridis, accession A10, have been thoroughly investigated and applied in research on bioenergy, feed and forage of stock [16,17,19,21,22]. Moreover, A10 accession has been established and applied to QTL mapping and the construction of a genetic map [16,22].
The problem of invasive weeds caused losses of agriculture, overdose application of pesticide and more pollution to environments and eco-systems. S. viridis possesses the potential to adapt to various environments and habitats; consequently, it has invaded not only throughout the temperate, but in some subtropical and tropical regions of agricultural systems worldwide [8,23,24,25,26]. The variable biodiversity in phenotype and genotype allows S. viridis to invade, endure and colonize in different local environments [3]. The seeds can float with water flow for 10 days [27] or attach to animals or human clothing with the bristles on the panicles to disperse for a long distance [28,29,30,31]. Hence, it is considered as a serious weed for agriculture in many countries, such as Canada, the USA, Spain and Japan [4,30,32,33], and usually grows near riverbanks and lakes, and in roadsides, grain fields, wastelands and any other disturbed regions [34,35]. The invasiveness of S. viridis was detrimental to crop growth and production, with one reference of reported losses of 21% and 44% yields of wheat [36]. Furthermore, many other crops, like grain sorghum, rice and alfalfa, were also reported to be influenced by S. viridis significantly [28,29,37]. Despite being a noxious weed, S. viridis is extensively used as forage in Europe and as herbal medicine in some regions of Asia [38,39]. In North America, S. viridis is widely dispersed [30], but it does not tend to occupy high mountains and regions of lower latitudes [40]. Similarly, Jia et al. (2013) found that S. viridis was localized to northern latitude regions in China, suggesting that the local populations are more adapted to temperate climates [41].
Due to the interfile between S. italica and S. viridis, the occurrence of gene flow might make the weediness of S. viridis more powerful in nature [14,42]. For example, the giant green foxtail, S. viridis var. “major” (Gaud.) Posp., an intermediate type, is originally from the hybridization between wild S. viridis and cultivated S. italica [14,34,43]. In addition, S. faberi R. A. W. Herrma and S. verticillata (L.) P. Beauv., the tetraploid species (AABB genome), originated from a natural crossing between S. adhaerans (Forssk.) Chiov. and S. viridis [10]. On the contrary, it was also reported that reproductive barriers partially existed, resulting in a low level of introgression and gene flow in a wild-weed-crop complex [14,44,45,46]. It seems that the risk of gene flow between S. italica and S. viridis is low [47].
Until now, there were some studies about the genetics, genomics and evolution of S. italica published, but few about S. viridis. Related studies of S. viridis did not attract much attention, although it has been recommended as a model system for the studies of C4 photosynthesis, biofuels, and drought and salinity tolerance. The abundance of foxtail millet landraces has been observed in China and Taiwan [48,49,50]. The intrapopulation genetic diversity of weedy Setaria species (S. viridis, S. faberi, S. parviflora (Poir.) Kerguélen, S. pumila (Poir.) Roem. and Schult., S. verticillata) was quite low, but quite high in inter-population genetic diversity [40,51,52]. Interestingly, the low level of genetic diversity of S. viridis was observed in comparison with the other crop wild relatives, such as Oryza rufipogon and teosinte [26,53,54]. Instead, the cultivated S. italica displayed high diversity compared to sorghum and rice [55,56]. Overall, the genetic diversity and phylogenetic relationship was mostly assessed in the studies of foxtail millet [57,58,59,60], and only a few studies also included S. viridis collections [12,41,61]. In our opinion, these studies are not enough to deeply understand the genetic diversity and population structure of S. viridis, and many questions still remain unanswered. Importantly, that kind of information is crucial for germplasm conservation, genetic mapping, association studies and breeding programs [62,63].
The earliest described specimen of S. viridis in Taiwan is the one numbered 107,274 in the herbarium HAST, which was collected in 1916, and the earliest documentation in Taiwan was recorded in 1930 [64]. On the other hand, according to the archeological evidence, the cultivation of foxtail millet in Taiwan could be dated back to 5000 years ago [65]. Foxtail millet is one of the traditional foods for Taiwanese aborigines, and it also was used to brew alcoholic beverages because of the waxy property of Taiwanese landraces [48]. However, genomic or genetic diversity of S. viridis and its mechanism of success in becoming an aggressive weed in Taiwan are little understood so far. In this study, we hope to address the following issues: (i) how the pattern of the genetic diversity of S. viridis in Taiwan came about; (ii) the estimated population structure of genetic variation and genetic relationship of different S. viridis populations in Taiwan; and (iii) the pattern of genetic differentiation among S. viridis populations in different geographical regions of Taiwan.

2. Materials and Methods

2.1. Field Collections of S. viridis in Taiwan

The field survey covered Eastern and Western Taiwan, and several offshore islands belonging to the Taiwan Government as well. A total of 141 individuals of S. viridis were collected from 10 sites, including four on main island of Taiwan and six distributed on different offshore islands (Table 1). The individuals from the same collection site were regarded as a population. The sample size of every population ranged from 8 to 24. Fresh leaves were dried out using desiccant beads, then preserved at 4 °C. The longitudes and latitudes of all sites were recorded in WGS84 format.

2.2. Genotyping by Microsatellite

The dried leaf of each sample was homogenized using tungsten carbide beads with Tissuelyser, then the genomic DNA was extracted by using the TPS method with modifications [66]. Twenty-five markers were used at first based on the PIC (polymorphism information content) value reported by Zhang et al. [67].
The forward and reversed primers were elongated with 5′ ACGACGTTGTAAAA 3′ and reversed 5′ CATTAAGTTCCCATTA 3′ sequences, respectively, to perform multiplex-ready PCR [68]. The PCR reaction mixture of each sample was 10 μL in total volume, containing 20 ng template DNA, 1 μL 1× IMMOLASE buffer (BIOLINE), 0.2 mM dNTP, 2.0 mM MgCl2, 40 nM primers, 80 nM fluorophores (VIC, 6-FAM, NED, or PET), 0.05 μL IMMOLASE DNA polymerase (BIOLINE) and 4.55 μL ddH2O. The amplification program was performed with the following steps: 95 °C 10 min, 20 cycles of 92 °C for 30 s, 63 °C for 90 s, 72 °C for 60 s, then 40 cycles of 92 °C for 15 s, 54 °C for 30 s and 72 °C for 60 s. The four PCR products were pooled together at a ratio of 2:3:4:6 (VIC:6-FAM:NED:PET) in volume, then we used GSLIZ600 as internal control. The size of the SSR fragments was detected by capillary electrophoresis. An elite variety of foxtail millet (Setaria italica) in Taiwan, Taitung Number 8 (TT8), was also pooled into each plate to correct the size bias among different plates. The FSA (.fsa) files that contained fragment sizes and fluorescence intensities were analyzed using the “Fragman” v1.0.9 package in R software v4.0.2 [69,70]. After filtering out the markers with multiple peaks (multiallele), a set of 13 SSR markers distributed on nine chromosomes was selected and used for further analysis.

2.3. Genetic Diversity and Clustering Analysis

The genetic diversity of each marker and sampling site were evaluated with the parameters of allele numbers (Na), effective allele numbers (Ne), observed heterozygosity (Ho) and expected heterozygosity (He), which is also called gene diversity [71], using the “PopGenReport” v3.0.4 package in R software [72]. Additionally, the polymorphism information content (PIC) of each marker was calculated with the “polysat” v1.7.4 package in R software [73].
As for the clustering analysis of 141 S. viridis samples, the genetic distance between each pair of individuals was estimated by Euclidean distance using the “adegenet” v2.0.1 package in R software [74]. Subsequently, the distance matrix was used for a principal coordinate analysis (PCoA) using the “cmdscale” function and for constructing a neighbor-joining tree with the “ape” v5.4 package in R software [75]. The variety TT8 was included as an outgroup for phylogenetic tree.
The term “population structure” was defined as the genetic background of all 141 S. viridis individuals and estimated with STRUCTURE v2.3.4 using an admixture model [76]. The term “subpopulation” was defined as the clusters based on the optimum clustering number (K value). The K value was tested from 1 to 11 to find the best K for 141 S. viridis individuals. For each K value, burn-in period and Markov chain Monte Carlo (MCMC) were both set to 100,000× with 20 replications. The result of STRUCTURE was integrated with the “pophelper” v2.3.0 package in R software [77], and the optimum K value was determined by the value of delta K described in the Evanno method [78]. Finally, the results above were visualized using the “ggplot2” [79] and “ggtree” v3.11 packages in R software [80]. The individuals in the barplot of STRUCTURE were sorted by 10 collection sites, from #01 to #10. The different genetic background of each collection site based on structure analysis were represented by pie charts on the map of Taiwan.

2.4. F-Statistics of Populations at 10 Collection Sites

Wright’s F-statistics, including FIS, FST and FIT, were used to summarize the population structure among the 10 collection sites [81]. The estimator of each parameters was described by Weir and Cockerham [82]. The FST-derived estimator, Nm value [83], was further used to evaluate the gene flow between each pair of collection sites under the island model theory. The formula used was Nm = (1 − FST)/4FST [81]. Finally, all of the F-statistics parameters were calculated in R software.

3. Results

3.1. Molecular Diversity of Microsatellite Markers from the Individuals of Green Foxtail in Taiwan

Thirteen SSR markers were used to assess the genetic diversity of 141 S. viridis individuals in Taiwan (Table 1). A total of 79 alleles were detected, with an average of 6.1 alleles per locus. The observed allele number ranged from 2 (SICAAS5005, SICAAS6052, SICAAS7090, SICAAS9121) to 16 (SICAAS1065). On the other hand, the effective allele number (Ne) was predicted when the number of alleles with equal frequency was assumed. In average, 3.558 effective alleles per locus were measured in all S. viridis populations. The marker SICAAS1015 showed the largest Ne (9.18), and SICAAS5005 showed the smallest Ne (1.26). The value of observed heterozygosity (Ho) ranged from 0.015 to 0.022 for all markers. Compared to the expected heterozygosity (He), the mean of Ho was only 0.0054, indicating the characteristic of high self-pollinated rate of S. viridis. In addition, nine out of 13 SSR markers displayed none of the observed heterozygosity in our study. Conversely, the values of expected heterozygosity (He) ranged from 0.21 (SICAAS5005) to 0.89 (SICAAS1015). Four markers, SICAAS1015, SICAAS1065, SICAAS2084 and SICAAS3090, exhibited more abundant gene diversity in our study. The PIC values ranged from 0.18 (SICAAS5005) to 0.88 (SICAAS1015) with a mean of 0.527, indicating that highly polymorphic SSR markers were used in our study. The marker SICAAS5005 showed the lowest PIC value, and provided little information for the analysis. The PIC values of seven markers were within the range of 0.25 to 0.5, displaying moderate polymorphic information. Finally, the PIC values of five markers were over 0.7, representing high polymorphism in our study (Table 2).
The genetic diversity indexes of S. viridis populations collected from 10 sites were revealed in this study (Table 3). Among all 10 collection sites, the number of observed alleles ranged from 13 (sites #01 and #02) to 29 (site #08), with a mean of 18.9. Similarly, the largest number of effective alleles was also detected at site #08, and the lowest was at both site #01 and #02. Overall, 15.619 effective alleles per site were found. The observed heterozygosity (Ho) was only detected at three sites (#03, #08 and #10) with very small values, and the other populations of S. viridis showed none of Ho. The mean of Ho was 0.005, which was expected due to the characteristics of self-pollination of S. viridis. As for the expected heterozygosity (He), it ranged from 0.03 (site #04) to 0.27 (site #08), and no He was observed at two collecting sites (#01 and #02).

3.2. Genetic Relationship of Green Foxtail Individuals Collected in Taiwan

The results of the principle coordinate analysis offer preliminary insight on the genetic relationship among 141 S. viridis individuals or 10 wild populations collected in Taiwan (Figure 1). The first and the second coordinates explained 23.00% and 14.90% of variability, respectively. First of all, sites #01 and #05, which are both in Western Taiwan, were grouped together. Secondly, three collecting sites, all in Taitung County (sites #02 and #03), including small island Ludao (site #4), had a slightly close relationship with each other. However, two individuals at site #03 were slightly away from the others. Interestingly, the S. viridis at site #06 and site #07 (Qimei and Huxi in Penghu, respectively) were significantly isolated from the other sites. However, one collection belonging to site #06 was closer to the individuals at sites #01 and #05. Finally, three outer collection sites (#08, #09 and #10) closer to mainland China showed an overlapped pattern with each other that indicated a closer relationship among them.
A similar pattern with more details is presented in the phylogenetic tree (Figure 2). Individuals collected in Taitung County, including sites #02, #03 and #04, were in Clade I. Broadly, S. viridis individuals collected at site #04 (Ludao) were closer to collections at site #03 (Taitung), however, several individuals collected at site #03 showed a complex and mixed relationship among these populations. Individuals from site #01 (Miaoli) and #05 (Chiayi), with clear geographical separation, were grouped in Clade II. Nevertheless, an individual from site #06 (Penghu) was grouped in this clade, indicating the probable movement behavior of S. viridis individuals could occur between Penghu and Chiayi occasionally. Besides, some individuals from site #08 were closer to site #09 (see Clade III), and the others were closer to site #10 instead (see Clade IV), suggesting the higher abundance of S. viridis at site #08 (Jinning, Kinmen). Furthermore, the individuals from site #09 (Jinsha, Kinmen) showed clear separation from the individuals from site #10 (Lienchang). Moreover, the individuals from site #09 can be further divided into two small clusters. The individuals from site #07 (Huxi, Penghu) were also isolated as Clade V. Similarly, most S. viridis individuals from site #06 were obviously separated from the others (as Clade VI), but an exception was grouped in Clade II and closer to the individuals at site #05. This is consistent with the result of the PCoA (Figure 1).

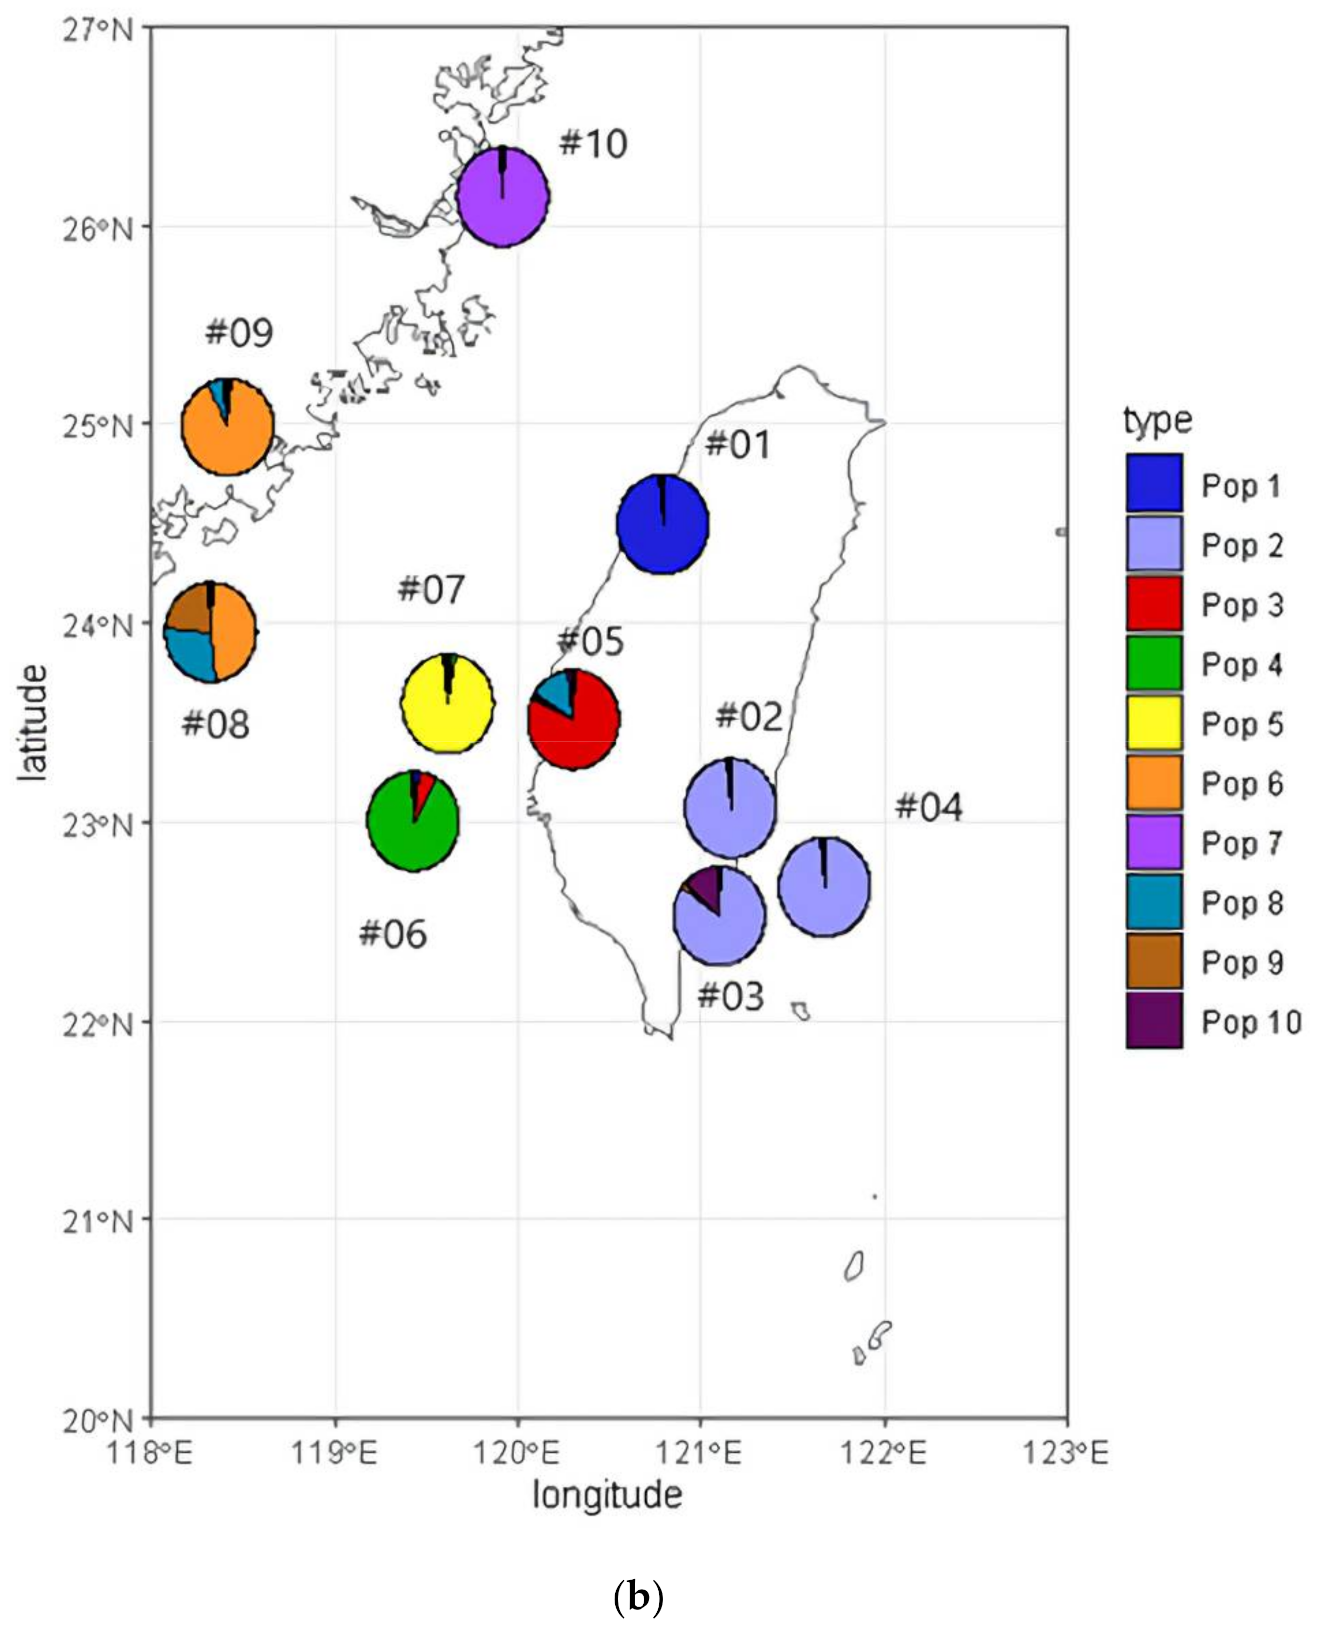
3.3. Population Structure and Geographic Distribution

The population structure of S. viridis collected from 10 sites was simulated by STRUCTURE (Figure 3a). The K value was inferred by the Evanno method, from K = 1 to K = 11 (Figure S1). The best K value was 10; however, 10 colors of different genetic backgrounds did not exactly represent the 10 collection sites (Figure 3b). In addition, the admixed individual is defined when the percentage of its own genetic background does not exceed at least 80%. The wild populations collected at sites #01, #02, #04 and #10 possessed pure genetic backgrounds with no admixture. In contrast, four individuals from site #05, three from #09, two from #06, one from #07 and most individuals from #08 were considered as admixture. Above all, the individuals collected from site #08 (Jinning, Kinmen) displayed the most complicated pattern (Figure 3b). The individuals from site #01 (Miaoli) and site #10 (Lienchiang) independently formed distinct subpopulations, called Pop 1 and Pop 7, respectively. Moreover, the individuals from sites #02, #03 and #04, in Eastern Taiwan (Taitung) were all grouped in Pop 2. Interestingly, two individuals from site #03 exceptionally formed another subgroup (Pop 10). The individuals from site #05 (Chiayi) were all grouped in Pop 3, mixed with another genetic background that also appeared in Pop 8 (in greenish blue), indicating potential gene flow or introgression. Surprisingly, two collecting sites of S. viridis from Penghu (sites #06 and #07) clearly formed two different subpopulations, Pop 4 for site #06 and Pop 5 for site #07 (see Figure 3a and Table 1). In addition, one individual collected at site #06 was grouped in Pop 3 instead of Pop 4, and showed high percentage of red background, which can be also noticed in the phylogenetic tree (Figure 2) and the PCoA (Figure 3). Finally, the individuals from sites #08 and #09 (Kinmen) were grouped in Pop 6, but displayed the mixed genetic background of Pop 8 and Pop 9.

3.4. Genetic Differentiation among the Populations of S. viridis in Taiwan

F-statistics were also estimated in this study. All FIS and FIT values for the 10 sampling sites were all over 0.96. The lowest value of FIS (0.9653) and FIT (0.9790) were observed at site #10 (Lienchiang), an offshore island of Taiwan that is close to mainland China. The highest FIS (0.9921) was detected at site #05 (Chiaiyi), and the highest FIT (0.9950) was detected at sites #02 and #04 (Taitung). Overall, it was concluded that the wild S. viridis in Taiwan are highly self-pollinated within a population, which agreed with the result of low observed heterozygosity (Table 3). The extent of genetic differentiation between populations was estimated by FST value. We found high genetic differentiation among wild S. viridis populations in Taiwan. The populations at site #02 (Taitung) and site #01 (Miaoli) displayed the highest FST values, 0.4995 and 0.4895, respectively. Oppositely, site #08 (Kinmen) displayed a relatively smaller FST value (0.2525), suggesting that more gene flow events might take place in this area. Likewise, the number of immigrants (Nm) denotes the extent of gene flow, in which great differences of Nm value were found (0.25 to 0.74). Obviously, the highest extent of gene flow was detected at site #08, Kinmen (0.74), and smaller Nm values were observed at sites #01, #02 and #04, Taitung (0.25 to 0.27), which is in accordance with the results of genetic differentiation (Table 3).

3.5. Pairwise FST Index of Collecting Populations in Taiwan

Pairwise FST value, representing the extent of genetic differentiation between populations, was assessed for the 10 collection sites, and ranged from 0.14 to 0.62 (Table 4). The least extent of genetic differentiation was between sites #08 and #09 (Kinmen), indicating gene flow events might happen more frequently here. Next, the S. viridis populations collected at sites #03 (Taitung) and #04 (Ludao) also showed a low level of genetic differentiation (FST = 0.17). The FST values among sites #02, #03 and #04, in Taitung, were quite small in comparison with the others. On the contrary, the highest level of genetic differentiation was observed between site #07 (Huxi, Penghu) and site #04 (Ludao, Taitung), which are both small offshore islands off Taiwan’s main island (Figure 3b). Next, three combinations from different collection sites showed the second-highest genetic differentiation (FST = 0.59): #07 (Penghu) and #02 (Taitung), #09 (Kinmen) and #06 (Penghu), and #10 (Lienchiang) and #06 (Penghu). In addition, two collection sites, #06 and #07 (Penghu), showed relatively high genetic differentiation with the other populations. On the contrary, the S. viridis population at site #08 (Jinning, Kinmen) exhibited the opposite result in our investigation. For example, the populations collected at sites #05 (Chiayi), #10 (Lienchiang) and #07 (Huxi, Penghu) separately showed the least genetic differentiation with site #08, suggesting that the composition of S. viridis at site #08 is more complex than the others. Finally, the population collected at site #01 (Miaoli) also showed the least genetic differentiation (FST = 0.36) with the population at site #05 (Chiayi), which also is located in Western Taiwan (Figure 3b).

4. Discussion

4.1. Molecular Diversity of Microsatellite from the Individuals of Green Foxtail in Taiwan

Simple sequence repeats (SSRs) are very useful for the investigation of population genetics and studies of evolution because they is easy to manipulate and contain abundant molecular variations and information [84,85,86]. In this study, 6.1 allele numbers were observed from 141 S. viridis individuals with 13 SSR markers. Despite the estimated PIC value, 0.527 on average, being lower than that in other related studies of S. viridis or S. italica [44,55,57], highly polymorphic markers were still used in our analysis (Table 2). The other related grass species of S. viridis, such as Miscanthus sinensis and switchgrass, showed different patterns. The naturalized populations of M. sinensis in the United States contained only 2.3 alleles per locus by 74 molecular markers, and the PIC value ranged from 0.2228 to 0.3030 [87]. Nevertheless, 8.7 alleles per locus were detected from 156 switchgrass individuals with 18 highly polymorphic markers [88]. Therefore, we thought that the quality of used markers was much more important than the quantity of markers. In our analysis, we preferred to select highly informative markers because it was reported that a small number of molecular markers with high quality can be enough for analysis of genetic variation [89]. Only four markers (SICAAS1065, SICAAS3090, SICAAS7002, SICAAS8025) displayed low extent of the observed heterozygosity (Ho), indicating that in Taiwan, S. viridis is a highly selfing species, which corresponds with previous studies [26,40]. In addition, a similar pattern of Ho value in terms of S. viridis at different collection sites was also observed (Table 3). On the other hand, importantly, the advantages of low heterozygosity (high rate of selfing) includes the ease of sequencing, and better analyzing and understanding of genetic and evolutionary mechanisms [90,91]. Besides, an effective allele number (Ne) based on the frequency of variants is an alternative measure of intrapopulation diversity [92]. Hence, it basically corresponds to the expected heterozygosity (Table 2). An average effective allele number of 3.558 can be seen in our S. viridis populations in terms of the assessment of 13 SSR markers. Interestingly, the Ne value of S. viridis in Taiwan was higher than that in mid/southern US, but much lower than the Asian populations [89].
For the purpose of better understanding the relationship between the genetic diversity and geographical distribution, we mainly focused on the genetic diversity of S. viridis populations from different parts of Taiwan (Table 3). The highest value of observed allele number (Na), effective allele numbers (Ne) and expected heterozygosity of S. viridis population were all detected at site #8 (Kinmen), indicating the highest genetic diversity of S. viridis was preserved in a population on Kinmen Island, near mainland China, which might be one of the origin of S. viridis (cp. [1,3]). On the contrary, the lowest genetic diversity was observed at site #1 (Miaoli) and site #2 (Taitung) in terms of the relatively low Na, Ne and He. The relatively low genetic diversity of intrapopulation of S. viridis was reported previously [40,51,52]. Wild sorghum populations collected from different regions in Africa showed high genetic diversity, He = 0.46 on average, assessed by six SSR markers [93]. Likewise, the M. sinensis population collected in the US showed a medium level of genetic diversity, with He values ranging from 0.2776 to 0.3738 [87]. However, in this study of S. viridis in Taiwan, the level of heterozygosity was considerably low in comparison with previous studies (cf. [41,89]).

4.2. Genetic Relationship and Structure of Green Foxtail Individuals among Different Parts of Taiwan

Basically, both the PCoA and phylogenetic analysis showed a similar pattern of results, which is accordance with geographical distribution and concordant with previous studies. The main island of Taiwan extends 394 km along its north–south oriented axis and a width of 140 km at its broadest. There are 268 peaks above 3000 m in elevation, and all of them are located within the so-called Central Range, which basically follows the axis of the island. No doubt this Central Range is a barrier for the gene flow between the east and west parts of Taiwan [94]. In addition to the isolation by the Taiwan Strait, the Central Range on the main island of Taiwan is also a barrier for gene flow. The S. viridis were also found to be grouped by regions or species in phylogenetic tree in a previous study [61]. Moreover, our results were concordant with the PCA pattern from the world-wide S. viridis panel in terms of SNP, PAV and structural variant genetic structure (cf. [15]). As a result, the genetic relationship may be influenced by geographical distribution for the same species [95]. In this study, some individuals from different populations clustered together in the same clade, displaying the mixed genetic branches of S. viridis collected at different sites in the phylogenetic tree (Figure 2). This might be the result of migration caused by human activities and long-distance animal movements. For example, there is routine transportation by ferry between Taitung City (site #03) and Ludao (site #04). The same ferry shuttle also ran between Chiayi (site #05) and Huxi (site #07). The simulated genetic backgrounds basically agreed with the administrative districts of Taiwan, except that Pop 4 and Pop 5 were two separate townships in Penghu (Figure 3a). Notably, four out of 10 S. viridis samples in Chiayi (site #05) showed admixed genetic background, which was also found at sites #08 and #09 in Kinmen. In addition, relatively low genetic differentiation between sites #05 and #08 was detected (Table 4), implying that some of the S. viridis in Chiayi might be taken from Kinmen because of human activities. Finally, pure and different genetic backgrounds at collection sites suggested that gene flow rarely happened among them, causing the pairwise genetic differentiation to be quite high. It was concluded that the S. viridis at these sites mainly reproduced by selfing, and it was hard for them to disperse by pollens or seeds of their own. Finally, the S. viridis individuals in the population at site #08 (Jinning, Kinmen) mixed in clade III and IV, showing the most complex genetic variation in our study in terms of the analysis of genetic-diversity parameters, population structure and genetic relationship (Table 3, Figure 3a).

4.3. Genetic Differentiation and Possible Gene Flow among the Populations of Different Collection Sites

F-statistics is one of the major measures to examine the differentiation between a subdivided population that deviates from the Hardy–Weinberg equilibrium. Briefly, FIS, FIT and FST represent the genetic diversity of different types of conditions that are individuals within the subpopulation, individuals within the total population and subpopulation within the total population, respectively [81,82]. In this study, low FIS and FIT values were observed at sites #08 (Kinmen) and #10 (Lienchiang), indicating that the inbreeding coefficient of S. viridis collected at sites #08 and #10 were relatively low. Consequently, the observed heterozygosity of S. viridis at these two sites were essentially high (Table 3). The extent of genetic differentiation (FST) among populations varied up to two times. S. viridis collected at site #08 showed the lowest genetic differentiation (FST = 0.2525), and the population at site #05 was ranked second (FST = 0.3540), indicating that gene flow in Kinmen and Chiayi might have occurred more frequently. Oppositely, the collected populations at site #01 (FST = 0.4895) and site #02 (FST = 0.4995) showed high extents of genetic differentiation, which might be due to less chance of interflow with other populations (Table 3). The higher Nm values at sites #05 and #08 were observed; however, the two admixed populations contained elevated heterozygosity (He), indicating gene flow might have taken place at these two sites recently [96,97]. Instead, the S. viridis at site #09 showed a relatively higher Nm value (0.33), but lower heterozygosity (0.07), which may be the result of ancient crossing, then followed by inbreeding with no cross-pollination [26]. It was reported that elevated diversity might be the result of multiple origins or larger populations [15]. The collection sites with no admixed individuals (sites #01, #02 and #04), exhibited a lower Nm value (<0.3), suggesting that less gene flow occurred before.
Pairwise FST varied dramatically, 0.14 to 0.62 (Table 4). The higher extent of genetic differentiation between the S. viridis populations was mostly observed at sites #06 or #07 compared with other collection sites. For example, the highest one (FST = 0.62) was detected between site #07 (Huxi, Penghu) and site #04 (Ludao, Taitung), two offshore islands of Taiwan. Likewise, some studies found that S. viridis both in Eurasia and North America displayed strong intracontinental differentiation [40,95]. In addition, the populations at site #09 (Kinmen) and #10 (Lienchiang) also showed the same extent of high genetic differentiation (FST = 0.59) as site #06. As a result, the S. viridis populations collected at sites #06 and #07 seemed to be more departed from the other populations in Taiwan, which agreed with the patterns of the PCoA and the phylogenetic tree (Figure 1 and Figure 2). In fact, site #06 (Qimei) and site #07 (Huxi) belong to the Penghu archipelago, which is located in the middle of the Taiwan Strait (Table 1). One possible reason could be that the special climate of Penghu could have selected or filtered certain genotypes or genes, which is the same condition in North America (cf. [15,89]). Oppositely, the smallest FST was observed between sites #08 and #09 (FST = 0.14), followed by the ones between sites #03 and #04 (FST = 0.17), which are located in the same counties, Kinmen and Taitung, respectively. On the other hand, the collection sites in the same administrative district, such as sites #02, #03 and #04 (Taitung), and sites #08 and #09 (Kinmen), revealed less genetic differentiation than the others, indicating that isolation by distance or geographic barriers may affect the possibility of migration or exchange [98], such as the spread of seeds or pollens by wind and animals in nature. The other explanation might be that more frequent human activities take place within the neighboring area, which then increase the probability of artificial and unintentional movement of caryopses and individuals [99,100]. For example, there are routine ferry shuttles between the regions of sites #03 and #04.
Sites #05 and site #08 displayed relatively less genetic differentiation compared to other sites, which is congruent with their higher values of Nm (Table 3). Interestingly, the genetic distance between S. viridis and S. italica in the same area was lower than that between different areas of the same species, indicating the geographical factors was more important in shaping genetic differentiation than taxonomical factor between S. viridis and S. italica [95]. The FST value between S. viridis and S. italica (at the taxonomical level) was 0.05 to 0.41 in a previous study, which was lower than that of our study (at the geographical level) [56]. On the contrary, different races or species of rice showed significantly genetic differentiation (FST = 0.1166 to 0.42). The FST value of Sorghum halepense populations collected in the US were quite low, indicating not much differentiation among wild sorghum populations from different states in the US [101].
In conclusion, S. viridis showed a pattern of low diversity and heterozygosity within a population, but high differentiation among populations. This is accordant with a similar previous study of a Taiwanese coastal herbal plant, Lysimachia mauritiana, with allozyme markers [102]. In L. mauritiana, allozyme variation was very low, and F-statistics indicated an extremely high level of population differentiation, implying limited gene flow among populations. This pattern of population genetic structure probably resulted from severe genetic drift triggered by genetic bottlenecks, suggesting that Taiwanese populations were likely to be derived from four independent founder events [102]. Several selective forces could influence the population structure, genetic diversity and differentiation of Setaria grass were mentioned in [3]. For example, the decreased allele richness of S. viridis samples in North America was the result of the founder effect or genetic drift. A strong population structure of S. viridis had been presented in the US and Canadian collections because of different climatic zones or latitude [26,89,95]. Instead, the populations collected from China lacked an obvious population structure [41,89,103]. Surprisingly, the S. viridis populations in Taiwan, a small island, still displayed a strong population structure (Figure 3a). Up to 84 % of the S. viridis samples were considered as pure individual, indicating a high selfing rate and low extent of gene flow occurred among populations in Taiwan. However, most of admixed individuals were found at site #08, probably due to the short distance away from mainland China, resulting in a more complex genetic background than the other populations in Taiwan. The extent of genetic diversity was essentially low, but displayed strong population structure and differentiation [104,105,106], suggesting that not only normal, but specifically adapted genotypes still existed in the S. viridis populations in Taiwan (cp. [3]).
Investigation of the genetic structure, differentiation and related pattern of geographical distribution can help us to better understand the domestication and evolutionary mechanism [107]. Moreover, the S. viridis collections with abundant diversity and characteristics could be a valuable resource for breeding programs of foxtail millet, as is planned or is already underway globally for other crop wild relatives (CWR) for the purpose of enhancing genetic resources, including those at risk of extinction [108,109,110]. Finally, the related knowledge needs to be re-examined at a genome-wide level, and even include more geographic areas with larger collections to investigate subtler population structure and obtain a better diversity panel that can be applied in GWAS (Genome-wide association study) and breeding program in the future.

Supplementary Materials

The following are available online at https://www.mdpi.com/article/10.3390/d13040159/s1, Figure S1: Delta K value from K = 2 to K = 10 evaluated by the Evanno method.

Author Contributions

C.-H.C. and Y.-R.L. initiated this project and looked for financial support; W.-H.H. and Y.-R.L. designed the experiments. The experiment and data analysis were conducted by Y.-C.C., and H.-C.L. and C.-H.C. collected all the samples. Finally, W.-H.H. and C.-H.C. drafted and revised the manuscript. All authors have read and agreed to the final version of the manuscript.

Funding

This research was funded from the project 106-2313-B-002-034-MY3 by Ministry of Science and Technology, Taipei, Taiwan and also the project 106AS-11.9.2-EI-W1 from the Council of Agriculture, Executive Yuan, Taipei, Taiwan.

Institutional Review Board Statement

Not applicable.

Informed Consent Statement

Not applicable.

Data Availability Statement

The data is not publicly available owing to privacy concerns. The data is available on request from the corresponding author.

Acknowledgments

This work was supported by the project 106AS-11.9.2-EI-W1 from the Council of Agriculture, Executive Yuan, Taipei, Taiwan. The source of funding was from the project 106-2313-B-002-034-MY3 from the Ministry of Science and Technology, Taipei, Taiwan.

Conflicts of Interest

The authors declare no conflict of interest.

References

  1. Brutnell, T.P.; Wang, L.; Swartwood, K.; Goldschmidt, A.; Jackson, D.; Zhu, X.G.; Kellogg, E.; Eck, J.V. Setaria viridis: A model for C4 photosynthesis. Plant Cell 2010, 22, 2537–2544. [Google Scholar] [CrossRef] [Green Version]
  2. Chen, C.H.; Lin, C.Y.; Kuoh, C.S. Panicoideae, Paniceae. In Grass Flora of Taiwan (2 of 3); Endemic Species Research Institute: Chichi, Taiwan, 2014; p. 158. [Google Scholar]
  3. Dekker, J. The foxtail (Setaria) species-group. Weed Sci. 2003, 51, 641–656. [Google Scholar] [CrossRef]
  4. Li, Y.; Wu, S.Z. Traditional maintenance and multiplication of foxtail millet (Setaria italica (L.) P. Beauv) landraces in China. Euphytica 1996, 87, 33–38. [Google Scholar] [CrossRef]
  5. Li, H.W.; Li, C.H.; Pao, W.K. Cytological and genetical studies of the interspecific cross of the cultivated foxtail millet, Setaria italica (L.) Beauv., and the green foxtail millet, S. viridis L. Agron. J. 1945, 9, 32–54. [Google Scholar] [CrossRef]
  6. Yang, X.; Wan, Z.; Perry, L.; Lu, H.; Wang, Q.; Zhao, C.; Li, J.; Xie, F.; Yu, J.; Cui, T.; et al. Early millet use in northern China. Proc. Natl. Acad. Sci. USA 2012, 109, 3726–3730. [Google Scholar] [CrossRef] [Green Version]
  7. Barton, L.; Newsome, S.D.; Chen, F.; Wang, H.; Guilderson, T.P.; Bettinger, R.L. Agricultural origins and the isotopic identity of domestication in northern china. Proc. Natl. Acad. Sci. USA 2009, 106, 5523–5528. [Google Scholar] [CrossRef] [Green Version]
  8. Austin, D.F. Foxtail millets (Setaria: Poaceae)—Abandoned food in two hemispheres. Econ. Bot. 2006, 60, 143–158. [Google Scholar] [CrossRef]
  9. Food and Agriculture Organization of the United Nations. FAOSTAT Statistical Database. Available online: http://www.fao.org/faostat/en/#data/QC/visualize (accessed on 15 October 2020).
  10. Benabdelmouna, A.; Shi, Y.; Abirached-Darmency, M.; Darmency, H. Genomic in situ hybridization (GISH) discriminates between the A and the B genomes in diploid and tetraploid Setaria species. Genome 2001, 44, 685–690. [Google Scholar] [CrossRef] [PubMed]
  11. Giussani, L.M.; Cota-Sánchez, J.H.; Zuloaga, F.O.; Kellogg, E.A. A molecular phylogeny of the grass subfamily Panicoideae (Poaceae) shows multiple origins of C4 photosynthesis. Am. J. Bot. 2001, 88, 1993–2012. [Google Scholar] [CrossRef] [PubMed] [Green Version]
  12. Doust, A.N.; Penly, A.M.; Jacobs, S.W.L.; Kellogg, E.A. Congruence, conflict, and polyploidization shown by nuclear and chloroplast markers in the monophyletic “bristle clade” (Paniceae, Panicoideae, Poaceae). Syst. Bot. 2007, 32, 531–544. [Google Scholar] [CrossRef]
  13. Harlan, J.R.; de Wet, J.M.J. Towards a rational classification of cultivated plants. Taxon 1971, 20, 509–517. [Google Scholar] [CrossRef]
  14. Darmency, H.; Zangre, G.R.; Pernes, J. The wild-weed-crop complex in Setaria: A hybridization study. Genetica 1987, 75, 103–107. [Google Scholar] [CrossRef]
  15. Mamidi, S.; Healey, A.; Huang, P.U.; Grimwood, J.; Jenkins, J.; Barry, K.; Sreedasyam, A.; Shu, S.; Lovell, J.T.; Feldman, M.; et al. A genome resource for green millet Setaria viridis enables discovery of agronomically valuable loci. Nat. Biotechnol. 2020, 38, 1203–1210. [Google Scholar] [CrossRef]
  16. Bennetzen, J.L.; Schmutz, J.; Wang, H.; Percifield, R.; Hawkins, J.; Pontaroli, A.C.; Estep, M.; Feng, L.; Vaughn, J.N.; Grimwood, J.; et al. Reference genome sequence of the model plant Setaria. Nat. Biotechnol. 2012, 30, 555–561. [Google Scholar] [CrossRef] [PubMed] [Green Version]
  17. Brutnell, T.P.; Bennetzen, J.L.; Vogel, J.P. Brachypodium distachyon and Setaria viridis: Model genetic systems for the grasses. Annu. Rev. Plant Biol. 2015, 66, 465–485. [Google Scholar] [CrossRef] [PubMed]
  18. Huang, P.; Shyu, C.; Coelho, C.P.; Cao, Y.; Brutnell, T.P. Setaria viridis as a model system to advance millet genetics and genomics. Front. Plant Sci. 2016, 7, 1781. [Google Scholar] [CrossRef] [PubMed] [Green Version]
  19. Li, P.; Brutnell, T.P. Setaria viridis and Setaria italica, model genetic systems for the Panicoid grasses. J. Exp. Bot. 2011, 62, 3031–3037. [Google Scholar] [CrossRef] [PubMed] [Green Version]
  20. Zhang, G.; Liu, X.; Quan, Z.; Cheng, S.; Xu, X.; Pan, S.; Xie, M.; Zeng, P.; Yue, Z.; Wang, W.; et al. Genome sequence of foxtail millet (Setaria italica) provides insights into grass evolution and biofuel potential. Nat. Biotechnol. 2012, 30, 549–554. [Google Scholar] [CrossRef] [Green Version]
  21. Diao, X.; Schnable, J.; Bennetzen, J.L.; Li, J. Initiation of Setaria as a model plant. Front Agric. Sci. Eng. 2014, 1, 16–20. [Google Scholar]
  22. Doust, A.N.; Kellogg, E.A.; Devos, K.M.; Bennetzen, J.L. Foxtail millet: A sequence-driven grass model system. Plant Physiol. 2009, 149, 137–141. [Google Scholar] [CrossRef] [Green Version]
  23. Chen, S.L.; Phillips, S.M. Setaria P. Beauv. In Flora of Chine; Wu, Z.Y., Raven, P.R., Eds.; Science Press: Beijing, China, 2006; Volume 22, pp. 531–537. [Google Scholar]
  24. Lorenzi, H.J.; Jeffery, L.S. Weeds of the United States and Their Control; Van Nostrand Reinhold: New York, NY, USA, 1987. [Google Scholar]
  25. Defelice, M.S. Green Foxtail, Setaria viridis (L.) P. Beauv. Weed Technol. 2002, 16, 253–257. [Google Scholar] [CrossRef]
  26. Huang, P.; Feldman, M.; Schröder, S.; Bahri, B.A.; Diao, X.; Zhi, H.; Estep, M.; Baxter, I.; Devos, K.M.; Kellogg, E.A. Population genetics of Setaria viridis, a new model system. Mol. Ecol. 2014, 23, 4912–4925. [Google Scholar] [CrossRef]
  27. Ridley, H.N. The Dispersal of Plants throughout the World; Reeve: Ashford, UK, 1930; p. 744. [Google Scholar]
  28. Douglas, B.J.; Morrison, I.N.; Thomas, A.G.; Maw, M.G. The Biology of Canadian Weeds. 70. Setaria viridis (L.) Beauv. Can. J. Plant Sci. 1985, 65, 669–690. [Google Scholar] [CrossRef] [Green Version]
  29. Holm, L.G.; Plucknett, D.L.; Pancho, J.V.; Herberger, J.P. The World’s Worst Weeds: Distribution and Biology; Krieger Publishing: Malabar, FL, USA, 1991; p. 609. [Google Scholar]
  30. Holm, L.G.; Plucknett, D.L.; Pancho, J.V.; Herberger, J.P. The World’s Worst Weeds-Distribution and Biology; The East-West Food Institute: Honolulu, HI, USA, 1977. [Google Scholar]
  31. Wilson, R.G. Dissemination of weed seeds by surface irrigation water in Western Nebraska. Weed Sci. 1980, 28, 87–92. [Google Scholar] [CrossRef]
  32. Frankton, C.; Mulligan, G.A. Weeds of Canada; Canada Department of Agriculture, Queen’s Printer: Ottawa, ON, Canada, 1970; p. 948. [Google Scholar]
  33. Perrino, E.V.; Calabrese, G. Endangered segetal species in southern Italy: Distribution, conservation status, trends, actions and ethnobotanical notes. Genet. Resour. Crop Evol. 2018, 65, 2107–2134. [Google Scholar] [CrossRef]
  34. Rominger, J.M. Taxonomy of Setaria (Graminaceae) in North America; University of Illinois Press: Urbana, IL, USA, 1962. [Google Scholar]
  35. Yatskievych, G. Steyermarks’s Flora of Missouri; Missouri Botanical Garden Press: St. Louis, MO, USA, 1999; Volume 1, p. 991. [Google Scholar]
  36. Blackshaw, R.E.; Stobbe, E.H.; Sturko, A.R.W. Effect of seeding dates and densities of green foxtail (Setaria viridis) on the growth and productivity of spring wheat (Triticum aestivum). Weed Sci. 1981, 29, 212–217. [Google Scholar] [CrossRef]
  37. Gates, F.C. Weeds in Kansas; Kansas State Printing Plant: Topeka, KS, USA, 1941; p. 360. [Google Scholar]
  38. Hunt, H.V.; Linden, M.V.; Liu, X.; Motuzaite-Matuzeviciute, G.; Colledge, S.; Jones, M.K. Millets across Eurasia: Chronology and context of early records of the genera Panicum and Setaria from archaeological sites in the Old World. Veg. Hist. Archaeobot. 2008, 17, 5–18. [Google Scholar] [CrossRef] [PubMed] [Green Version]
  39. Duke, J.A. Handbook of Edible Weeds; CRC Press: Boca Raton, FL, USA, 1992; p. 246. [Google Scholar]
  40. Wang, R.L.; Wendel, J.F.; Dekker, J.H. Weedy adaptation in Setaria spp. I. Isozyme analysis of genetic diversity and population genetic structure in Setaria viridis. Am. J. Bot. 1995, 82, 308–317. [Google Scholar] [CrossRef]
  41. Jia, G.; Shi, S.; Wang, C.; Niu, Z.; Chai, Y.; Zhi, H.; Diao, X. Molecular diversity and population structure of Chinese green foxtail [Setaria viridis (L.) Beauv.] revealed by microsatellite analysis. J. Exp. Bot. 2013, 64, 3645–3656. [Google Scholar] [CrossRef] [Green Version]
  42. Shi, Y.; Wang, T.; Li, Y.; Darmency, H. Impact of transgene inheritance on the mitigation of gene flow between crops and their wild relatives: The example of foxtail millet. Genetics 2008, 180, 969–975. [Google Scholar] [CrossRef] [Green Version]
  43. Pohl, R.W. The genus Setaria in Iowa. Iowa State. J. Sci. 1951, 25, 501–508. [Google Scholar]
  44. de Wet, J.M.J. The origin of weediness in plants. Proc. Okla. Acad. Sci. 1966, 1966, 14–17. [Google Scholar]
  45. Harlan, J.R. The possible role of weed races in the evolution of cultivated plants. Euphytica 1965, 14, 173–176. [Google Scholar] [CrossRef]
  46. Harlan, J.R.; de Wet, J.M.J.; Price, E.G. Comparative evolution of cereals. Evolution 1973, 27, 311–325. [Google Scholar] [CrossRef] [PubMed]
  47. Wang, T.Y.; Zhao, Z.H.; Yan, H.B.; Li, Y.; Zhu, X.H.; Shi, Y.S.; Song, Y.C.; Ma, Z.Y.; Darmency, H. Gene flow from cultivated herbicide-resistant foxtail millet to its wild relatives: A basis for risk assessment of the release of transgenic millet. Acta Agron. Sin. 2001, 27, 681–687. (in Chinese). [Google Scholar]
  48. Kuo, S.M.; Chen, Y.R.; Yin, S.Y.; Ba, Q.X.; Tsai, Y.C.; Kuo, W.H.J.; Lin, Y.R. Waxy allele diversification in foxtail millet (Setaria italica) landraces of Taiwan. PLoS ONE 2018, 13, e0210025. [Google Scholar] [CrossRef]
  49. Hirano, R.; Naito, K.; Fukunaga, K.; Watanabe, K.N.; Ohsawa, R.; Kawase, M. Genetic structure of landraces in foxtail millet (Setaria italica (L.) P. Beauv.) revealed with transposon display and interpretation to crop evolution of foxtail millet. Genome 2011, 54, 498–506. [Google Scholar] [CrossRef] [Green Version]
  50. Fukunaga, K.; Ichitani, K.; Kawase, M. Phylogenetic analysis of the rDNA intergenic spacer subrepeats and its implication for the domesticated history of foxtail millet, Setaria italica. Theor. Appl. Genet. 2006, 113, 261–269. [Google Scholar] [CrossRef]
  51. Hamrick, J.L.; Godt, M.J.W. Allozyme diversity in plant species. In Plant Population Genetics, Breeding and Genetic Resources; Brown, A.H.D., Clegg, M.T., Kahler, A.L., Weir, B.S., Eds.; Sinauer: Sunderland, MA, USA, 1990; pp. 43–63. [Google Scholar]
  52. Wang, R.L.; Wendel, J.F.; Dekker, J.H. Weedy adaptation in Setaria spp. II. Genetic diversity and population genetic structure in S. glauca, S. geniculata, and S. faberii (Poaceae). Am. J. Bot. 1995, 82, 1031–1039. [Google Scholar] [CrossRef]
  53. Huang, X.; Kurata, N.; Wei, X.; Wang, Z.X.; Wang, A.; Zhao, Q.; Zhao, Y.; Liu, K.; Lu, H.; Li, W.; et al. A map of rice genome variation reveals the origin of cultivated rice. Nature 2012, 490, 497–501. [Google Scholar] [CrossRef] [Green Version]
  54. Wright, S.I.; Bi, I.V.; Schröder, S.G.; Yamasaki, M.; Doebley, J.F.; McMullen, M.D.; Gaut, B.S. The effects of artificial selection on the maize genome. Science 2005, 308, 1310–1314. [Google Scholar] [CrossRef] [PubMed]
  55. Liu, Z.; Bai, G.; Zhang, D.; Znu, C.; Xia, X.; Cheng, Z.; Shi, Z. Genetic diversity and population structure of elite foxtail millet (Setaria italica (L.) P. Beauv.) germplasm in China. Crop Sci. 2011, 51, 1655–1663. [Google Scholar] [CrossRef]
  56. Wang, C.; Chen, J.; Zhi, H.; Yang, L.; Li, W.; Wang, Y.; Li, H.; Zhao, B.; Chen, M.; Diao, X. Population genetics of foxtail millet and its wild ancestor. BMC Genet. 2010, 11, 90. [Google Scholar] [CrossRef] [Green Version]
  57. Wang, C.; Jia, G.; Zhi, H.; Niu, Z.; Chai, Y.; Li, W.; Wang, Y.; Li, H.; Lu, P.; Zhao, B.; et al. Genetic diversity and population structure of Chinese foxtail millet [Setaria italica (L.) Beauv.] landraces. G3 (Bethesda) 2012, 2, 769–777. [Google Scholar] [CrossRef] [Green Version]
  58. Gupta, S.; Kumari, K.; Muthamilarasan, M.; Parida, S.K.; Prasad, M. Population structure and association mapping of yield contributing agronomic traits in foxtail millet. Plant Cell Rep. 2014, 33, 881–893. [Google Scholar] [CrossRef]
  59. Vetriventhan, M.; Upadhyaya, H.D.; Anandakumar, C.R.; Senthilvel, S.; Varshney, R.K.; Parzies, H.K. Population structure and linkage disequilibrium of ICRISAT foxtail millet (Setaria italica (L.) P. Beauv.) core collection. Euphytica 2014, 196, 423–435. [Google Scholar] [CrossRef]
  60. Fukunaga, K.; Wang, Z.; Kato, K.; Kawase, M. Geographical variation of nuclear genome RFLPs and genetic differentiation in foxtail millet, Setaria italica (L.) P. Beauv. Genet. Resour. Crop Evol. 2002, 49, 95–101. [Google Scholar] [CrossRef]
  61. Li, W.; Zhi, H.; Wang, Y.; Li, H.; Diao, X. Assessment of genetic relationship of foxtail millet with its wild ancestor and close relatives by ISSR markers. J. Integr. Agric. 2012, 11, 556–566. [Google Scholar] [CrossRef]
  62. Kim, S.; Plagnol, V.; Hu, T.T.; Toomajian, C.; Clark, R.M.; Ossowski, S.; Ecker, J.R.; Weigel, D.; Nordborg, M. Recombination and linkage disequilibrium in Arabidopsis thaliana. Nat. Genet. 2007, 39, 1151–1155. [Google Scholar] [CrossRef] [PubMed]
  63. Brachi, B.; Morris, G.P.; Borevitz, J.O. Genome-wide association studies in plants: The missing heritability is in the field. Genome Biol. 2011, 12, 232. [Google Scholar] [CrossRef] [Green Version]
  64. Honda, M. Monographia Poacearum Japonicarum, Bambusoideis Exclusis (Journal of the Faculty of Science: Section III, Botany); Imperial University of Tokyo: Tokyo, Japan, 1930; Volume 3, pp. 1–484. [Google Scholar]
  65. Tsang, C.H.; Li, K.T.; Hsu, T.F.; Tsai, Y.C.; Fang, P.H.; Hsing, Y.I.C. Broomcorn and foxtail millet were cultivated in Taiwan about 5000 years ago. Bot. Stud. 2017, 58, 3. [Google Scholar] [CrossRef] [PubMed] [Green Version]
  66. Thomson, D.; Dietzgen, R.G. Detection of DNA and RNA plant viruses by PCR and RT-PCR using a rapid virus release protocol without tissue homogenization. J. Virol. Methods 1995, 54, 85–95. [Google Scholar] [CrossRef]
  67. Zhang, S.; Tang, C.; Zhao, Q.; Li, J.; Yang, L.; Qie, L.; Fan, X.; Li, L.; Zhang, N.; Zhao, M.; et al. Development of highly polymorphic simple sequence repeat markers using genome-wide microsatellite variant analysis in Foxtail millet [Setaria italica (L.) P. Beauv.]. BMC Genom. 2014, 15, 78. [Google Scholar] [CrossRef] [Green Version]
  68. Hayden, M.J.; Nguyen, T.M.; Waterman, A.; Chalmers, K.J. Multiplex-Ready PCR: A new method for multiplexed SSR and SNP genotyping. BMC Genom. 2008, 9, 80. [Google Scholar] [CrossRef] [Green Version]
  69. Covarrubias-Pazaran, G.; Diaz-Garcia, L.; Schlautman, B.; Salazar, W.; Zalapa, J. Fragman: An R package for fragment analysis. BMC Genet. 2016, 17, 62. [Google Scholar] [CrossRef] [PubMed] [Green Version]
  70. R Core Team. R: A language and Environment for Statistical Computing; R Foundation for Statistical Computing: Vienna, Austria, 2019; Available online: https://www.R-project.org/ (accessed on 10 November 2019).
  71. Nei, M. Analysis of gene diversity in subdivided populations. Proc. Nat. Acad. Sci. USA 1973, 70, 3321–3323. [Google Scholar] [CrossRef] [Green Version]
  72. Adamack, A.T.; Gruber, B. Popgen Report: Simplifying basic population genetic analyses in R. Methods Ecol. Evol. 2014, 5, 384–387. [Google Scholar] [CrossRef]
  73. Clark, L.V.; Jasieniuk, M. POLYSAT: An R package for polyploid microsatellite analysis. Mol. Ecol. Resour. 2011, 11, 562–566. [Google Scholar] [CrossRef]
  74. Jombart, T. Adegenet: A R package for the multivariate analysis of genetic markers. Bioinformatics 2008, 24, 1403–1405. [Google Scholar] [CrossRef] [PubMed] [Green Version]
  75. Saitou, N.; Nei, M. The neighbor-joining method: A new method for reconstructing phylogenetic trees. Mol. Biol. Evol. 1987, 4, 406–425. [Google Scholar]
  76. Pritchard, J.K.; Stephens, M.; Donnelly, P. Inference of population structure using multilocus genotype data. Genetics 2000, 155, 945–959. [Google Scholar] [PubMed]
  77. Francis, R.M. pophelper: An R package and web app to analyze and visualize population structure. Mol. Ecol. Resour. 2017, 17, 27–32. [Google Scholar] [CrossRef] [Green Version]
  78. Evanno, G.; Regnaut, S.; Goudet, J. Detecting the number of clusters of individuals using the software Structure: A simulation study. Mol. Ecol. 2005, 14, 2611–2620. [Google Scholar] [CrossRef] [Green Version]
  79. Wickham, H. ggplot2: Elegant Graphics for Data Analysis; Springer Publishing Company: New York, NY, USA, 2009. [Google Scholar]
  80. Yu, G.; Smith, D.K.; Zhu, H.; Guan, Y.; Lam, T.T.Y. ggtree: An R package for visualization and annotation of phylogenetic trees with their covariates and other associated data. Methods Ecol. Evol. 2017, 8, 28–36. [Google Scholar] [CrossRef]
  81. Wright, S. The genetical structure of populations. Ann. Eugen. 1951, 15, 323–354. [Google Scholar] [CrossRef] [PubMed]
  82. Weir, B.S.; Cockerham, C.C. Estimating F-statistics for the analysis of population structure. Evolution 1984, 38, 1358–1370. [Google Scholar]
  83. Wright, S. Isolation by distance. Genetics 1943, 28, 114–138. [Google Scholar]
  84. Matsuoka, Y.; Mitchell, S.E.; Kresovich, S.; Goodman, M.; Doebley, J. Microsatellites in Zea-variability, patterns of mutations, and use for evolutionary studies. Theor. Appl. Genet. 2002, 104, 436–450. [Google Scholar] [CrossRef]
  85. Tautz, D.; Renz, M. Simple sequences are ubiquitous components of eukaryotic genomes. Nucleic Acids Res. 1984, 12, 4127–4138. [Google Scholar] [CrossRef] [Green Version]
  86. Kumar, P.; Gupta, V.K.; Misra, A.K.; Modi, D.R.; Pandey, B.K. Potential of molecular markers in plant biotechnology. Plant OMIC 2009, 2, 141–162. [Google Scholar]
  87. Zhao, Y.; Basak, S.; Fleener, C.E.; Egnin, M.; Sacks, E.J.; Prakash, C.S.; He, G. Genetic diversity of Miscanthus sinensis in US naturalized populations. GCB Bioenergy 2017, 9, 965–972. [Google Scholar] [CrossRef]
  88. Ecker, G.; Zalapa, J.; Auer, C. Switchgrass (Panicum virgatum L.) genotypes differ between coastal sites and inland road corridors in the Northeastern US. PLoS ONE 2015, 10, e0130414. [Google Scholar] [CrossRef] [PubMed] [Green Version]
  89. Schröder, S.; Bahri, B.A.; Eudy, D.M.; Layton, D.J.; Kellogg, E.A.; Devos, K.M. Genetic diversity and origin of North American green foxtail [Setaria viridis (L.) Beauv.] accessions. Genet. Resour. Crop Evol. 2017, 64, 367–378. [Google Scholar] [CrossRef] [Green Version]
  90. Fang, X.; Dong, K.; Wang, X.; Liu, T.; He, J.; Ren, R.; Zhang, L.; Liu, R.; Liu, X.; Li, M.; et al. A high density genetic map and QTL for agronomic and yield traits in Foxtail millet [Setaria italica (L.) P. Beauv.]. BMC Genom. 2016, 17, 336. [Google Scholar] [CrossRef] [Green Version]
  91. Gupta, S.; Kumari, K.; Sahu, P.P.; Vidapu, S.; Prasad, M. Sequence-based novel genomic microsatellite markers for robust genotyping purposes in foxtail millet [Setaria italica (L.) P. Beauv]. Plant Cell Rep. 2012, 31, 323–337. [Google Scholar] [CrossRef]
  92. Nei, M. Estimation of average heterozygosity and genetic distance from a small number of individuals. Genetics 1978, 89, 583–590. [Google Scholar]
  93. Muraya, M.M.; de Villiers, S.; Parzies, H.K.; Mutegi, E.; Sagnard, F.; Kanyenji, B.M.; Kiambi, D.; Geiger, H.H. Genetic structure and diversity of wild sorghum populations (Sorghum spp.) from different eco-geographical regions of Kenya. Theor. Appl. Genet. 2011, 123, 571–583. [Google Scholar] [CrossRef]
  94. Hsieh, C.F.; Shen, C.F. Introduction to the flora of Taiwan, 1: Geography, geology, climate, and soils. In Flora of Taiwan, 2nd ed.; Department of Botany, National Taiwan University: Taipei, Taiwan, 1994; Volume 1, pp. 1–3. [Google Scholar]
  95. Jusuf, M.; Pernes, J. Genetic variability of foxtail millet (Setaria italica P. Beauv.). Theor. Appl. Genet. 1985, 71, 385–391. [Google Scholar] [CrossRef]
  96. Slatkin, M.; Barton, N.M. A comparison of three indirect methods for estimating average levels of gene flow. Evolution 1989, 43, 1349–1368. [Google Scholar] [CrossRef]
  97. Nei, M. Molecular Evolutionary Genetics; Columbia University Press: New York, NY, USA, 1987. [Google Scholar]
  98. Upadhyaya, H.D.; Dwivedi, S.L.; Baum, M.; Varshney, R.K.; Udupa, S.M.; Gowda, C.L.L. Genetic structure, diversity, and allelic richness in composite collection and reference set in chickpea (Cicer arietinum L.). BMC Plant Biol. 2008, 8, 106. [Google Scholar] [CrossRef] [PubMed] [Green Version]
  99. Nguyen, V.E.; Pernès, J. Genetic diversity of foxtail millet (S. italica). In Genetic Differenciation and Dispersal in Plants; Jacquard, P., Ed.; NATO ASI series; Springer: Berlin/Heidelberg, Germany, 1985; Volume G5, pp. 113–128. [Google Scholar]
  100. Ohadi, S.; Littlejohn, M.; Mesgaran, M.; Rooney, W.; Bagavathiannan, M. Surveying the spatial distribution of feral sorghum (Sorghum bicolor L.) and its sympatry with johnsongrass (S. halepense) in South Texas. PLoS ONE 2018, 13, e0195511. [Google Scholar]
  101. Sezen, U.U.; Barney, J.N.; Atwater, D.Z.; Pederson, G.A.; Pederson, J.F.J.; Chandler, M.; Cox, T.S.; Cox, S.; Dotray, P.; Kopec, D.; et al. Multi-Phase US Spread and Habitat Switching of a Post-Columbian Invasive, Sorghum halepense. PLoS ONE 2016, 11. [Google Scholar] [CrossRef] [Green Version]
  102. Kono, Y.; Chung, K.F.; Chen, C.H.; Hoshi, Y.; Setoguchi, H.; Chou, C.H.; Oginuma, K.; Peng, C.I. Intraspecific karyotypic polymorphism is highly concordant with allozyme variation in Lysimachia mauritiana (Primulaceae: Myrsinoideae) in Taiwan: Implications for the colonization history and dispersal patterns of coastal plants. Ann. Bot. 2012, 110, 1119–1135. [Google Scholar] [CrossRef] [PubMed] [Green Version]
  103. Le Thierry d’Ennequin, M.; Panaud, O.; Toupance, B.; Sarr, A. Assessment of genetic relationships between Setaria italica and its wild relative S. viridis using AFLP markers. Theor. Appl. Genet. 2000, 100, 1061–1066. [Google Scholar] [CrossRef]
  104. Barrett, S.C.H.; Shore, J.S. Isozyme variation in colonizing plants. In Isozymes in Plant Biology; Soltis, D.E., Soltis, P.S., Eds.; Dioscorides: Portland, OR, USA, 1989; pp. 106–126. [Google Scholar]
  105. Barrett, S.C.H. Genetics and evolution of agricultural weeds. In Weed Management in Agro-Ecosystems: Ecological Approach; Altieri, M., Liebman, M., Eds.; CRC Press: Boca Raton, FL, USA, 1988; pp. 58–75. [Google Scholar]
  106. Rice, K.; Jain, S.K. Plant population genetics and evolution in disturbed environments. In The Ecology of Natural Disturbance and Patch Dynamics; Pickett, S.T.A., White, P.A., Eds.; Academic Press: New York, NY, USA, 1985; pp. 287–303. [Google Scholar]
  107. Hartl, D.L.; Clark, A.G. Principles of Population Genetics; Sinauer Associates: Sunderland, MA, USA, 2007. [Google Scholar]
  108. Perrino, E.V.; Wagensommer, R.P. Crop Wild Relatives (CWR) Priority in Italy: Distribution, Ecology, In Situ and Ex Situ Conservation and Expected Actions. Sustainability 2021, 13, 1682. [Google Scholar] [CrossRef]
  109. Castañeda-Álvarez, N.; Khoury, C.; Achicanoy, H.; Bernau, V.; Dempewolf, H.; Eastwood, R.J.; Guarino, L.; Harker, R.H.; Jarvis, A.; Maxted, N.; et al. Global conservation priorities for crop wild relatives. Nat. Plants 2016, 2, 16022. [Google Scholar] [CrossRef]
  110. Jarvis, D.I.; Brown, A.H.; Cuong, P.H.; Collado-Panduro, L.; Latournerie-Moreno, L.; Gyawali, S.; Tanto, T.; Sawadogo, M.; Mar, I.; Sadiki, M.; et al. A global perspective of the richness and evenness of traditional crop-variety diversity maintained by farming communities. Proc. Natl. Acad. Sci. USA 2008, 105, 5326–5331. [Google Scholar] [CrossRef] [Green Version]
Figure 1. Principal coordinate analysis of the 141 Setaria viridis individuals in Taiwan. The first and the second coordinates explained 23.00 % and 14.90 % of variability, respectively. The 10 collecting sites are marked by different colors.
Diversity 13 00159 g001
Figure 2. Neighbor-joining tree of the 141 Setaria viridis accessions in Taiwan. The color of each clade represents each individual collected from its own collecting site. The vertical line with different colors of every clade number corresponds to subpopulations that were inferred by the STRUCTURE analysis.
Diversity 13 00159 g002
Figure 3. (a) STRUCTURE barplot of the 141 Setaria viridis individuals with K value = 10 inferred by the Evanno method. The order of results from STRUCTURE is sorted by 10 collection sites from #01 to #10. An individual is considered as the admixture when the genetic background is lower than 80% of its own percentage. (b) Geographic distribution of the 10 collection sites in Taiwan. The pie chart at each site represents the genetic proportion inferred by STRUCTURE when K = 10.
Diversity 13 00159 g003aDiversity 13 00159 g003b
Table 1. Information, including code, site, latitude, longitude and sample size of 10 collection sites in different parts of Taiwan.
CodeSite (Township/County)LatitudeLongitudeSample Size
#01Tongluo, Miaoli24°29′48.00″ N120°47′17.00″ E16
#02Haiduan, Taitung23°4′9.00″ N121°9′33.00″ E8
#03Taitung, Taitung22°43′36.00″ N121°5′48.00″ E16
#04Ludao, Taitung22°40′25.00″ N121°28′17.00″ E9
#05Liujiao, Chiayi23°30′56.00″ N120°17′56.00″ E10
#06Qimei, Penghu23°12′18.00″ N119°25′37.00″ E15
#07Huxi, Penghu23°35′40.00″ N119°36′47.00″ E11
#08Jinning, Kinmen24°27′20.00″ N118°19′8.00″ E16
#09Jinsha, Kinmen24°29′36.00″ N118°24′44.00″ E24
#10Nangan, Lienchiang26°8′45.00″ N119°54′47.00″ E16
Total 141
Table 2. Genetic diversity parameters of 13 SSR markers used to assess 141 Setaria viridis individuals.
MarkersNaNeHoHePIC
SICAAS1015149.180.0000.890.88
SICAAS1065167.790.0150.870.86
SICAAS208485.160.0000.810.78
SICAAS3090106.060.0220.830.81
SICAAS500521.260.0000.210.18
SICAAS508142.190.0000.540.48
SICAAS605221.370.0000.270.30
SICAAS700274.350.0170.770.73
SICAAS700841.980.0000.490.44
SICAAS709021.410.0000.290.27
SICAAS802542.120.0160.530.41
SICAAS912121.410.0000.290.26
SICAAS913041.980.0000.500.45
Average6.13.5580.00540.5610.527
Na: observed allele number; Ne: effective allele number; Ho: observed heterozygosity; He: expected heterozygosity; PIC: polymorphic information content.
Table 3. Genetic diversity index of Setaria viridis individuals in each collecting site.
Collecting SiteSSNaNeHoHeFISFSTFITNm
#01161313.000.000.000.98960.48950.99470.26
#0281313.000.000.000.99010.49950.99500.25
#03161914.250.010.120.98410.39540.99040.38
#0491413.600.000.030.99040.47830.99500.27
#05102218.630.000.160.99210.35400.99490.46
#06152214.940.000.110.99050.44760.99480.31
#07112015.570.000.120.99150.39840.99490.38
#08162921.820.020.270.97230.25250.97930.74
#09241815.040.000.070.99010.42770.99430.33
#10161916.340.020.140.96530.39430.97900.38
Average 18.915.6190.0050.102
SS: sample size; Na: observed allele number; Ne: effective allele number; Ho: observed heterozygosity; He: expected heterozygosity; FIS: inbreeding coefficient of an individual relative to the subpopulation; FST: the degree of genetic differentiation between populations; FIT": inbreeding coefficient of an individual relative to the total population; Nm: number of immigrants, the extent of gene flow.
Table 4. Pairwise FST value between subpopulations from the 10 collecting sites.
#01#02#03#04#05#06#07#08#09
#020.47
#030.540.22
#040.550.280.17
#050.360.470.460.51
#060.570.520.560.520.50
#070.580.590.580.620.500.50
#080.410.380.420.440.320.490.40
#090.520.490.550.550.420.590.500.14
#100.510.520.550.580.460.590.540.320.45
Publisher’s Note: MDPI stays neutral with regard to jurisdictional claims in published maps and institutional affiliations.

