Article

Variation in Assemblages of Freshwater Mussels Downstream of Dams and Dam Removals in the Lake Michigan Basin, Michigan, USA

by
Shaughn E. Barnett
and
Daelyn A. Woolnough
*
Department of Biology, Institute for Great Lakes Research, Central Michigan University, Mount Pleasant, MI 48859, USA
*
Author to whom correspondence should be addressed.
Diversity 2021, 13(3), 119; https://doi.org/10.3390/d13030119
Submission received: 7 February 2021 / Revised: 3 March 2021 / Accepted: 10 March 2021 / Published: 12 March 2021
(This article belongs to the Special Issue Freshwater Mollusk Conservation)

Abstract

:
Impacts of barriers, including dam removals, on aquatic diversity are poorly understood. We assessed freshwater mussel assemblages and microhabitat downstream of uncontrolled and controlled low-head dams and low-head dam removals in Michigan, USA. The objectives of this study were to quantify whether downstream mussel assemblages and microhabitat parameters differ by anthropogenic barrier and along a downstream gradient, and to determine parameters that were predictors of mussel diversity and density. Sampling consisted of standardized timed-searches and quadrat excavations. Results suggest that areas downstream of dams had higher mussel diversity than dam removals, and mussel assemblages differed along a downstream gradient for uncontrolled and controlled dams. Indicator Species Analyses determined mussel species representative of downstream river reaches from uncontrolled low-head dams and removals. Predictor variables for mussel assemblages included substrate classes and total suspended solids. Controlled dams contained the least fine substrates (%) and highest coarse substrates (%) in downstream reaches. This study suggests that rivers with uncontrolled low-head dams and removals provide downstream habitat that support viable mussel assemblages. Results from this study also suggest that evidence of mussel assemblage recovery following dam removal may take many years. Quantification of barrier-related impacts, as shown in this study, are imperative to guide conservation of aquatic fauna.

1. Introduction

Dams have impacted aquatic ecosystems; globally there are ~45,000 large dams (>15 m) and ~800,000 small dams (<15 m) [1,2,3,4,5,6]. In the United States alone, dams have fragmented 5.2 million km of river, with the Great Lakes region containing >2000 dams that are within the lowest quartile of dam-impacted discharge in the United States [2,4]. Historically, dams have served many purposes including grain milling, hydroelectric power, water supply, and navigation [7,8]; however, some dams have become obsolete, while others continue to decrease ecosystem function [3,9].
Dam parameters such as size, operation, and age have influenced riverine abiotic and biotic components [10]. Large hydroelectric storage dams continue to be the most detrimental to riverine ecosystems and have received the most attention with impacts to discharge, sediment transport, temperature, and organismal dispersal [11,12,13,14]. Dam studies have focused on upstream effects shifting impoundment conditions from lotic to lentic environments [15]. Additionally, discharge from hydroelectric dams has caused downstream sediment scour, decreased water temperature, and confounded organismal life histories (e.g., fish spawning, egg hatching, glochidial encystment, and aquatic insect metamorphosis) that are dependent on natural flow regimes [16].
Low-head dams have received much less attention than hydroelectric storage dams [10,12,13,15,17,18] but refer to structures whose height (<15 m) are within the upstream channel banks and include a crest spanning the entire channel width that allows discharge to flow over the top (i.e., top-release) [5,15,19,20]. At low-head dams, water is impeded behind the crest during periods below base flow and low-head dams can become nearly or completely submerged during high water events [20]. Uncontrolled low-head dams typically allow for more natural flow regimes than storage dams (i.e., controlled dams) by not regulating the volume of water to downstream reaches therefore, they are regarded as less detrimental to aquatic fauna) [10]. During periods at or above base flow, hydrologic conditions of low-head dams may facilitate shortened retention times and sufficient downstream sediment transport which supports a diverse mix of substrate classes [20]. These hydrologic conditions may facilitate increased species richness of aquatic flora and fauna as downstream sediment classes are often intermediate in size when compared to controlled operations (i.e., coarse-grained) and dam removals (i.e., fine-grained). Intermediate levels of disturbance can increase species richness when early and/or late successional species are unable to dominate the assemblage (i.e., intermediate disturbance hypothesis [21]). Additionally, upstream low-head impoundments may increase primary productivity, particulate organic matter (POM), and downstream water temperatures that may facilitate increased growth and survival of filter-feeding macroinvertebrates [12,13,15,22,23].
Low-head dams have also been the target of dam removals across the United States, focusing on dams <5 m that serve no current purpose [10,24]. However, less than 5% of dam removals have been studied post-removal with conflicting results on whether dam removals improve ecosystem conditions [19,25,26,27]. Studies have shown stream gradients reverting to pre-impoundment conditions post-removal; however, the dislodgement of upstream sediments, nutrients, and pollutants can cause irreparable harm to downstream organisms when neglected prior to removal [28,29,30,31,32]. Dam removals can be ecologically successful when removal impacts are fully considered [33,34,35,36]. Dam removal impacts on biota vary, but are likely related to an organism’s dispersal ability, fecundity, and growth rate [15]. Therefore, restoration success(es) may be dependent on the study organism chosen to be quantified post-restoration.
One group of organisms, dependent on favorable lotic conditions, are freshwater mussels (family: Unionidae). Freshwater mussels serve integral roles in aquatic systems by filtering organic matter from the water column, which then is deposited within feces, allowing for growth of other benthic organisms (e.g., insects and algae) [37,38,39,40]. Freshwater mussels also improve sediment stability through burrowing behavior and their shells act as important habitat for aquatic insects [41,42]. However, freshwater mussels are one of the most imperiled faunal groups in North America with ~72% of the nearly 300 species of conservation concern (i.e., special concern, threatened, or endangered) [43,44]. The State of Michigan has 43 species of freshwater mussels, with 28 of these species listed as species of conservation concern [45,46,47]. The threats that have imperiled mussels include habitat destruction, fragmentation, channel modification, and introduction of non-endemic mollusks [43,48,49,50].
Impacts from low-head dams and low-head dam removals on mussel populations have resulted in conflicted findings with studies often limited to a small number of sites. Studies have found increased mussel diversity and density downstream of low-head dams in the Midwest and southern United States [12,18,51,52] and a study upstream of low-head dams in Illinois showed that free-flowing sites had higher species richness and CPUE when compared to impounded areas [53]. Low-head dam removals have found minimal impacts on downstream mussel assemblages in North Carolina [35,36], while an unregulated dam removal in Wisconsin led to decreased mussel densities three years post-dam removal [54].
It was the goal of this study to quantify mussel assemblages downstream of anthropogenic barriers and recognize potential impacts following dam removals. In this study, microhabitat parameters and freshwater mussel assemblages were quantified among three anthropogenic barriers (i.e., uncontrolled low-head dams, controlled low-head dams, and low-head dam removals) in the Lake Michigan drainage basin, Michigan, USA. The following questions were addressed: (1) Do downstream mussel assemblages and microhabitat parameters differ by anthropogenic barrier? (2) Do mussel assemblages and microhabitat parameters differ along a downstream gradient from anthropogenic barriers? and (3) Which microhabitat parameters are important predictors of mussel assemblages? We know of no other studies prior to this study that has quantified mussel assemblages and microhabitat parameters downstream of uncontrolled low-head, controlled low-head, and low-head dam removals. This study also adds to the limited literature of mussel assemblage structure downstream of anthropogenic barriers in the previously glaciated Laurentian Great Lakes region of North America and is integral in understanding species survival in interrupted river reaches.

2. Materials and Methods
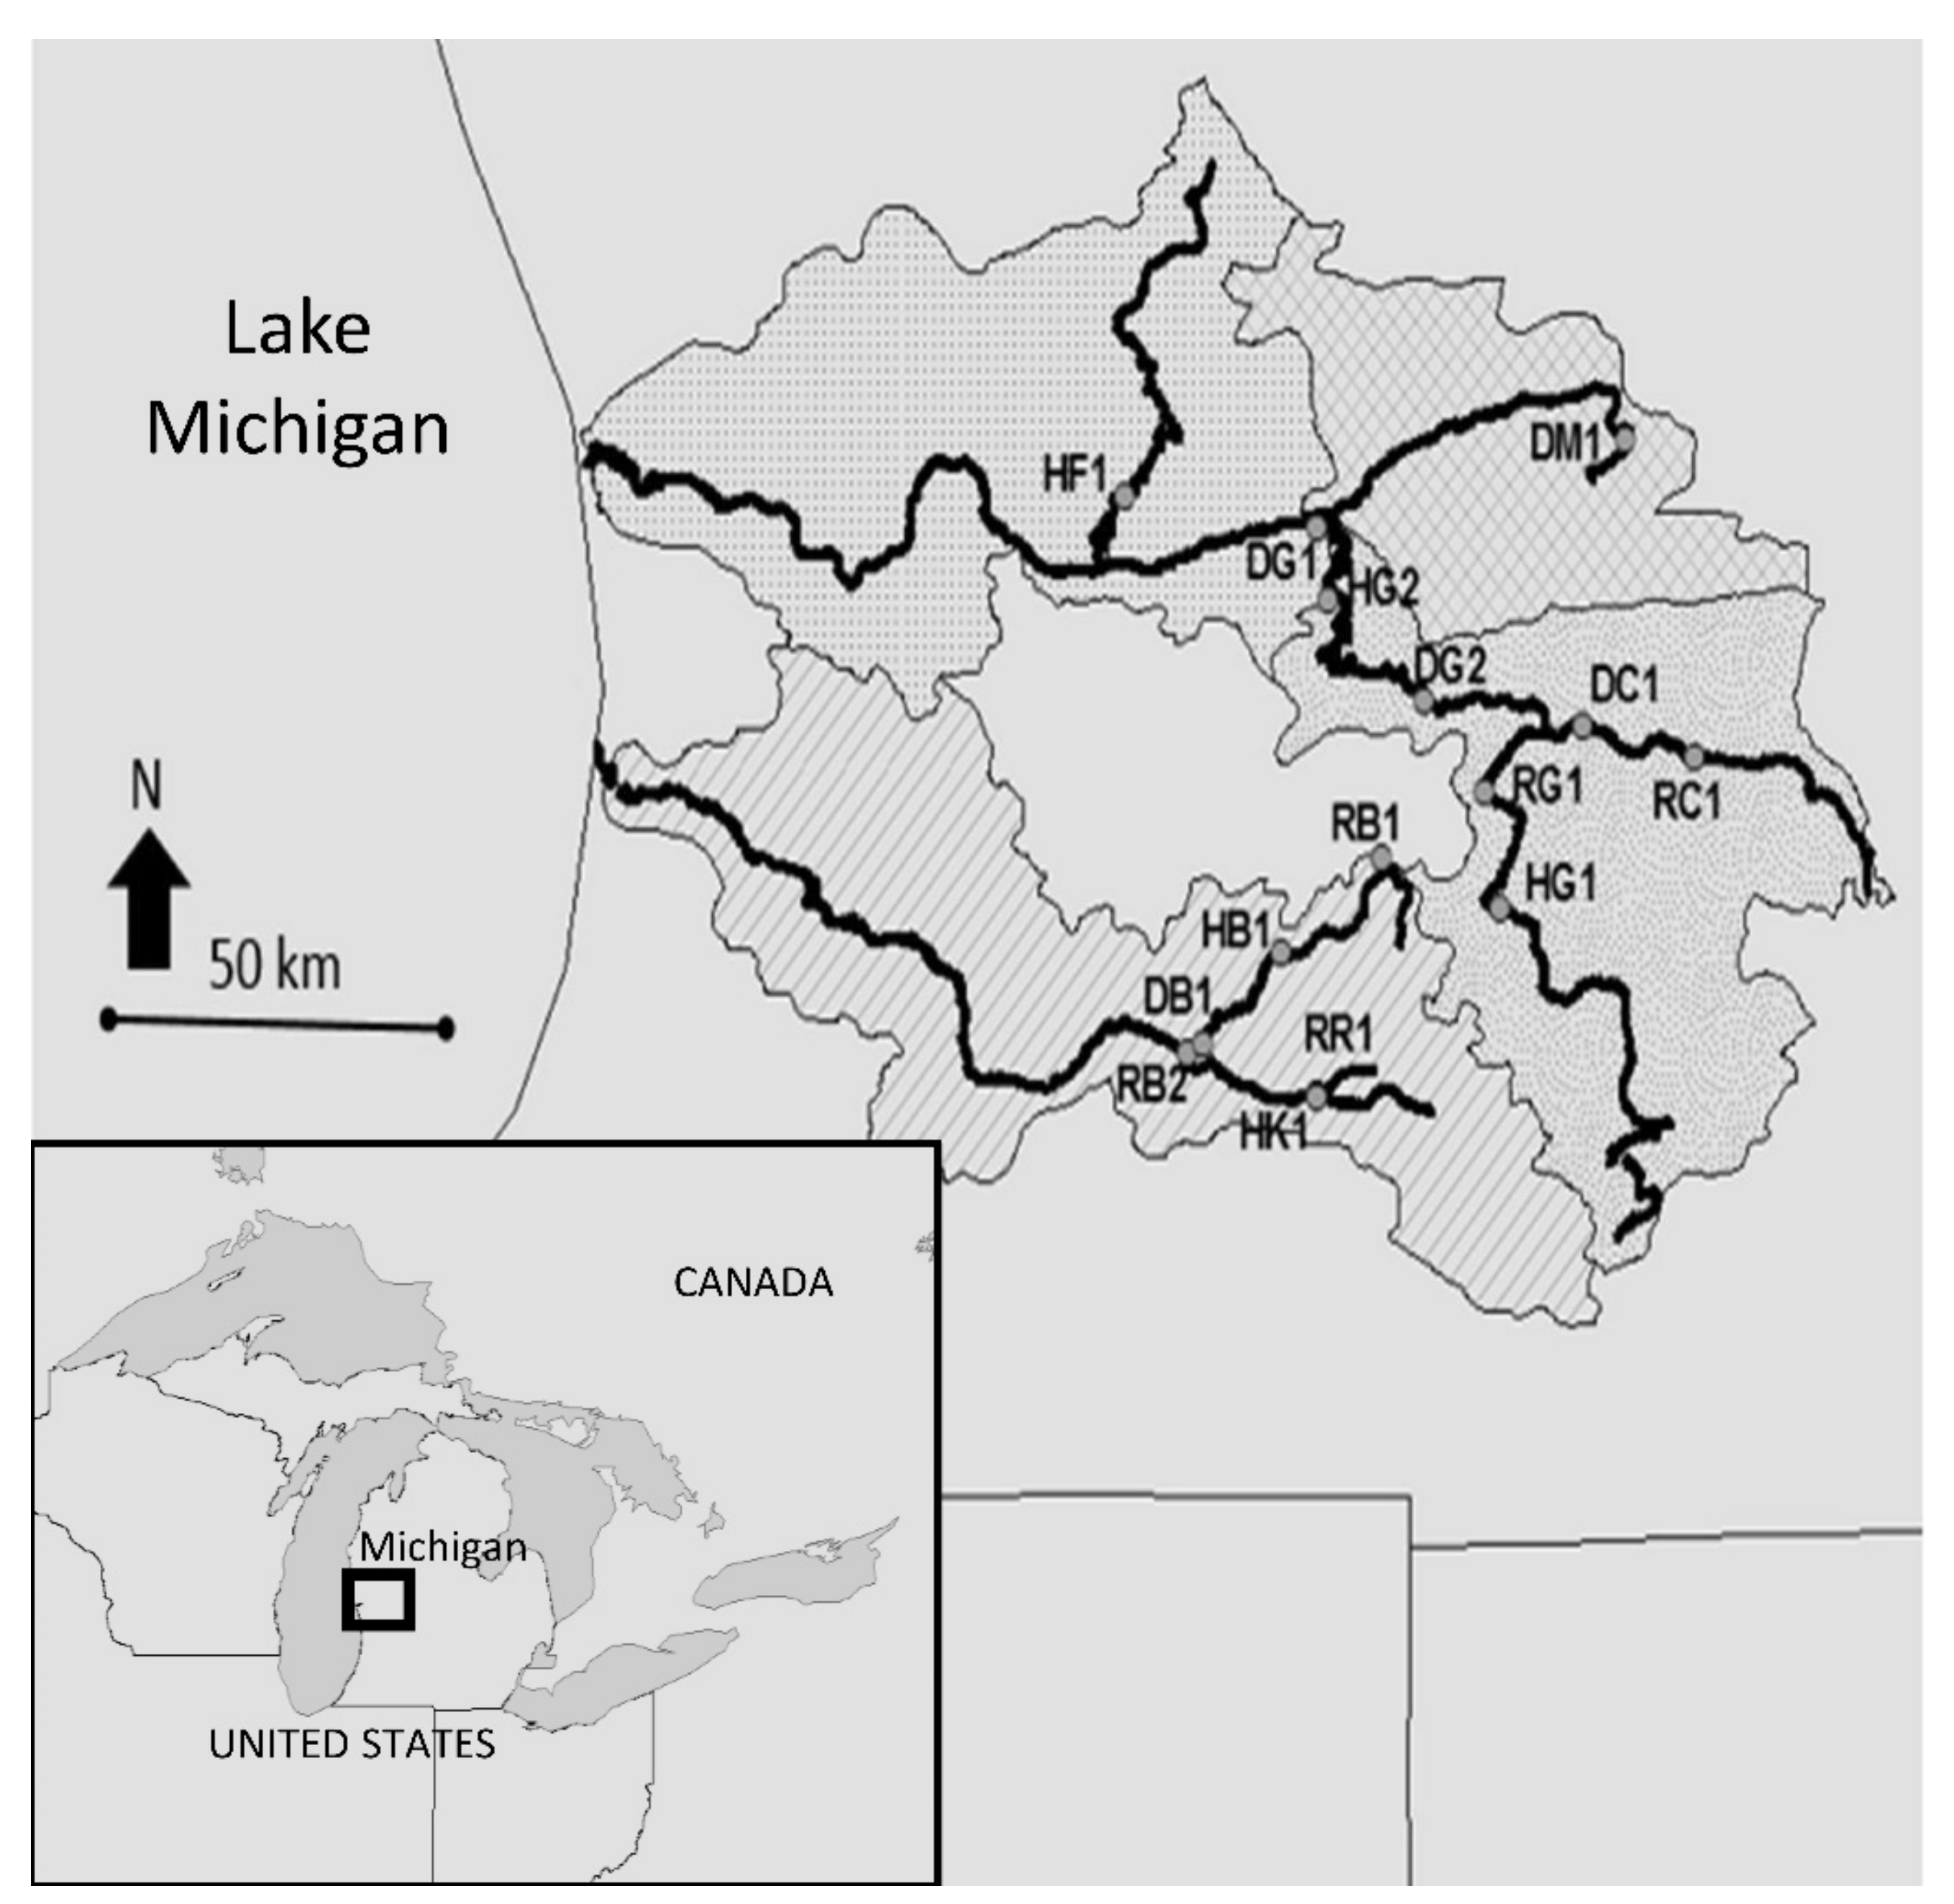
2.1. Study Sites

This study was conducted at 15 sites in the Lake Michigan drainage basin, Michigan, during the summer and fall of 2014 and 2015 (Figure 1, Table S1). It was decided a priori that, due to variation in biodiversity outside of the larger Lake Michigan watershed as well as limited site numbers that could be logistically considered, we would limit sites to within the Lake Michigan drainage. Sites were selected based on similar characteristics, including dam size, historic dam use, and length of time since dam removal (Table S1). Low-head dams (uncontrolled and controlled) were selected from the National Inventory of Dams and through correspondence with the Michigan Department of Natural Resources (MDNR) and Department of Environmental Quality (MDEQ). There are varying definitions of dam types; however, for this study uncontrolled dams consisted of low-head dams that facilitate a more natural flow regime over the structure and controlled dams contained hydroelectric dams with the ability to regulate water (Table S1). Once selected, it was determined that one uncontrolled dam (i.e., DG1, Table 1) was directly downstream of a wastewater treatment plant. All controlled dams are currently licensed through the Federal Energy Regulatory Commission (FERC) as run-of-the-river operations. Low-head dam removals, the third category of barriers, were selected from dam removal summaries in the state of Michigan [55,56] (Table S1). Relocation of mussels could influence mussel distributions; however, no freshwater mussel relocations had occurred at any of the sites in this study. Hereafter, all reference to dams, both uncontrolled, controlled, and dam removals will be referred to as barriers, unless otherwise specified. We recognize that many dam removals are not considered to function as barriers; however, barrier-effectiveness is often quantified in potential fish passage post-removal with limited invertebrate data. Five barriers of each category (uncontrolled low-head, controlled low-head, and low-head dam removals) were sampled for a total of 15 locations (Figure 1, Table S1).

2.2. Mussel Sampling

The sampling protocol used a standardized river area to account for variable river length and width among study reaches. Each site was semi-quantitatively and quantitatively sampled once using cross-sectional transects (n = 5 per site) spaced ~7500 m2 apart (Figure 2). The sampling reaches were chosen to encompass and extend downstream of areas that were obviously influenced by the barriers (e.g., scour, bank erosion, sediment deposition). Semi-quantitative tactile timed-searches were performed between transects (n = 4 per site; 1-person hour for every 2500 m2; Figure 2) to quantify rare mussel species that are below quadrat detection limits [57]. Transects began 50 m downstream of barriers due to safety concerns and sampling logistics immediately downstream of barriers (Figure 2). Quantitative sampling consisted of 10 quadrats (0.50 m × 0.50 m) randomly distributed along each transect (n = 50 quadrats per site) (Figure 2). Quadrats were excavated to a depth of ~15 cm and live mussels were identified to species [47], enumerated, measured, and returned with the anterior end down into the substrate. We also noted whether mussels were state or federally listed was documented [44,45]. Digital images were also collected as vouchers. The sampling effort was sufficient to detect mussel densities of 0.08 mussels m−2 (i.e., 1 mussel from fifty 0.50 m × 0.50 m quadrats reach−1) [58].

2.3. Microhabitat Parameters

Prior to quadrat excavation, microhabitat parameters were quantified at a quadrat and site scale. At a quadrat scale, variables included water depth (cm) measured with a meter stick, mean and benthic current velocity (m s−1) using a Marsh-McBirney flow meter (Frederick, Maryland), and substrate size (mm). Substrate particles were categorized according to Wolman’s (1954) pebble count [59]. A modified Wolman’s pebble count was used [59], where five particles were selected; one directly from the middle and one from each quadrat corner (n = five per quadrat). At a site scale, pH, conductivity (μS cm−1), and turbidity (NTU) were measured using YSI water quality sondes (models 6600 and 600R; Yellow Springs, Ohio); these measures were performed prior to quadrat excavation in the middle of transect 1 (i.e., the most upstream transect closest to the barrier). HOBO temperature loggers (model UA-001-64, Bourne, Massachusetts; n = 1 site−1) measured water temperature (°C) every two hours at sites sampled during July and August. Duplicate water samples were collected and total suspended solids (TSS), organic suspended solids (OSS), and inorganic suspended solids (ISS) were measured using Standard Methods 2540 D-E [60]. Water samples were collected from all sites 30–31 July 2015.

2.4. Data Analyses: Comparison of Mussel Assemblages Downstream of Three Anthropogenic Barrier Types

Statistical analyses were performed at a timed-search scale as the majority of mussels (i.e., 88%) and species collected during the study were found within semi-quantitative timed-searches. Using timed-search data provided the best statistical inference based on the study design. Mussel abundance was calculated as catch-per-unit-effort (CPUE; # mussels person-hour−1) and mussel diversity was calculated using species richness and Shannon’s diversity index (H’) [61]. Shannon’s diversity accounts for species’ distribution and abundance and weighs each species according to their frequency [62]. H’ were linearly transformed (EXP) to assess the magnitude of change for each index among anthropogenic barriers [62]. The number of years since the dams were removed and sampled varied; therefore, a regression analysis was performed with species richness to see if there was a relationship.
To determine whether mussel species were indicative of particular anthropogenic barriers, an Indicator Species Analysis (ISA) was performed [63] using abundance data. The species matrix was grouped by anthropogenic barrier to determine an indicator value for each mussel species based on within-group species abundance and occurrence [64]. The significance of each indicator value was then tested using a randomized permutation procedure (n = 9999), which generates the reference distribution from the data [63].
A Non-Metric Multidimensional Scaling (NMDS) ordination was performed [65] using mussel abundance data, followed by a MRPP to determine whether mussel assemblages group by anthropogenic barrier. NMDS ordination was chosen because it is the most robust ordination technique in community ecology [66]. NMDS is an ordination technique that plots similar objects close together and dissimilar objects further apart in ordination space [65]. A Bray-Curtis distance measure, in the NMDS ordination and MRPP, was used because it is often regarded as the best rank-order relation technique when using count data [67].
Kruskal–Wallis tests [68] were performed to compare mussel diversity and abundance among anthropogenic barriers because biotic data did not meet parametric test assumptions, even following transformations. If significance was found among reaches, a Dunn’s multiple comparison test [69] was used to identify pairwise differences [70]. The statistical power [71] of subsequent tests was also calculated from within- group variance, between-group variance, number of groups (n = 3), and mean number of observations (n = 15).
R software (Version 3.0.2) was used for all statistical procedures, except Multi-Response Permutation Procedure (MRPP), which were performed in PC-ORD version 6.0.

2.5. Data Analyses: Variation of Mussel Assemblages Along a Downstream Gradient from Anthropogenic Barriers

Kruskal–Wallis tests [68] were performed at a quadrat scale, due to non-parametric data, to evaluate mussel diversity and density along a downstream gradient (i.e., five transects equal distance apart) for each anthropogenic barrier. Based on the study design and statistical power of sampling efforts, quantitative quadrat data provided the best inference of data collected [71]. Quadrats (n = ~50 at each barrier; Figure 2; Table 1) were treated as replicates along each transect (n = 5 transects) for anthropogenic barriers (n = 3 types of barriers). If significance was found among transects, a Dunn’s multiple comparison test [69] was used to identify pairwise differences [70]. The statistical power [71] of subsequent tests was calculated the same as statistical power for mussel density and diversity by anthropogenic barrier.

2.6. Data Analyses: Microhabitat Parameters

Generalized Linear Mixed-effects Models (GLMM) [72] were performed, at a quadrat scale to determine which microhabitat variables were the best predictors of species richness, density, and mussel presence. Sites scale microhabitat variables (i.e., water temperature (°C), pH, conductivity (μS cm−1), turbidity (NTU), and suspended solids were applied to quadrat scale biotic data as these variables were not expected to spatially vary among quadrats within individual sites. Mixed-effects models were used to reduce spatial autocorrelation that was present among quadrats along the same transect. A random intercept structure was applied at a transect scale because spatial autocorrelation was highest at this scale, allowing the model’s intercept to change for each transect [73]. GLMM also used a Poisson distribution for all response variables other than mussel presence, in which a binomial distribution was selected. Variance inflation factors (VIF) [74] were used to address multicollinearity among variables. Predictor variables were removed from models when VIF > 10 [75,76].
Model selection was determined using Akaike Information Criterion (AIC) [72], where AIC selects competing models based on maximum log-likelihood estimates and the number of model parameters [77]. Models with a ∆AIC ≤ 2 have substantial support and minimize information lost, allowing meaningful interpretation of candidate models [78]. The model weight (wm) was used to approximate the probability of the best model given the a priori model set [77]. The relative importance of predictor variables (wv) was determined by summing the model weights that include each variable in models with a ∆AIC ≤ 2 [78]. Relative importance of predictor variables is equivalent to the probability of being included in the ‘real’ (e.g., true biological explanation) best model [79].

3. Results

3.1. Comparison of Mussel Assemblages Downstream of Three Anthropogenic Barrier Types

A total of 20 species of native freshwater mussels (3685 individuals) of all life-history strategies (i.e., opportunistic, periodic, and equilibrium; [14]) were collected and identified during quadrat and timed-search surveys (Table 1). Due to safety concerns, including high water and discharge, some quadrats and timed-searches were not completed (Table 1). Site-scale mussel abundance ranged from 0 to 1171 individuals ( x ¯ = 245.67 ± 88.49) and CPUE ranged from 0.25 to 74.33 person-hour−1 ( x ¯ = 22.56 ± 6.22). Site-scale species richness ranged from 0 to 15 species site−1 ( x ¯ = 7.07 ± 1.19) and Shannon’s diversity (EXP (H’)) ranged from 1 to 8.94 species site−1 ( x ¯ = 3.66 ± 0.62). Five sites contained ≥0 species (Table 1) and eight federally or state listed species were collected from all sites (i.e., uncontrolled dams (n = 7), controlled dams (n = 3), and dam removals (n = 2); Table 1). Eurynia dilatata was the most dominant species at all three anthropogenic barriers (i.e., 20%, 30%, and 70% at uncontrolled, controlled, and removals, respectively; Table 1).
Indicator Species Analyses found three species associated with uncontrolled dams (i.e., Amblema plicata (p = 0.0015); Epioblasma triquetra (p = 0.010); Cyclonaias pustulosa (p = 0.017)). Three species were also marginally associated with uncontrolled dams (i.e., Lasmigona complanata (p = 0.058), Ligumia recta (p = 0.059), and Quadrula quadrula (p = 0.065)). Utterbackia imbecillis (p = 1.000) and Ptychobranchus fasciolaris (p = 0.112) were only found downstream of uncontrolled dams, but due to low abundances these species were not significantly associated with uncontrolled dams. Furthermore, there were no species associated with controlled dams and one species (i.e., Alasmidonta viridis (p = 0.008) was associated with dam removals (p = 0.008) and was found at one site (Table 1), comprising 1% of the assemblage.
The NMDS ordination (stress = 0.129, iterations = 100) and MRPP results (p = 0.001, A = 0.080) revealed that mussel assemblages group by anthropogenic barrier (Figure 3). Many of the periodic species found across all sites were grouped in the middle of the ordination except Fusconaia flava which is considered an equilibrium species (Figure 3; Table 1). Mussel assemblages at controlled sites are represented in the ordination with a tighter (i.e., smaller ellipse) ordination relationship than the uncontrolled and removal sites representing a more predictable unionid assemblage at the controlled dam sites.
Species richness (χ2 = 6.62, df = 2, p = 0.036; Figure 4A) and Shannon’s diversity (χ2 = 12.853, df = 2, p = 0.002; Figure 4B) differed significantly among anthropogenic barriers. Species richness at uncontrolled dams ( x ¯ = 7.47 ± 0.92) was greater than dam removals ( x ¯ = 4.21 ± 1.01) (p = 0.0062) and marginally greater than controlled dams ( x ¯ = 5.83 ± 0.42) (p = 0.057; Figure 4A). There were no differences in CPUE (χ2 = 1.76, df = 2, p = 0.416; Figure 4C) among anthropogenic barriers; however, uncontrolled dams had the highest CPUE ( x ¯ = 29.44 ± 18.35), followed by dam removals ( x ¯ = 24.90 ± 29.13), and controlled dams ( x ¯ = 14.69 ± 2.59). Shannon’s diversity at dam removals ( x ¯ = 2.10 ± 0.35) was less than uncontrolled ( x ¯ = 4.71 ± 0.55; p < 0.001) and controlled dams ( x ¯ = 3.76 ± 0.39; p = 0.009), and no difference occurred between uncontrolled and controlled dams (p = 0.191; Figure 4B). The statistical power (%) for Kruskal–Wallis tests varied among response variables tested, and was 25 for species richness, 11 for CPUE, and 52 for Shannon’s diversity (EXP (H’)).
Species richness was marginally related to the number of years since dams were removed (p = 0.068, R2 = 0.630; Figure 5).

3.2. Variation of Mussel Assemblages Along a Downstream Gradient from Anthropogenic Barriers

Overall, mussel species richness differed significantly among transects for uncontrolled (χ2 = 10.54, df = 4, p = 0.032) and controlled dams (χ2 = 12.61, df = 4, p = 0.014, Figure 6A). Species richness downstream of uncontrolled dams does not follow an increasing or decreasing pattern with longitudinal distance, however transect 2 ( x ¯ = 0.82 ± 0.14) contained more species than transects 1 ( x ¯ = 0.38 ± 0.10), 3 ( x ¯ = 0.37 ± 0.11), and 5 ( x ¯ = 0.36 ± 0.08) (p < 0.05, Figure 6A). Species richness increased with distance downstream of controlled dams, with more species in transects 4 ( x ¯   =   0.4   ±   0.11 ) and 5 ( x ¯   =   0.38   ±   0.11 ) than transects 1 ( x ¯ = 0.08 ± 0.48), 2 ( x ¯ = 0.10 ± 0.04), and 3 ( x ¯ = 0.16 ± 0.07) (p < 0.05, Figure 6B). There was not a statistical difference in species richness among transects for dam removal sites (χ2 = 0.84, df = 4, p = 0.933, Figure 6C). Mussel density was significantly different among transects downstream of sites for uncontrolled (χ2 = 10.25, df = 4, p = 0.036, Figure 6D) and controlled dams (χ2 = 12.38, df = 4, p = 0.015, Figure 6E), with no differences in density downstream of dam removals (χ2 = 0.85, df = 4, p = 0.931) (Figure 6F). Mussel density downstream of uncontrolled dams does not produce any discernible longitudinal pattern, with transect 2 ( x ¯ = 4.32 ± 0.88) containing more mussels m−2 than transects 1 ( x ¯ = 2.4 ± 0.97), 3 ( x ¯ = 1.68 ± 0.56), and 5 ( x ¯ = 1.84 ± 0.43) (p < 0.05). Density downstream of controlled dams increased along a downstream gradient, with more mussels m−2 for transects 4 ( x ¯   =   1.68   ±   0.49 ) and 5 ( x ¯   =   2.48   ±   0.84 ) than transects 1 ( x ¯ = 0.32 ± 0.19), 2 ( x ¯   =   0.56   ±   0.26 ), and 3 ( x ¯   =   0.88   ±   0.38 ) (p < 0.05). Shannon’s diversity only differs significantly among controlled dams (χ2 = 11.23, df = 4, p = 0.019), with no differences among transects 1–5 for uncontrolled dams (χ2 = 8.57, df = 4, p = 0.073) and dam removals (χ2 = 1.06, df = 4, p = 0.901). Shannon’s diversity downstream of controlled dams is greatest at transects 4 ( x ¯ = 1.16 ± 0.01) and 5 ( x ¯ = 1.10 ± 0.01), with statistical differences between transect 4 and transects 1 ( x ¯ = 1.02 ± 0.00), 2 ( x ¯ = 1.00 ± 0.00), and 3 ( x ¯ = 1.04 ± 0.00) (p < 0.05), as well as between transect 5 and 2 (p = 0.04). The statistical power (%) for Kruskal–Wallis tests varied among response variables and anthropogenic barriers; with a power of 23, 20, and 5 for species richness, 15, 21, and 14 for density, and 15, 19, and 5 for Shannon’s diversity (EXP (H’)) for uncontrolled, controlled, and removals, respectively. It should be noted that observations during sampling at HG1 have shown downstream discharges to be variable and different than upstream seasonal flows. Downstream flow, at HG1, rarely occurred over the spillway and was released through gates on each side of the dam.

3.3. Microhabitat Parameters

Ten microhabitat parameters were retained from VIF selection and used in GLMM (i.e., silt/clay, sand, gravel, cobble, boulder, bedrock, depth, benthic velocity, growing degree days, and total suspended solids). All variables had VIF values < 5, which indicate low to moderate multicollinearity. When mussel presence/absence was used as the response variable, seven models had ∆AIC’s < 2, with the best model including silt/clay, gravel, bedrock, and total suspended solids (wm = 0.242) (Table 2). Variable weights for silt/clay (wv = 1), gravel (wv = 1), total suspended solids (wv = 1), and bedrock (wv = 0.725) were determined as important predictor variables for mussel presence/absence. For species richness as the response variable, six models had ∆AIC’s < 2 with the best model also including silt/clay, gravel, bedrock, and total suspended solids (wm = 0.264) (Table 2). The important predictor variables for species richness were silt/clay (wv = 1), gravel (wv = 1), total suspended solids (wv = 1), and bedrock (wv = 0.875). For density as the response variable, six models had ∆AIC’s < 2 with the best model including silt/clay, gravel, cobble, bedrock, and total suspended solids (wm = 0.317) (Table 2). Similar to previous models, silt/clay (wv = 1), bedrock (wv = 1), total suspended solids (wv = 1), and gravel (wv = 0.733) were regarded as important predictor variables to predict mussel density; however, cobble (wv = 0.733) was also included. As different substrate types (i.e., silt/clay, gravel, cobble, and bedrock) were regarded as important predictor variables, mean % substrate composition by anthropogenic barrier was calculated (Figure S1) and along the downstream gradient at transects (Figure S2). Controlled dams contained the least % fine-grained substrate (silt/clay ( x ¯ = 1.12 ± 0.54) and sand ( x ¯ = 4.16 ± 0.75)), followed by uncontrolled (silt/clay ( x ¯ = 5.04 ± 1.29) and sand ( x ¯ = 13.59 ± 1.67)), and dam removals (silt/clay ( x ¯ = 6.27 ± 1.39) and sand ( x ¯ = 29 ± 2.35)). Dam removals contained the least % coarse-grained substrate (gravel ( x ¯ = 47.18 ± 2.56) and cobble ( x ¯ = 8.64 ± 1.22)), followed by uncontrolled (gravel ( x ¯ = 56.41 ± 2.43) and cobble ( x ¯ = 15.55 ± 1.69)), and controlled dams (gravel ( x ¯ = 66.56 ± 2.09) and cobble ( x ¯ = 19.12 ± 1.67)). Downstream of controlled dams, % cobble decreased from transects 1 to 3, while % gravel increased. Downstream of uncontrolled dams, % silt/clay increased from transect 1 to 3, while % cobble decreased. Substrate composition downstream of dam removals does not follow a distinct pattern; however, substrate is more uniform across dam removal transects, than uncontrolled and controlled dam transects. There was no silt along transect 1 for all three anthropogenic barriers.

4. Discussion

This study has shown that freshwater mussel assemblages are regionally diverse and variable downstream of dam and dam removal reaches of rivers in the Lake Michigan basin, Michigan, USA. Additionally, contrary to other studies that have occurred in areas without anthropogenic barriers [80,81,82,83], this study shows that downstream mussel assemblages can be predicted by microhabitat parameters such as substrate and total suspended solids. The ability to identify important mussel microhabitat characteristics gives managers a tool to conserve and restore priority areas for imperiled freshwater mussels. As a result, managers responsible for anthropogenic barriers can use data from this study to quantify microhabitat parameters and predict common mussel metrics (e.g., mussel presence, species richness, density) and species indicative of barrier types. Furthermore, changes in microhabitat parameters following dam removal can be used to generate ecological models that predict further imperilment or recovery of freshwater mussels worldwide.

4.1. Mussel Assemblages Downstream of Three Anthropogenic Barrier Types

In this study, mussel assemblages downstream of barriers were influenced by variation in sediment composition and the assemblages differed among anthropogenic barriers. Uncontrolled dams had the highest mussel diversity and predictable indicator species, while substrate composition was intermediate when compared to other barriers. Uncontrolled dams may facilitate intermediate levels of disturbance necessary for all life-history strategies to coexist (i.e., opportunistic, periodic, and equilibrium) [14,84] by providing substrate heterogeneity that is neither too fine nor coarse-grained. Species associated with uncontrolled dams represented all life-history strategies (i.e., opportunistic (L. complanata), periodic (L. recta and E. triquetra), and equilibrium (A. plicata, C. pustulosa, and Q. quadrula)), adding further support to the intermediate disturbance hypothesis [21], suggesting that there are unstable (i.e., opportunistic), cyclical (i.e., periodic), and stable (i.e., equilibrium) habitats downstream of uncontrolled dams [14]. Though there were no species associated with controlled dams and only one species (i.e., A. viridis) associated with dam removals in this study, the majority of species found downstream of controlled dams and dam removals represented the periodic life-history strategy. The presence of periodic species suggests that habitats downstream from controlled dams and dam removals could be experiencing cyclical levels of disturbance that exclude habitat for equilibrium and opportunistic species [14].
Sediment stability was considered an important mussel predictor variable and various substrate sizes can be stable, facilitating mussel colonization and burrowing to aid in anchoring [80,85]. Substrate downstream of dam removals contained unstable finer-grained sediments, which covered coarser-grained sediment necessary for stable mussel habitats. Controlled dams had the highest % gravel and cobble substrates that limit mussel diversity when compared to uncontrolled dams that contained intermediate % gravel and cobble. Gravel and cobble were both positively related to mussel metrics, yet excess coarse-grained sediment can also limit mussel diversity when substrate is not penetrable for mussel burrowing [86].
Study results also suggest that low-head dams sampled during this study contained greater mussel diversity than dam removals; however, there was no difference in CPUE among the three anthropogenic barriers. Hornbach et al. [52] compared mussel assemblages upstream and downstream of impoundment conditions at 2 dams, finding the highest densities downstream of the uncontrolled dam (Sunrise River, Wisconsin) and the highest diversity downstream of the controlled dam (St. Croix River, Minnesota). Contrary to Hornbach et al. [52], the current study had more replicates and species richness downstream of uncontrolled dams was greater than controlled dams. Furthermore, it has been noted that tailwater reaches of low-head dams contain as dense mussel populations as free-flowing reaches [14]; however, Walter [51] discovered increased species-richness downstream of uncontrolled dams than other sites sampled in the Neuse River Basin, North Carolina. None of the previous studies sampled downstream substrate composition; however, similar to this study, Gangloff [12] found coarser-grained substrates as important predictors for mussel richness and density downstream of 22 low-head dams in Alabama streams. Results of this study are consistent with others and suggest that reaches downstream of low-head dams can support regionally diverse and abundant mussel assemblages [12,14,51,52].
Differing from this study, past studies downstream of low-head dams have also attributed diverse and dense assemblages to both increased water temperatures and total suspended solids associated with dams [12,13,52]. Mixed-effects models did not determine water temperature to be an important predictive variable and we did not find significant differences in water temperature among barriers. Increased water temperatures may improve glochidia viability and growth rates which cause mussels to reach reproductive maturity faster [7,13,14,52,87,88]. However, because water temperatures were not collected upstream of impoundment conditions, we cannot conclude that dams do not influence downstream temperatures. Mean summer temperatures at study sites are ~6 °C cooler than found in another study [13] (i.e., ~27 °C); therefore, mussels at study sites in the Great Lakes region may not experience greater resource assimilation than previously documented [13], emphasizing regional differences and contributing to the knowledge that variability seen in rivers is important to acknowledge.
Total suspended solids were regarded as an important predictor variable in the mixed-effects models, yet there were no differences among anthropogenic barriers. Total suspended solids were used in this study as a measure of inorganic and organic suspended solids. Studies have observed that impoundments increase particulate organic matter through increased primary productivity and hydrologic retention times, which may benefit downstream filter-feeding macroinvertebrates [22,23,88]. As freshwater mussels consume particulate organic matter (POM), studies have hypothesized that low-head dams may increase food availability (i.e., organic suspended solids), growth rates, and densities of downstream mussel populations [13,52]. There were no differences in organic suspended solids by anthropogenic barrier, suggesting that low-head dams do not increase the food source for downstream mussel populations in this study. Furthermore, there were no differences in downstream inorganic suspended solids, suggesting that sediment release is still occurring in post-removal impoundments and some fine-grained sediments remain in suspension through low-head dam impoundments.
Dam removals contained the lowest mussel diversity; however, RC1 (i.e., the oldest dam removal, removed in 1998) contained regionally diverse assemblages (10 species) and had the highest mussel density of all sites ( x ¯ = 24.32 mussels m−2). However, dam removal impacts in this study are harder to gauge without pre-removal data and long-term mussel recovery data from other studies. Dam removal results show that there is a slight positive relationship between mussel species richness and dam removal age. This study suggests that age of removal may be important in predicting mussel assemblage recovery and dam removals may have short-term (<16 years) impacts on downstream mussel communities in the Laurentian Great Lakes region; yet mussel recovery may take longer than in regions with higher gradient rivers.
Following a 3-year post-monitoring removal of a small (i.e., 3.3 m) low-head dam in Wisconsin, downstream mussel communities decreased in density (~32%) and C. pustulosa was extirpated from fine-grained sediment deposition [54]. Cyclonaias pustulosa is also a species absent from mussel assemblages downstream of dam removals in our study; however, was present and significantly associated with uncontrolled dams. In contrast to Sethi et al. [54], Heise et al. [36] monitored mussel assemblages for 4-years post-removal of a small controlled dam in North Carolina and found no significant effect on density or species richness. Similar to Heise et al. [35], McCormick [18] also did not find adverse effects on mussel assemblages following 2 dam removals in North Carolina. These studies suggest that not all dam removals impair downstream mussel assemblages. As long as impoundments are not sediment traps [20], the likelihood of legacy sediments smothering downstream mussel assemblages may be low [89]. However, we are aware of no studies where downstream mussel assemblages have improved following dam removal. The age since dam removal will likely influence whether mussel assemblages have improved and if restoration was a success relative to mussel recruitment.

4.2. Variation of Mussel Assemblages Along a Downstream Gradient from Anthropogenic Barriers

Mussel species richness, density, and Shannon’s diversity showed differing patterns along a downstream gradient for each anthropogenic barrier. Downstream of uncontrolled dams, a middle transect (i.e., transect 2) contained higher densities and more species than transects closer to the dam and further downstream (e.g., transects 1,3, and 5). This pattern may be attributed to relatively higher % cobble closer to uncontrolled dams that create impenetrable habitat for freshwater mussels and higher % silt that facilitates non-ideal mussel habitat for some species. Silt is often too unstable to support mussel burrowing [86] and has low permeability, facilitating decreased dissolved oxygen and increasing concentrations of unionized ammonia that can be toxic to freshwater mussels [90,91,92]. Similar to bed scour caused by large dams [87], bed scour seems to result downstream of uncontrolled dams to at least 50 m. However, unlike larger dams that can result in >99% trap efficiency of incoming sediment [93], a degree of silt and sand remain in suspension through the impoundment and begin to settle out further downstream (i.e., beyond transect 3).
Downstream of controlled dams, there was an increase in species richness and density as distance increased. The furthest downstream transects (i.e., transects 4 and 5) had higher densities and species richness than other transects, which may be attributed to a decrease in % cobble that does not limit mussel persistence. Transect 3 had similar substrate composition than transects further downstream but lower mussel richness and density. This pattern indicates that substrate may stabilize beyond transect 3 and may increase mussel persistence in those areas. In a river reach downstream of a large dam in Oklahoma, species richness and abundance of freshwater mussels did not recover until 20 km downstream of an impoundment due to controlled and variable discharge impacts on sediment composition, deposition, and scour [94]. The correlation of sediment size and stability relies on hydraulic conditions, with sediment composition remaining dynamic downstream of controlled dams with large variations in discharge regimes (e.g., peaking operations) [82,86]. Additionally, compared to the other barriers in this study, controlled dams contained the highest % gravel and cobble and the least % sand and silt among all transects. The relatively high % coarse substrate and low % fine substrate, suggests that impoundments entrain fine sediment from downstream reaches and/or fine sediment is flushed beyond the sampled areas. Peaking operations have the propensity of flushing fine-grained sediments further downstream, resulting in substrate coarsening and scour (i.e., streambed armoring) [82,95]. However, the high % of downstream gravel, indicates a substrate conducive for mussel persistence.
Downstream of dam removals there was not a difference in mussel density or diversity along a downstream gradient and substrate composition was relatively similar across transects. All transects had the highest % fine-grained substrate and the least % coarse-grained substrate of anthropogenic barriers, which suggests fine-grained sediment deposition following dam removal. As transects downstream of dam removals had high amounts of fine-grained substrate, post-impoundment sediment transport may be dominated by fine-grained substrates until an equilibrium is reached [96]. Three years after a dam removal in Michigan, ~14% of impoundment sediment (i.e., dominated by sand) was deposited within 1 km of the dam and was estimated to continue for many years [97]. Due to the age of dams in this study (i.e., >100 years) and the low-gradient status of other rivers throughout the Great Lakes region, impoundment sediment compaction will increase the time frame before downstream substrate coarsening can occur [30,32]. Following a dam removal in Michigan, sediment release was estimated to take around 50–80 years based upon the high degree of sediment compaction [98].

4.3. Management Implications

As freshwater mussels are relatively sedentary during their adult life and dependent on fish for dispersal during the obligate early life-stage, recovery rates following dam removal may take longer than for more mobile species (e.g., fish) and/or species with high reproductive capacity and short-life spans (e.g., aquatic insects) [8,15]. Therefore, it is important to weigh the costs and benefits of dam removal on a case-by-case basis [27]. In addition, because most streams are anthropogenically impacted, there have been unanticipated impacts of dam removal such as contaminant, sediment, and nutrient mobilization from impoundment conditions that can cause irreversible ecosystem harm [8,15,32,54]. Dams have also played a role in restricting the range of some invasive species such as sea lamprey and Asian carp in the Great Lakes basin [98,99] and impoundments may also facilitate spread of other species such as dreissenids (i.e., (i.e., zebra and quagga mussels) [100]. Dam removal can also flush larval dreissenids, which are pelagic, to downstream reaches, facilitating the spread of an invasive species which are detrimental to freshwater mussels [100]. As a result, dam removal in areas at risk of invasion may have unintended ecological and economic consequences.
Freshwater mussel assemblages can persist with high diversity and density downstream of dams; therefore, considerations of dam removals must include possible negative impacts to freshwater mussel assemblages and endangered mussels. In rare instances, dam removal impacts on mussel assemblages might outweigh the benefits and dam repair might be a better option. Freshwater mussels were species rich and occurred at the highest densities downstream of a dam removal used in this study (i.e., RC1). However, no long-term mussel studies exist that gauge mussel recovery time post-removal. Continued monitoring of these post-removal mussel assemblages that have low species richness and abundance would increase the scientific understanding of mussel response to future dam removals in the Great Lakes basin and worldwide. Mussel assemblages downstream of uncontrolled and controlled dams were more diverse than assemblages downstream of dam removals. However, mussel assemblages were less diverse and dense at a few of these sites (i.e., HG1, HG2, and DG1), which necessitates further research to determine reasons for adverse effects on these mussel assemblages and ecological rational for the variability observed. For example, detailed long-term discharge and flow data may be relevant to assess patterns through time and useful in predicting mussel assemblage characteristics. Additionally, DG1 was directly downstream of a wastewater treatment facility (< 100 m) and mussels may be at risk from unionized ammonia, chloride, and contaminant concentrations that are toxic to freshwater mussels [101,102,103,104]. Additional water quality testing for ammonia, chloride levels, and other contaminants may add further explanation of poor mussel communities at locations where effluent may be influenced by wastewater treatment plants. Studies can also incorporate free-flowing reaches outside the zone of influence of barriers in order to further quantify the effects of dams on aquatic biota and make predictions following dam removals.
Currently, pre- and post-removal studies are lacking and may be influenced by public and scientific perception that dam removal will automatically lead to improved stream conditions and the high costs associated with dam removals and monitoring studies [10]. Uncontrolled dams will likely be the target of future dam removals because they outnumber controlled dams and many do not serve a purpose [2,32]. Approximately 85% of all U.S. dams have expired in 2020 and will be potential candidates for removal [105]. Although much research focus on dam removals in the United States; it is evident through the increased research on macroinvertebrates and dams worldwide [106] that the results on downstream assemblages of barriers can be used for worldwide predictions. However, the results of this study have important conservation implications for freshwater mussel assemblages downstream of anthropogenic barriers. Mussel assemblages downstream of most uncontrolled dams were regionally diverse and abundant; therefore, removal may result in further imperilment of freshwater mussels.
Furthermore, results of this study indicate that freshwater mussels can persist as regionally diverse and dense assemblages downstream of controlled dams in the Lake Michigan basin, yet mussel assemblages were variable. As a result, operation of controlled dams is paramount to maintain adequate downstream habitat to support freshwater mussels. We recommend that future controlled dams regulations incorporate monitoring of impacts to mussel assemblages.
Although this study focused on mussels, incorporating data learned from this study in decision making about barriers is likely to have concurrent, and perhaps similar, influence on non-molluscan communities. For example, this study helps provide lacking intrariver variation and supports non-molluscan macroinvertebrate data that recolonization post dam removal is difficult to quantify [107]; however, we have provided a timeframe for when recolonization may be observed for freshwater mussels (e.g., >16 years) and suggest patterns that may occur in other organismal groups. Worldwide fish have been impacted by connectivity of riverine ecosystems [108] but our study adds to the ecological links of variable trophic levels (e.g., filter feeders and predators) and also the potential dispersal of mussels by host fish that may be understood by considering adult mussel distribution. For example, fish that are required hosts for the mussel reproductive cycle may be unable to pass barriers; therefore, mussel populations may be denser downstream of certain barrier types (e.g., hydroelectric [109]) with the mussel diversity and distribution reflecting host fish movement. Theoretically, freshwater mussels should be able to recolonize upstream reaches if host-fish passage is not restricted and life-history and habitat requirements of mussels are met [53,89,109]. Finally, this study adds information that may contribute to the understanding of shifts in food web structure that may happen during dam removals [110] and could be incorporated into restoration actions.
As dam removals are often stream restoration targets and will be in the foreseeable future, dam removals must have anticipated positive effects on ecosystem conditions [15,27]. From the dam removals used in this study, most sites have poor benthic habitat and mussel assemblages. Pre- and post-monitoring studies are a necessity to measure dam removal ecosystem response and make informed management decisions for future dam removals [27]. Our study indicates that post-removal studies may need to incorporate >16 years of data (oldest removal in the current study), before recovery or stabilization of freshwater mussel assemblages can be observed.

5. Conclusions

Anthropogenic barriers, including dam removals, had different impacts on downstream mussel assemblages and microhabitat parameters in the Lake Michigan basin, Michigan, USA. This study confirms that dam-related microhabitat impacts (i.e., substrate type) can be used to predict freshwater mussel assemblages. Further quantification of barrier-related impacts is imperative to guide conservation efforts of freshwater mussels worldwide and this study highlights valuable data to be collected during future studies. Additionally, this study shows that mussel assemblages downstream of uncontrolled dams are more diverse than controlled dams and dam removals. However, each anthropogenic barrier type had examples of mussel assemblages that would be considered species rich and dense It is clear that the predictive ability of mussel assemblages downstream of all anthropogenic barriers can be a challenge. Further, anthropogenic barrier impacts must be statistically modeled, using data like those collected during this study, to understand potential impacts on mussel communities. Additionally, post-removal impacts (i.e., sedimentation) in low-gradient rivers may be more severe and take longer to remediate than other rivers. The results of this research can be used to help guide more effective conservation plans for North American freshwater mussels in response to dam-related impacts and recovery of mussel assemblages following dam removal.

Supplementary Materials

The following are available online at https://www.mdpi.com/1424-2818/13/3/119/s1, Table S1. Site history for fifteen sites in the Lake Michigan basin, Michigan, USA. Figure S1. Mean percent substrate composition at three anthropogenic barriers in the Lake Michigan basin, Michigan, USA. Figure S2. Mean percent substrate composition at anthropogenic barriers (n = 5 for each type of barrier) in the Lake Michigan basin, Michigan, USA. (A) silt/clay, (B) gravel, (C) cobble along transects.

Author Contributions

Conceptualization, S.E.B. and D.A.W.; data curation, S.E.B.; formal analysis, S.E.B.; funding acquisition, D.A.W.; investigation, S.E.B.; methodology, S.E.B. and D.A.W.; project administration, D.A.W.; resources, D.A.W.; supervision, D.A.W.; writing—original draft, S.E.B.; writing—review and editing, S.E.B. and D.A.W. All authors have read and agreed to the published version of the manuscript.

Funding

This research was supported with funding from Ionia Conservation District and Central Michigan University.

Institutional Review Board Statement

Not applicable.

Informed Consent Statement

Not applicable.

Data Availability Statement

The data presented in this study are available on request from the corresponding author. These data are not publicly available due to federally and state endangered and threatened species in the study.

Acknowledgments

Field assistants for this study were: Emily Schaefer, Amanda Chambers, Amelia Baird, Kelsey Krupp, Ryan Cooke, Marissa Romero, Scott LaValley, Victoria Smith, Mariah Wild Scott, Jordan Hoffman, Trevor Hewitt, Courtney King, and Baleigh Schuler. We would thank Brad Swanson (Central Michigan University; CMU) and Kevin Pangle (CMU) for their input on earlier versions of this manuscript. Thank you to David Zanatta (CMU) for aid with mussel identification. For assistance with site selection, we thank Luke Trumble (Michigan Department of Environmental Quality), Scott Hanshue (Michigan Department of Natural Resources), Jamie Bettaso (United States Fish and Wildlife Service), and Chris Freiburger (Michigan Department of Natural Resources. Mussel surveys were performed in accordance with permits from the Michigan Department of Natural Resources and United States Fish and Wildlife Service. The manuscript benefited from comments from an anonymous reviewer. This paper is contribution #152 of the CMU Institute for Great Lakes Research. Thank you to anonymous reviewers that have provided helpful feedback on this manuscript.

Conflicts of Interest

The authors declare no conflict of interest. The funders had no role in the design of the study; in the collection, analyses, or interpretation of data; in the writing of the manuscript, or in the decision to publish the results.

References

  1. Baxter, R.M. Environmental effects of dams and impoundments. Annu. Rev. Ecol. Syst. 1977, 8, 255–283. [Google Scholar] [CrossRef]
  2. Benke, A.C. A perspective on America’s vanishing streams. J. N. Am. Benthol. Soc. 1990, 9, 77–88. [Google Scholar] [CrossRef]
  3. Dynesius, M.; Nilsson, C. Fragmentation and flow regulation of river systems in the northern third of the world. Science 1994, 266, 753. [Google Scholar] [CrossRef] [PubMed]
  4. Graf, W.L. Dam nation: A geographic census of American dams and their large-scale hydrologic impacts. Water Resour. Res. 1999, 35, 1305–1311. [Google Scholar] [CrossRef]
  5. WCD (World Commission on Dams). Dams and Development: A New Framework for Decision-Making; Earthscan Publications: Sterling, VA, USA, 2000. [Google Scholar]
  6. Anderson, E.P.; Pringle, C.M.; Freeman, M.C. Quantifying the extent of river fragmentation by hydropower dams in the Sarapiqui River Basin, Costa Rica. Aquat. Conserv. 2008, 18, 408–417. [Google Scholar] [CrossRef]
  7. Bednarek, A.T. Undamming rivers: A review of the ecological impacts of dam removal. Environ. Manag. 2001, 27, 803–814. [Google Scholar] [CrossRef] [PubMed]
  8. Stanley, E.H.; Doyle, M.W. A geomorphic perspective on nutrient retention following dam removal. Bioscience 2002, 52, 693–701. [Google Scholar] [CrossRef] [Green Version]
  9. Haslam, S.M. The Riverscape and the River; Cambridge University Press: New York, NY, USA, 2008. [Google Scholar]
  10. Poff, N.L.; Hart, D.D. How dams vary and why it matters for the emerging science of dam removal. Bioscience 2002, 52, 659–668. [Google Scholar] [CrossRef] [Green Version]
  11. Kingsford, R.T. Ecological impacts of dams, water diversions and river management on floodplain wetlands in Australia. Austral. Ecol. 2000, 25, 109–127. [Google Scholar] [CrossRef]
  12. Gangloff, M.M.; Hartfield, E.E.; Werneke, D.C.; Feminella, J.W. Associations between small dams and mollusk assemblages in Alabama streams. J. N. Am. Benthol. Soc. 2011, 30, 1107–1116. [Google Scholar] [CrossRef]
  13. Singer, E.E.; Gangloff, M.M. Effects of a small dam on freshwater mussel growth in an Alabama (USA) stream. Freshwater Biol. 2011, 56, 1904–1915. [Google Scholar] [CrossRef]
  14. Haag, W.R. North American Freshwater Mussels: Natural History, Ecology, and Conservation; Cambridge University Press: New York, NY, USA, 2012. [Google Scholar]
  15. Gangloff, M.M. Taxonomic and ecological tradeoffs associated with small dam removals. Aquat. Conserv. 2013, 23, 475–480. [Google Scholar] [CrossRef]
  16. Poff, N.L.; Allan, J.D.; Bain, M.B.; Karr, J.R.; Prestegaard, K.L.; Richter, B.D.; Stromberg, J.C. The natural flow regime. Bioscience 1997, 47, 769–784. [Google Scholar] [CrossRef]
  17. Hoch, R.A. Beaver and Mill Dams Alter Freshwater Mussel Habitat, Growth, and Survival in North Carolina Piedmont Streams. Master’s Thesis, Appalachian State University, Boone, NC, USA, 2012. [Google Scholar]
  18. McCormick, M.A. Effects of Small Dams on Freshwater Bivalve Assemblages in North Carolina Piedmont and Coastal Plain Streams. Master’s Thesis, Appalachian State University, Boone, NC, USA, 2012. [Google Scholar]
  19. ICF Consulting. A Summary of Existing Research on Low-Head Dam Removal Projects; American Association of State Highway and Transportation Officials: Washington, DC, USA, 2005. [Google Scholar]
  20. Csiki, S.J.; Rhoads, B.L. Influence of four run-of-river dams on channel morphology and sediment characteristics in Illinois, USA. Geomorphology 2014, 206, 215–229. [Google Scholar] [CrossRef]
  21. Wilson, J.B. Mechanisms of species coexistence: Twelve explanations for Hutchinson’s paradox of the plankton: Evidence from New Zealand plant communities. N. Z. J. Ecol. 1990, 13, 17–42. [Google Scholar]
  22. Cushing, C.E., Jr. Filter-feeding insect distribution and planktonic food in the Montreal River. Trans. Am. Fish. Soc. 1963, 92, 216–219. [Google Scholar] [CrossRef]
  23. Simmons, G.M., Jr.; Voshell, J.R., Jr. Pre-and post-impoundment benthic macroinvertebrate communities of the North Anna River. In Current Perspectives on River-Reservoir Ecosystems; Cairns, J., Benfield, E.F., Webster, J.R., Eds.; North American Benthological Society: Havana, IL, USA, 1978; pp. 45–61. [Google Scholar]
  24. Pejchar, L.; Warner, K. A river might run through it again: Criteria for consideration of dam removal and interim lessons from California. Environ. Manag. 2001, 28, 561–575. [Google Scholar]
  25. Grant, G. Dam removal: Panacea or pandora for rivers? Hydrol. Process. 2001, 15, 1531–1532. [Google Scholar] [CrossRef]
  26. Hart, D.D.; Johnson, T.E.; Bushaw-Newton, K.L.; Horwitz, R.J.; Bednarek, A.T.; Charles, D.F.; Velinsky, D.J. Dam Removal: Challenges and Opportunities for Ecological Research and River Restoration. Bioscience 2002, 52, 669–682. [Google Scholar] [CrossRef]
  27. Palmer, M.A.; Bernhardt, E.S.; Allan, J.D.; Lake, P.S.; Alexander, G.; Brooks, S.; Sudduth, E. Standards for ecologically successful river restoration. J. Appl. Ecol. 2005, 42, 208–217. [Google Scholar] [CrossRef]
  28. Shuman, J.R. Environmental considerations for assessing dam removal alternatives for river restoration. Regul. Rivers Res. Manag. 1995, 11, 249–261. [Google Scholar] [CrossRef]
  29. Perrin, C.J.; Ashley, K.I.; Larkin, G.A. Effect of drawdown on ammonium and iron concentrations in a coastal mountain reservoir. Water Qual. Res. J. Can. 2000, 35, 231–244. [Google Scholar] [CrossRef]
  30. Pizzuto, J. Effects of Dam Removal on River Form and Process. Bioscience 2002, 52, 683–691. [Google Scholar] [CrossRef] [Green Version]
  31. Heinz Center. Dam Removal: Science and Decision Making; The H. John Heinz III Center for Science, Economics, and the Environment: Washington, DC, USA, 2002. [Google Scholar]
  32. Doyle, M.W.; Harbor, J.M.; Stanley, E.H. Toward policies and decision-making for dam removal. Environ. Manag. 2003, 31, 453–465. [Google Scholar] [CrossRef]
  33. Kanehl, P.D.; Lyons, J.; Nelson, J.E. Changes in the habitat and fish community of the Milwaukee River, Wisconsin, following removal of the Woolen Mills Dam. N. Am. J. Fish. Manag. 1997, 17, 387–400. [Google Scholar] [CrossRef]
  34. Smith, L.W.; Dittmer, E.; Prevost, M.; Burt, D.R. Breaching of a small irrigation dam in Oregon: A case history. N. Am. J. Fish. Manag. 2000, 20, 205–219. [Google Scholar] [CrossRef]
  35. Stanley, E.H.; Doyle, M.W. Trading off: The ecological effects of dam removal. Front. Ecol. Environ. 2003, 1, 15–22. [Google Scholar] [CrossRef]
  36. Heise, R.J.; Cope, W.G.; Kwak, T.J.; Eads, C.B. Short-term effects of small dam removal on a freshwater mussel assemblage. Walkerana 2013, 16, 41–52. [Google Scholar] [CrossRef]
  37. Christian, A.D.; Smith, B.N.; Berg, D.J.; Smoot, J.C.; Findlay, R.H. Trophic position and potential food sources of 2 species of unionid bivalves (Mollusca: Unionidae) in 2 small Ohio streams. J. N. Am. Benthol. Soc. 2004, 23, 101–113. [Google Scholar] [CrossRef]
  38. Vaughn, C.C.; Hakenkamp, C.C. The functional role of burrowing bivalves in freshwater ecosystems. Freshwater Biol. 2001, 46, 1431–1446. [Google Scholar] [CrossRef] [Green Version]
  39. Spooner, D.E.; Vaughn, C.C. A trait-based approach to species’ roles in stream ecosystems: Climate change, community structure, and material cycling. Oecologia 2008, 158, 307–317. [Google Scholar] [CrossRef]
  40. Atkinson, C.L.; First, M.R.; Covich, A.P.; Opsahl, S.P.; Golladay, S.W. Suspended material availability and filtration–biodeposition processes performed by a native and invasive bivalve species in streams. Hydrobiologia 2011, 667, 191–204. [Google Scholar] [CrossRef]
  41. McCall, P.L.; Tevesz, M.J.; Schwelgien, S.F. Sediment mixing by Lampsilis radiata siliquoidea (Mollusca) from western Lake Erie. J. Great Lakes Res. 1979, 5, 105–111. [Google Scholar] [CrossRef]
  42. Strayer, D.L.; Hunter, D.C.; Smith, L.C.; Borg, C.K. Distribution, abundance, and roles of freshwater clams (Bivalvia, Unionidae) in the freshwater tidal Hudson River. Freshw. Biol. 1994, 31, 239–248. [Google Scholar] [CrossRef]
  43. Williams, J.D.; Warren, M.L., Jr.; Cummings, K.S.; Harris, J.L.; Neves, R.J. Conservation status of freshwater mussels of the United States and Canada. Fisheries 1993, 18, 6–22. [Google Scholar] [CrossRef]
  44. Ferreira-Rodriguez, N.; Akiyama, Y.; Aksenova, O.A.; Araujo, R.; Barnhart, C.; Bespalaya, Y.; Bogan, A.; Bolotov, I.; Budha, P.B.; Clavijo, C. Research priorities for freshwater mussel conservation assessment. Biol. Conserv. 2019, 231, 77–87. [Google Scholar] [CrossRef] [Green Version]
  45. MDNR (Michigan Department of Natural Resources). Michigan’s Official List of Endangered and Threatened Species. 2009. Available online: http://www.michigan.gov/documents/dnr/2007-007_NR_Threatened_Endangered_Species__nonstrike__9-12._274586_7.pdf (accessed on 31 January 2021).
  46. USFWS (United States Fish and Wildlife Service). Endangered and threatened wildlife and plants; determination of endangered status for the rayed bean and snuffbox mussels throughout their ranges. Fed. Regist. 2012, 77, 8632–8665. [Google Scholar]
  47. Mulcrone, R.S.; Rathbun, J.E. Pocket Field Guide to the Freshwater Mussels of Michigan, 2nd ed.; Michigan Department of Natural Resources: Lansing, MI, USA, 2020; pp. 1–78.
  48. Ricciardi, A.; Rasmussen, J.B. Extinction rates of North American freshwater fauna. Conserv. Biol. 1999, 13, 1220–1222. [Google Scholar] [CrossRef]
  49. Zanatta, D.T.; Mackie, G.L.; Metcalfe-Smith, J.L.; Woolnough, D.A. A refuge for native freshwater mussels (Bivalvia: Unionidae) from impacts of the exotic zebra mussel (Dreissena polymorpha) in Lake St. Clair. J. Great Lakes Res. 2002, 28, 479–489. [Google Scholar] [CrossRef]
  50. Downing, J.A.; Van Meter, P.; Woolnough, D.A. Suspects and evidence: A review of the causes of extirpation and decline in freshwater mussels. Anim. Biodivers. Conserv. 2010, 33, 151–185. [Google Scholar]
  51. Walter, W.M. Mollusks of the upper Neuse River basin, North Carolina. J. Elisha Mitchell Sci. Soc. 1956, 72, 262–274. [Google Scholar]
  52. Hornbach, D.J.; Hove, M.C.; Liu, H.T.; Schenck, F.R.; Rubin, D.; Sansom, B.J. The influence of two differently sized dams on mussel assemblages and growth. Hydrobiologia 2014, 724, 279–291. [Google Scholar] [CrossRef]
  53. Tiemann, J.S.; Dodd, H.R.; Owens, N.; Wahl, D.H. Effects of lowhead dams on unionids in the Fox River, Illinois. Northeast. Nat. 2007, 14, 125–138. [Google Scholar] [CrossRef]
  54. Sethi, S.A.; Selle, A.R.; Doyle, M.W.; Stanley, E.H.; Kitchel, H.E. Response of unionid mussels to dam removal in Koshkonong Creek, Wisconsin (USA). Hydrobiologia 2004, 525, 157–165. [Google Scholar] [CrossRef]
  55. American Rivers. Comprehensive List of Dams Removed: 1999–2019. 2019. Available online: https://www.americanrivers.org/wp-content/uploads/2020/02/DamsRemoved_1999-2019.pdf (accessed on 31 January 2021).
  56. MDNR (Michigan Department of Natural Resources). Michigan Dam Removal Case Studies. 1999. Available online: https://www.michigan.gov/documents/dnr/damsuccess_513764_7.pdf (accessed on 1 February 2021).
  57. Metcalfe-Smith, J.L.; Di Maio, J.; Staton, S.K.; Mackie, G.L. Effect of sampling effort on the efficiency of the timed search method for sampling freshwater mussel communities. J. N. Am. Benthol. Soc. 2000, 19, 725–732. [Google Scholar] [CrossRef]
  58. Strayer, D.L.; Smith, D.R. A Guide to Sampling Freshwater Mussel Populations, 8th ed.; American Fisheries Society: Bethesda, MD, USA, 2003. [Google Scholar]
  59. Wolman, M.G. A method of sampling coarse river-bed material. EOS 1954, 35, 951–956. [Google Scholar]
  60. American Public Health Association; American Water Works Association; Water Pollution Control Federation; Water Environment Federation. Standard Methods for the Examination of Water and Wastewater; American Public Health Association: Washington, DC, USA, 1995. [Google Scholar]
  61. Shannon, C.E.; Weaver, W. A mathematical theory of communication. Bell. Syst. Tech. J. 1948, 27, 379–423, 623–656. [Google Scholar] [CrossRef] [Green Version]
  62. Jost, L. Entropy and diversity. Oikos 2006, 113, 363–375. [Google Scholar] [CrossRef]
  63. Caceres, M.; Legendre, P. Associations between species and groups of sites: Indices and statistical inference. Ecology 2009, 90, 3566–3574. [Google Scholar] [CrossRef]
  64. Legendre, P.; Legendre, L.F. Numerical Ecology; Elsevier: Amsterdam, The Netherlands, 2012. [Google Scholar]
  65. Oksanen, J.; Blanchet, F.G.; Kindt, R.; Legendre, P.; Minchin, P.R.; Ohara, R.B.; Simpson, G.L.; Solymos, P.; Stevens, M.H.; Wagner, H. Package ‘Vegan’; R Package: New York, NY, USA, 2015. [Google Scholar]
  66. Minchin, P.R. An evaluation of the relative robustness of techniques for ecological ordination. Plant Ecol. 1987, 69, 89–107. [Google Scholar] [CrossRef]
  67. Faith, D.P.; Minchin, P.R.; Belbin, L. Compositional dissimilarity as a robust measure of ecological distance. Vegetatio 1987, 69, 57–68. [Google Scholar] [CrossRef]
  68. R Core Team. R: A Language and Environment for Statistical Computing; R Foundation for Statistical Computing: Vienna, Austria, 2015. [Google Scholar]
  69. Dinno, A. Package ‘Dunn.test’; R Package: New York, NY, USA, 2015. [Google Scholar]
  70. Zar, J.H. Biostatistical Analysis; Pearson Education: Delhi, India, 1999. [Google Scholar]
  71. Peterman, R.M. Statistical power analysis can improve fisheries research and management. Can. J. Fish. Aquat. Sci. 1990, 47, 2–15. [Google Scholar] [CrossRef]
  72. Venables, W.N.; Ripley, B.D. Modern Applied Statistics with S; Springer: New York, NY, USA, 2002. [Google Scholar]
  73. Zuur, A.; Leno, E.N.; Walker, N.; Saveliev, A.A.; Smith, G.M. Mixed Effects Models and Extensions in Ecology with R; Springer: New York, NY, USA, 2009. [Google Scholar]
  74. Fox, J.; Weisberg, S. An R Companion to Applied Regression; Sage: Newbury Park, CA, USA, 2011. [Google Scholar]
  75. Myers, R.H. Classical and Modern Regression with Applications; Duxbury Press: Pacific Grove, CA, USA, 1990. [Google Scholar]
  76. Helms, B.S.; Feminella, J.W.; Pan, S. Detection of biotic responses to urbanization using fish assemblages from small streams of western Georgia, USA. Urban Ecosyst. 2005, 8, 39–57. [Google Scholar] [CrossRef]
  77. Anderson, D.R.; Burnham, K.P.; Thompson, W.L. Null hypothesis testing: Problems, prevalence, and an alternative. J. Wildl. Manag. 2000, 64, 912–923. [Google Scholar] [CrossRef]
  78. Burnham, K.P.; Anderson, D.R. Multimodel inference understanding AIC and BIC in model selection. Soc. Method. Res. 2004, 33, 261–304. [Google Scholar] [CrossRef]
  79. Symonds, M.R.; Moussalli, A. A brief guide to model selection, multimodel inference and model averaging in behavioural ecology using Akaike’s information criterion. Behav. Ecol. Sociobiol. 2011, 65, 13–21. [Google Scholar] [CrossRef]
  80. Strayer, D.L.; Ralley, J. Microhabitat use by an assemblage of stream-dwelling unionaceans (Bivalvia), including two rare species of Alasmidonta. J. N. Am. Benthol. Soc. 1993, 12, 247–258. [Google Scholar] [CrossRef]
  81. Strayer, D.L. Macrohabitats of freshwater mussels (Bivalvia: Unionacea) in streams of the northern Atlantic Slope. J. N. Am. Benthol. Soc. 1993, 12, 236–246. [Google Scholar] [CrossRef]
  82. Layzer, J.B.; Madison, L.M. Microhabitat use by freshwater mussels and recommendations for determining their instream flow needs. Regul. River. 1995, 10, 329–345. [Google Scholar] [CrossRef]
  83. Haag, W.R.; Warren, M.L., Jr. Role of ecological factors and reproductive strategies in structuring freshwater mussel communities. Can. J. Fish. Aquat. Sci. 1998, 55, 297–306. [Google Scholar] [CrossRef]
  84. McRae, S.E.; Allan, J.D.; Burch, J.B. Reach-and catchment-scale determinants of the distribution of freshwater mussels (Bivalvia: Unionidae) in south-eastern Michigan, USA. Freshw. Biol. 2004, 49, 127–142. [Google Scholar] [CrossRef] [Green Version]
  85. Strayer, D.L. Freshwater Mussel Ecology: A Multifactor Approach to Distribution and Abundance, 1st ed.; University of California Press: Oakland, CA, USA, 2008. [Google Scholar]
  86. Petts, G.E. Impounded Rivers: Perspectives for Ecological Management; John Wiley and Sons: Hoboken, NJ, USA, 1985. [Google Scholar]
  87. Lessard, J.L.; Hayes, D.B. Effects of elevated water temperature on fish and macroinvertebrate communities below small dams. River Res. Appl. 2003, 19, 721–732. [Google Scholar] [CrossRef]
  88. Merkley, W.B. Impact of red rock reservoir on the Des Moines River. In Current Perspective on River-Reservoir Ecosystems; Cairns, J., Benefield, E.F., Webster, J.R., Eds.; North American Benthological Society: Havana, IL, USA, 1978; pp. 62–76. [Google Scholar]
  89. Tiemann, J.S.; Douglass, S.A.; Stodola, A.P.; Cummings, K.C. Effects of lowhead dams on freshwater mussels in the Vermilion River Basin, Illinois, with comments on a natural dam removal. Trans. Ill. State Acad. Sci. 2016, 109, 1–7. [Google Scholar]
  90. Augspurger, T.; Keller, A.E.; Black, M.C.; Cope, W.G.; Dwyer, F.J. Water quality guidance for protection of freshwater mussels (Unionidae) from ammonia exposure. Environ. Toxicol. Chem. 2003, 22, 2569–2575. [Google Scholar] [CrossRef]
  91. Mummert, A.K.; Neves, R.J.; Newcomb, T.J.; Cherry, D.S. Sensitivity of juvenile freshwater mussels (Lampsilis fasciola, Villosa iris) to total and un-ionized ammonia. Environ. Toxicol. Chem. 2003, 22, 2545–2553. [Google Scholar] [CrossRef]
  92. Newton, T.J.; Allran, J.W.; O’Donnell, J.A.; Bartsch, M.R.; Richardson, W.B. Effects of ammonia on juvenile unionid mussels (Lampsilis cardium) in laboratory sediment toxicity tests. Environ. Toxicol. Chem. 2003, 22, 2554–2560. [Google Scholar] [CrossRef] [PubMed]
  93. Williams, J.D.; Wolman, M.G. Downstream Effects of Dams on Alluvial Rivers; Geological Survey Paper 1286, United States Government Printing Office: Washington, DC, USA, 1984. [Google Scholar]
  94. Vaughn, C.C.; Taylor, C. Impoundments and the decline of freshwater mussels: A case study of an extinction gradient. Con Biol. 1999, 13, 912–920. [Google Scholar] [CrossRef]
  95. Ligon, F.K.; Dietrich, W.E.; Trush, W.J. Downstream ecological effects of dams. BioScience 1995, 45, 183–192. [Google Scholar] [CrossRef]
  96. Burroughs, B.A.; Hayes, D.B.; Klomp, K.D.; Hansen, J.F.; Mistak, J. Effects of Strobach Dam removal on fluvial geomorphology in the Pine River, Michigan, United States. Geomorphology 2009, 110, 96–107. [Google Scholar] [CrossRef]
  97. Simons, R.K.; Simons, D.B. Sediment problems associated with dam removal, Muskegon River, Michigan; Hydraulic Engineering. In Proceedings of the 1991 National Conference of the American Society of Civil Engineers, Nashville, TN, USA, 29 July–2 August 1991; American Society of Civil Engineers: New York, NY, USA, 1991; pp. 680–685. [Google Scholar]
  98. McLaughlin, R.L.; Smyth, E.R.; Castro-Santos, T.; Jones, M.L.; Koops, M.A.; Pratt, T.C.; Vélez-Espino, L.A. Unintended consequences and trade-offs of fish passage. Fish Fish. 2013, 14, 580–604. [Google Scholar] [CrossRef]
  99. Jackson, C.R.; Pringle, C.M. Ecological benefits of reduced hydrologic connectivity in intensively developed landscapes. Bioscience 2010, 60, 37–46. [Google Scholar] [CrossRef] [Green Version]
  100. Nalepa, T.F.; Schloesser, D.W. (Eds.) Quagga and Zebra Mussels: Biology, Impacts, and Control, 2nd ed.; CRC Press: New York, NY, USA, 2014. [Google Scholar]
  101. Wang, N.; Ingersoll, C.G.; Greer, I.E.; Hardesty, D.K.; Ivey, C.D.; Kunz, J.L.; Barnhart, M.C. Chronic toxicity of copper and ammonia to juvenile freshwater mussels (Unionidae). Environ. Toxicol. Chem. 2007, 26, 2048–2056. [Google Scholar] [CrossRef] [Green Version]
  102. Wang, N.; Consbrock, R.A.; Ingersoll, C.G.; Barnhart, M.C. Evaluation of influence of sediment on the sensitivity of a unionid mussel (Lampsilis siliquoidea) to ammonia in 28-day water exposures. Environ. Toxicol. Chem. 2011, 30, 2270–2276. [Google Scholar] [CrossRef]
  103. USEPA (United States Environmental Protection Agency). United States EPA Aquatic Life Water Quality Criteria for Ammonia-Freshwater 2013; EPA Report 822-R-13-001; US Environmental Protection Agency: Washington, DC, USA, 2013.
  104. Woolnough, D.A.; Bellamy, A.; Longstaff Hummel, S.; Annis, M. Environmental exposure of freshwater mussels to contaminants of emerging concern: Implications for species conservation. J. Great Lakes Res. 2020, 46, 1625–1638. [Google Scholar] [CrossRef]
  105. Evans, J.E.; Mackey, S.D.; Gottgens, J.F.; Gill, W.M. Lessons from a dam failure. Ohio J. Sci. 2000, 100, 121–131. [Google Scholar]
  106. Wang, J.; Ding, L.; Tao, J.; Ding, C.; He, D. The effects of dams on macroinvertebrates: Global trends and insights. River Res. Appl. 2019, 35, 702–713. [Google Scholar]
  107. Boon, P.J. The impact of river regulation on invertebrate communities in the U.K. River Res. Appl. 1998, 2, 389–409. [Google Scholar] [CrossRef]
  108. Barbarossa, V.; Schmitt, R.J.P.; Huijbregts, M.A.J.; Zarfl, C.; King, H.; Schipper, A.M. Impacts of current and future large dams on the geographic range connectivity of freshwater fish worldwide. PNAS 2020, 117, 3648–3655. [Google Scholar] [CrossRef] [Green Version]
  109. Sietman, B.E.; Whitney, S.D.; Kelner, D.E.; Douglas Blodgett, K.; Dunn, H.E. Post-extirpation recovery of the freshwater mussel (Bivalvia: Unionidae) fauna in the Upper Illinois River. J. Freshw. Ecol. 2001, 16, 273–281. [Google Scholar] [CrossRef] [Green Version]
  110. Morley, S.A.; Foley, M.M.; Duda, J.J.; Beirne, M.M.; Paradis, R.L.; Johnson, R.C.; McHenry, M.L.; Elofson, M.; Sampson, E.M.; McCoy, R.E.; et al. Shifting food web structure during dam removal—Disturbance and recovery during a major restoration action. PLoS ONE 2020, 15, e0239198. [Google Scholar] [CrossRef]
Figure 1. Study area and sampling locations of fifteen sites in the Lake Michigan basin, Michigan, USA. Site codes are listed by anthropogenic barrier-river-upstream/downstream most location. Anthropogenic barriers are D (uncontrolled), H (controlled), and R (removal). Rivers are G (Grand River), B (Battle Creek), M (Maple River), R (Rice Creek), C (Red Cedar River), F (Flat River), and K (Kalamazoo River). River locations are 1 (upstream most site) and 2 (downstream most site).
Diversity 13 00119 g001
Figure 2. Standardized sampling design downstream of anthropogenic barriers. Semi-quantitative timed-searches were performed between transects (n = 4 per site; A–D; 1-person hour for every 2500 m2). Quantitative sampling consisted of quadrats (n = 10; 0.50 m × 0.50 m) randomly distributed along each transect (n = 5 per site; 1–5).
Diversity 13 00119 g002
Figure 3. Non-Metric Multidimensional Scaling (NMDS) ordination of study sites in mussel species space. Symbols are timed-searches performed at barriers and taxon scores are presented by taxon abbreviations (First letter of genus and three letters of species; see Table 1). Blue = uncontrolled dams, Red = controlled dams, Green = dam removals. Ellipses represent 95% confidence intervals around the centroid of each data cluster.
Diversity 13 00119 g003
Figure 4. Mussel assemblage metrics downstream of three anthropogenic barriers in the Lake Michigan basin, Michigan, USA. (A) Median species richness, (B) median Shannon’s diversity, and (C) median CPUE. Kruskal–Wallis tests were used among barriers. Error bars represent the 25th and 75th quartiles. Letters above bars indicate statistical significance with Dunn’s Test.
Diversity 13 00119 g004
Figure 5. Linear regression of mussel species richness by number of years since dam removal in the Lake Michigan basin, Michigan, USA.
Diversity 13 00119 g005
Figure 6. Mussel species richness (AC) and densities (DF) along a downstream gradient from anthropogenic barriers in the Lake Michigan basin, Michigan, USA. (A,D) = uncontrolled dams; (B,E) = controlled dams; (C,F) = dam removals. Kruskal–Wallis tests were performed independently within each subfigure and are indicated by letters above bars. Horizontal line median, box 25th and 75th quartiles, whiskers the highest and lowest values, excluding outliers, circles indicate outliers. Letters above box plots indicate statistical significance with Dunn’s Test.
Diversity 13 00119 g006
Table 1. Mussel assemblage metrics collected within timed-searches and quadrats downstream of fifteen sites in the Lake Michigan basin, Michigan, USA. State mussel status is E = endangered, T = threatened, SC = special concern. Federal mussel status is F = endangered. Life-history strategy (L) is E = Equilibrium, P = Periodic, O = Opportunistic [14].
Mussel TaxaLDG1DG2DB1DM1DC1 HG1HG2HB1HF1HK1RG1 RB1RB2RR1RC1
Actinonaias ligamentinaE111422 2 64
Alasmidonta marginata (SC)P 73104 52
Alasmidonta viridis (T)P 14
Amblema plicataE 43 51
Cambarunio iris (SC)P 8 12 7
Cyclonaias pustulosaE 5 70
Eurynia dilatataP 16011211 14429223225943
Epioblasma triquetra (F)P 23 6
Fusconaia flavaE 3867916 176242 6121
Lampsilis cardiumP 298512315 472513 5216
Lampsilis siliquoideaP 11144131 10 19
Lasmigona complanataO 264 4 2
Lasmigona costataP12257945 153391 1 25
Ligumia recta (E)P 2 6
Ptychobranchus fasciolaris (SC)E 12
Pyganodon grandisO31 54 1 1 45
Quadrula quadrulaE 101
Strophitus undulatusP 10633 31091 23
Utterbackia imbecillis (SC)O 2
Venustaconcha ellipsiformis (SC)P 22243 21542 158
Total Species Richness 31411151110977626410
Total Mussels 5139785523366102272657911480291171
Mean CPUE 0.410.361.939.537.3NANA17.520.26.31.50.320.03.774.3
Mean Shannon’s Diversity (EXP(H’)) 2.597.455.678.944.41NANA3.775.573.353.331.002.381.782.60
* see footnote * *** * ****
* Due to depth (>1 m) and high flow, quadrats were not completed for DG2 along transect 3 (n = 2) and 4 (n = 4). Due to depth, quadrats along transect 3 (n = 10) at DC1 and along transect 5 (n = 10) at RG1 were not completed. No timed-searches (TS) were completed at HG1 and HG2 because of depths. Additional timed-searches were not completed at DC1 (TS 3); RG1 (TS 3, 4); RB2 (TS 1, 2) because of depths. ** RR1 only included the first 3 transects and 2 timed-searches before entering the Kalamazoo River.
Table 2. Akaike Information Criterion (AIC) model selection results for mussel presence, species richness, and density models. All models with ∆AIC < 2 were included, as well as the null model. ∆AIC = the difference between the AIC of the best fitting model and the model of comparison. wm = model weights (normalized relative likelihood values). B = parameter coefficients that describe the effect of the independent variable on the response variable. Microhabitat parameters are silt/clay (SC), sand (SA), gravel (GR), cobble (CO), boulder (BO), bedrock (BE), depth (DEP), total total suspended solids (TSS). Benthic velocity and growing degree days were included in model selection but were not considered important in the AIC analyses (see Methods).
Response VariableParameters in Model (B)
SCSAGRCOBOBEDEPTSSAICAICwm
Presence−1.236 0.179 −0.684 0.359590.60.0000.242
−1.214 0.206 0.364591.50.9000.154
−1.171 0.172 −0.7040.0070.371591.71.1000.140
−1.1360.1370.239 −0.625 0.363591.71.1000.140
−1.0870.1800.280 0.369592.01.4000.120
−1.272 0.149−0.113 −0.715 0.358592.11.5000.114
−1.241 0.175 −0.133−0.692 0.360592.62.0000.089
628.237.6000.000
Richness−0.683 0.111 −0.543 0.205530.00.0000.264
−0.707 0.093−0.073 −0.563 0.205530.10.1000.251
−0.6430.0690.143 −0.512 0.207531.21.2000.145
−0.670 0.125 0.208531.51.5000.125
−0.679 0.115 0.119−0.538 0.204531.61.6000.119
−0.687 0.111 −0.5420.0000.204532.02.0000.097
560.530.5000.000
Density−0.725 0.1200.114 −0.625 0.261754.80.0000.317
−0.752 0.1210.112 −0.616−0.0030.257756.21.4000.158
−0.868−0.133 −0.740 0.259756.31.5000.150
−0.753−0.0340.0980.096 −0.648 0.260756.61.8000.129
−0.728 0.1180.108−0.049−0.629 0.261756.61.8000.129
−0.869−0.132 −0.136−0.746 0.259756.82.0000.117
804.90.0000.000
Publisher’s Note: MDPI stays neutral with regard to jurisdictional claims in published maps and institutional affiliations.

