
Testing a Local Inbreeding Hypothesis as a Cause of Observed Antler Characteristics in Managed Populations of White-Tailed Deer

 ,
, 
Abstract
:1. Introduction
2. Materials and Methods
2.1. Study Area
2.2. Sample Collection
2.3. DNA Isolation and Extraction
2.4. DNA Amplification and Separation
2.5. Data Analysis
2.6. Statistical Analysis
3. Results
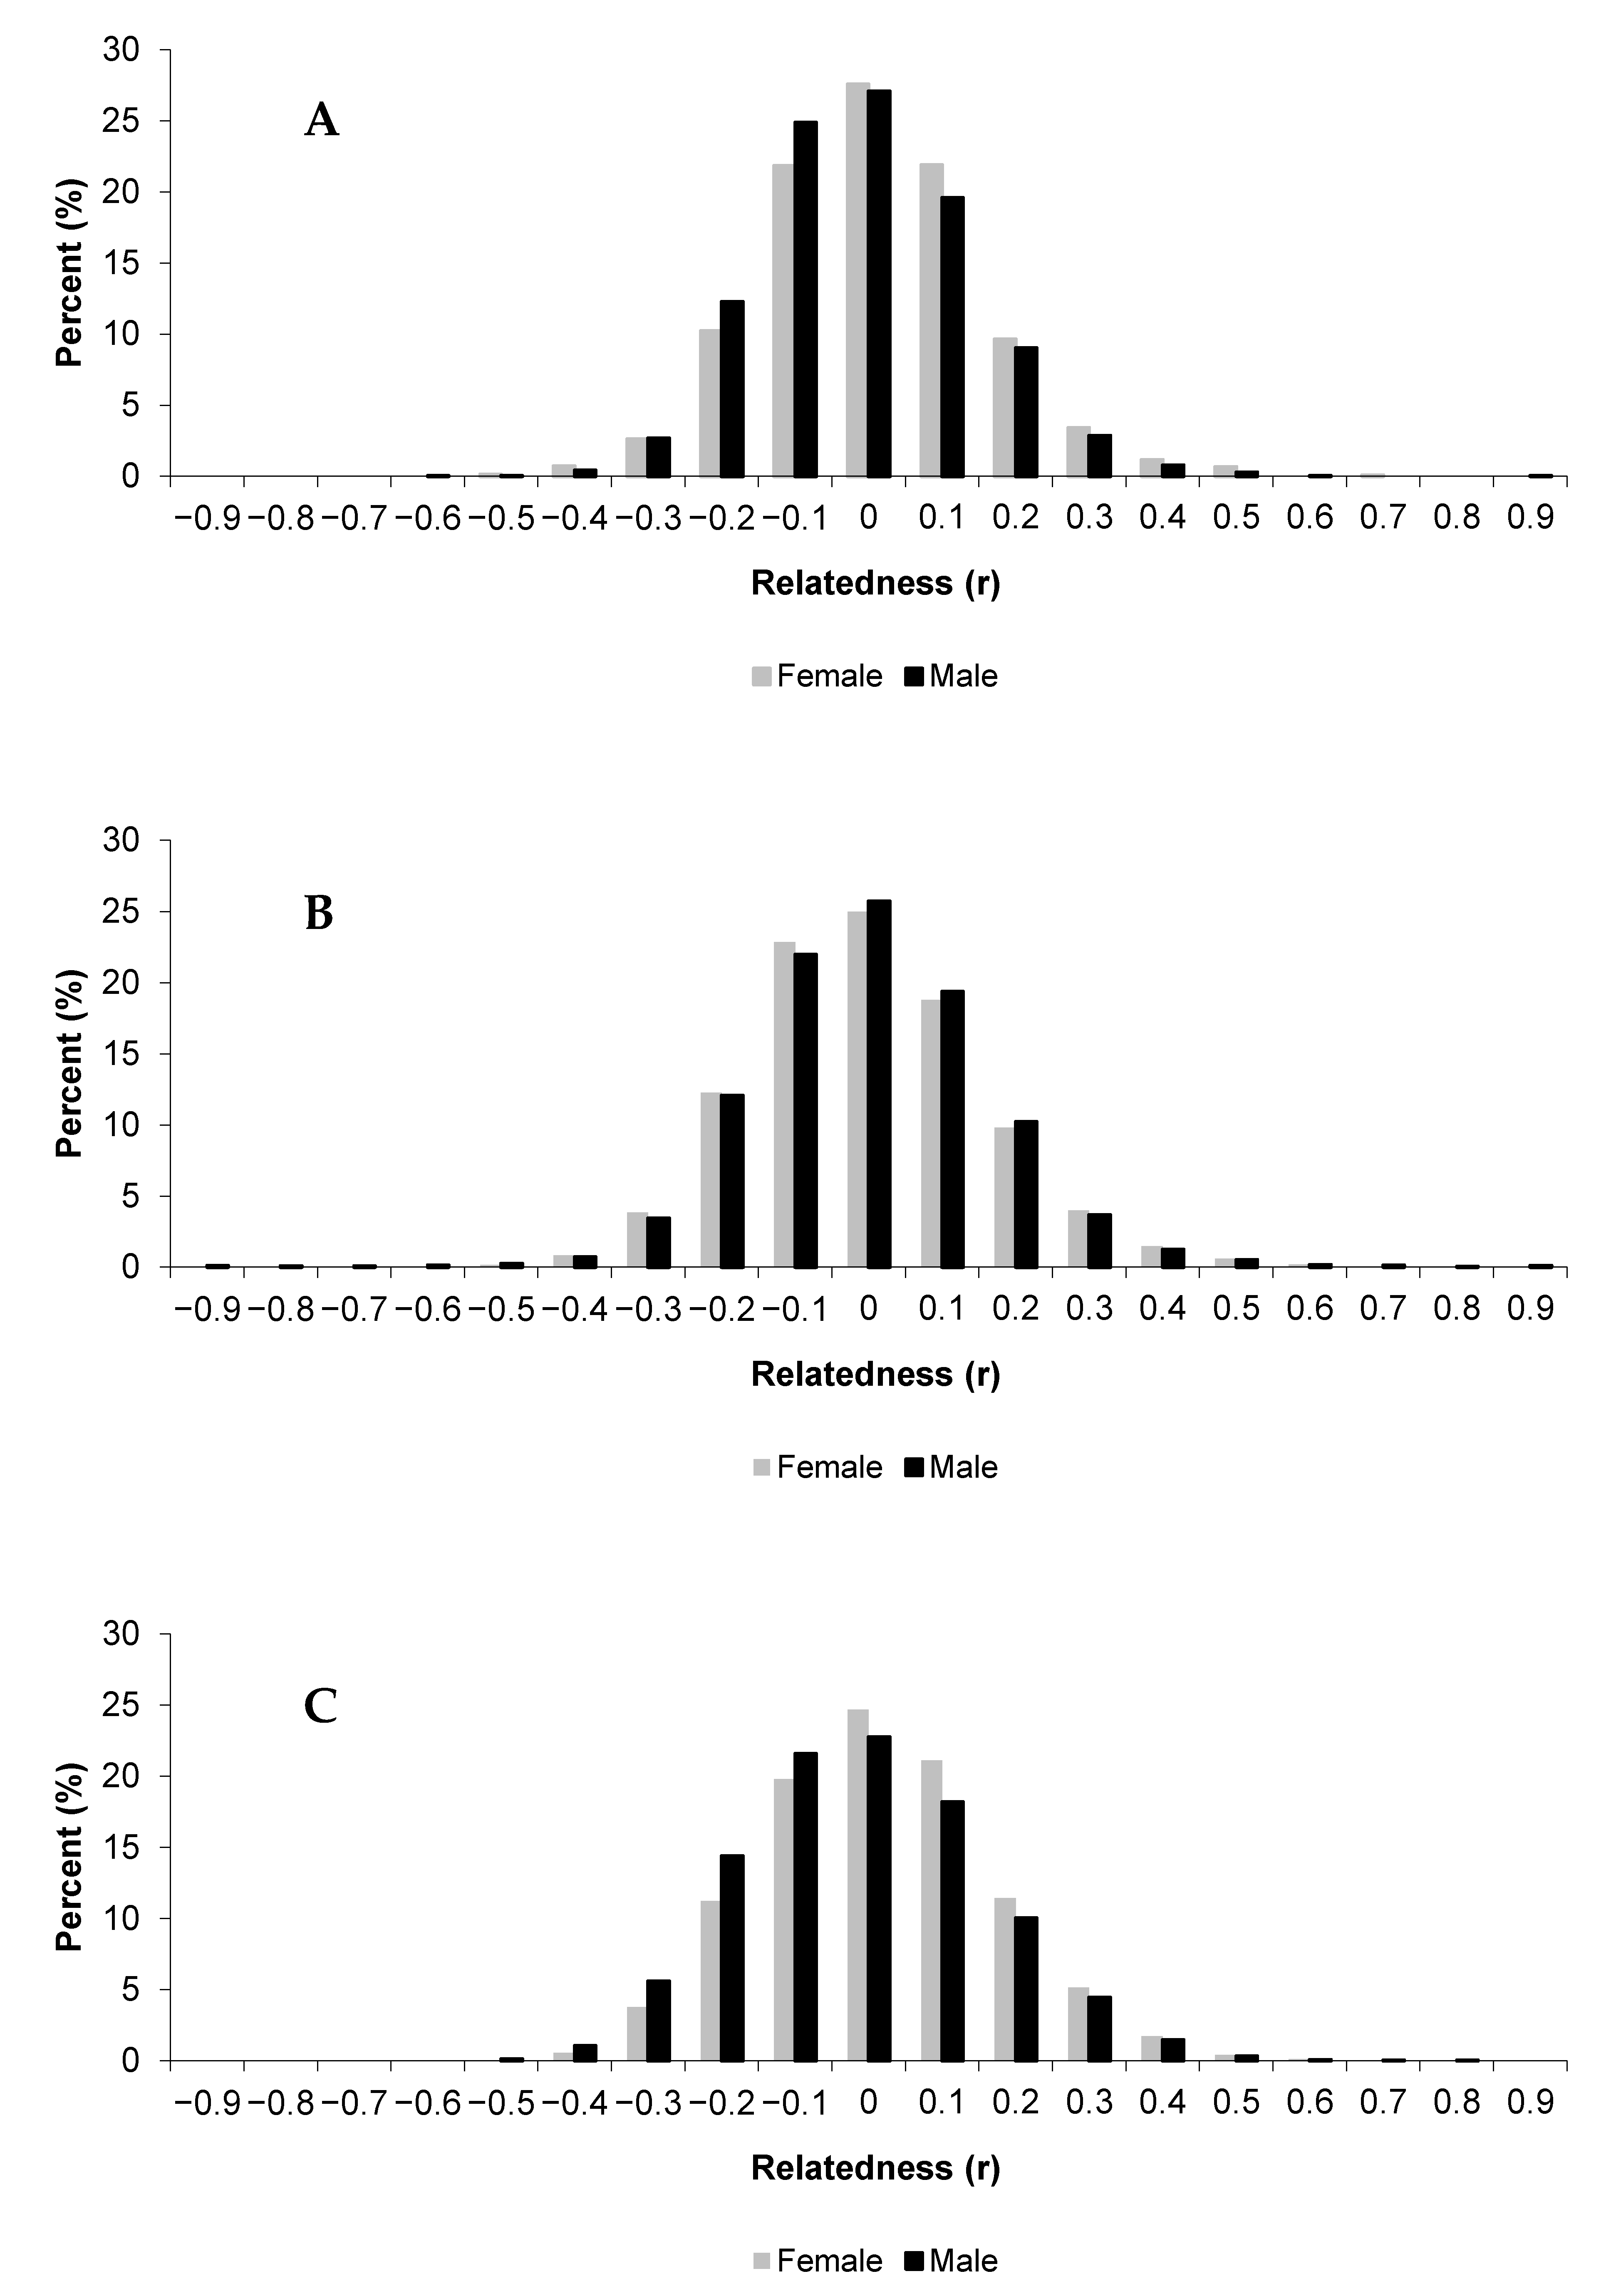
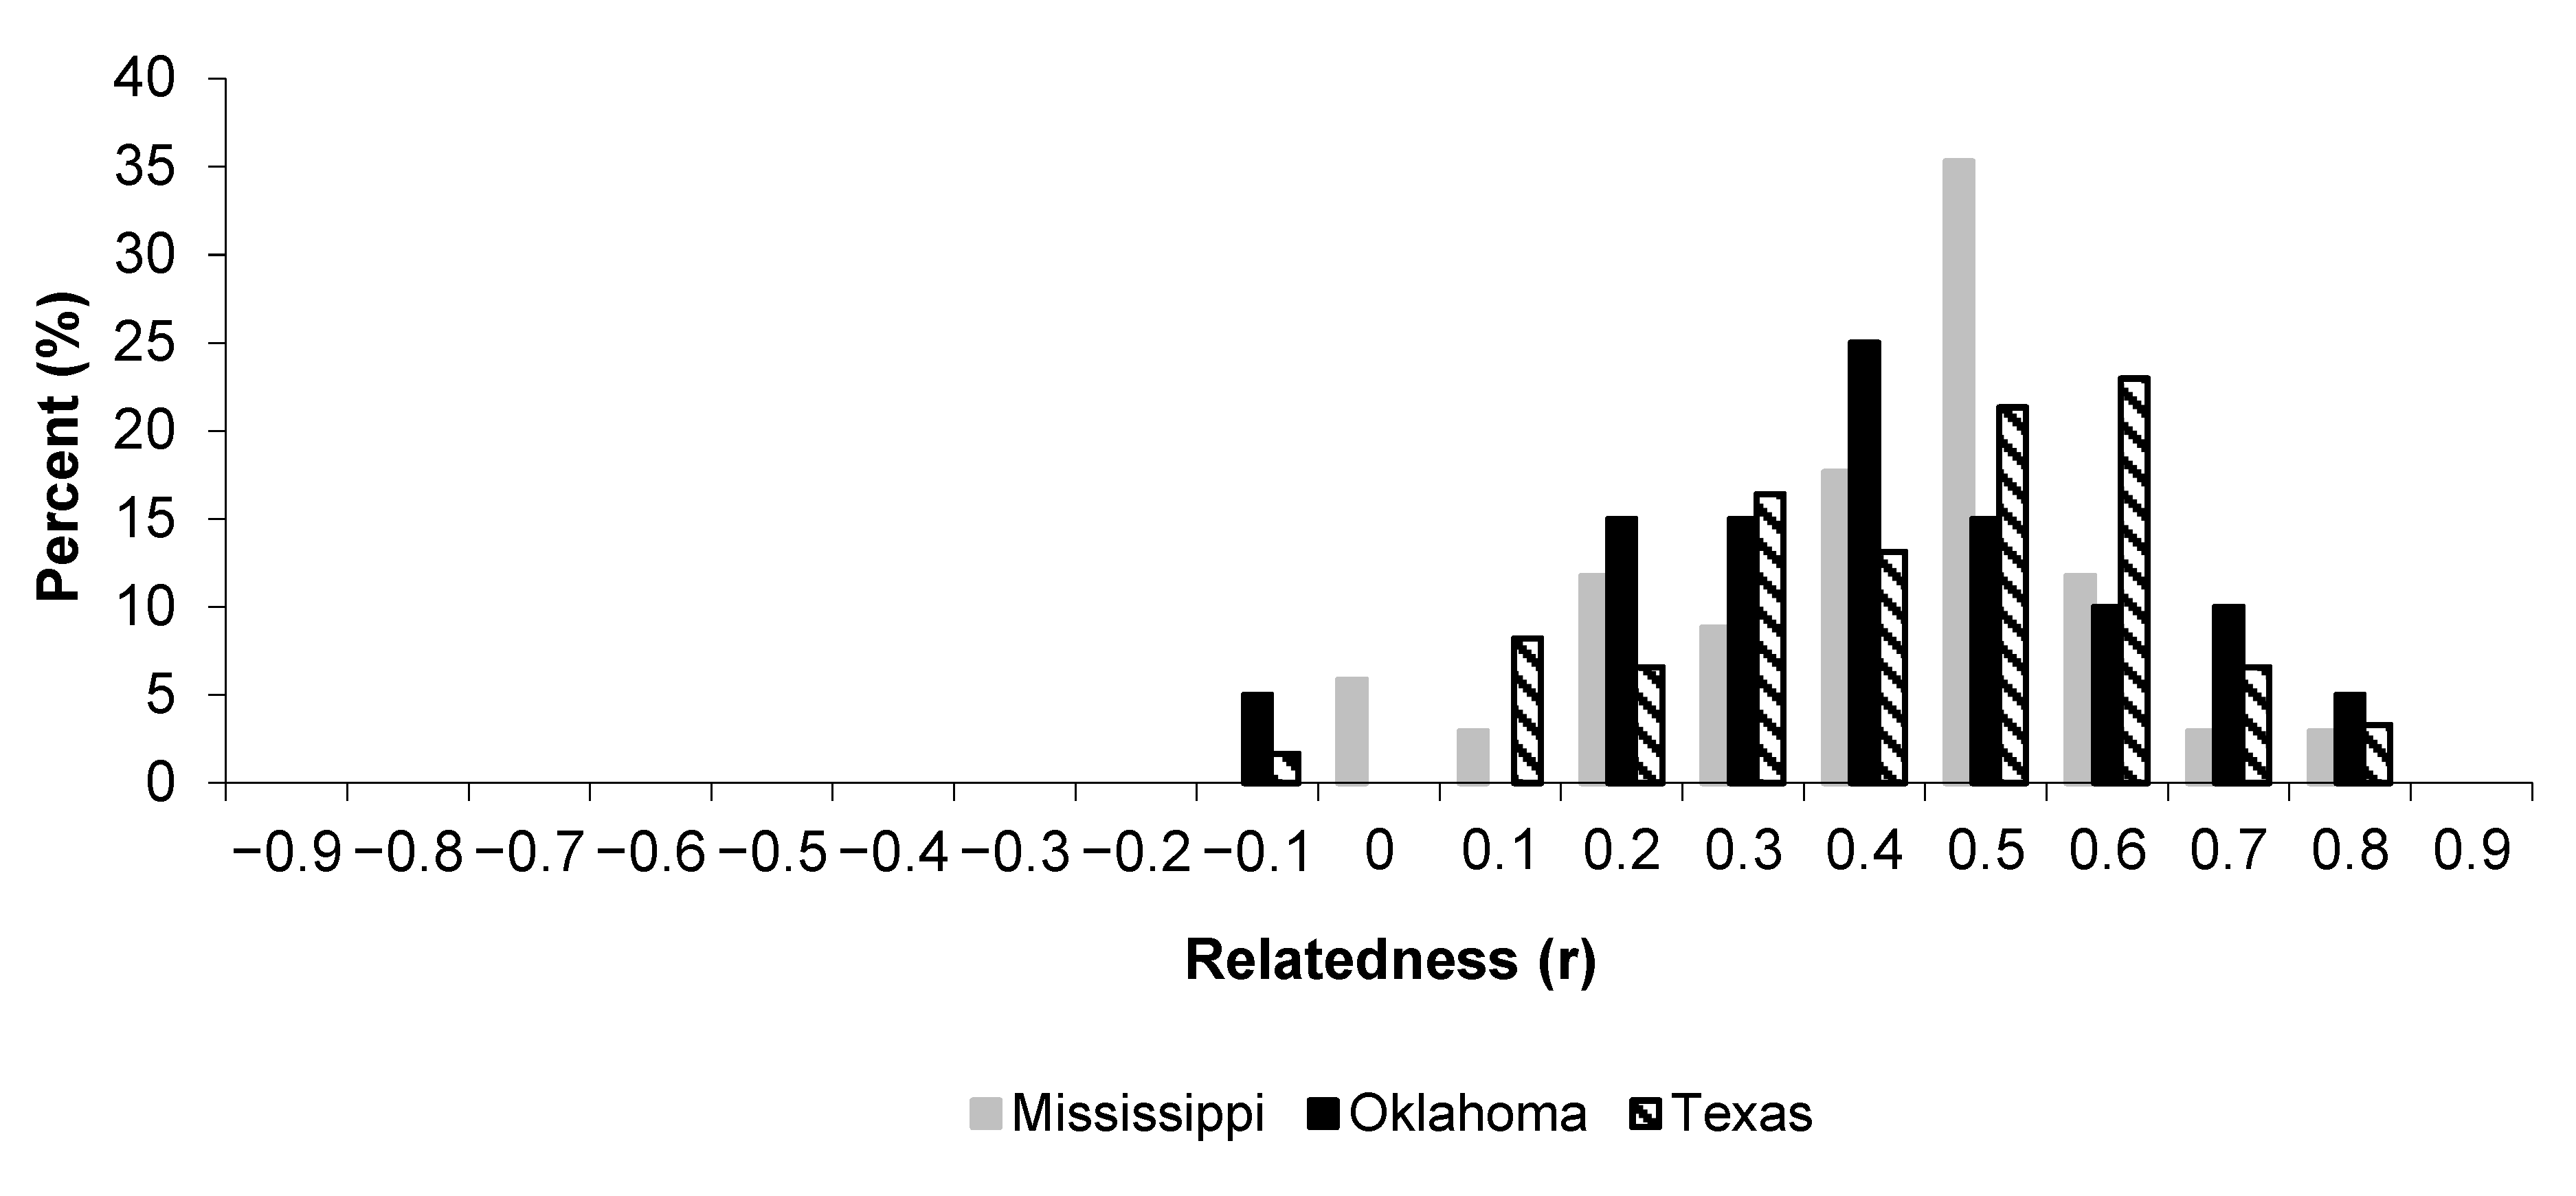
3.1. Relatedness
3.2. Internal Relatedness
3.3. Homozygosity Weighted by Locus
3.4. F-statistics
4. Discussion
5. Conclusions
Author Contributions
Funding
Institutional Review Board Statement
Informed Consent Statement
Data Availability Statement
Acknowledgments
Conflicts of Interest
Appendix A

| Relatedness | Internal Relatedness | Homozygosity | Fis | |||||
|---|---|---|---|---|---|---|---|---|
| Study Area | Age | Trait | Class | N | Mean (95% CI) | Mean (95% CI) | Mean (95% CI) | Mean (95% CI) |
| Mississippi | 1 | Score | Lower | 10 | −0.013 (−0.098, 0.072) | 0.064 (−0.03, 0.158) | 0.299 (0.224, 0.374) | 0.062 (−0.056, 0.18) |
| Upper | 11 | −0.055 (−0.087, −0.022) | 0.059 (−0.027, 0.145) | 0.286 (0.214, 0.358) | 0.073 (−0.043, 0.189) | |||
| Point | Lower | 22 | −0.022 (−0.050, 0.006) | 0.02 (−0.07, 0.111) | 0.25 (0.182, 0.319) | 0.034 (−0.041, 0.109) | ||
| Upper | 11 | −0.04 (−0.077, −0.002) | 0.069 (−0.025, 0.164) | 0.288 (0.209, 0.366) | 0.068 (−0.023, 0.159) | |||
| 2 | Score | Lower | 8 | −0.048 (−0.106, 0.010) | 0.031 (−0.104, 0.166) | 0.27 (0.165, 0.376) | 0.054 (−0.071, 0.17) | |
| Upper | 9 | −0.063 (−0.101, −0.025) | 0.105 (0.014, 0.196) | 0.303 (0.219, 0.386) | 0.115 (−0.003, 0.233) | |||
| Point | Lower | 6 | −0.038 (−0.098, 0.021) | 0.099 (−0.066, 0.264) | 0.308 (0.157, 0.458) | 0.103 (−0.08, 0.286) | ||
| Upper | 12 | −0.054 (−0.095, −0.013) | 0.016 (−0.046, 0.078) | 0.23 (0.186, 0.274) | 0.024 (−0.046, 0.094) | |||
| 3 | Score | Lower | 8 | −0.04 (−0.086, 0.007) | 0.014 (−0.116, 0.145) | 0.249 (0.143, 0.355) | 0.025 (−0.072, 0.122) | |
| Upper | 8 | 0.001 (−0.110, 0.113) | 0.017 (−0.109, 0.144) | 0.259 (0.164, 0.354) | 0.02 (−0.103, 0.143) | |||
| Point | Lower | 12 | −0.04 (−0.118, 0.038) | 0.026 (−0.066, 0.118) | 0.266 (0.195, 0.337) | 0.04 (−0.028, 0.108) | ||
| Upper | 13 | −0.047 (−0.071, −0.023) | 0.007 (−0.092, 0.106) | 0.242 (0.168, 0.315) | 0.02 (−0.072, 0.112) | |||
| Oklahoma | 1 | Score | Lower | 15 | −0.007 (−0.033, 0.019) | 0.106 (0.023, 0.189) | 0.341 (0.276, 0.407) | 0.102 (−0.02, 0.224) |
| Upper | 15 | −0.027 (−0.070, 0.017) | 0.01 (−0.083, 0.103) | 0.256 (0.188, 0.324) | 0.023 (−0.043, 0.089) | |||
| Point | Lower | 19 | −0.006 (−0.036, 0.024) | 0.112 (0.042, 0.182) | 0.349 (0.29, 0.409) | 0.113 (0.014, 0.212) | ||
| 1 | Point | Upper | 15 | −0.013 (−0.048, 0.021) | 0.022 (−0.076, 0.12) | 0.263 (0.194, 0.331) | 0.019 (−0.078, 0.116) | |
| 2 | Score | Lower | 11 | −0.068 (−0.115, −0.020) | 0.059 (−0.031, 0.149) | 0.315 (0.248, 0.382) | 0.071 (−0.076, 0.218) | |
| Upper | 12 | −0.003 (−0.056, 0.050) | 0.032 (−0.076, 0.141) | 0.274 (0.186, 0.361) | 0.029 (−0.061, 0.119) | |||
| Point | Lower | 15 | −0.048 (−0.074, −0.022) | 0.122 (0.052, 0.192) | 0.345 (0.299, 0.392) | 0.129 (0.024, 0.234) | ||
| Upper | 17 | −0.03 (−0.063, 0.011) | 0.019 (−0.065, 0.104) | 0.262 (0.193, 0.331) | 0.034 (−0.038, 0.106) | |||
| 3 | Score | Lower | 8 | −0.027 (−0.067, 0.012) | 0.069 (−0.047, 0.184) | 0.311 (0.229, 0.392) | 0.073 (−0.045, 0.191) | |
| Upper | 8 | −0.04 (−0.096, 0.015) | 0.027 (−0.107, 0.161) | 0.271 (0.159, 0.382) | 0.042 (−0.072, 0.156) | |||
| Point | Lower | 16 | −0.03 (−0.058, −0.003) | 0.057 (−0.007, 0.12) | 0.304 (0.253, 0.355) | 0.064 (−0.015, 0.143) | ||
| Upper | 10 | −0.045 (−0.084, −0.005) | 0.057 (−0.056, 0.17) | 0.296 (0.198, 0.393) | 0.067 (−0.057, 0.191) | |||
| N/A | NT 1 | Absent | 81 | −0.01 (−0.028, 0.009) | 0.08 (0.048, 0.112) | 0.31 (0.286, 0.334) | 0.086 (0.034, 0.138) | |
| Present | 19 | 0.006 (−0.035, 0.047) | 0.083 (0.009, 0.156) | 0.308 (0.245, 0.37) | 0.072 (0.011, 0.133) | |||
| Abn 2 | Yes | 7 | −0.025 (−0.111, 0.060) | 0.119 (0.029, 0.209) | 0.329 (0.251, 0.406) | 0.13 (−0.009, 0.269) | ||
| No | 109 | −0.007 (−0.018, 0.004) | 0.065 (0.037, 0.093) | 0.298 (0.276, 0.319) | 0.068 (0.02, 0.116) | |||
| Texas | 1 | Score | Lower | 12 | −0.005 (−0.059, 0.049) | 0.113 (0.014, 0.212) | 0.327 (0.253, 0.401) | 0.14 (0.021, 0.259) |
| Upper | 12 | −0.035 (−0.091, 0.020) | 0.003 (−0.085, 0.091) | 0.232 (0.173, 0.292) | 0.06 (−0.041, 0.161) | |||
| Point | Lower | 13 | −0.015 (−0.061, 0.031) | 0.073 (−0.029, 0.174) | 0.297 (0.218, 0.376) | 0.106 (−0.001, 0.213) | ||
| Upper | 12 | −0.029 (−0.092, 0.035) | 0.016 (−0.065, 0.098) | 0.248 (0.191, 0.304) | 0.056 (−0.072, 0.184) | |||
| 2 | Score | Lower | 15 | 0.011 (−0.046, 0.067) | 0.11 (0.026, 0.195) | 0.32 (0.252, 0.387) | 0.128 (−0.003, 0.259) | |
| Upper | 15 | −0.039 (−0.064, −0.014) | 0.117 (0.047, 0.186) | 0.3 (0.251, 0.349) | 0.142 (0.022, 0.262) | |||
| Point | Lower | 13 | −0.01 (−0.050, 0.029) | 0.131 (0.043, 0.218) | 0.334 (0.269, 0.399) | 0.156 (0.01, 0.302) | ||
| Upper | 11 | −0.061 (−0.095, −0.027) | 0.045 (−0.044, 0.134) | 0.247 (0.184, 0.309) | 0.04 (−0.071, 0.151) | |||
| 3 | Score | Lower | 9 | −0.027 (−0.123, 0.069) | 0.049 (−0.084, 0.183) | 0.261 (0.168, 0.354) | 0.064 (−0.049, 0.177) | |
| Upper | 9 | −0.005 (−0.098, 0.088) | 0.06 (−0.093, 0.214) | 0.283 (0.179, 0.387) | 0.099 (−0.03, 0.228) | |||
| Point | Lower | 4 | −0.105 (−0.243, 0.034) | 0.083 (−0.045, 0.211) | 0.279 (0.141, 0.417) | 0.117 (−0.144, 0.378) | ||
| Upper | 10 | 0.004 (−0.077, 0.085) | 0.098 (−0.01, 0.206) | 0.3 (0.228, 0.372) | 0.099 (−0.034, 0.232) | |||
| N/A | NT 1 | Absent | 134 | −0.013 (−0.025, −0.001) | 0.077 (0.049, 0.105) | 0.287 (0.266, 0.307) | 0.093 (0.032, 0.154) | |
| Present | 22 | 0.019 (−0.021, 0.059) | 0.111 (0.058, 0.164) | 0.311 (0.272, 0.351) | 0.099 (0.009, 0.189) | |||
| N/A | Abn 2 | Yes | 5 | −0.063 (−0.138, 0.011) | 0.101 (−0.068, 0.279) | 0.3 (0.163, 0.437) | 0.204 (−0.06, 0.468) | |
| No | 239 | −0.008 (−0.016, 0.000) | 0.082 (0.062, 0.102) | 0.29 (0.276, 0.305) | 0.094 (0.039, 0.149) |


References
- Demarais, S.; Strickland, B.K.; Castle, L.E. Antler regulation effects on white-tailed deer on Mississippi public hunting areas. Proc. Southeast. Assoc. Fish Wildl. Agen. 2005, 59, 1–9. [Google Scholar]
- Jacobson, H.A. Age and quality relationships. In Quality Whitetails: The Why and How of Quality Deer Management; Miller, K.V., Marchinton, R.L., Eds.; Stackpole Books: Mechanicsburg, PA, USA, 1995; pp. 103–111. [Google Scholar]
- Lukefahr, S.D.; Jacobson, H.A. Variance component analysis and heritability of antler traits in white-tailed deer. J. Wildl. Manag. 1998, 62, 262–268. [Google Scholar] [CrossRef]
- Strickland, B.K.; Demarais, S. Age and regional differences in antlers and mass of white-tailed deer. J. Wildl. Manag. 2000, 64, 903–911. [Google Scholar] [CrossRef]
- Coltman, D.W.; O’Donoghue, P.; Jorgenson, J.T.; Hogg, J.T.; Strobeck, C.; Festa-Bianchet, M. Undesirable evolutionary consequences of trophy hunting. Nature 2003, 26, 655–658. [Google Scholar] [CrossRef] [PubMed]
- Harris, R.B.; Wall, W.A.; Allendorf, F.W. Genetic consequences of hunting: What do we know and what should we do? Wildl. Soc. Bull. 2002, 30, 634–643. [Google Scholar]
- Guynn, D.C., Jr.; Mott, S.P.; Cotton, W.D.; Jacobson, H.A. Cooperative management of white-tailed deer on private lands in Mississippi. Wildl. Soc. Bull. 1983, 11, 211–214. [Google Scholar]
- Strickland, B.K. (Mississippi State University, Mississippi State, MS, USA). Personal communication, 2009. [Google Scholar]
- Falconer, D.S.; Mackay, T.F.C. Introduction to Quantitative Genetics, 4th ed.; Longman Group Ltd.: Essex, UK, 1996. [Google Scholar]
- Coltman, D.W.; Bowen, W.D.; Wright, J.M. Birth weight and neonatal survival of harbour seal pups are positively correlated with genetic variation measured by microsatellites. Proc. R. Soc. Lond. B 1998, 265, 803–809. [Google Scholar] [CrossRef] [PubMed] [Green Version]
- Coulson, T.N.; Pemberton, J.M.; Albon, S.D.; Beaumont, M.; Marshall, T.C.; Slate, J.; Guinness, F.E.; Clutton-Brock, T.H. Microsatellites reveal heterosis in red deer. Proc. R. Soc. Lond. B 1998, 265, 489–495. [Google Scholar] [CrossRef] [PubMed] [Green Version]
- Smith, M.H.; Hillestad, H.O.; Manlove, M.N.; Marchinton, R.L. Use of population genetics data for the management of fish and wildlife populations. Trans. N. Am. Wildl. Nat. Resour. Conf. 1976, 41, 119–133. [Google Scholar]
- Smith, M.H.; Chesser, R.K.; Cothran, E.G.; Johns, P.E. Genetic Variability and Antler Growth in a Natural Population of White-tailed Deer. In Antler Development in Cervidae; Brown, R.D., Ed.; Caesar Kleberg Wildlife Research Institute: Kingsville, TX, USA, 1983; pp. 365–387. [Google Scholar]
- Scribner, K.T.; Smith, M.H.; Johns, P.E. Age, condition, and genetic effects on incidence of spike bucks. Proc. Southeast. Assoc. Fish Wildl. Agen. 1984, 38, 23–32. [Google Scholar]
- Scribner, K.T.; Smith, M.H. Genetic variability and antler development. In Horns, Pronghorns, and Antlers: Ecology, Morphology, Physiology, and Social Significance; Bubenik, G.A., Bubenik, A.B., Eds.; Springer: New York, NY, USA, 1990; pp. 460–473. [Google Scholar]
- Smith, M.H.; Scribner, K.T.; Johns, P.E.; Rhodes, O.E., Jr. Genetics and antler development. In Global Trends in Wildlife Management; Bobek, B., Perzanowski, K., Regelin, W., Eds.; Swiat Press: Krakow, Warszawa, 1991; pp. 323–326. [Google Scholar]
- Fitzsimmons, N.N.; Buskirk, S.W.; Smith, M.H. Population history, genetic variability, and horn growth in bighorn sheep. Conserv. Biol. 1995, 9, 314–323. [Google Scholar] [CrossRef]
- Williams, J.D.; Krueger, W.F.; Harmel, D.H. Heritabilities for antler characteristics and body weight in yearling white-tailed deer. Heredity 1994, 73, 78–83. [Google Scholar] [CrossRef] [PubMed]
- Kruuk, L.E.B.; Slate, J.; Pemberton, J.M.; Brotherstone, S.; Guinness, F.; Clutton-Brock, T. Antler size in red deer: Heritability and selection but no evolution. Evolution 2002, 56, 1683–1695. [Google Scholar] [CrossRef] [PubMed]
- Michel, E.S.; Demarais, S.; Strickland, B.K.; Smith, T.; Dacus, C.M. Antler characteristics are highly heritable but influenced by maternal factors. J. Wildl. Manag. 2016, 80, 1420–1426. [Google Scholar] [CrossRef]
- Hicks, J.F.; Rachlow, J.L. Is there a genetic basis for antler and pedicle malformations in reintroduced elk in northern Arizona? Southwest Nat. 2006, 51, 276–282. [Google Scholar] [CrossRef]
- French, C.E.; McEwen, L.C.; Magruder, N.D.; Ingram, R.H.; Swift, R.W. Nutrient requirements for growth and antler development in the white-tailed deer. J. Wildl. Manag. 1956, 20, 221–232. [Google Scholar] [CrossRef]
- Ullrey, D.E. Nutrition and antler development in white-tailed deer. In Antler Development in Cervidae; Brown, R.D., Ed.; Caesar Kleberg Wildlife Research Institute: Kingsville, TX, USA, 1983; pp. 49–59. [Google Scholar]
- Ditchkoff, S.S.; Lochmiller, R.L.; Masters, R.E.; Starry, W.R.; Leslie, D.M., Jr. Does fluctuating asymmetry of antlers in white-tailed deer (Odocoileus virginianus) follow patterns predicted for sexually selected traits? Proc. R. Soc. Lond. B 2001, 268, 891–898. [Google Scholar] [CrossRef] [PubMed]
- Zahavi, A. Mate selection: A selection for a handicap. J. Theor. Biol. 1975, 53, 205–214. [Google Scholar] [CrossRef]
- Baccus, J.T.; Welch, R.D. Asymmetry in the Antler Structure of Sika Deer from the Edwards Plateau of Texas. In Antler Development in Cervidae; Brown, R.D., Ed.; Caesar Kleberg Wildlife Research Institute: Kingsville, TX, USA, 1983; pp. 211–221. [Google Scholar]
- Gould, S.J. The origin and function of “bizarre” structures: Antler size and skull size in the “Irish elk,” Megaloceros giganteus. Evolution 1974, 28, 191–220. [Google Scholar]
- Morina, D.L.; Demarais, S.; Strickland, B.K.; Larson, J.E. While males fight, females choose: Male phenotypic quality informs female mate choice in mammals. Anim. Behav. 2018, 138, 69–74. [Google Scholar] [CrossRef]
- Pettry, D.E. Soil Resources Areas of Mississippi, Information Sheet 1278; Mississippi Agricultural and Forestry Experiment Station, Mississippi State University: Starkville, MS, USA, 1977. [Google Scholar]
- DeYoung, R.W. Effects of Social and Population Characteristics on the Reproductive Success of Male White-Tailed Deer. Ph.D. Thesis, Mississippi State University, Starkville, MS, USA, 2004. [Google Scholar]
- Gee, K.L.; Porter, M.D.; Demarais, S.; Bryant, F.C.; Van Vreede, G. White-Tailed Deer: Their Foods and Management in the Cross Timbers, 2nd ed.; The Samuel Roberts Noble Foundation: Ardmore, OK, USA, 1994. [Google Scholar]
- Webb, S.L.; Gee, K.L.; Demarais, S.; Strickland, B.K.; DeYoung, R.W. Efficacy of a 15-strand high tensile electric fence to control white-tailed deer movements. Wildl. Biol. Pract. 2009, 5, 45–57. [Google Scholar] [CrossRef]
- McCoy, J.E.; Hewitt, D.G.; Bryant, F.C. Dispersal by yearling male white-tailed deer and implications for management. J. Wildl. Manag. 2005, 69, 366–376. [Google Scholar] [CrossRef]
- Strickland, B.K.; Jones, P.D.; Demarais, S.; Dacus, C.M.; Dillard, J.R.; Jacobson, H.A. Estimating Boone and Crockett scores for white-tailed deer from simple antler measurements. Wildl. Soc. Bull. 2013, 37, 458–463. [Google Scholar] [CrossRef]
- Boone and Crockett Club. Measuring and Scoring North American Big Game Trophies, 2nd ed.; Boone and Crockett Club: Missoula, MT, USA, 1997. [Google Scholar]
- Ramsey, C.W. A drop-net deer trap. J. Wildl. Manag. 1968, 32, 187–190. [Google Scholar] [CrossRef] [Green Version]
- Gee, K.L.; Holman, J.H.; Demarais, S. A man-power efficient drop-net system for capturing white-tailed deer. Proc. Annu. Southeast Deer Study Group 1999, 22, 31. [Google Scholar]
- Webb, S.L.; Lewis, J.S.; Hewitt, D.G.; Hellickson, M.W.; Bryant, F.C. Assessing the helicopter and net-gun as a capture technique for white-tailed deer. J. Wildl. Manag. 2008, 72, 310–314. [Google Scholar] [CrossRef]
- DeYoung, R.W.; Demarais, S.; Honeycutt, R.L.; Gonzales, R.A.; Gee, K.L.; Anderson, J.D. Evaluation of a DNA microsatellite panel useful for genetic exclusion studies in white-tailed deer. Wildl. Soc. Bull. 2003, 31, 220–232. [Google Scholar]
- Anderson, J.D.; Honeycutt, R.L.; Gonzales, R.A.; Gee, K.L.; Skow, L.C.; Gallagher, R.L.; Honeycutt, D.A.; DeYoung, R.W. Development of microsatellite DNA markers for the automated genetic characterization of white-tailed deer populations. J. Wildl. Manag. 2002, 66, 67–74. [Google Scholar] [CrossRef]
- Rachlow, J.L.; Lee, R.M.; Riley, R.K. Abnormal antlers and pedicles on Rocky Mountain elk in northern Arizona. Southwest Nat. 2003, 48, 147–153. [Google Scholar] [CrossRef]
- Severinghaus, C.W. Tooth development and wear as criteria of age in white-tailed deer. J. Wildl. Manag. 1949, 13, 195–216. [Google Scholar] [CrossRef]
- Gee, K.L.; Holman, J.H.; Causey, M.K.; Rossi, A.N.; Armstrong, J.B. Aging white-tailed deer by tooth replacement and wear: A critical evaluation of a time-honored technique. Wildl. Soc. Bull. 2002, 30, 387–393. [Google Scholar]
- Queller, D.C.; Goodnight, K.F. Estimating relatedness using genetic markers. Evolution 1989, 43, 258–275. [Google Scholar] [CrossRef]
- Hardy, O.J.; Vekemans, X. SPAGeDi: A versatile computer program to analyse spatial genetic structure at the individual or population levels. Mol. Ecol. Notes 2002, 2, 618–620. [Google Scholar] [CrossRef] [Green Version]
- Amos, W.; Wilmer, J.W.; Fullard, K.; Burg, T.M.; Croxall, J.P.; Bloch, D.; Coulson, T. The influence of parental relatedness on reproductive success. Proc. R. Soc. Lond. B 2001, 268, 2021–2027. [Google Scholar] [CrossRef] [PubMed]
- Amos, W. IR Macron3. Available online: http://www.zoo.cam.ac.uk/system/files/documents/IRmacroN4.doc (accessed on 27 August 2008).
- Aparicio, J.M.; Ortego, J.; Cordero, P.J. What should we weight to estimate heterozygosity, alleles or loci? Mol. Ecol. 2006, 15, 4659–4665. [Google Scholar] [CrossRef] [PubMed]
- Wright, S. The genetical structure of populations. Ann. Eugen. 1951, 15, 323–354. [Google Scholar] [CrossRef] [PubMed]
- Weir, B.S.; Cockerham, C.C. Estimating F-statistics for the analysis of population structure. Evolution 1984, 38, 1358–1370. [Google Scholar] [PubMed]
- Avise, J.C. Molecular Markers, Natural History, and Evolution, 2nd ed.; Sinauer Associates, Inc.: Sunderland, MA, USA, 2004. [Google Scholar]
- DeYoung, R.W.; Demarais, S.; Gonzales, R.A.; Honeycutt, R.L.; Gee, K.L. Multiple paternity in white-tailed deer (Odocoileus virginianus) revealed by DNA microsatellites. J. Mammal. 2002, 83, 884–892. [Google Scholar] [CrossRef] [Green Version]
- Sorin, A.B. Paternity assignment for white-tailed deer (Odocoileus virginianus): Mating across age classes and multiple paternity. J. Mammal. 2004, 85, 356–362. [Google Scholar] [CrossRef] [Green Version]
- Kenward, M.G.; Roger, J.H. Small sample inference for fixed effects from restricted maximum likelihood. Biometrics 1997, 53, 983–997. [Google Scholar] [CrossRef] [Green Version]
- Littell, R.C.; Milliken, G.A.; Stroup, W.W.; Wolfinger, R.D.; Schabenberger, O. SAS® for Mixed Models, 2nd ed.; SAS Institute, Inc.: Cary, NC, USA, 2006. [Google Scholar]
- DeYoung, R.W.; Demarais, S.; Gee, K.L.; Honeycutt, R.L.; Hellickson, M.W.; Gonzales, R.A. Molecular evaluation of the white-tailed deer (Odocoileus virginianus) mating system. J. Mammal. 2009, 90, 946–953. [Google Scholar] [CrossRef] [Green Version]
- Balloux, F.; Amos, W.; Coulson, T.N. Does heterozygosity estimate inbreeding in real populations? Mol. Ecol. 2004, 13, 3021–3031. [Google Scholar] [CrossRef] [PubMed]
- Von Hardenberg, A.; Bassano, B.; Festa-Bianchet, M.; Luikart, G.; Lanfranchi, P.; Coltman, D. Age-dependent genetic effects on a secondary sexual trait in male Alpine ibex, Capra ibex. Mol. Ecol. 2007, 16, 1969–1980. [Google Scholar] [CrossRef] [PubMed]
- Scribner, K.T.; Smith, M.H.; Jones, P.E. Environmental and genetic components of antler growth in white-tailed deer. J. Mammal. 1989, 70, 284–291. [Google Scholar] [CrossRef]
- Hartl, G.B.; Klein, F.; Willing, R.; Aapollonio, M.; Lang, G. Allozymes and the genetics of antler development in red deer (Cervus elaphus). J. Zool. 1995, 237, 83–100. [Google Scholar] [CrossRef]
- Hartl, G.B.; Zachos, F.; Nadlinger, K. Genetic diversity in European red deer (Cervus elaphus L.): Anthropogenic influences on natural populations. Comptes Rendus Biol. 2003, 326, 37–42. [Google Scholar] [CrossRef]
- Ryman, N.; Baccus, R.; Reuterwall, C.; Smith, M.H. Effective population size, generation interval, and potential loss of genetic variability in game species under different hunting regimes. Oikos 1981, 36, 257–266. [Google Scholar] [CrossRef]
- Latch, E.K.; Gee, K.L.; Webb, S.L.; Honeycutt, R.L.; DeYoung, R.W.; Gonzales, R.A.; Demarais, S.; Toby, R. Genetic consequences of fence confinement in a population of white-tailed deer. Diversity 2021, accepted. [Google Scholar]
- Zachos, F.E.; Althoff, C.; Steynitz, Y.V.; Eckert, I.; Hartl, G.B. Genetic analysis of an isolated red deer (Cervus elaphus) population showing signs of inbreeding depression. Eur. J. Wildl. Res. 2007, 53, 61–67. [Google Scholar] [CrossRef]
- Webb, S.L.; Gee, K.L.; Wang, G. Survival and fidelity of an enclosed white-tailed deer population using capture–recapture-reporting data. Pop. Ecol. 2010, 52, 81–88. [Google Scholar] [CrossRef]
- Webb, S.L.; Demarais, S.; Strickland, B.K.; DeYoung, R.W.; Kinghorn, B.P.; Gee, K.L. Effects of selective harvest on antler size in white-tailed deer: A modeling approach. J. Wildl. Manag. 2012, 76, 48–56. [Google Scholar] [CrossRef]


| Mississippi 1 | Oklahoma 2 | Texas 3 | |||||
|---|---|---|---|---|---|---|---|
| Metric | Age | Lower | Upper | Lower | Upper | Lower | Upper |
| Score | 1 | ≤104.1 | ≥137.2 | ≤78.7 | ≥142.2 | ≤76.2 | ≥137.2 |
| 2 | ≤188.0 | ≥233.7 | ≤167.6 | ≥256.5 | ≤180.3 | ≥238.8 | |
| 3 | ≤195.6 | ≥292.1 | ≤236.2 | ≥281.9 | ≤254.0 | ≥309.9 | |
| Points | 1 | ≤4 | ≥6 | ≤3 | ≥8 | ≤2 | ≥6 |
| 2 | ≤5 | ≥8 | ≤7 | ≥9 | ≤6 | ≥9 | |
| 3 | ≤6 | ≥8 | ≤8 | ≥10 | ≤7 | ≥10 | |
| 95% CI | |||||
|---|---|---|---|---|---|
| Study Area | Group | N | Mean (SE) | Lower | Upper |
| Mississippi | Both | 197 | −0.005 (0.001) | −0.007 | −0.003 |
| Female | 53 | 0.005 (0.008) | −0.012 | 0.022 | |
| Male | 144 | −0.008 (0.004) | −0.011 | 0.022 | |
| Siblings | 62 | 0.415 (0.024) | 0.367 | 0.463 | |
| Oklahoma | Both | 495 | −0.002 (0.003) | −0.007 | 0.003 |
| Female | 266 | −0.003 (0.002) | −0.008 | 0.002 | |
| Male | 229 | −0.001 (0.006) | −0.012 | 0.01 | |
| Siblings | 34 | 0.405 (0.04) | 0.324 | 0.486 | |
| Texas | Both | 330 | −0.006 (0.003) | −0.011 | 0.000 |
| Female | 132 | 0.013 (0.011) | −0.008 | 0.034 | |
| Male | 198 | −0.012 (0.007) | −0.026 | 0.002 | |
| Siblings | 113 | 0.439 (0.022) | 0.395 | 0.483 | |
| Internal Relatedness (IR) | Homozygosity (HL) | ||||
|---|---|---|---|---|---|
| Study Area | Age | Score | Sign | Score | Sign |
| Oklahoma | 3 | −0.022 | < | 0.199 | < |
| 2 | 0.207 | > | 0.403 | > | |
| 2 | 0.135 | > | 0.341 | > | |
| 1 | 0.258 | > | 0.447 | > | |
| 1 | 0.068 | = | 0.274 | < | |
| 1 | 0.040 | = | 0.285 | = | |
| 3 | 0.147 | > | 0.353 | > | |
| Texas | 4 | −0.032 | < | 0.181 | < |
| 2 | 0.404 | > | 0.526 | > | |
| 2 | 0.027 | < | 0.246 | < | |
| 6 | 0.167 | > | 0.318 | > | |
| 8 | 0.099 | = | 0.347 | > | |
Publisher’s Note: MDPI stays neutral with regard to jurisdictional claims in published maps and institutional affiliations. |
© 2021 by the authors. Licensee MDPI, Basel, Switzerland. This article is an open access article distributed under the terms and conditions of the Creative Commons Attribution (CC BY) license (http://creativecommons.org/licenses/by/4.0/).
Share and Cite
Webb, S.L.; DeYoung, R.W.; Demarais, S.; Strickland, B.K.; Gee, K.L. Testing a Local Inbreeding Hypothesis as a Cause of Observed Antler Characteristics in Managed Populations of White-Tailed Deer. Diversity 2021, 13, 116. https://doi.org/10.3390/d13030116
Webb SL, DeYoung RW, Demarais S, Strickland BK, Gee KL. Testing a Local Inbreeding Hypothesis as a Cause of Observed Antler Characteristics in Managed Populations of White-Tailed Deer. Diversity. 2021; 13(3):116. https://doi.org/10.3390/d13030116
Chicago/Turabian StyleWebb, Stephen L., Randy W. DeYoung, Stephen Demarais, Bronson K. Strickland, and Kenneth L. Gee. 2021. "Testing a Local Inbreeding Hypothesis as a Cause of Observed Antler Characteristics in Managed Populations of White-Tailed Deer" Diversity 13, no. 3: 116. https://doi.org/10.3390/d13030116