Article

Deep Learning Applied to SEM Images for Supporting Marine Coralline Algae Classification

by
Giulia Piazza
1,*,
Cecile Valsecchi
1 and
Gabriele Sottocornola
2
1
Department of Earth and Environmental Sciences, University of Milano-Bicocca, 20126 Milano, Italy
2
Department of Information Science and Technology, Free University of Bozen-Bolzano, 39100 Bolzano, Italy
*
Author to whom correspondence should be addressed.
Diversity 2021, 13(12), 640; https://doi.org/10.3390/d13120640
Submission received: 21 October 2021 / Revised: 18 November 2021 / Accepted: 30 November 2021 / Published: 3 December 2021
(This article belongs to the Special Issue Machine Learning Methods Applied in Diversity Studies)

Abstract

:
The classification of coralline algae commonly relies on the morphology of cells and reproductive structures, along with thallus organization, observed through Scanning Electron Microscopy (SEM). Nevertheless, species identification based on morphology often leads to uncertainty, due to their general plasticity. Evolutionary and environmental studies featured coralline algae for their ecological significance in both recent and past Oceans and need to rely on robust taxonomy. Research efforts towards new putative diagnostic tools have recently been focused on cell wall ultrastructure. In this work, we explored a new classification tool for coralline algae, using fine-tuning pretrained Convolutional Neural Networks (CNNs) on SEM images paired to morphological categories, including cell wall ultrastructure. We considered four common Mediterranean species, classified at genus and at the species level (Lithothamnion corallioides, Mesophyllum philippii, Lithophyllum racemus, Lithophyllum pseudoracemus). Our model produced promising results in terms of image classification accuracy given the constraint of a limited dataset and was tested for the identification of two ambiguous samples referred to as L. cf. racemus. Overall, explanatory image analyses suggest a high diagnostic value of calcification patterns, which significantly contributed to class predictions. Thus, CNNs proved to be a valid support to the morphological approach to taxonomy in coralline algae.

Graphical Abstract

1. Introduction

Calcareous red algae belong to the phylum Rhodophyta and include a multitude of diverse marine species, acknowledged for their ecological importance as ecosystem engineers [1,2,3,4]. They are common in Mediterranean benthic communities, constituting biodiversity hotspots known as maerl beds and coralligenous habitats [2,5,6].
Species identification in this taxon can be challenging. A reliable taxonomy is imperative, especially for paleontologists, in the attempt to reconstruct both the paleoecology and the paleoclimate [7,8,9,10]. Thallus organization and the morphological characteristics of cells and reproductive structures are generally used to discriminate among species [11,12,13,14], either by light microscopy of thin sections or by high-resolution Scanning Electron Microscopy (SEM) [15]. Nevertheless, the increasing application of molecular systematic tools has been revealing many cases of cryptic diversity and has given way to several systematic revisions [16,17,18,19,20]. Recent investigations into coralline algal cell walls and their calcified nanostructures embrace the hypothesis that a biological control exerted by the alga drives the crystallite shape [21]. Particularly, the shape of the nanostructures composing the so-called primary and secondary calcification is diagnostic at the level of family [21].
Recently, a new species of non-geniculate coralline alga, Lithophyllum pseudoracemus sp. nov. Caragnano, Rodondi & Rindi, was discovered by molecular phylogeny [16]. Due to their morphological similarity, an expert cannot unequivocally distinguish this species from Lithophyllum racemus (Lamarck) Foslie 1901 [16,22]. Common in the Mediterranean Sea, L. racemus usually constitutes maerl beds [23,24]. It is a non-geniculate, fruticose alga with many protuberances densely spaced and apically broadened [22]. It is often found in association with Lithothamnion corallioides (P. Crouan & H. Crouan) P. Crouan & H. Crouan 1867 [25,26,27,28,29,30], which grows in the form of free-living branchlets or nodules, often sterile [31]. Another common species of coralline alga in Mediterranean waters is Mesophyllum philippii (Foslie) Adey 1970, which is one of the main bioconstructors of the Mediterranean coralligenous concretions, occurring in the form of layered crusts [32], sometimes with protuberances.
Convolutional Neural Networks (CNNs) have been successfully applied for the classification of fish species [33,34], bivalves [35] and foraminifera [36]. In such cases, the classified images were photographs of the entire organism. Liu and Song [37] used fine-tuning on pretrained CNNs for the recognition of different taxonomic groups of microfossils observed in thin sections and obtained a model accuracy comparable to human classifiers. To the best of our knowledge, the application of CNNs to SEM images has never been used for taxonomic identification, and there are no previous attempts to classify calcareous red algae by CNNs. Indeed, Modarres et al. [38] used CNN for SEM image recognition of generic nanostructures, mostly of non-biological origin. Given their morphological plasticity, new diagnostic tools for species identification could provide significant support to the experts, especially for fossil samples with poorly preserved morphological features.
In this work, we used CNNs to classify a set of SEM images belonging to the calcareous red algae L. corallioides, M. philippii, L. racemus, and L. pseudoracemus. The models were enriched by processing each image together with the vectorized representation of the observed morphological features (or categories). Six relevant morphological categories were considered, which were manually paired to each image (Figure 1). Three models were trained on the same images, which were grouped at different taxonomic levels to:
  • Discriminate L. pseudoracemus from all the other species (2 class-CNN);
  • Classify the three genera (3 class-CNN);
  • Classify the four species (4 class-CNN).
Finally, we tested the model potential as a diagnostic tool for the classification of two uncertain samples, non-molecularly identified and generically referred to as L. cf. racemus. The experimental results proved that the proposed CNN-based approach could potentially support and improve the expert capability in the taxonomic identification of diverse calcareous red algal species. Thus, we summarize the contribution of this research as follows:
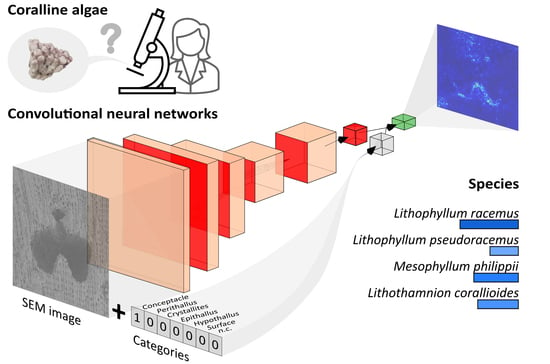
  • We presented a new classification tool for coralline algae diagnosis, by applying a deep learning technique to SEM images for the automated identification of four species at different taxonomic levels;
  • We developed and evaluated CNN-based classification models (open-sourced on GitHub as reported in the Data Availability Statement) against two baselines, namely a dummy classifier and a human-reported classification. Then, our model was tested in a practical scenario, to support the classification of two uncertain samples of coralline algae;
  • We investigated and discussed the contribution of six main morphological categories, shown in the SEM images, to the classification task;
  • We explored a set of explanation methods, which justify the class assignment of the proposed model by visually highlighting the contribution of portions of the processed SEM image.

2. Materials and Methods

2.1. Samples and Data Collection

Samples were collected at different locations in the Western and Eastern Mediterranean Sea, and one sample was collected from the NE Atlantic Ocean (Table 1). They were recovered by grab during the cruises of the R/V Minerva Uno, in the framework of the Marine Strategy Campaigns, or by SCUBA diving during local surveys. The sample from Capraia, Tuscany (Italy) was collected in the framework of “Taphonomy and Sedimentology on the Mediterranean shelf ” project. A total of eleven specimens were selected, at least two for each species considered (Table 1).
Species identification for Lithothamnion sp. and Mesophyllum sp. was assessed by morphological analyses of the SEM images. Two samples (iv1, iv2 in Table 1) were identified as L. corallioides [31,39]. Three more samples (iv3–5) (Table 1) were identified as M. philippii [13,32]. Four samples (iv6–9) (Table 1) were targeted for a multigene molecular phylogeny at Università Politecnica delle Marche (AN) [16], and are currently deposited in the Herbarium Universitatis Florentinae, Natural History Museum (Florence, Italy) with codes FI058894, FI058887, FI058890 and FI058891. They were identified as L. racemus (samples iv6, iv7 in Table 1) and L. pseudoracemus (samples iv8, iv9 in Table 1). The last two samples considered (DB865 and DB866) (Table 1) were referred to as L. cf. racemus [22], since they were not molecularly identified, and, thus, they could be used as a real-case test study.
The selected algae were cleaned of sediment and epiphytes, and then prepared for SEM as per Basso [12]. Samples were fragmented along the growth direction to observe morphologies in longitudinal sections, they were mounted on stubs by means of graphite paste, and finally, chrome coated. SEM analysis was performed by a Field Emission Gun Scanning Electron Microscope (SEM-FEG) Gemini 500 Zeiss (Milan, Italy).
The final dataset included 255 SEM images, belonging to the eleven samples listed in Table 1. The images had a resolution of 2046 × 1369 pixels in greyscale (single channel). Furthermore, each image in the dataset was assigned to one or more categories (i.e., conceptacles, perithallus, crystallites, epithallus, hypothallus and surface) according to the morphological features observed (Figure 1), and each category information was added as metadata. Among those, 21 images were assigned to more than one category since they present multiple structures together. Ten images, including those showing details of the conceptacle pore canal (Figure A1), were not attributed to any specific category.

2.2. Data Augmentation

To increase the number of images, and, hence, improve the variance of the available training set, an ‘on-the-fly’ realistic data augmentation [40] was performed. Namely, during model training, each image in the training set was duplicated five times, each time with some random changes according to the following criteria: a random change in brightness in the range [0.5, 1.8], a random rotation up to 10 degrees, a random zoom to a maximum of 0.7, and a random horizontal flip. Figure 2 shows eight examples of augmented images obtained from the original image located in the upper left corner. The criteria were chosen to obtain realistic augmented images, i.e., images compatible with SEM images.

2.3. Convolutional Neural Networks

Classification (or, more formally, supervised classification) is the specific area of machine learning that aims at assigning objects to one of several predefined classes. In our case, the objects, i.e., the input of classification, are represented by images associated with categorical metadata (i.e., morphological features), while the classes are the considered species or genera. Artificial neural networks are popular machine learning algorithms whose goal is to determine the set of weights (i.e., the edges connecting neurons of the network) that minimize a defined loss function over the predicted classes and the real classes [41]; this is achieved by an iterative process which alternated a feedforward step, in which weights connecting different layers are used to compute the output (i.e., the predicted classes), to a backpropagation step, whose aim is to adjust the weights by computing the gradient of the loss function. Deep learning usually refers to artificial neural networks with more than two hidden layers.
In the image classification context, deep learning avoids the time-consuming and challenging feature extraction process which is required for other classification methods (such as SVM and kNN) [42,43]. Indeed, deep learning provides end-to-end learning and eliminates all extra overheads of selecting feature descriptors and feature selection by automatically extracting information from the raw data. In particular, Convolutional Neural Networks (CNNs) have become the state-of-the-art image recognition method [44].
Several different variations in CNN architectures have been applied, but in general, they consist of stacked convolutional and pooling layers, followed by one or more fully connected layer(s). The convolutional layers are the core of CNNs and are based on a set of trainable filters or kernels; basically, they can be seen as a pattern extractor. The inputs are convolved over those filters, whose weights are optimized in the training phase to obtain a new representation of the original images, i.e., a new feature map. The pooling layer reduces these feature maps through information compression, usually keeping the maximum value (i.e., maxpooling layer). Convolutional and pooling layers are followed by fully connected or dense layers, which consist of neurons connected to all the neurons of the previous and following dense layers. For classification purposes, the number of neurons in the output layer is equal to the number of classes to be predicted, and each of these neurons provides as output the probability that the image belongs to the corresponding class.
CNNs are data-hungry; that is, they need to be trained on a huge number of training images [44]. Thus, for small datasets (i.e., less than a thousand images) it is convenient to start from a pretrained network, which is a CNN whose weights have been already trained on thousands of images [45,46]. Unlike random weights, the weights of a pretrained CNN have been already trained to distinguish some simple and common geometrical patterns. Typically, the last fully connected layer of the pretrained CNN will be substituted to obtain the desired output, which may imply a different number of classes. Then, the CNN can be trained on the images of interest, and depending on the training procedure, we can speak of transfer learning and/or fine-tuning. In the former case, all or only some layers of the CNN will be trained on the images of interest for a few numbers of epochs, while the latter involves the tuning of some hyperparameters (such as the learning rate) to adapt the network to the new classification purpose.
We adapted and fine-tuned a deep neural network named Visual Geometry Group 16 (VGG16) [47] pretrained on the “imagenet” dataset [48], which includes 14 million images belonging to 1000 classes. Figure 3 depicts the adapted VGG16 architecture, which is constituted by:
  • An input layer of fixed size 224 × 224 Red-Green-Blue image;
  • A stack of convolutional layers, where the filters were used with a very small receptive field: 3 × 3;
  • Five maxpooling layers (not all the convolutional layers are followed by max-pooling);
  • A dense layer, whose input is the output of the previous maxpooling layer and concatenated with the one-hot-encoded categories, and;
  • A softmax output layer.
All hidden layers, i.e., the layers between the input and the output layers, are equipped with the ReLU activation function [47,49]. VGG16 architecture is particularly suited for the recognition of geometries, which makes it effective for our application since the shape of cells and reproductive structures is one of the most significant parameters for species identification in coralline algae. In a preliminary analysis, we further considered a set of other CNN-based architectures (namely ResNet50, InceptionV3, MobileNet), where the VGG16 resulted as the most promising approach in terms of diagnostic accuracy.
We resized our sampled SEM images and replicated the same greyscale image for the three RGB channels, to be injected into the input layer. All the convolutional layers’ parameters of the original VGG16 are kept frozen (i.e., are not modified during the learning procedure), while we trained the last dense layer and the output layer of our specific classification tasks. Furthermore, we added a new input layer constituted by six neurons, mapping the one-hot encoded representation of the morphological features observed in each image, and directly connected with the dense layer.
Formally, given an image x with a morphological categories vector c, each output neuron og, associated to algae class g, is computed as:
o g = s o f t m a x ( i W i , g o d i ) ;   d i = ReLU ( j W j , i d h j + l W l , i d c l )   ,
where di is the i-th component of the dense layer, h j is the j-th component of the image x representation provided by the last maxpooling layer of VGG16, and c l is the l-th component of the one-hot encoded category input layer. Wd and Wo are the matrices of weights learned by the model for the dense and output layers respectively.
We stress the fact that the softmax function, applied to the output layer, projects the output in the interval [0, 1], such that og = P(g|x, c) for each class g. The predicted class g ^ is hence assigned to the class g with the highest probability.
Since L. pseudoracemus and L. racemus are almost undistinguishable from a traditional morphological approach [16], the difficulty of the classification task changed according to the taxonomic level considered. Therefore, we constructed the following three architectures addressing different classification tasks, each grouping the SEM images at diverse levels (as shown in Figure 3):
  • 2 class-CNN (L. pseudoracemus versus Others, i.e., all the other species), last dense layer of 128 neurons, output layer of two neurons;
  • 3 class-CNN, at the genus level (Lithothamnion sp., Mesophyllum sp. and Lithophyllum sp.), last dense layer of 256 neurons, output layer of three neurons;
  • 4 class-CNN, at the species level (L. corallioides, M. philippii, L. racemus and L. pseudoracemus), last dense layer of 64 neurons, output layer of four neurons.
For all three architectures, the number of epochs was set to 20 and the learning rate to 10−5.
We optimized the VGG16 hyperparameters, i.e., the number of neurons in the last hidden dense layer, the training epochs and the learning rate in order to obtain suitable weights for the problem under study. As per common practice, the best hyperparameters were chosen according to the highest performance in cross-validation [50]. In addition, we used a weighted class assignment, in which the class contributions are inversely proportional to the different representativeness of the classes.

2.4. Interpretability

Despite widespread adoption, CNNs are often considered as black boxes, because the interpretation of the model predictions is not trivial. However, understanding the reasons behind predictions is a matter of intuition, which is fundamental to act based on the prediction. In order to make CNNs replicable, different approaches belonging to the so-called explainable artificial intelligence were developed, i.e., local approximations of the model’s behavior. In this work, we considered three approaches: Saliency [51], LIME [52] and Grad-CAM [53].
As explained in [51], the computing of the gradient of an output class with respect to an input image provides information on how the output class value changes with respect to a small change in input image pixels. All the positive values in the gradients tell us that a small change to that pixel will increase the output value. Hence, a saliency map is the visualization of these gradients, which have the same shape as the image and provide an intuition of the information learned by the model.
Local Interpretable Model-Agnostic Explanation (LIME) [52] is a model-independent explanation technique that attempts to explain the model by perturbing the input samples and understanding how these perturbations affect the predictions. Given an input image, LIME masks random regions of the image to define their importance for the CNN prediction.
Like Saliency, Gradient-weighted Class Activation Mapping (Grad-CAM) also uses the class-specific gradient, but in this case, considers the final convolutional layer of a CNN to produce a coarse location map of important regions in the image [53].
We applied these explanation techniques to the sampled SEM images to obtain different explained overlays. Thus, they were evaluated according to their meaningfulness and helpfulness for the classification task.
The CNNs and the explanation models were built by means of Keras [54], Keras Vis [55] and Lime [52] packages with TensorFlow [56] backend in Python v3.6.

2.5. Evaluation Protocol

To extensively evaluate the effectiveness of our approach for the task of coralline algae classification, we considered two different setups.
In the first one, Internal Validation, we measured the capability of the model in identifying the correct class for each image involved in the study. For this purpose, we selected only the images belonging to the samples for which a sure diagnosis is given as ground truth (based on morphology and molecular phylogeny, as described in Section 2.1). Thus, we excluded the images referred to the L. cf. racemus samples (i.e., DB865 and DB866). We ended up with a dataset of 214 tagged SEM images. In order to consider the whole set of images while avoiding overfitting, we applied a k-fold cross validation approach [50]. Specifically, we considered a four-fold cross validation, in which the original dataset was partitioned into four disjoint sets (i.e., folders). In each round, a folder was used as a validation set (on which classification metrics were computed), while the other folders were used to train the model. The procedure iterated until all the folders (and thus all the images) were used for validation. Furthermore, we compared the performances obtained by the CNN models with average baselines produced by dummy classifiers, whose random predictions (repeated 1000 times) follow the a priori class distribution, and with a human classifier, required to diagnose each SEM image considered in Internal Validation. Specifically, a post-doc researcher in paleoecology at Milano-Bicocca University was invited to identify the species shown in each SEM image (previously anonymized and shuffled), by filling a multiple-choice questionnaire, and relying on scientific experience and provided literature [13,16,22,31,32,39]. The comparison between the model and the expert’s performances allowed us to evaluate the practical usefulness of our method in supporting the classification task [57,58].
We applied two well-defined classification metrics to evaluate the performance of our model, namely Global Accuracy and Class Recall [50]. For each model, the Global accuracy is the fraction of correctly predicted images in cross validation, while Class Recall for the g-th class is the fraction of correctly predicted images of the sample belonging to class g in cross validation. The Class Recall fractions were also given for each morphological category, added as metadata (Figure 1).
In the second setup, External Test, we tested our model in a simulated scenario, namely, where an expert is required to identify the correct classes (i.e., genus or species) of new unknown samples of coralline algae. We simulated this case study by training our CNN classification model on the whole set of 214 tagged SEM images, then we applied the model to each image belonging to the L. cf. racemus samples DB865 and DB866. Therefore, we can measure the Class Share (CS) of each class g, for a specific sample s, as follows:
C S s ( g ) = 1 N s n = 1 N s δ n   w h e r e   δ n = { 1 ,   i f   g ^ n = g 0 ,   o t h e r w i s e   ,
where Ns is the number of SEM images belonging to sample s, δ n is equal to 1 if the n-th image of sample s is assigned to class g (i.e., the predicted class g ^ n is equal to g) by our classification model and 0 otherwise. Furthermore, the Class Share per category was computed on the different subsets of SEM images assigned to each morphological category (Figure 1).

3. Results

3.1. Internal Validation

In Table 2, we report the results for the Internal Validation procedure compared to the results provided by dummy and human classifiers.
The global cross-validation accuracy was similar in the 2 class-CNN (L. pseudoracemus versus Others) and in the 3 class-CNN (genus level), despite the increased difficulty in the task, given the higher number of classes (three rather than two) and thus, data sparsity. The highest classification accuracy was in fact achieved by the 3 class-CNN (accuracy 64%), and the lowest by the 4 class-CNN (species level), with an accuracy of 48% (Table 2).
With respect to the Class Recall, in the 2 class-CNN we observe a significant improvement in the identification of L. pseudoracemus (61% against the 27% of the dummy baseline and the 27% of the human classifier), despite registering a decrease in the Recall for Others, and in the Global accuracy, compared to expert evaluation.
For both 3 and 4 class-CNNs the Global accuracy and all the Class Recall were higher than both the baselines, except for Lithothamnion sp. (or L. corallioides), where a 55% and 57% Recall is achieved, against the 73% of the human classifier. Nevertheless, our models significantly outperform the expert classification on the Recall of the two other classes (with a maximum of +27% for Lithophyllum sp. Recall) and Accuracy (+15%). Furthermore, the two genera Lithothamnion and Mesophyllum were classified by our model with a Recall that is more than twice as high as the dummy classifier. Similar observations can be drawn from the Recall at the species level (4 class-CNN). Another interesting finding is that the Lithothamnion genus is predicted slightly better at the species level (i.e., L. corallioides), with an increased Recall from 55% to 57%, despite having a sparser classification task. The classification of L. racemus and L. pseudoracemus in the 4 class-CNN corresponded to the most difficult task due to their morphological similarity, and our analysis, as well as the empirical evidence of human evaluation, was in line with the domain-related studies. In fact, both at genus and species levels the increment in Recall was consistently between the 10% and 15%, compared to the dummy classifiers’ baseline. L. pseudoracemus in the 4 class-CNN was the most difficult class to be identified by our model, with the lowest Recall of 37%. Compared to the model, the human performances showed a better in Recall limitedly to L. corallioides class, while all the other classes at both genus and species levels had a notably lower Recall. Concluding, our CNN-based models outperformed the human diagnosis at both genus and species level Global accuracy, as well as in the Recall of the hardest distinguishable classes, L. racemus and L. pseudoracemus, proving the effectiveness of our technique in support of coralline algae classification.
Finally, the 3 class-CNN thus appeared to be the best model for coralline algae classification, with the highest Global accuracy and solid Class Recall for each genus. Nevertheless, it would be convenient to adopt the 4 class-CNN model when a more fine-grained diagnosis (i.e., at species level) is required. This model, indeed, despite the smaller Global accuracy, could include more classes and still provide reasonable support for classification even in the occurrence of very similar classes, such as L. pseudoracemus and L. racemus.

Morphological Categories Analysis

Table 3 is a summary of the results of Class Recall for each class and each modeling approach conditioned on the morphological category represented in the image.
As shown in Table 3, considering L. pseudoracemus, the 2 class-CNN correctly recognized all the images showing the conceptacle and 70% of crystallites and the epithallus. On the other hand, only 14% of the images of the L. pseudoracemus perithallus were assigned to the correct class. Within the class including all the species except for L. pseudoracemus (Others), the percentages of images correctly identified were balanced among classes with an average accuracy of 64%. Overall, about 61% of the SEM images in both classes had been correctly classified, despite the class Others had almost three times more images than L. pseudoracemus (Table 3). The images with no category (n.c.) were mostly assigned to the correct class, as well as the images within the class, others showed more than one category (shared), which included five images showing the hypothallus, two images showing both epithallus and perithallus and one image showing both perithallus and crystallites. The n.c. images in both classes included the conceptacle pore canal and the perithallus with crystallites in the proximity of the pore canal in L. racemus (Figure A1) and L. pseudoracemus.
Among genera, Lithophyllum sp. had the highest percentage of images correctly classified (69%). The identification of conceptacles, when present, was still significant for the correct classification, as well as the perithallus in Lithothamnion sp. and the crystallites in both Lithothamnion sp. and Lithophyllum sp. (Table 3). In Mesophyllum sp., the only genus showing the hypothallus, this contributed significantly to the identification with 67% of correct assignations. In the 3 class-CNN models as well, the non-categorized images have been of significant support to the correct classification (Table 3). The shared images correctly identified as Mesophyllum sp. included five images of the hypothallus, three of which also show the conceptacle, and two showing also the epithallus. The n.c. images correctly identified in the Lithophyllum sp. class included the pore canal of a conceptacle in the L. pseudoracemus, the perithallial cells and crystallites at the proximity of the same pore canal, and the pore canals in two different conceptacles of L. racemus (Figure A1).
Conceptacles were determinants for the identification of the algae also at the species level (Table 3). The perithallus, instead, aided only the classification of L. corallioides (with 60% of correct assignations), in which also the crystallites made a significant contribution (71%). The images showing the epithallus were mostly correctly classified in L. pseudoracemus (70%) and misclassified in M. philippii (20%). As for the 3 class-CNN, also in the 4 class-CNN the hypothallus was a significant contributor for the classification of M. philippii (67%), as well as the images showing the surface (75%). All the shared images in M. philippii were correctly classified, corresponding to those described for the 3 class-CNN.
The SEM images showing conceptacles were the major contributors to the success of the classification task in each model (Figure 4). Except for the 4 class-CNN, the exact classification was significantly favored by crystallites as well, which represented almost half of the total number of SEM images in the dataset (Table 3, Figure 4). In the 2 class-CNN, besides crystallites and conceptacles, high percentages of images correctly classified were achieved by the epithallus (71%, the highest value), and the hypothallus. Conversely, in the 3 class-CNN, the epithallus, together with the surface, led to the most incorrect classifications (Figure 4). Crystallites further increased in significance, as well as conceptacles. In the 4 class-CNN, the accuracy decreased and a reduced number of images showing the perithallus, the surface and the crystallites had correctly been classified (Figure 4). Conceptacles represented the most robust category for the classification success (90% of images correctly classified), together with the hypothallus which kept the same significance across models (67%).

3.2. External Test

In Table 4, we show the Class Share for the two test samples, namely DB865 and DB866. Considering the 2 class-CNN model, we notice how the two samples are classified in a similar way by identifying around 70% of the images in both samples belonging to the Others class. This approach seems to suggest that the two samples do not belong to the L. pseudoracemus class.
In the 3 class-CNN approach, the model is convincing in assigning the images of the two samples to the Lithophyllum genus. Specifically, for the DB866, more than 90% of the images are classified in that class, while for DB865 around 80% of the images are classified as Lithophyllum sp., and the remaining 20% to Lithothamnion sp. class.
Finally, in the 4 class-CNN, species level classification, again there is a high similarity between the two samples. In both cases, DB865 and DB866 images are assigned to L. racemus (around 50%) and L. pseudoracemus (around 30% each), while 20% of DB865 are identified as belonging to the L. corallioides species and less than 10% of the images are assigned to the L. corallioides and M. philippii for sample DB866. The highest Class Share is achieved by the L. racemus class with 54% (sample DB866).
These findings are in line with the expert evaluation of samples DB865 and DB866, which were identified as L. cf. racemus, being impossible to clearly discriminate between L. racemus and L. pseudoracemus without molecular data. Nevertheless, the 4 class-CNN model favored the L. racemus class over L. pseudoracemus (around 50% versus 30%).

Morphological Categories Analysis

In the 2 class-CNN most of the SEM images showing the L. cf. racemus samples DB865 and DB866 were classified in the class Others, with very similar percentages (68% and 69%, respectively as shown in Table 4). All the conceptacles were assigned to this class, as well as most of the images showing crystallites and the epithallus, with a lower percentage for the crystallites in sample DB866 (67%) (Table 5 and Table 6). Most of the images showing the perithallus were rather classified as L. pseudoracemus, this is particularly true in the sample DB866. In this sample, also the image showing the surface was assigned to L. pseudoracemus class (Table 6). The n.c. images showing the perithallial cells in the proximity of a pore canal in sample DB865 have been assigned to the Others class. In sample DB865, an image showing both the epithallus and the crystallites was identified as belonging to L. pseudoracemus (Table 5).
At the genus level, most of the images of samples DB865 and DB866 were correctly classified as Lithophyllum sp. (82% and 92%, respectively, as shown in Table 4). The classification was correct for all categories in sample DB866, while the conceptacle in sample DB865 was, surprisingly, assigned to Lithothamnion sp. (Table 5 and Table 6).
At species-level, most of the images of samples DB865 and DB866 were assigned to L. racemus and L. pseudoracemus, with a higher percentage for the first class (Table 4). All the conceptacles were identified as belonging to L. racemus, as well as crystallites, especially for sample DB865. The images of the perithallus were rather classified as L. pseudoracemus, with a higher probability in DB866 (Table 5 and Table 6). The epithallus in both samples was identified as L. corallioides, while the surface was assigned to the L. pseudoracemus class in DB866. In sample DB865, all the images showing more than one category were classified as L. pseudoracemus (Table 5). Every shared image showed the epithallus, two with also the crystallites and one with the surface.

3.3. Explanation

Image analyses using explainable artificial intelligence allowed us to detect the areas more relevant to CNN classification.
Each explanation approach used highlighted different areas of the image by showing positive and negative contributions (LIME), a heat map of the positive contributions (Grad-CAM), or simply the more relevant pixels (Saliency) (Figure 5). In some cases, the information given by the three approaches was counterintuitively different, due to the differences in the calculation of the outputs. For this reason, the visualization of the three explanatory techniques together could provide more insights into the relevant features displayed in the images.
Given the complexity of the structures shown in the SEM dataset, it was not always possible to recognize common diagnostic structures. Nevertheless, in most cases, the shape of cells and conceptacles were identified by the models (Figure A2). In images showing the epithallus and the perithallus, background areas and starch grains (Figure A2) sometimes “disturbed” the classification, resulting in erroneous identifications. The model performances could, therefore, be implemented by avoiding the use of images containing these interferences.
Notably, crystallites and cell wall calcification, in general, have been considered to be important features for the classification task. Figure 5, which was correctly classified in all three models used by the Internal validation (2, 3 and 4 class-CNNs), shows an example of L. corallioides crystallites in the perithallial cell walls of two adjacent cells. LIME, Saliency and Grad-CAM approaches (Figure 5) consistently revealed a significant contribution of the primary calcification [59,60], i.e., the outermost calcified layer of the cell wall composed by crystallites oriented parallel to the cell lumen, also called “interfilament”, at the boundary between cell filaments [61]. Thus, this calcification feature appeared to have a particular significance for the classification task, as already observed recently by Auer and Piller [21], and Bracchi et al. [60].

4. Discussion

The main goal of this work was to explore a new putative tool for coralline algae identification, by applying deep learning methods to the automatic classification of four algal species common in Mediterranean waters.
Species identification in this taxon is often ambiguous, and advances in molecular phylogeny revealed striking cases of cryptic and pseudocryptic species. The traditional morphological approach to taxonomic identification relies on thallus organization and on the morphometrical measurements of biological structures, including epithallial, perithallial and hypothallial cells and conceptacles. Besides the uncertainty related to the classification based solely on these tools (e.g., L. racemus and L. pseudoracemus) [16], in fossil samples, where molecular techniques cannot be applied, traditional morphological parameters are often poorly preserved due to diagenetic processes, which reduce their taxonomic value. Recently, new attention has arisen on the calcification patterns of coralline algae, revealing the cell wall ultrastructure as the phenotypic expression of genotypic information [21]. Indeed, there is a taxon-specific regulation of the morphology of crystallites composing the cell wall, also observed at the genus level [60].
The use of CNNs has offered the opportunity to investigate the diagnostic value of morphology as a whole, including both traditional parameters and the mineralized ultrastructure. In doing so, machine learning has played the role of an unbiased operator, which could establish its own classification features and possibly suggest to the real operator significant diagnostic parameters, even more than conventional ones.
The analysis of the different explanatory techniques allowed us to highlight the image areas that have most influenced identification at both genus and species levels. Concerning the morphology of biological structures, an elementary description of the species is given as follows: L. corallioides is often sterile lacking conceptacles, it has rectangular perithallial cells connected by multiple fusions and the epithallus is characterized by multiple layers of flattened cells, typically flared in the first layer below the surface [12]. M. philippii has a thick coaxial hypothallus and a single layer of rounded to flattened epithallial cells. The perithallial cells commonly present cell fusions and the buried multiporate sporangial conceptacles, hemispherical in shape, are typically infilled with large, irregular cells [11,32]. In L. racemus and L. pseudoracemus, sporangial conceptacles are rounded and uniporate, secondary pit connections join the perithallial cells of adjacent cell filaments and there can be up to five layers of flattened epithallial cells [16,22]. The two Lithophyllum spp. have been unequivocally distinguished from each other only by molecular tools so far since the morphological approach was poorly effective. Therefore, the specific classification task involving their discrimination was particularly challenging. From an ultrastructural point of view, the cell walls in Lithothamnion corallioides are constituted by flattened squared bricks with roundish outlines in the secondary calcification and rectangular tiles in the primary calcification [60]. The secondary calcification in Lithophyllum sp. is organized in perpendicular rods, while the primary calcification presents rhombohedral crystallites [21]. Mesophyllum sp. cell wall ultrastructure has never been specifically characterized. Thanks to the explanation comparison, we recognized some traditional morphological parameters, such as conceptacle and cells morphometry (Figure A2), but also the crystallite morphology undoubtedly contributed to the outcomes of the classification (Figure 5). A particular relevance, indeed, was given to crystallites, which alone constituted almost half of the total images used to run the CNN models. Concerning the identification of the two L. cf. racemus samples, DB865 and DB866, the model agreed with the expert on attributing the Lithophyllum sp. class in the 3 class-CNN and was leaning towards L. racemus in the 4 class-CNN.
To maximize the species variance, we included in the dataset the images for each specimen (two/three samples per species) (Table 1). By doing so, we reduced the error related to the features characterizing the sample more than the species itself. To achieve satisfying classification performances, intra-class variability is required to be lower than inter-class variability. However, in our case increasing the number of classes led to a decrease in inter-class variability (due to the two similar classes L. racemus and L. pseudoracemus). This was clearly not balanced by an increase of intra-class variability and, thus, led to lower performance.
It is essential to remark that the SEM images used were not taken specifically for the purpose of this work. Indeed, while in the 4 class-CNN the number of images among classes was reasonably balanced, in the 3 class-CNN the Lithophyllum sp. class accounted for more than half the total number of images, potentially favoring the accuracy of its classification. Nevertheless, even accounting for about one-third of the total images, the Class Recall of L. pseudoracemus in the 2 class-CNN was similar to the class Others (60%, Table 2). Therefore, the model proved to be able to identify some morphological features of L. pseudoracemus, as suggested by a Class Recall value much higher (60%) than both the performances of the dummy classifier (27%) and, most notably, the human classifier (21%) (Table 2).
Future experimentation on CNNs applied to SEM imagery for the identification of coralline algae should better rely on standard magnifications for SEM images within each morphological category, with an even distribution of the number of images among classes. We propose the following standards:
  • Conceptacles: ~250×, ~500×;
  • Perithallus: ~1000×, ~2500×, ~5000×;
  • Crystallites: ~10000×, ~20000×, ~30000×;
  • Epithallus: ~1000×, ~2500×, ~5000×;
  • Hypothallus: ~250×; ~1000×;
  • Surface: ~1000×.
Variable sample orientation should be carefully avoided, and the collection of SEM images should be carried out on longitudinal sections, as explained in Section 2.1. Overall, our performances offered promising results for obtaining a useful model that could support the expert for the classification of coralline algae, also considering the reduced number of images and samples, and the high intra-class variability. Further investigations should involve an image dataset wider and standardized, to guarantee the reproducibility of the method and enhance model accuracies.

Author Contributions

Conceptualization, G.P.; software and formal analysis, G.P., C.V. and G.S.; data curation, G.P.; writing—original draft preparation, G.P.; writing—review and editing, C.V., G.S. and G.P.; supervision, G.S. All authors have read and agreed to the published version of the manuscript.

Funding

Some algal samples used in this study were collected in the framework of “Convenzione MATTM-CNR per i Programmi di Monitoraggio per la Direttiva sulla Strategia Marina (MSFD, Art. 11, Dir. 2008/56/CE)”. G.P. was funded by a doctoral fellowship in Environmental Sciences of the University of Milano-Bicocca.

Institutional Review Board Statement

Ethical review and approval were waived for this study, because it had no risk for human rights or welfare.

Data Availability Statement

The full SEM dataset is not publicly available. The model scripts are available on GitHub https://github.com/CValsecchi/VGG16_SEM (accessed on 19 November 2021).

Acknowledgments

Our gratitude goes to the anonymous referees whose insightful comments enabled us to make significant improvements to the paper. We are grateful to Daniela Basso, Valentina Alice Bracchi, Guido Bressan, Luigi Piazzi and Francesco Mastrototaro for sample collections. The captain, crew, and scientific staff of the RV Minerva Uno cruise STRATEGIA MARINA LIGURE-TIRRENO are acknowledged for their efficient and skillful cooperation at sea. We also thank Giovanni Coletti for his collaboration as human classifier.

Conflicts of Interest

The authors declare no conflict of interest.

Appendix A

Figure A1. Examples of SEM images that were not assigned to a specific category: (a) Lithophyllum racemus pore canal; (b) a magnification showing perithallial cells near the pore canal. These features proved to be significant contributors to the correct classification of Lithophyllum spp. in the 2 and 3 class-CNNs.
Diversity 13 00640 g0a1
Figure A2. LIME, Saliency and Grad-CAM techniques show the pixels giving the major contributions to CNN classification: (a) magnification of the epithallial cell wall in Lithophyllum racemus evidence the significant contribution of calcification, formed by rod-shaped crystallites; (b) Mesophyllum philippii conceptacle shape focused by Saliency; (c) starch grains within the perithallial cells of L. racemus did not hamper correct identification; (d) the background beyond the epithallus of Lithothamnion corallioides was likely responsible for the erroneous classification of this image.
Diversity 13 00640 g0a2

References

  1. Bracchi, V.A.; Basso, D.; Marchese, F.; Corselli, C.; Savini, A. Coralligenous morphotypes on subhorizontal substrate: A new categorization. Cont. Shelf Res. 2017, 144, 10–20. [Google Scholar] [CrossRef]
  2. Cebrián, E.; Ballesteros, E.; Canals, M. Shallow rocky bottom benthic assemblages as calcium carbonate producers in the Alboran Sea (Southwestern Mediterranean). Oceanol. Acta 2000, 23, 311–322. [Google Scholar] [CrossRef] [Green Version]
  3. Basso, D. Production carbonatée par les algues rouges calcaires et changement climatique global. Geodiversitas 2012, 34, 13–33. [Google Scholar] [CrossRef]
  4. Ballesteros, E. Mediterranean coralligenous assemblages: A synthesis of present knowledge. Oceanogr. Mar. Biol. 2006, 44, 123–195. [Google Scholar] [CrossRef]
  5. Basso, D.; Nalin, R.; Massari, F. Genesis and composition of the Pleistocene coralligène de plateau of the Cutro Terrace (Calabria, Southern Italy). Neues Jahrb. Geol. Palaontol. Abh. 2007, 244, 173–182. [Google Scholar] [CrossRef]
  6. Bracchi, V.A.; Nalin, R.; Basso, D. Morpho-structural heterogeneity of shallow-water coralligenous in a Pleistocene marine terrace (Le Castella, Italy). Palaeogeogr. Palaeoclimatol. Palaeoecol. 2016, 454, 101–112. [Google Scholar] [CrossRef]
  7. Basso, D.; Morbioli, C.; Corselli, C. Rhodolith facies evolution and burial as a response to Holocene transgression at the Pontian islands shelf break. Geol. Soc. Spec. Publ. 2006, 255, 23–34. [Google Scholar] [CrossRef]
  8. Bracchi, V.A.; Nalin, R.; Basso, D. Paleoecology and dynamics of coralline dominated facies during a Pleistocene transgressive-regressive cycle (Capo Colonna marine terrace, Southern Italy). Palaeogeogr. Palaeoclimatol. Palaeoecol. 2014, 414, 296–309. [Google Scholar] [CrossRef]
  9. Darrenougue, N.; de Deckker, P.; Eggins, S.; Payri, C. Sea-surface temperature reconstruction from trace elements variations of tropical coralline red algae. Quat. Sci. Rev. 2014, 93, 34–46. [Google Scholar] [CrossRef]
  10. Coletti, G.; Basso, D.; Corselli, C. Coralline algae as depth indicators in the Sommières Basin (Early Miocene, Southern France). Geobios 2018, 51, 15–30. [Google Scholar] [CrossRef]
  11. Basso, D. Study of living calcareous algae by a paleontological approach: The non-geniculate Corallinaceae (Rhodophyta) of the soft bottoms of the Tyrrhenian Sea (Western Mediterranean). The genera Phymatolithon Foslie and Mesophyllum Lemoine. Riv. Ital. Di Paleontol. Stratigr. 1995, 100, 575–596. [Google Scholar]
  12. Basso, D. Living calcareous algae by a paleontological approach: The genus Lithothamnion Heydrich Nom. Cons. from the soft bottoms of the Tyrrhenian Sea (Mediterranean). Riv. Ital. Di Paleontol. Stratigr. 1995, 101, 349–366. [Google Scholar] [CrossRef]
  13. Cabioch, J.; Mendoza, M.L. Mesophyllum Alternans (Foslie) Comb. Nov. (Corallinales, Rhodophyta), a Mediterraneo-Atlantic species, and new considerations on the Lithothamnion philippii Foslie complex. Phycologia 1998, 37, 208–221. [Google Scholar] [CrossRef]
  14. Adey, W.H.; Mcintyre, I.G. Crustose coralline algae: A re-evaluation in the geological sciences. Geol. Soc. Am. Bull. 1973, 84, 883–904. [Google Scholar] [CrossRef]
  15. Garbary, J.D. An introduction to the Scanning Electron Microscopy of red algae. In Modern Approaches to the Taxonomy of Red and Brown Algae; Academic Press: Cambridge, MA, USA, 1978; pp. 205–222. [Google Scholar]
  16. Caragnano, A.; Rodondi, G.; Basso, D.; Peña, V.; Gall, L.; Rindi, F. Circumscription of Lithophyllum racemus (Corallinales, Rhodophyta) from the Western Mediterranean Sea reveals the species Lithophyllum pseudoracemus sp. nov. Phycologia 2020, 59, 584–597. [Google Scholar] [CrossRef]
  17. Pezzolesi, L.; Peña, V.; le Gall, L.; Gabrielson, P.W.; Kaleb, S.; Hughey, J.R.; Rodondi, G.; Hernandez-Kantun, J.J.; Falace, A.; Basso, D.; et al. Mediterranean Lithophyllum stictiforme (Corallinales, Rhodophyta) is a genetically diverse species complex: Implications for species circumscription, biogeography and conservation of coralligenous habitats. J. Phycol. 2019, 55, 473–492. [Google Scholar] [CrossRef]
  18. De Jode, A.; David, R.; Haguenauer, A.; Cahill, A.E.; Erga, Z.; Guillemain, D.; Sartoretto, S.; Rocher, C.; Selva, M.; le Gall, L.; et al. From seascape ecology to population genomics and back. Spatial and ecological differentiation among cryptic species of the red algae Lithophyllum stictiforme/L. cabiochiae, main bioconstructors of coralligenous habitats. Mol. Phylogenetics Evol. 2019, 137, 104–113. [Google Scholar] [CrossRef] [PubMed] [Green Version]
  19. Rösler, A.; Perfectti, F.; Peña, V.; Braga, J.C. Phylogenetic relationships of Corallinaceae (Corallinales, Rhodophyta): Taxonomic implications for reef-building corallines. J. Phycol. 2016, 52, 412–431. [Google Scholar] [CrossRef] [PubMed]
  20. Kato, A.; Baba, M.; Suda, S. Revision of the Mastophoroideae (Corallinales, Rhodophyta) and polyphyly in nongeniculate species widely distributed on Pacific coral reefs. J. Phycol. 2011, 47, 662–672. [Google Scholar] [CrossRef] [PubMed]
  21. Auer, G.; Piller, W.E. Nanocrystals as phenotypic expression of genotypes-An example in coralline red algae. Sci. Adv. 2020, 6, eaay2126. [Google Scholar] [CrossRef] [Green Version]
  22. Basso, D.; Fravega, P.; Vannucci, G. Fossil and living corallinaceans related to the Mediterranean endemic species Lithophyllum racemus (Lamarck) Foslie. Facies 1996, 35, 275–292. [Google Scholar] [CrossRef]
  23. Basso, D.; Babbini, L.; Kaleb, S.; Bracchi, V.A.; Falace, A. Monitoring deep Mediterranean rhodolith beds. Aquat. Conserv. Mar. Freshw. Ecosyst. 2016, 26, 549–561. [Google Scholar] [CrossRef] [Green Version]
  24. Basso, D. Deep rhodolith distribution in the Pontian islands, Italy: A model for the paleoecology of a temperate sea. Palaeogeogr. Palaeoclimatol. Palaeoecol. 1998, 137, 173–187. [Google Scholar] [CrossRef]
  25. Foster, M.S. Rhodoliths: Between rocks and soft places. J. Phycol. 2001, 37, 659–667. [Google Scholar] [CrossRef]
  26. Basso, D.; Babbini, L.; Ramos-Esplá, A.A.; Salomidi, M. Mediterranean rhodolith beds. Coast. Res. Libr. 2017, 15, 281–298. [Google Scholar] [CrossRef]
  27. Carro, B.; Lopez, L.; Peña, V.; Bárbara, I.; Barreiro, R. DNA barcoding allows the accurate assessment of European maerl diversity: A proof-of-concept study. Phytotaxa 2014, 190, 176–189. [Google Scholar] [CrossRef] [Green Version]
  28. Potin, P.; Floc’h, J.Y.; Augris, C.; Cabioch, J. Annual growth rate of the calcareous red alga Lithothamnion corallioides (Corallinales, Rhodophyta) in the Bay of Brest, France. Hydrobiologia 1990, 204, 263–267. [Google Scholar] [CrossRef]
  29. Savini, A.; Basso, D.; Bracchi, V.A.; Corselli, C.; Pennetta, M. Cartographie du maërl et quantification de la production carbonatée sur les terrasses sous-marines au large de la péninsule du Cilento (Mer Tyrrhénienne, Italie). Geodiversitas 2012, 34, 77–98. [Google Scholar] [CrossRef]
  30. Martin, S.; Castets, M.D.; Clavier, J. Primary production, respiration and calcification of the temperate free-living coralline alga Lithothamnion corallioides. Aquat. Bot. 2006, 85, 121–128. [Google Scholar] [CrossRef]
  31. Irvine, L.M.; Chamberlain, Y. Seaweeds of the British isles: Volume 1 Rhodophyta. Part 2B Corallinales, Hildenbrandiales; Natural History Museum: London, UK, 1994; 284p. [Google Scholar]
  32. Peña, V.; de Clerck, O.; Afonso-Carrillo, J.; Ballesteros, E.; Bárbara, I.; Barreiro, R.; le Gall, L. An integrative systematic approach to species diversity and distribution in the genus Mesophyllum (Corallinales, Rhodophyta) in Atlantic and Mediterranean Europe. Eur. J. Phycol. 2015, 50, 20–36. [Google Scholar] [CrossRef]
  33. Park, J.-H.; Hwang, K.-B.; Park, H.-M.; Choi, Y.-K. Application of CNN for fish species classification. J. Korea Inst. Inf. Commun. Eng. 2019, 23, 39–46. [Google Scholar] [CrossRef]
  34. Rathi, D.; Jain, S.; Indu, S. Underwater fish species classification using Convolutional Neural Network and Deep Learning. In Proceedings of the 9th International Conference on Advances in Pattern Recognition 2018, Bangalore, India, 23–27 December 2017; pp. 344–349. [Google Scholar] [CrossRef] [Green Version]
  35. Kiel, S. Assessing bivalve phylogeny using Deep Learning and computer vision approaches. bioRxiv 2021. [Google Scholar] [CrossRef]
  36. De Lima, R.P.; Welch, K.F.; Barrick, J.E.; Marfurt, K.J.; Burkhalter, R.; Cassel, M.; Soreghan, G.S. Convolutional Neural Networks as an aid to biostratigraphy and micropaleontology: A test on Late Paleozoic microfossils. Palaios 2020, 35, 391–402. [Google Scholar] [CrossRef]
  37. Liu, X.; Song, H. Automatic identification of fossils and abiotic grains during carbonate microfacies analysis using Deep Convolutional Neural Networks. Sediment. Geol. 2020, 410, 105790. [Google Scholar] [CrossRef]
  38. Modarres, M.H.; Aversa, R.; Cozzini, S.; Ciancio, R.; Leto, A.; Brandino, G.P. Neural Network for nanoscience Scanning Electron Microscope image recognition. Sci. Rep. 2017, 7, 1–12. [Google Scholar] [CrossRef] [Green Version]
  39. Adey, W.H.; McKibbin, D.L. Studies on the maerl species Phymatolithon calcareum (Pallas) nov. comb. and Lithothamnium coralloides Crouan in the Ria de Vigo. Bot. Mar. 1970, 13, 100–106. [Google Scholar] [CrossRef]
  40. Shorten, C.; Khoshgoftaar, T.M. A survey on image Data Augmentation for Deep Learning. J. Big Data 2019, 6, 60. [Google Scholar] [CrossRef]
  41. Hecht-Nielsen, R. Theory of the Backpropagation Neural Network. Int. Jt. Conf. Neural Netw. 1989, 1, 593–605. [Google Scholar] [CrossRef]
  42. Liu, Q.; Zhang, N.; Yang, W.; Wang, S.; Cui, Z.; Chen, X.; Chen, L. A review of image recognition with Deep Convolutional Neural Network. In Intelligent Computing Theories and Application; Lecture Notes in Computer Science (including subseries Lecture Notes in Artificial Intelligence and Lecture Notes in Bioinformatics); Springer: Cham, Switzerland, 2017; Volume 10361 LNCS, pp. 69–80. [Google Scholar] [CrossRef]
  43. Wang, L.; Zhang, K.; Liu, X.; Long, E.; Jiang, J.; An, Y.; Zhang, J.; Liu, Z.; Lin, Z.; Li, X.; et al. Comparative analysis of image classification methods for automatic diagnosis of ophthalmic images. Sci. Rep. 2017, 7, 41545. [Google Scholar] [CrossRef] [PubMed] [Green Version]
  44. Goodfellow, I.; Bengio, Y.; Courville, A. Deep Learning; MIT Press: Cambridge, MA, USA, 2016; 800p. [Google Scholar]
  45. Abdalla, A.; Cen, H.; Wan, L.; Rashid, R.; Weng, H.; Zhou, W.; He, Y. Fine-Tuning Convolutional Neural Network with Transfer Learning for semantic segmentation of ground-level oilseed rape images in a field with high weed pressure. Comput. Electron. Agric. 2019, 167, 105091. [Google Scholar] [CrossRef]
  46. Deng, Y.; Lu, L.; Aponte, L.; Angelidi, A.M.; Novak, V.; Karniadakis, G.E.; Mantzoros, C.S. Deep Transfer Learning and Data Augmentation improve glucose levels prediction in type 2 diabetes patients. NPJ Digit. Med. 2021, 4, 1–13. [Google Scholar] [CrossRef] [PubMed]
  47. Simonyan, K.; Zisserman, A. Very Deep Convolutional Networks for large-scale image recognition. arXiv 2014, arXiv:1409.1556. [Google Scholar]
  48. Deng, J.; Dong, W.; Socher, R.; Li, L.-J.; Li, K.; Li, F. ImageNet: A large-scale hierarchical image database. In Proceedings of the IEEE Conference on Computer Vision and Pattern Recognition, Miami, FL, USA, 20–25 June 2009; pp. 248–255. [Google Scholar] [CrossRef] [Green Version]
  49. Agarap, A.F. Deep Learning Using Rectified Linear Units (ReLU). arXiv 2018, arXiv:1803.08375. [Google Scholar]
  50. Tan, P.; Steinbach, M.; Karpatne, A.; Kumar, V. Introduction to Data Mining, 2nd ed.; Addison-Wesley: Boston, MA, USA, 2018; 839p. [Google Scholar]
  51. Simonyan, K.; Vedaldi, A.; Zisserman, A. Deep inside Convolutional Networks: Visualising image classification models and Saliency Maps. arXiv 2013, arXiv:1312.6034. [Google Scholar]
  52. Ribeiro, M.T.; Singh, S.; Guestrin, C. “Why should I trust you?” Explaining the predictions of any classifier. In Proceedings of the ACM SIGKDD International Conference on Knowledge Discovery and Data Mining, San Francisco, CA, USA, 13–16 August 2016; Association for Computing Machinery: New York, NY, USA, 2016; Volume 13–17, pp. 1135–1144. [Google Scholar]
  53. Selvaraju, R.R.; Cogswell, M.; Das, A.; Vedantam, R.; Parikh, D.; Batra, D. Grad-CAM: Visual explanations from Deep Networks via gradient-based localization. arXiv 2016, arXiv:1611.07450. [Google Scholar] [CrossRef] [Green Version]
  54. Chollet, F. Keras, GitHub. Available online: https://github.com/fchollet/keras (accessed on 19 November 2021).
  55. Kotikalapudi, R.; Contributors. Keras-Vis, GitHub. Available online: https://github.com/raghakot/keras-vis (accessed on 19 November 2021).
  56. Abadi, M.; Agarwal, A.; Barham, P.; Brevdo, E.; Chen, Z.; Citro, C.; Corrado, G.S.; Davis, A.; Dean, J.; Devin, M.; et al. TensorFlow: Large-scale Machine Learning on heterogeneous distributed systems. arXiv 2015, arXiv:1603.04467. [Google Scholar]
  57. Hsiang, A.Y.; Brombacher, A.; Rillo, M.C.; Mleneck-Vautravers, M.J.; Conn, S.; Lordsmith, S.; Jentzen, A.; Henehan, M.J.; Metcalfe, B.; Fenton, I.S.; et al. Endless Forams: >34,000 modern planktonic foraminiferal images for taxonomic training and automated species recognition using Convolutional Neural Networks. Paleoceanogr. Paleoclimatology 2019, 34, 1157–1177. [Google Scholar] [CrossRef] [Green Version]
  58. Mitra, R.; Marchitto, T.M.; Ge, Q.; Zhong, B.; Kanakiya, B.; Cook, M.S.; Fehrenbacher, J.S.; Ortiz, J.D.; Tripati, A.; Lobaton, E. Automated species-level identification of planktic foraminifera using Convolutional Neural Networks, with comparison to human performance. Mar. Micropaleontol. 2019, 147, 16–24. [Google Scholar] [CrossRef]
  59. Flajs, G. Skeletal structures of some calcifying algae. In Fossil Algae; Springer: Berlin/Heidelberg, Germany, 1977; pp. 225–231. [Google Scholar] [CrossRef]
  60. Bracchi, V.A.; Piazza, G.; Basso, D. A stable ultrastructural pattern despite variable cell size in Lithothamnion corallioides. Biogeosciences 2021, 18, 6061–6076. [Google Scholar] [CrossRef]
  61. Nash, M.C.; Adey, W. Multiple phases of Mg-calcite in crustose coralline algae suggest caution for temperature proxy and ocean acidification assessment: Lessons from the ultrastructure and biomineralization in Phymatolithon (Rhodophyta, Corallinales). J. Phycol. 2017, 53, 970–984. [Google Scholar] [CrossRef] [PubMed]
Figure 1. SEM images showing: (a) a longitudinal section through Mesophyllum philippii coaxial hypothallus assigned to the hypothallus category; (b) a longitudinal section through Lithophyllum racemus epithallus (curly bracket) with the underlying perithallus assigned to both perithallus and epithallus categories; (c) a magnification of L. racemus perithallial cells showing crystallites composing the cell walls (crystallites category); (d) a Lithophyllum pseudoracemus sample in surface view (surface category).
Diversity 13 00640 g001
Figure 2. Examples of augmented images of a Lithophyllum racemus conceptacle given the original image in the first position (upper left).
Diversity 13 00640 g002
Figure 3. Adapted architecture from Visual Geometry Group 16 (VGG16).
Diversity 13 00640 g003
Figure 4. Total number of SEM images assigned to different categories that have been classified in the 2, 3 and 4 class-CNNs. Percentages within each category indicate the proportion between images correctly and wrongly classified.
Diversity 13 00640 g004
Figure 5. An example of the output obtained from the three approaches (LIME, Saliency, Grad-CAM) that show the pixels giving the major contributions to the CNN classification in the different models used (2, 3 and 4 class-CNNs). In LIME, positive and negative contributions to classification are respectively colored in green and red. In Saliency, brighter color highlights the pixels contributing the most to the class attribution, while in the Grad-CAM visualization the most significant areas for the final classification have a warmer color tone. The SEM image was successfully classified as Lithothamnion corallioides by every model and shows a magnification of the cell wall ultrastructure (crystallites category).
Diversity 13 00640 g005
Table 1. Summary of the samples used, site of collection, and the number of SEM images per sample.
SampleSpeciesSampling Site
(Latitude, Longitude)
Images (n)
iv1Lithothamnion corallioidesVillasimius, Sardinia (Italy)
(39°08′32″ N, 9°31′14″ E)
24
iv2 Morlaix, Brittany (France)
(48°34′42″ N, 3°49′36″ W)
25
iv3Mesophyllum philippiiPortofino, Liguria (Italy)
(44°17′56″ N, 9°13′08″ E)
11
iv4 Capraia, Tuscany (Italy)
(43°01′04″ N, 9°46′26″ E)
14
iv5 Cavoli Island, Sardinia (Italy)
(39°05′20″ N, 9°32′33″ E)
16
iv6Lithophyllum racemusPontian Islands (Italy)
(40°54′47″ N, 12°52′58″ E)
24
iv7 Capri, Gulf of Naples (Italy)
(40°34′08″ N, 14°13′32″ E)
43
iv8Lithophyllum pseudoracemusPontian Islands (Italy)
(40°11′43″ N, 12°53′07″ E)
9
iv9 Villasimius, Sardinia (Italy)
(39°08′32″ N, 9°31′14″ E)
48
DB865Lithophyllum cf. racemus Santa Catarina, Rovinj (Croatia)
(45°04′32″ N, 13°37′38″ E)
28
DB866 Torre dell’Orso, Puglia (Italy)
(40°14′00″ N, 18°28′00″ E)
13
Table 2. Model performances in the 3 classification tasks: L. pseudoracemus versus the other species (2 classes); diverse genera (3 classes) and diverse species (4 classes). The Global accuracy is shown, as well as the Class Recall for each class for the proposed approach (CNN), for the human classifier (HC) and dummy classifiers (DC).
2 classes3 classes4 classes
Class Recall Class Recall Class Recall
CNNHCDC CNNHCDC CNNHCDC
L. pseudoracemus0.610.210.27Lithothamnion sp.0.550.730.23L. corallioides0.570.730.23
Others0.620.920.73Mesophyllum sp.0.560.410.19M. philippii0.490.410.19
Lithophyllum sp.0.690.420.58L. racemus0.460.330.31
L. pseudoracemus0.370.210.27
Global accuracy0.610.730.62 0.640.490.43 0.480.400.27
Table 3. The total number of SEM images in each class (columns) and categories (rows) according to the three modeling approaches (L. pseudoracemus versus other species, diverse genera, and diverse species) is listed, together with the Class Recall. Images not assigned to a category (n.c.) and showing more than one category (shared) are also included.
2 class-CNN
L. pseudoracemusOthers
Category Images (n)Class RecallImages (n)Class Recall
conceptacles11.0090.56
perithallus70.14320.53
crystallites270.70670.61
epithallus100.70240.71
hypothallus0-30.67
surface50.6070.57
n.c.21.0040.75
shared50.40110.73
3 class-CNN
Lithothamnion sp.Mesophyllum sp.Lithophyllum sp.
CategoryImages (n)Class RecallImages (n)Class RecallImages (n)Class Recall
conceptacles0-40.7560.67
perithallus200.6530.33160.44
crystallites140.57130.38670.85
epithallus120.4250.20170.47
hypothallus0-30.670-
surface20.5040.5060.17
n.c.0-11.0050.80
shared10.0081.0070.57
4 class-CNN
L. corallioidesM. philippiiL. racemusL. pseudoracemus
Category Images (n)Class RecallImages (n)Class RecallImages (n)Class RecallImages (n)Class Recall
conceptacles0-41.0050.8011.00
perithallus200.6030.3390.2270.00
crystallites140.71130.00400.48270.37
epithallus120.5050.2070.57100.70
hypothallus0-30.670-0-
surface20.0040.7510.0050.40
n.c.0-11.0030.3320.00
shared10.0081.0020.5050.20
Table 4. Class Share for the L. cf. racemus samples (DB865, DB866) in the 3 classification tasks: L. pseudoracemus versus Others (2 class-CNN), diverse genera (3 class-CNN), and diverse species (4 class-CNN).
2 class-CNN
Sample DB865Sample DB866
L. pseudoracemus0.320.31
Others0.680.69
3 class-CNN
Sample DB865Sample DB866
Lithothamnion sp.0.180.00
Mesophyllum sp.0.000.08
Lithophyllum sp.0.820.92
4 class-CNN
Sample DB865Sample DB866
L. corallioides0.180.08
M. philippii0.000.08
L. racemus0.500.54
L. pseudoracemus0.320.30
Table 5. The Class Share of sample DB865 has been reported for each assigned category (rows) and class (columns). The total number of SEM images in every predicted class of the three models (L. pseudoracemus versus other species, genus level and species level) are listed. Images not assigned to a category (n.c.) and showing more than one category (shared) are also included.
DB8652 class-CNN
CategoryImages (n)L. pseudoracemusOthers
conceptacles10.001.00
perithallus30.670.33
crystallites120.170.83
epithallus50.200.80
hypothallus0--
1 surface20.500.50
n.c.20.500.50
shared30.670.33
3 class-CNN
Category Images (n)Lithothamnion sp.Mesophyllum sp.Lithophyllum sp.
conceptacles11.000.000.00
perithallus30.330.000.67
crystallites120.000.001.00
epithallus50.400.000.60
1 surface20.500.000.50
n.c.20.000.001.00
shared 0.000.001.00
4 class-CNN
CategoryImages (n)L. corallioidesM. philippiiL. racemusL. pseudoracemus
conceptacles10.000.001.000.00
perithallus30.330.000.000.67
crystallites120.000.000.830.17
epithallus50.800.000.200.00
1 surface20.000.000.500.50
n.c.20.000.000.500.50
shared30.000.000.001.00
1 no hypothallus in the sample DB865.
Table 6. The Class Share of the sample DB866 was reported for each assigned category (rows) and class (columns). The total number of SEM images in every predicted class of the three models is listed. Images not assigned to a category (n.c.) and showing more than one category (shared) are also included.
DB8662 class-CNN
CategoryImages (n)L. pseudoracemusOthers
conceptacles20.001.00
perithallus21.000.00
crystallites30.330.67
epithallus10.001.00
hypothallus0--
1 surface11.000.00
n.c.20.001.00
shared20.001.00
3 class-CNN
Category Images (n)Lithothamnion sp.Mesophyllum sp.Lithophyllum sp.
conceptacles20.000.001.00
perithallus20.000.001.00
crystallites30.000.001.00
epithallus10.000.001.00
1 surface10.000.001.00
n.c.20.000.001.00
shared20.000.500.50
4 class-CNN
CategoryImages (n)L. corallioidesM. philippiiL. racemusL. pseudoracemus
conceptacles20.000.001.000.00
perithallus20.000.000.001.00
crystallites30.000.000.670.33
epithallus11.000.000.000.00
1 surface10.000.000.001.00
n.c.20.000.001.000.00
shared20.000.500.500.00
1 no hypothallus in sample DB866.
Publisher’s Note: MDPI stays neutral with regard to jurisdictional claims in published maps and institutional affiliations.

