Article

Characterization of the Multidimensional Functional Space of the Aquatic Macroinvertebrate Assemblages in a Biosphere Reserve (Central México)

by
Alexis Joseph Rodríguez-Romero
1,
Axel Eduardo Rico-Sánchez
2,
Jacinto Elías Sedeño-Díaz
3 and
Eugenia López-López
1,*
1
Laboratorio de Evaluación de la Salud de los Ecosistemas Acuáticos, Escuela Nacional de Ciencias Biológicas, Instituto Politécnico Nacional, Prolongación de Carpio y Plan de Ayala s/n, Col. Santo Tomás, Miguel Hidalgo C.P., Ciudad de México 11340, Mexico
2
Programa de Hidrociencias, Colegio de Postgraduados, Km 35.5 Carretera México-Texcoco, Texcoco 56230, Mexico
3
Coordinación Politécnica para la Sustentabilidad, Instituto Politécnico Nacional, Av. Instituto Politécnico Nacional s/n, Esq. Wilfrido Massieu, Col. San Pedro Zacatenco, Gustavo A. Madero C.P., Ciudad de México 07738, Mexico
*
Author to whom correspondence should be addressed.
Diversity 2021, 13(11), 546; https://doi.org/10.3390/d13110546
Submission received: 30 September 2021 / Revised: 19 October 2021 / Accepted: 22 October 2021 / Published: 29 October 2021
(This article belongs to the Special Issue Aquatic Insects: Biodiversity, Ecology and Conservation Challenges)

Abstract

:
The analysis of functional diversity has shown to be more sensitive to the effects of natural and anthropogenic disturbances on the assemblages of aquatic macroinvertebrates than the classical analyses of structural ecology. However, this ecological analysis perspective has not been fully explored in tropical environments of America. Protected Natural Areas (PNAs) such as biosphere reserves can be a benchmark regarding structural and functional distribution patterns worldwide, so the characterization of the functional space of biological assemblages in these sites is necessary to promote biodiversity conservation efforts. Our work characterized the multidimensional functional space of the macroinvertebrate assemblages from an ecosystemic approach by main currents, involving a total of 15 study sites encompassing different impact and human influence scenarios, which were monitored in two contrasting seasons. We calculated functional diversity indices (dispersion, richness, divergence, evenness, specialization, and originality) from biological and ecological traits of the macroinvertebrate assemblages and related these indices to the physicochemical characteristics of water and four environmental indices (Water Quality Index, habitat quality, Normalized Difference Vegetation Index, and vegetation cover and land use). Our results show that the indices of functional richness, evenness, and functional specialization were sensitive to disturbance caused by salinization, concentration of nutrients and organic matter, and even to the occurrence of a forest fire in the reserve during one of the sampling seasons. These findings support the conclusion that the changes and relationships between the functional diversity indices and the physicochemical parameters and environmental indices considered were suitable for evaluating the ecological conditions within the reserve.

1. Introduction

Freshwater ecosystems are considered the most threatened natural systems globally since water is extracted from them to meet human needs [1]. These ecosystems have diverse natural, economic, cultural, aesthetic, and scientific resource values, among others [2]; they are considered biological diversity hotspots because they are home to approximately 10% of the known species worldwide [3]. However, freshwater ecosystems are affected by water extraction, flow regulation, wastewater discharges, overfishing, invasion of exotic species, and climate change, all of which degrade freshwater bodies and threat biodiversity [4]. In addition, biodiversity in the New World is far from being extensively known from a taxonomical standpoint. Nowadays, biodiversity loss is on the rise due to severe disturbances at regional and global scales [5]. This will likely lead to massive extinction rates, particularly in Protected Natural Areas (PNAs) such as the Sierra Gorda Reserve Biosphere (SGRB), where multiple species may disappear over a short period of time. This may be related to the impact of tourism, local mining extraction and the pollution associated with it, and the presence of invasive species [6].
The maintenance of aquatic ecosystems depends on physical, chemical, and biological processes sustained by different groups of organisms [7]. Aquatic macroinvertebrates play key functions in these ecosystems, participating in processes associated with energy flow across food webs in their roles as herbivores, predators, and filter-feeders. In addition, they participate in the decomposition of detritus and the mineralization of nutrients [8], and are consumed as food by other trophic levels [9]. The loss of species and biological resources, including macroinvertebrates, impairs the functioning and services supplied by aquatic ecosystems [10].
The analysis of functional diversity has shown to be more sensitive to the effects of natural and anthropogenic disturbances on aquatic macroinvertebrate assemblages than the classical analyses of structural ecology [8]. Little is known about how the functional diversity of macroinvertebrates changes with the characteristics of aquatic systems, particularly in the intertropical regions of America [11]. In these environments, some studies have investigated the composition and taxonomic diversity of macroinvertebrate assemblages [12], as well as the environmental conditions, in various rivers [13]. However, diversity measures such as the number of species do not contribute to understanding the functional traits or functional diversity of these assemblages. In the context of functional diversity, it is relevant to know how the functional traits of macroinvertebrates depend on the characteristics of rivers, especially if the aim is to maintain the functionality of these systems and, consequently, the ecosystem services they provide. Additionally, macroinvertebrates have been used as bioindicators of water quality due to their diverse responses when facing different types of impacts. It is widely recognized that the structure of macroinvertebrate assemblages reflects their ecological condition, habitat heterogeneity, and water quality [14,15,16]. Several studies have described the trophic functional groups and their relationship with the physical and chemical characteristics of river ecosystems in intertropical regions of America [17,18,19]. However, as far as we know, few studies have addressed the effect of environmental variables on the functional traits and functional diversity of aquatic macroinvertebrate assemblages in tropical rivers of America [20,21].
Functional traits are defined as physiological, morphological, or phenological characteristics related to how organisms interact with their environment [22]. For this reason, the study of functional traits allows understanding how biological diversity and ecosystem functioning are governed by environmental conditions, and how functional diversity is affected by human activities. Furthermore, functional diversity brings information about how niche space is shared and partitioned by species within an assemblage [23]. Thus, functional composition and diversity are useful approximations to exploring ecosystem imbalances.
As one of the main megadiverse countries, Mexico has developed a strategy to conserve its multiple natural ecosystems based on the establishment of Protected Natural Areas (PNAs), including the Sierra Gorda Biosphere Reserve (SGBR). This PNA is located in the Central Plateau of Mexico, an area influenced by the two biogeographical regions converging in the Mexican territory—the Nearctic and the Neotropical regions—and is part of the so-called Transition Zone [24]. Despite its high biological diversity, this PNA is affected by anthropic activities like agriculture and mining, as well as human settlements [25]. Consequently, the SGBR comprises zones influenced by anthropogenic activities and areas with low disturbance levels, thus being an ideal region for analyzing functional diversity.
This study involved two approaches. The first explores the functional composition of aquatic macroinvertebrate assemblages, i.e., the assessment of river ecosystems in the SGBR based on multifunctional features of the components of macroinvertebrate assemblages. The other approach includes analyses of several indices that quantify the distribution of functional traits of macroinvertebrate assemblages. In both cases, the relationships with environmental (physical and chemical) parameters of the river systems in the SGBR were investigated.

2. Materials and Methods
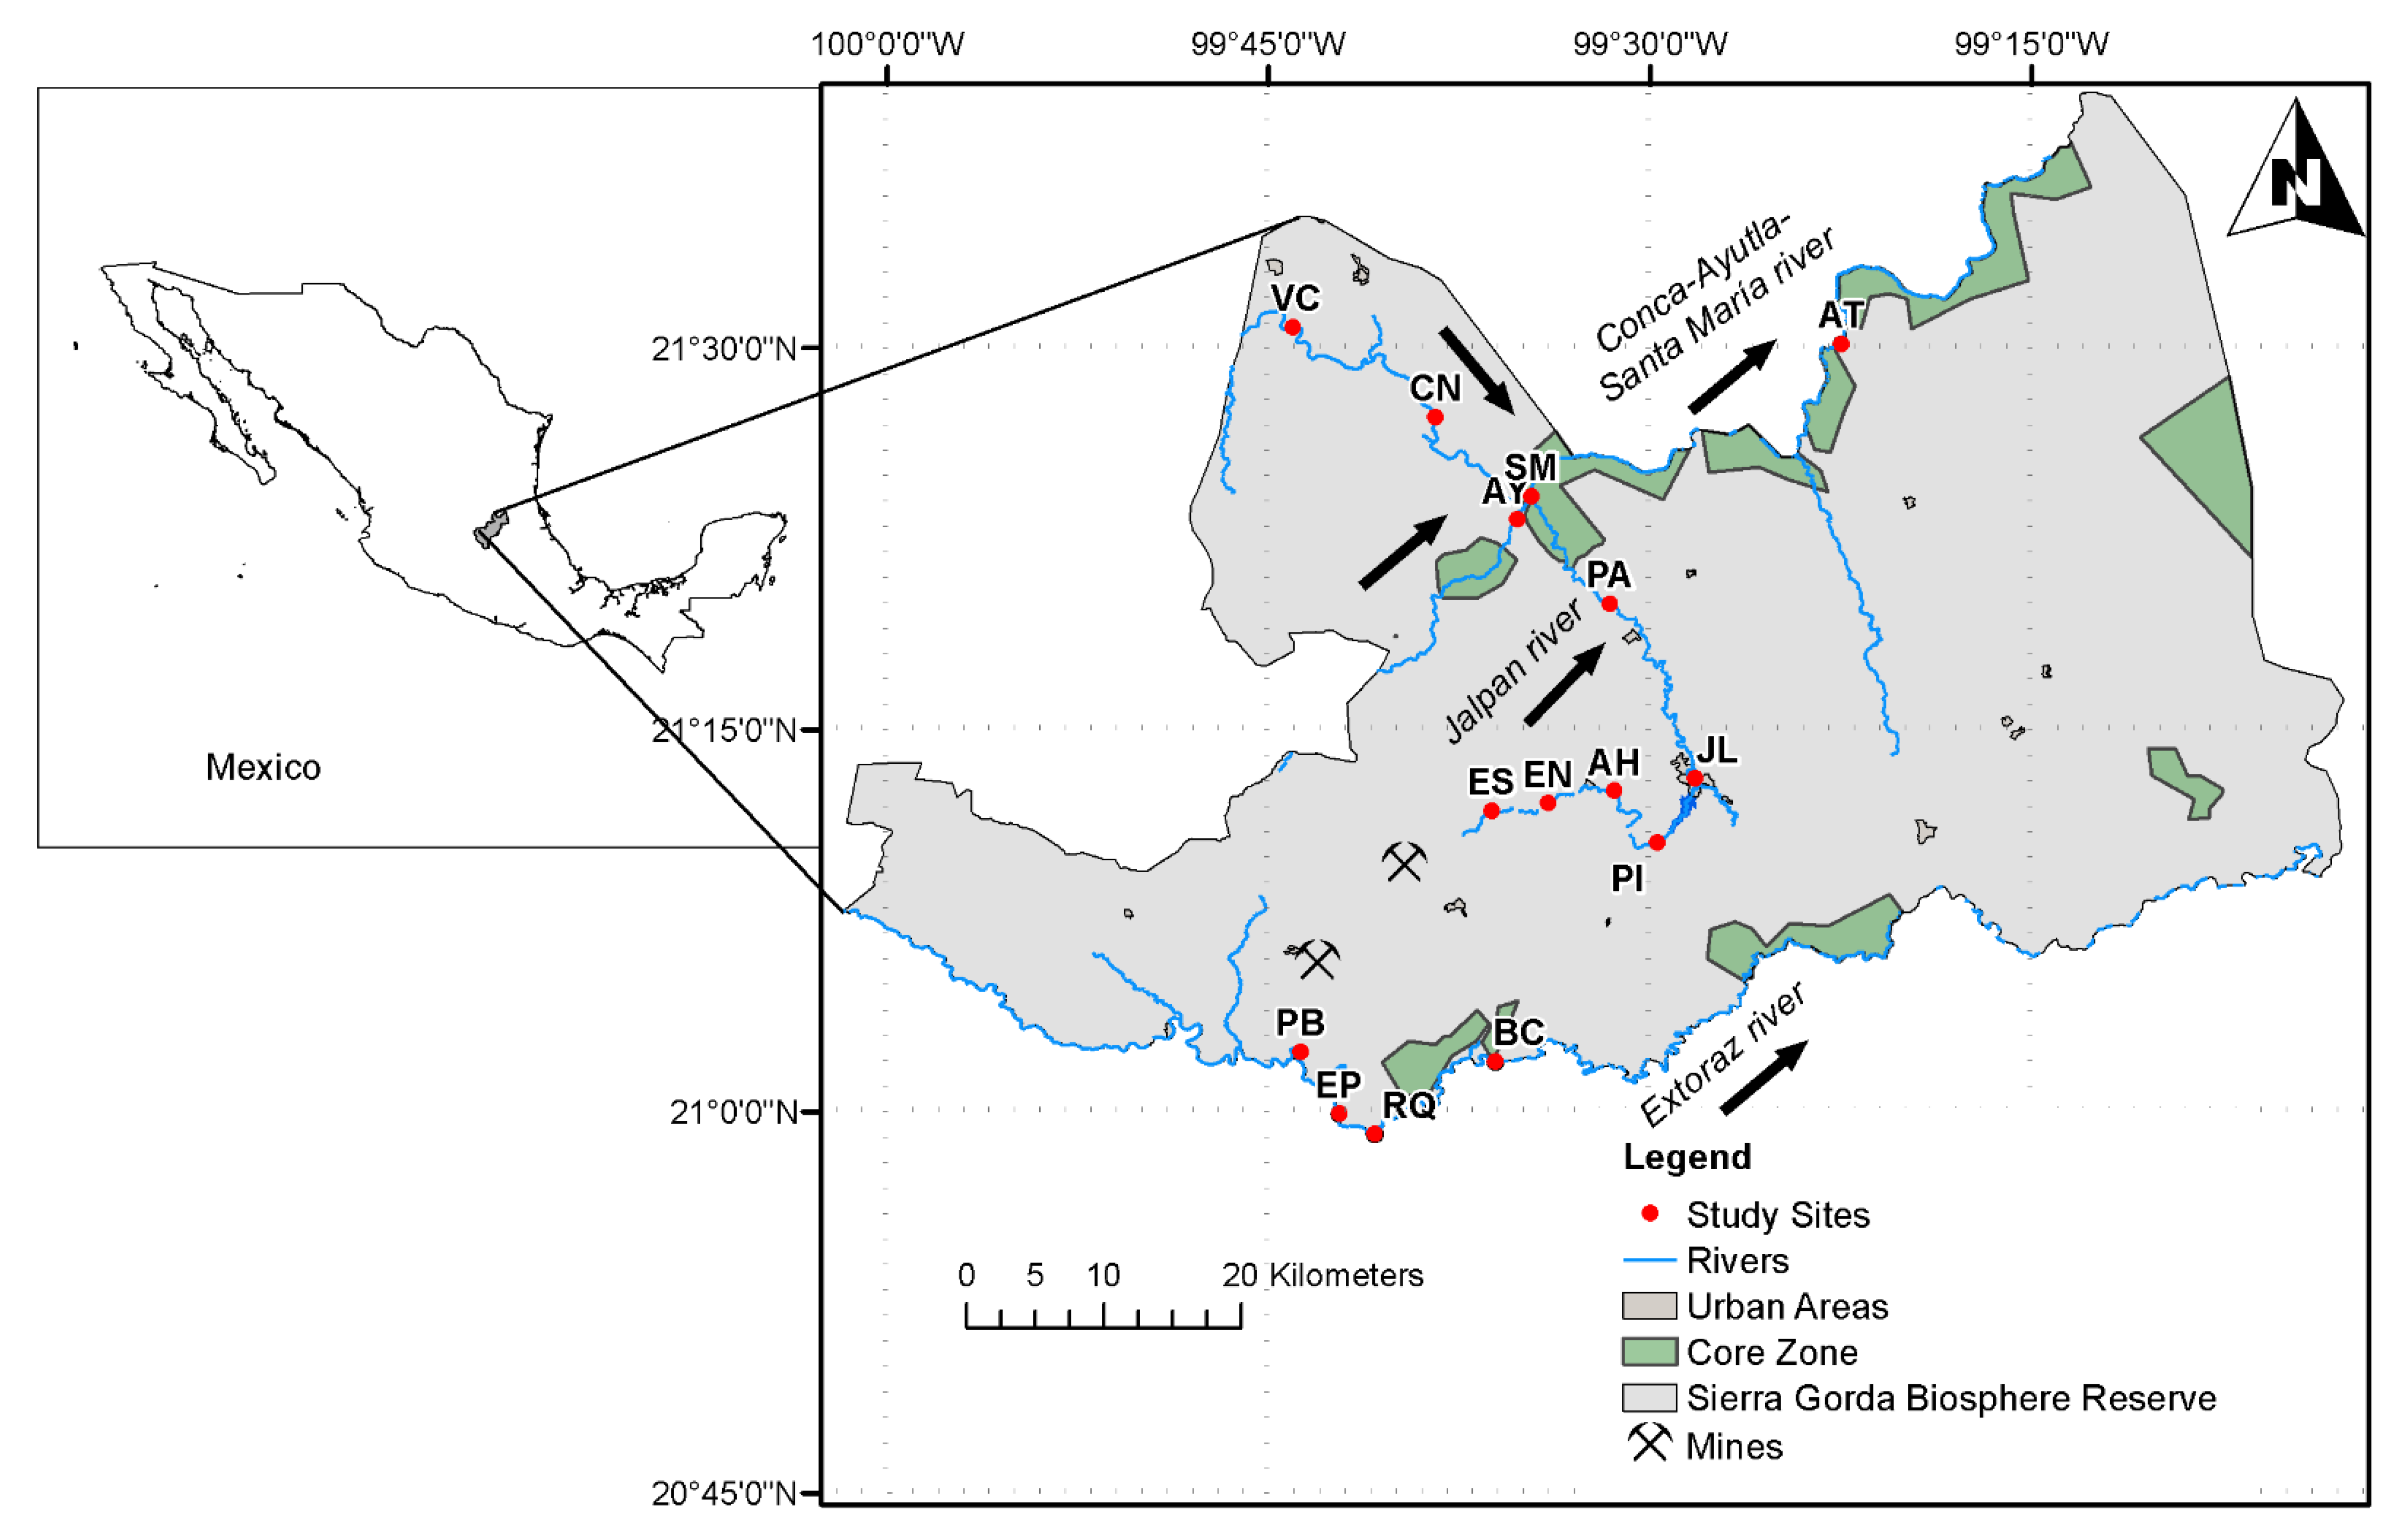
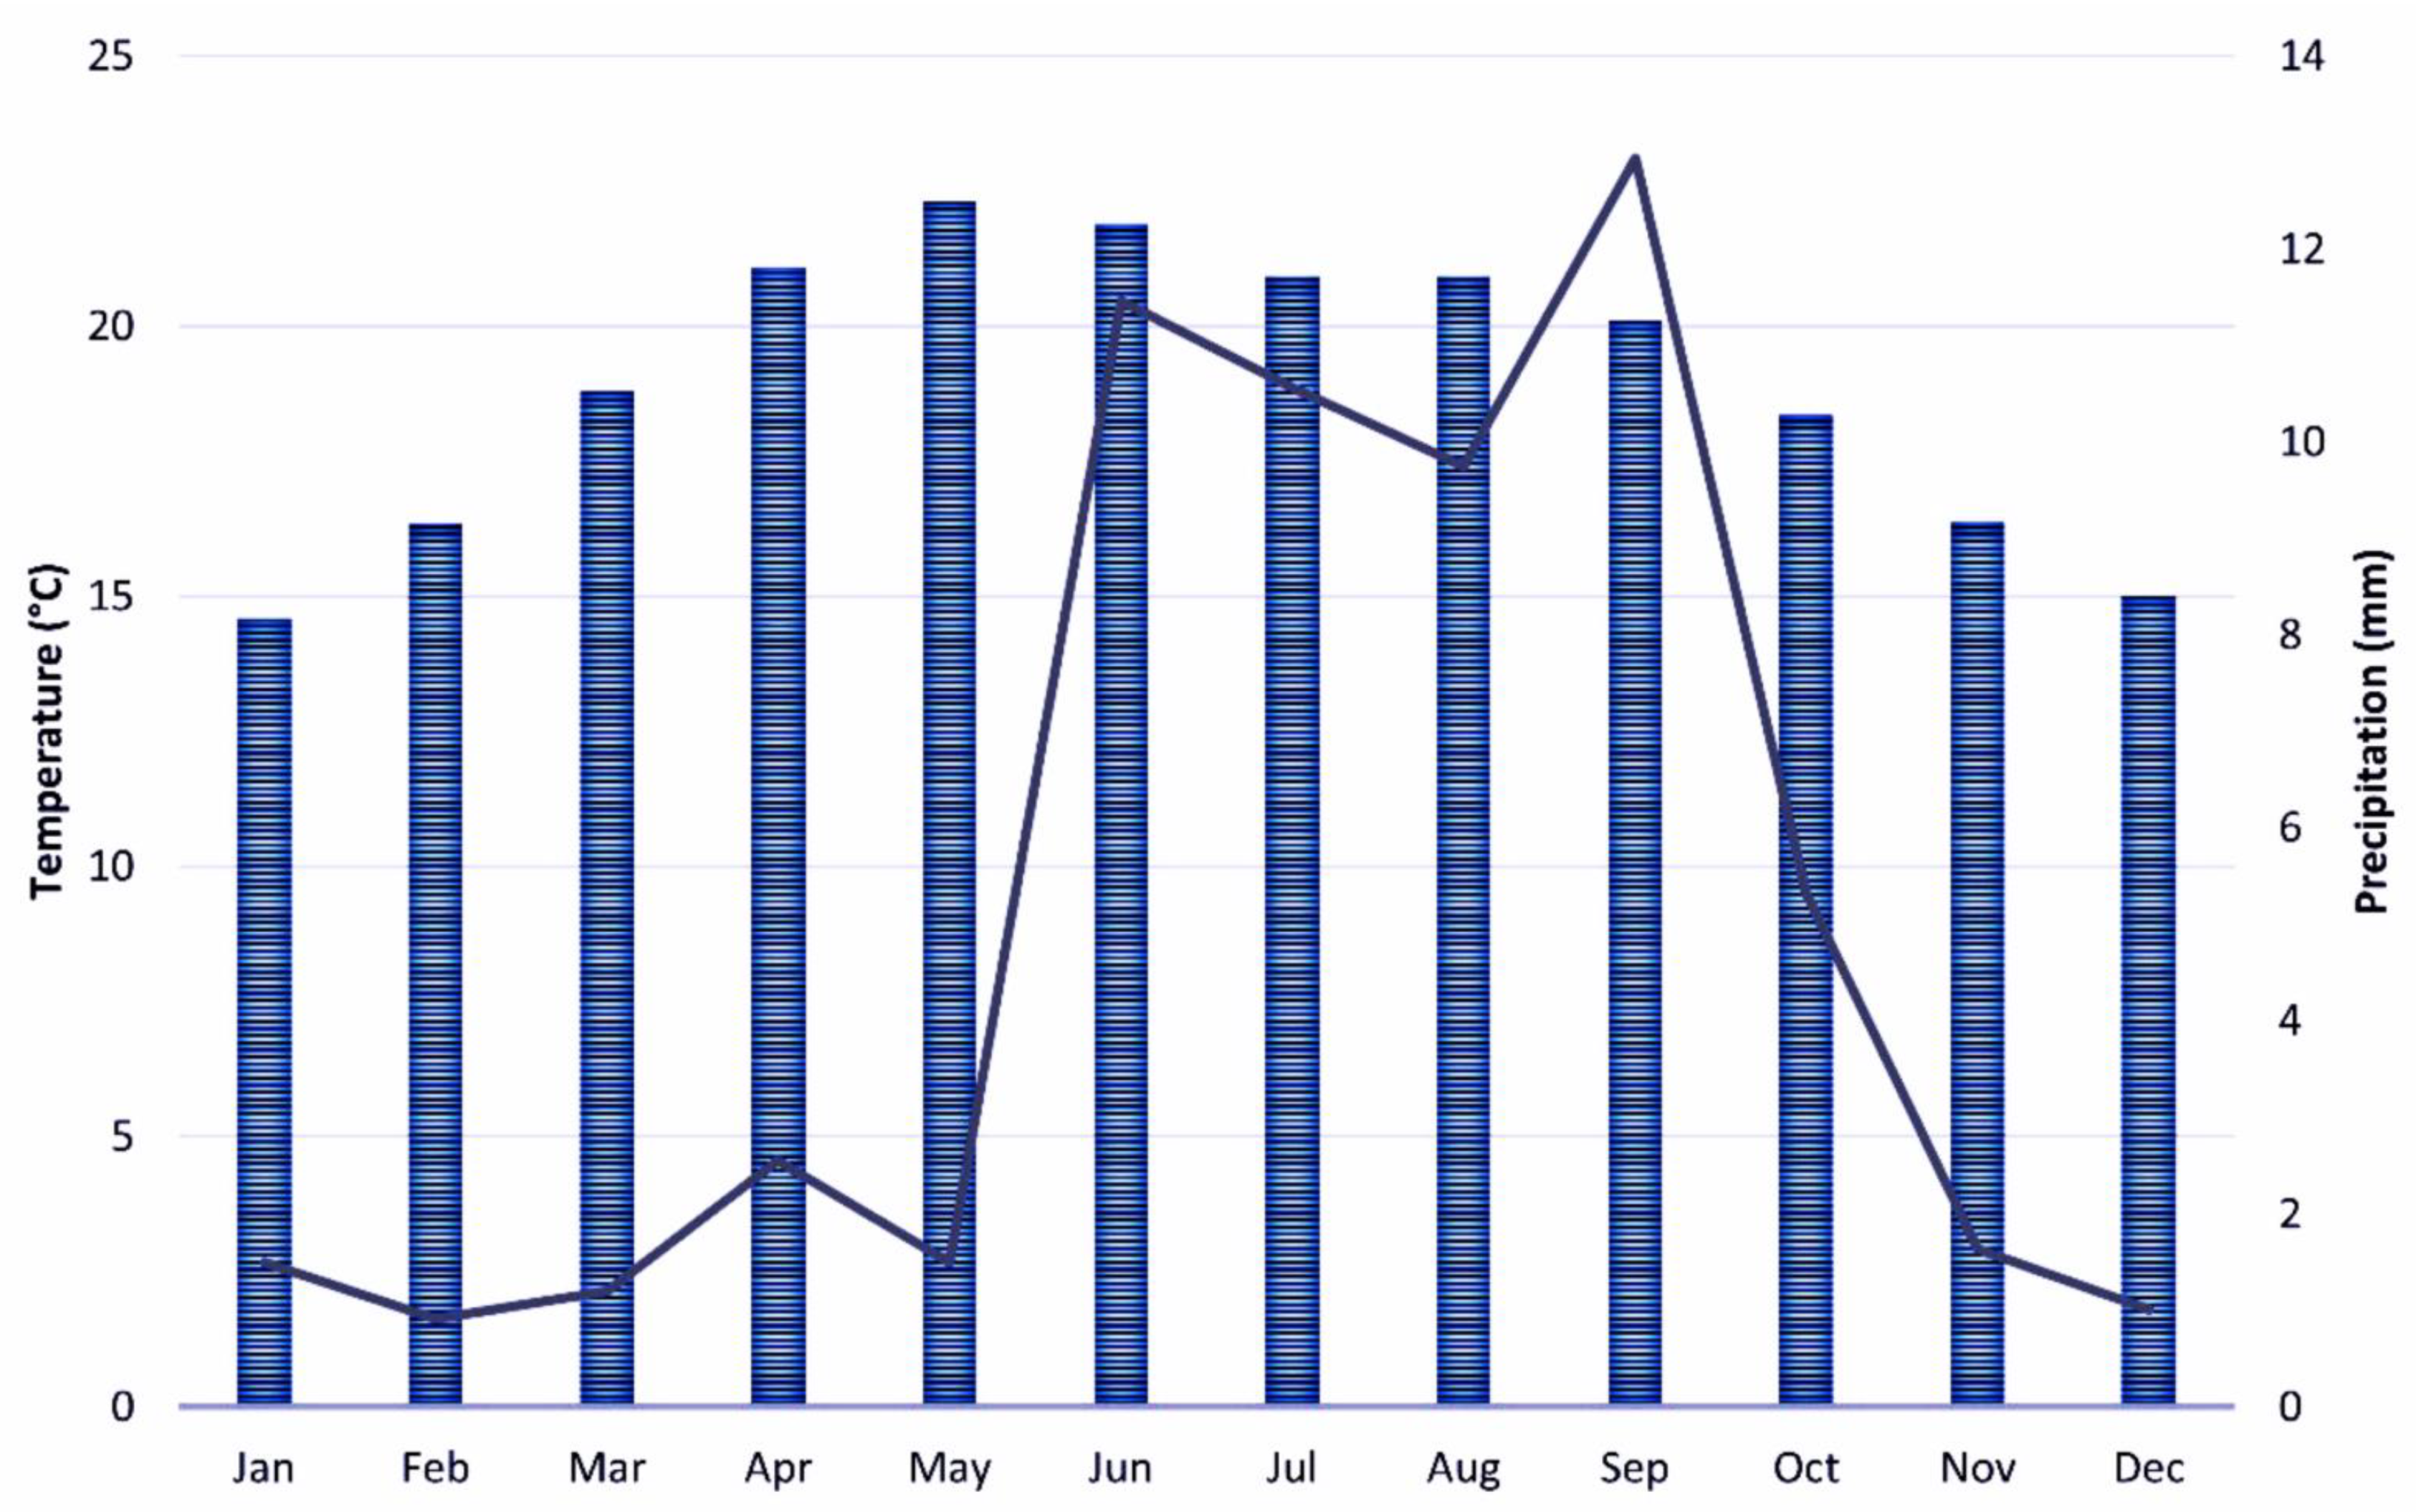
2.1. Study Area

The SGBR stretches across 3834 km2 in the Mexican Central Plateau. The Tamuín river runs through this PNA, including the Concá, Ayutla, Santa María, and Jalpan main streams (Figure 1). Moreover, a section of the Moctezuma river and the Extoraz river flow into the southern area of the reserve; both tributaries converge downstream into the Panuco river, which flows into the Gulf of Mexico. The altitude in the SGBR ranges between 300 and 3100 m a.s.l., hosting grasslands and mountain forests [26]. Since 1997, the Mexican authorities have established 11 core zones aiming to maximize the conservation of the natural conditions, which jointly represent about 7% of the total surface of the SGBR [27]. Other areas are considered buffer zones where agriculture and forestry exploitation are substantially reduced [28]. Several towns are located within the SGBR, with a total population that does not exceed 95,000 inhabitants [29] dedicated primarily to mining and agriculture. Approximately 116 mines are located in the SGBR [25].

2.2. Field Sampling and Environmental Variables

Fifteen sampling sites were selected in three main streams: Extoraz (four study sites), Jalpan (six study sites), and Concá-Ayutla-Santa María (five study sites) (Figure 1). In all the study sites, sampling and environmental monitoring were carried out in February 2017 and July 2017. In addition, the six sites along the Jalpan river, which concentrates the largest urban localities of the SGBR, were monitored in June 2019. The months monitored correspond to contrasting climatic seasons, i.e., cold dry (February 2017) and warm rainy (July 2017 and June 2019) seasons (Figure 2). In each study site, physicochemical variables were recorded in situ, such as dissolved oxygen (mg/L), oxygen saturation (%), pH, conductivity (ms/cm), salinity (UPS), suspended solids (mg/L), and temperature (°C), using a Quanta (Hydrolab)® (Sheffield, UK) multiparametric probe. Water samples were collected in 500 mL flasks in duplicate, plus a 100 mL sample placed in a Whirlpack® (Madison, USA) bag, to measure physicochemical parameters and run microbiological testing in the laboratory. Samples were transported refrigerated and protected from direct sunlight. In the laboratory, water samples were processed to determine total nitrogen (TN, mg/L), nitrites (NO2, mg/L), nitrates (NO3, mg/L), ammonia nitrogen (NH3, mg/L), sulfates (SO4, mg/L), orthophosphates (PO4, mg/L), total phosphorus (PT, mg/L), color (Pt-Co units), and total suspended solids (TSS, mg/L) using a HACH® (Sheffield, UK) DR3900 spectrophotometer (HACH, 2001), and hardness (CaCO3, mg/L) by titration. In addition, alkalinity (CaCO3, mg/L), chlorides (Cl, mg/L), biochemical oxygen demand over 5 days (BOD5, mg/L), and total and fecal coliforms (MPN/100 mL) were determined following APHA techniques [30] (Table 1).

2.3. Characterization of Sites with Environmental Indices

The protocol for characterizing habitat quality was applied in each monitoring station [31,32]. The percentage of each land use (natural vegetation, grassland, secondary vegetation, induced grassland, agriculture, and human settlements-urban areas) influencing each site was estimated inside a buffer area of 2 km upstream and 0.5 km to the sides of each study site, following the criteria of [33]. Buffer sites were set using the available information from a map of land use and vegetation at a 1:250,000 scale provided by the National Institute of Statistics and Geography of Mexico (INEGI, 2021) [34] and using the software QGIS version 3.20.3 (Open-Source Geospatial Foundation, Chicago, IL, USA). Additionally, the Normalized Difference Vegetation Index (NDVI) was calculated based on Landsat 8 OLI TIRS images from the USGS viewer [35], using the following equation [36]:
N D V I = ( B 5 B 4 ) ( B 5 + B 4 )
where B4 and B5 correspond to the bands of the Landsat 8 OLI TIRS satellite image.
In addition, the Water Quality Index proposed by [37] was calculated with the following equation:
W Q I = i = 1 n I i W i
where WQI = Water Quality Index (0 to 100); Ii = subindex of the ith parameter (0 to 100); Wi = weighting value of the ith parameter (0 to 1); n = number of parameters.

2.4. Macroinvertebrate Monitoring

Aquatic macroinvertebrates were collected using two types of sampling gear, namely, a scoop-type net (for riparian vegetation and ponds) and a kicking net (for riffles and zones with laminar and turbulent flow), both with a 500 µm mesh. Sampling was carried out according to the multi-habitat monitoring proposal [31,32], considering all the potential habitats where these organisms thrive; four replicate samples (the area in each sample was 2.5 m2) were obtained, two for each collection method, with a sampling effort of 10–20 min per study site. The macroinvertebrates sampled were preserved in 70% ethanol, and the identification and quantification of each taxon were carried out at family level (refer to the Table S1 of Supplementary Material). The functional diversity analysis was performed at family level following [38], which found that functional attributes based on biological and ecological traits, such as type of feeding, reproductive strategy, and trophic status, were strongly correlated with the composition of the assemblages at family level (ρ = 0.64–0.85). These attributes indicate that taxonomic sufficiency was universally applicable within taxonomic groups for different habitats within a biogeographical region, and that aggregation to family or order was adequate to quantify biodiversity and environmental gradients. The identification was based on specialized taxonomic keys [39,40,41] and using a Nikon® (Tokio, Japan) SMZ 745T stereo microscope.

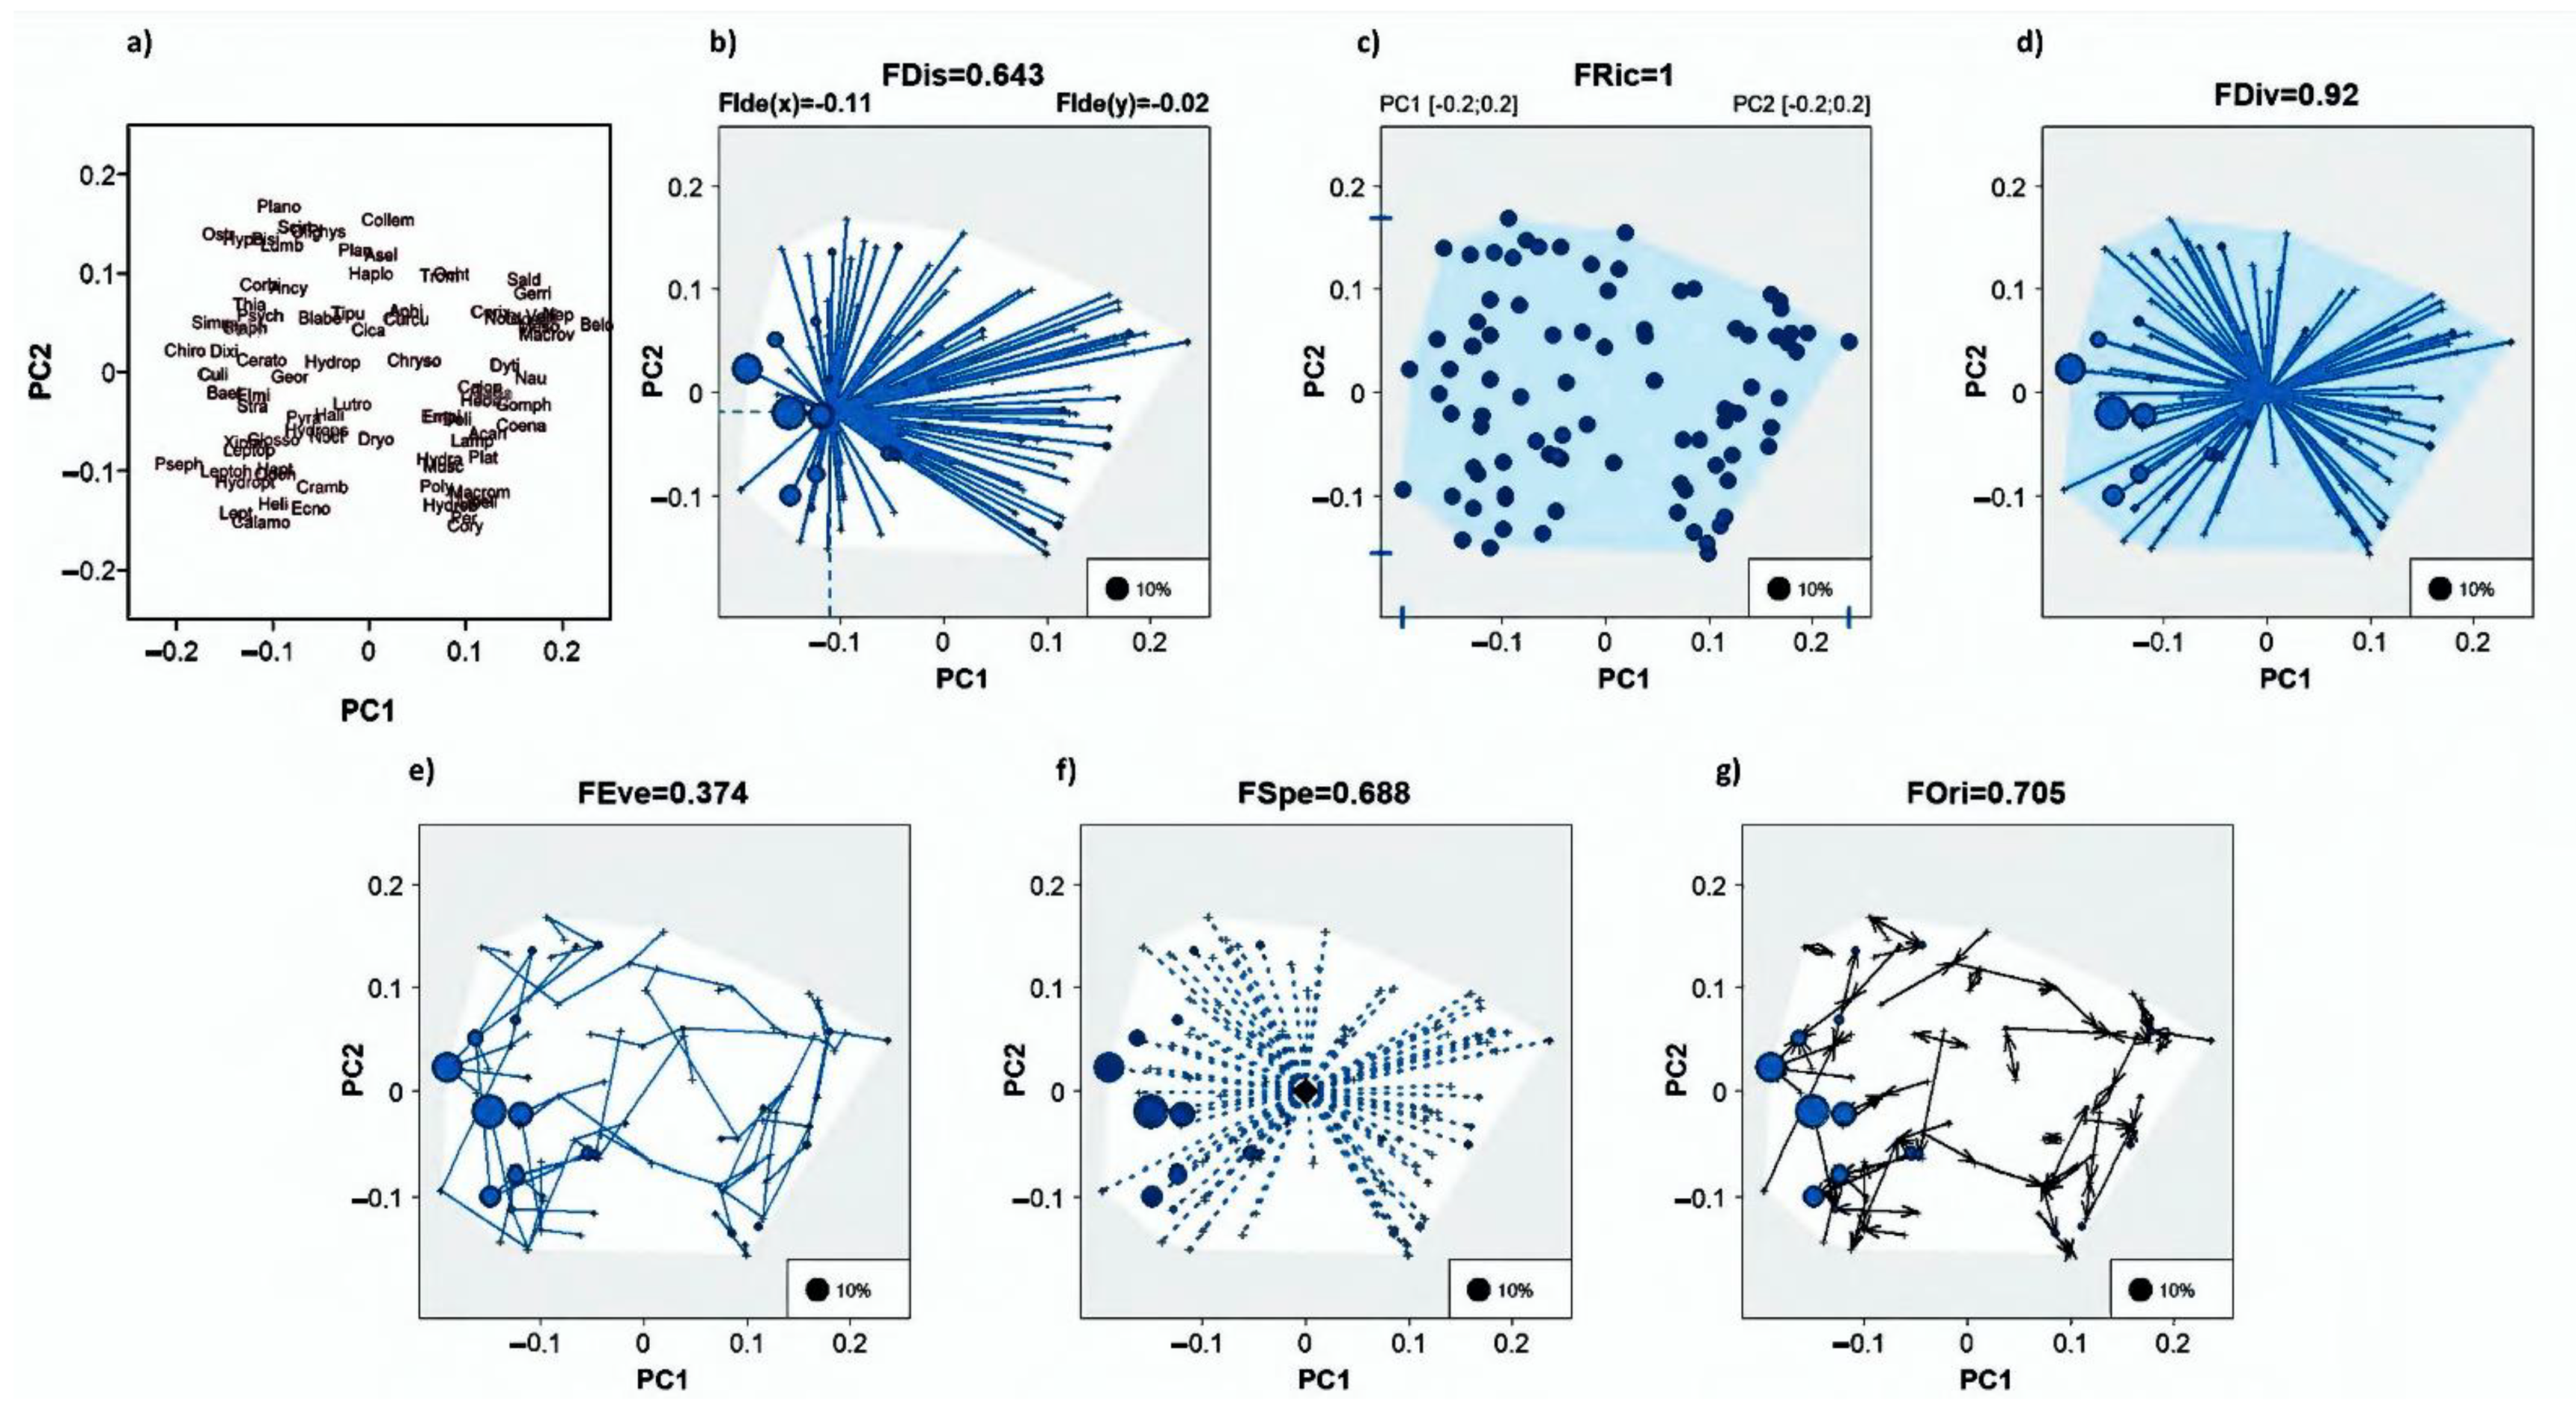
2.5. Characterization of the Multifunctional Space

Functional diversity was calculated from the combination of two matrices. The first included the abundances of taxa throughout study sites, streams, and sampling seasons; the second considered four ecological traits (food availability, cross-sectional distribution, habitat preference, and tolerance) and six biological traits (life cycle, life stage, respiratory mode, nutritional status, functional group, and body size) obtained from databases and published works [42,43,44,45] (refer to the Table S2 of Supplementary Material). Traits were coded using a ‘fuzzy’ approach, in which a value given to each trait category indicates whether the taxon has no (0), weak (1), moderate (2), or strong (3) affinity for the trait. Affinities were determined based on observations (taxon-specific information from the literature) [42,43,44,45]. Fuzzy coding can incorporate intra-taxon variability when trait profiles differ between genera within a family, early and late stages of a species, or individuals of a species living in different environments [46]. Six functional diversity indices were calculated from the multidimensional space of the features, considering the relative abundance of each taxon: Functional dispersion (FDis), Functional richness (FRic), Functional divergence (FDiv), Functional evenness (FEve), Functional specialization (FEsp), and Functional originality (FOri). An increase in FDis, FRic, and FDiv values indicates a greater amplitude of the niche space occupied by the taxa and a broader divergence in the distribution of abundances across the niche space [23]. The multidimensional space of traits was constructed, and functional diversity indices were calculated from the R script proposed by [5,47], available at: http://villeger.sebastien.free.fr/Rscripts.html (accessed on 6 September 2021).

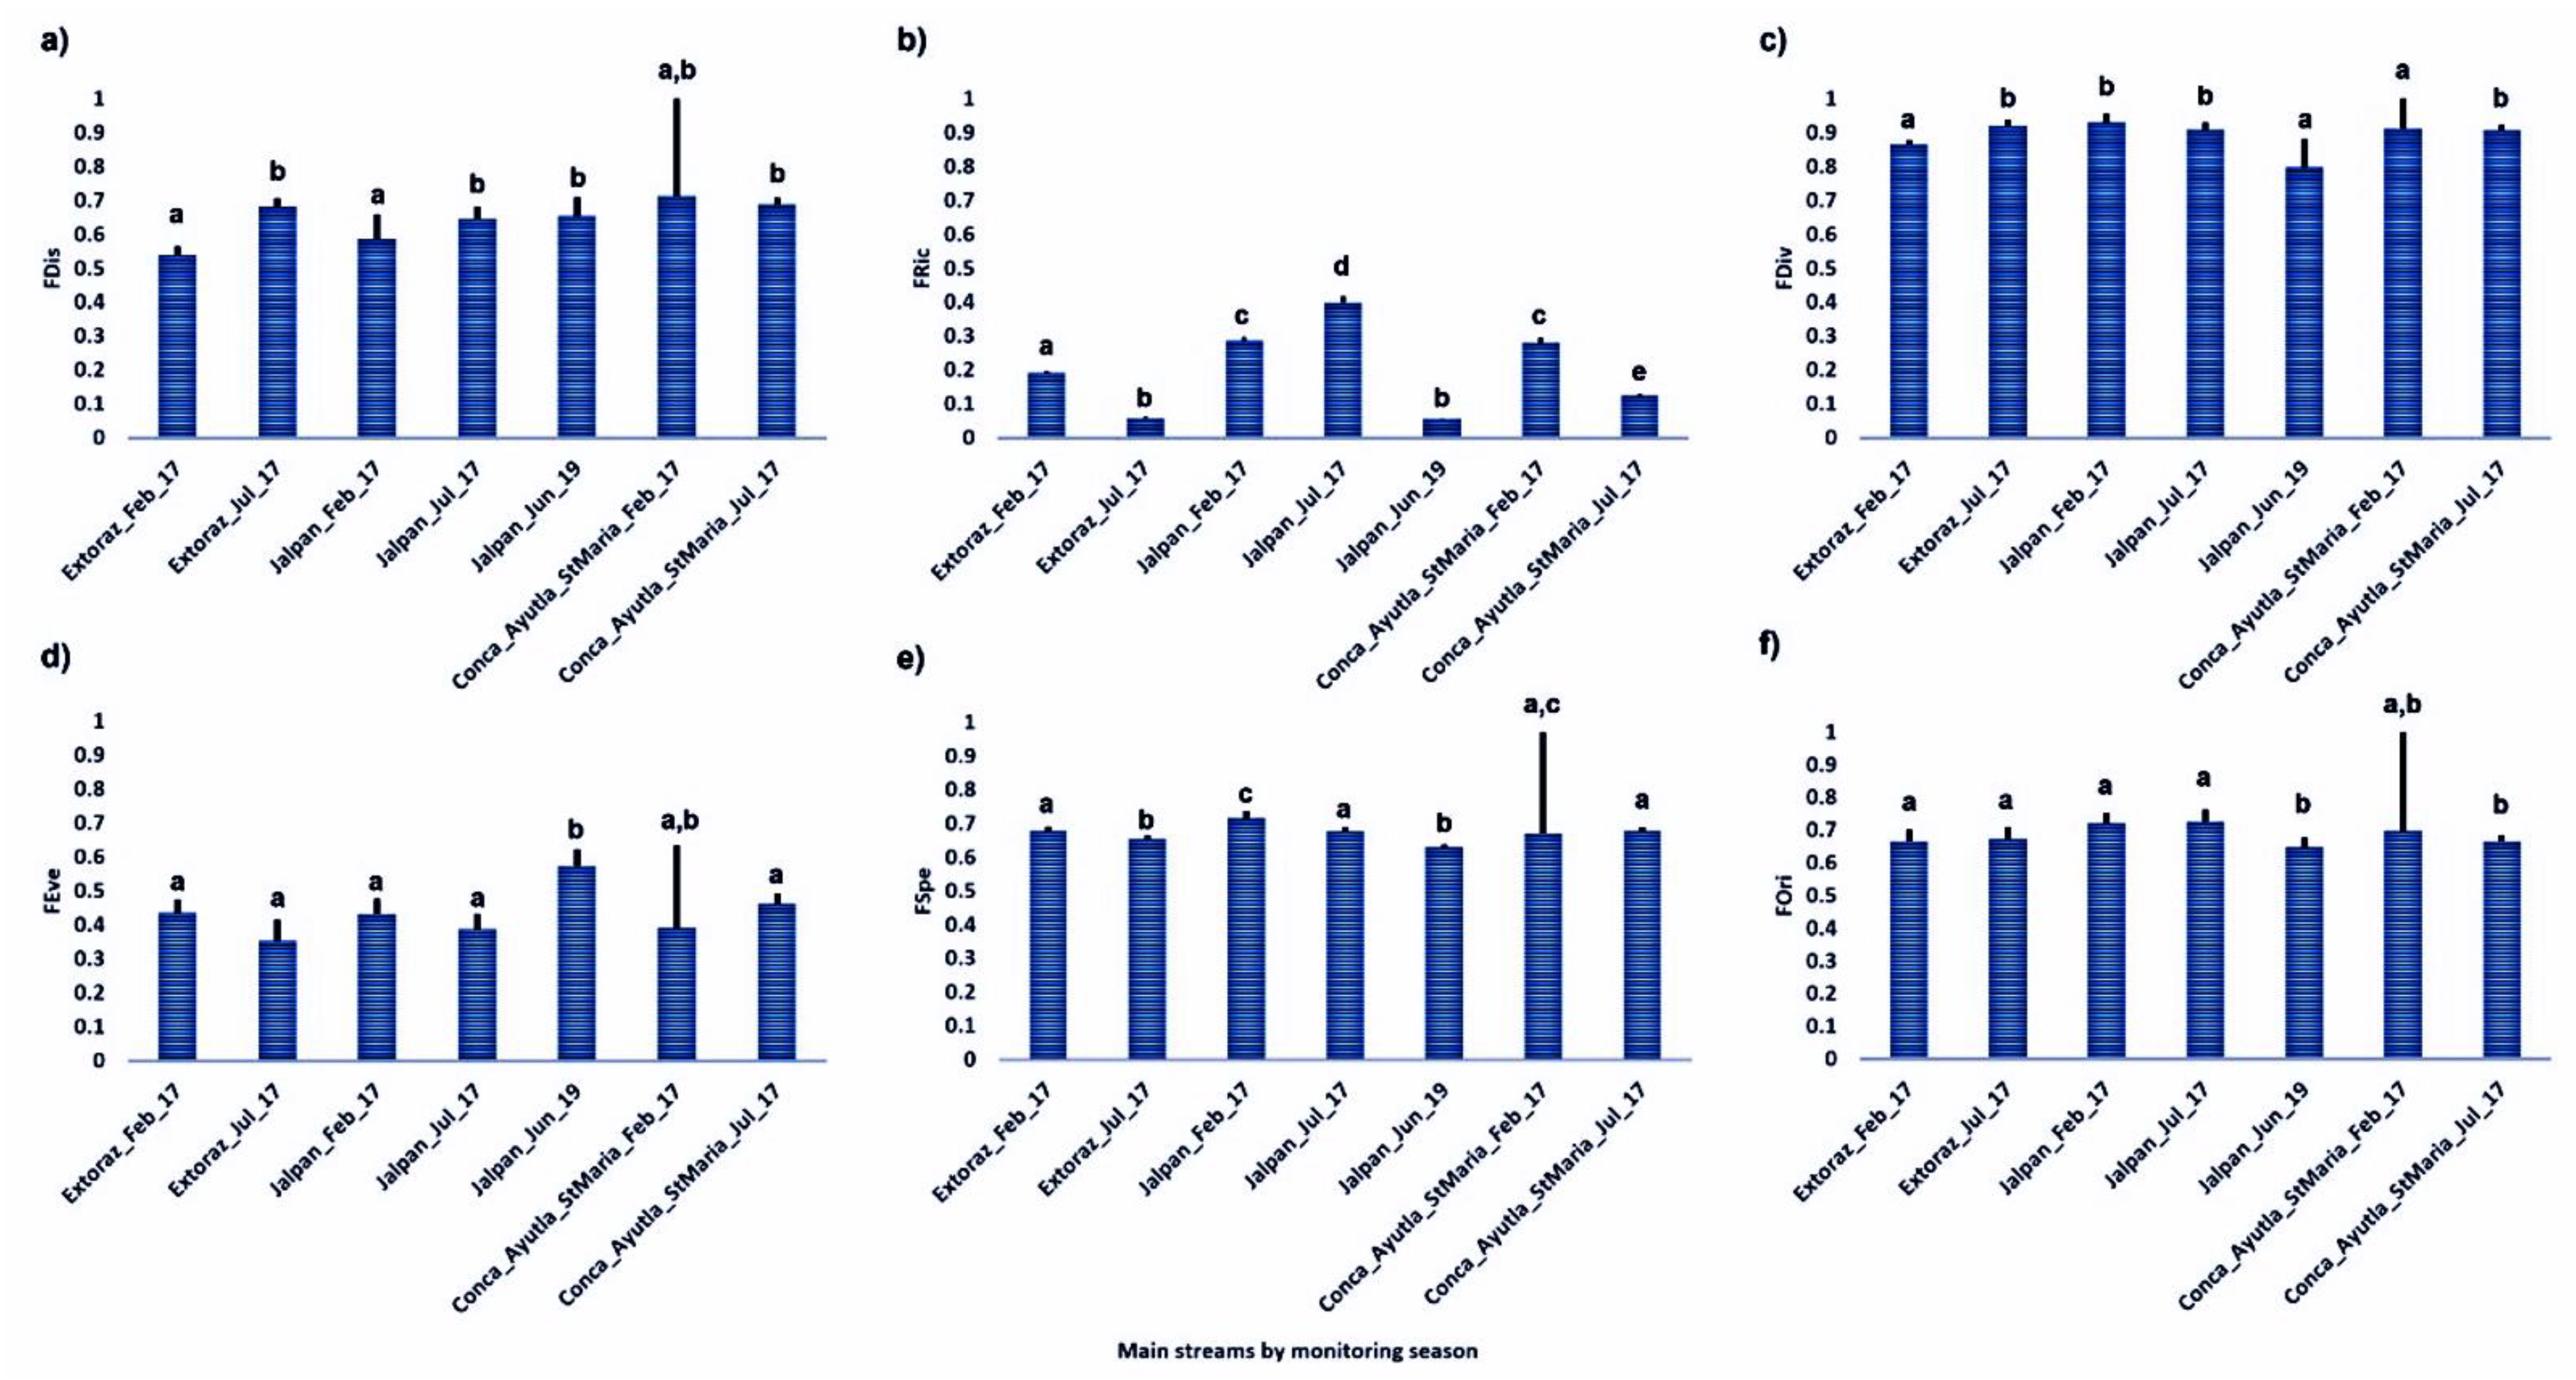
2.6. Statistical Analysis

The average value and standard error of each functional diversity index were calculated. First, we computed the value for each study site and season, and then the mean values for each main stream per study season. Significant differences between average values of the functional diversity indices calculated in each main stream and study season were analyzed using the Kruskal-Wallis test with a significance value of p < 0.05 and the Mann-Whitney U test for multiple comparisons. A database was created for environmental variables, with the indices of functional diversity and physicochemical parameters as active variables (i.e., those that are subject to manipulation or experimentation) and the environmental indices as supplementary variables, to run a Principal Component Analysis (PCA). Groups were defined a priori, each corresponding to the sites located in the three main streams (Extoraz, Jalpan, and Concá-Ayutla-Santa María) and monitoring seasons (February 2017, June 2017, and July 2019). Those environmental variables with a significance value greater than 0.5 in a previous Factor Analysis were maintained. All data were previously processed from ln (x + 1), and the XLStat (2020) package was used for all statistical analyses.

3. Results

The multidimensional space of the functional traits that was characterized in the first place corresponds to the total number of SGRB study sites (Figure 3a), considering all sites in the three main streams and all monitoring events. This procedure allowed us to identify the broadest spectrum of functional diversity within the reserve (multidimensional functional space). The value of FRic was 1, which is expected since all functional traits were present; however, FDiv and FDis were not necessarily equal to 1, although they were greater than 0.5, which indicates the broad spectrum of the functional niche occupied by aquatic macroinvertebrate assemblages in the entire reserve (Figure 3b–d). FEve for the total reserve was low (Figure 3e) since some functions (body size 0.25–0.5 cm; collectors and very tolerant taxa mainly distributed in riparian zones) were more abundant than other macroinvertebrates, associated with high abundances of some taxa (Baetidae, Chironomidae, Elmidae, and Leptophlebidae), which are concentrated at the lower left quadrant of the functional space (Figure 3a,e). Finally, FSpec and FOri were also greater than 0.5, indicating the importance of specific functions within the assemblages (Figure 3f,g).
Average values of functional diversity indices for each main stream throughout the monitoring seasons are shown in Figure 4. FDis (functional dispersion) is a multivariate measure of the dispersion of assemblages’ members across the trait space, estimated as the mean distance of all species to the weighted centroid of the assemblages in the trait space, equivalent to the multivariate dispersion. FDis values (Figure 4a) were above 0.5, with significant differences (p < 0.05) between monitoring seasons in the Extoraz and Concá-Ayutla-Santa María rivers in July 2017.
FRic (functional richness) represents the range of the functional space occupied by the assemblages, estimated as the number of combinations of functional traits in the assemblage. FRic values (Figure 4b) in the Jalpan river ranged from 0.058 ± 0.0007 in June 2019 to 0.4 ± 0.0175 in July 2017, which are significantly different (p < 0.05) between each other and also compared to the Extoraz river during February 2017 and the Concá-Ayutla-Santa María river in the two seasons. FRic values (Figure 4b) lower than 0.5 indicate that the range of functions is unique to a given stream relative to the multifunctional space of the entire SGRB. However, the Extoraz river in July 2017 and the Jalpan river in June 2019 showed very low values that contained less than 10% of the spectrum of functions of the entire reserve. FDiv (functional divergence) represents the proportion of the total abundance supported by taxa with the most extreme trait values within the assemblage. FDiv (Figure 4c) showed very high values (>0.799) in all streams and monitoring seasons.
FEve (functional evenness) represents the uniformity of the distribution and relative abundance of taxa in the functional space of a given assemblage. Higher FEve values indicate a more uniformly occupied niche space. FEve values (Figure 4d) fluctuated from 0.354 ± 0.039 in Extoraz in July 2017 to 0.576 ± 0.030 in Jalpan in June 2019. Values close to 0.5 indicate that the distribution of trait abundances are relatively evenly distributed in the functional space. This indicates that, overall, there are no dominant groups of macroinvertebrates performing similar functions or showing similar attributes. Finally, FSpe and FOri are defined as the mean distance of a taxon and the level of isolation of a taxon, respectively, relative to the functional space occupied by a certain assemblage. FSpe and FOri (Figure 4e,f) showed a similar behavior because these indices indicate the level of specialization of the functions, reaching values above 0.5 that peaked in the Jalpan river in February 2017 (0.718 ± 0.019) and July 2017 (0.728 ± 0.036).
The PCA of the variables and environmental indices that defined the ranking of streams and seasons studied are shown in Figure 5. The first two PCA components accounted for 57.29% of the variance and showed a main environmental gradient on the horizontal axis that clusters the monitoring points into two large groups: the first, on the left side of the biplot (Extoraz_Feb_2017, Jalpan_Feb_17, Conca_Ayutla_StMaria_2017, and Jalpan_Jul_17) is characterized by high oxygen levels (percent saturation), related to the highest FRic, FSpe, and FOri values. The monitoring points on the right side of the biplot (Extoraz_Jul_17, Conca_Ayutla_StaMaria_Jul_17, and Jalpan_Jun_19) are characterized by the highest values of color (9.2–40.6 Pt/Co U.), suspended solids, and turbidity, related to the highest FDis. The main environmental gradient along the horizontal axis denotes the physicochemical properties associated with well-oxygenated waters, in contrast with the study sites with higher contents of solid materials and organic matter. These results are closely related to the monitoring season because the streams positioned to the left were monitored in February 2017 (dry season), except for the Jalpan river in July 2017, while streams positioned to the right were monitored in July 2017 and June 2019 in the Jalpan river (rainy season).
A second environmental gradient is represented on the vertical axis, showed on the upper quadrants of the biplot (Jalpan_Feb_17, Jalpan_Jun_19, and Conca_Ayutla_StaMaria_Jul_17) with the highest values of pH, NDVI, secondary vegetation, natural vegetation, water quality, and habitat quality, related to the highest FEve values. The Extoraz_Feb_17, Extoraz_Jul_17, Jalpan_Jul_17, and Concá_Ayutla_StMaría_Feb_17 monitoring points are located at the lower portion of the biplot, characterized by the highest concentrations of chlorides, conductivity, salinity, sulfates, fecal coliforms, hardness, nitrite nitrogen, nitrates, total phosphorus, hardness, nitrite nitrogen, nitrates, total phosphorus, and nitrogen, related to human settlements, urban areas, and agriculture. Consequently, the second gradient refers to properties related to environmental quality, ranging from better water quality, habitat quality, and well-preserved vegetation cover (in the upper portion of the biplot) to higher contents of minerals, organic matter, and nutrients derived from human activities (at the bottom of the biplot).

4. Discussion

The past decade has witnessed an increase in the number of studies focused on changes in functional diversity using aquatic macroinvertebrate assemblages [48] since these show noticeable changes when facing impacts from human activities [49,50]. Our study proposes the use of functional diversity indices calculated from the characterization of the multifunctional space of macroinvertebrate assemblages in a biosphere reserve located in a tropical latitude, and its comparison within the reserve according to the streams and seasons studied. The perspective for the analysis of functional diversity used in our study, based on [5,47,49], is applied for the first time in Mexico, as far as we known [11].
The macroinvertebrate assemblages sampled in streams running across the SGRB comprised a total of 88 families (refer to the Table S3 of Supplementary Material), evidencing the high taxonomic diversity of aquatic macroinvertebrates in the SGRB. On the other hand [51], who studied some of the streams in the SGBR, reported a similar taxonomic richness, with 86 families identified. Based on taxonomic diversity, our work used a database of 52 functional traits divided into four categories of ecological attributes and six of biological attributes [41,42,43,44,45]. Compared to other reports [52,53], this study used a markedly lower number of traits, which highlights the scarcity of autoecology studies addressing macroinvertebrate groups in tropical areas of America [8,54]. Similarly to other authors [46,55,56], we used fuzzy coding to score the affinity of a given trait to each of our taxa; it has been shown that biological functions or attributes related to functional processes in ecosystems are not binomial in nature, but commonly result from multiple responses by a given assemblage [57].
In general, the reserve showed very high values for almost all the functional diversity indices, except for FEve, which is explained by the occurrence of dominant functions throughout the reserve. In this case, these dominant functions were related to nutrient-enrichment processes since collector organisms were present in all streams and monitoring seasons. Besides, the taxa to which these functions are associated showed high overall abundances (>50 individuals). In our study areas, as well as in other Neotropical rivers, high nutrient levels are mainly due to the incorporation of fine particulate organic matter, which is consistent with [58].
The functional multidimensional space of aquatic macroinvertebrate assemblages was evaluated for each stream within the SGRB in different monitoring seasons to identify variations in the functional diversity indices and explore how these changes are related to the functions within the reserve and the environmental variables and indices measured in the streams and monitoring seasons. It was observed that FDis values (Figure 4a) tend to be higher in Concá-Ayutla-Santa María in both seasons, likely because this is located in the mid-terminal portion of the stream. Here, the macroinvertebrate assemblages show generalist trophic habits and adaptations to avoid extreme hydraulic conditions related to their life cycle such as small body sizes that facilitate searching for shelters to avoid being dragged by strong currents [59], (extreme conditions were detected during the rainy season, with high values of suspended solids and turbidity, due to the incorporation of materials from the upper tributaries of this river, in contrast with those seasonal variations in Extoraz river where there are a lower number of tributaries; see Table 1). FRic (Figure 4b) may be considered one of the most important functional diversity indices because it indicates the variation of the functional space [23] in the streams and seasons monitored. This index showed the lowest values in Extoraz in July 2017 and Jalpan in June 2019. In both cases, this may be an effect of the rainy season as described by [60], who demonstrated that high-flow events caused by rains significantly reduced the richness of the macroinvertebrate assemblages. In the Extoraz river, lower FRic values may also reflect the effect of mining pressure (note the proximity of mining activities to the Extoraz river in Figure 1), mainly from mercury extraction in this area [61,62]. The Extoraz river showed significant differences in FRic values between February and July 2017; however, the low values recorded may be related to the local climate and type of vegetation in the basin. The Extoraz river is a stream located in an area with semi-arid climate and surrounded by xeric shrubland. According to [63], currents flowing across semi-arid environments show spatial and temporal changes that modify the vegetation in the riverbanks and riparian zones. Hence, these currents do not offer enough shelter for macroinvertebrates. Given the scarce habitat availability, the effect of the surrounding mining operations may have been intensified during February 2017, probably leading to marked reductions in the number of functions in this stream. In addition, increased conductivity (see the lower right quadrant of the PCA in Figure 5) affects the taxonomic and functional structure of the macroinvertebrate assemblage, as reported by [64]. In the Jalpan river in June 2019, the forest fires that occurred in that year [65] had a significant adverse effect (p < 0.05) when compared to this same stream in July 2017; noteworthily, the latter date reached the highest FRic value for the rainy season.
The effects of fires on macroinvertebrate assemblages have been rarely addressed. The reports by [66] showed that fire adversely affects FRic, as observed in the Jalpan river in June 2019. However, FDiv values (Figure 4c) remained relatively unchanged, similar to the findings reported by [67], i.e., this index did not decrease despite environmental and anthropogenic stressors. Other authors suggest that FDiv shows less variations in the presence of urban or agricultural land uses [68], as observed mainly in the Jalpan river. Moreover, high FDiv values (>0.799) indicate that the range of functions may be unique to each stream, with no niche overlap [23]. The highest FEve values (Figure 3d) were recorded in the Jalpan river in June 2019, when a disturbance event caused by forest fires occurred. According to [68], disturbance effects tend to increase functional evenness due to the concentration of the combinations of the most similar traits that result from the presence of tolerant and dominant species over the rest of the assemblage [69]. Functional specialization and originality (Figure 4e,f) have been little addressed in macroinvertebrate assemblages [8]; our results showed high values of functional specialization and originality along the streams. According to [70], functional specialization is an indicator that is sensitive to environmental disturbance. The values observed in this study suggest that these functional diversity indices are seemingly not compromised within the SGRB; the exception is the Jalpan river in June 2019, when the lowest values for these indices were observed.
Finally, the ordination analysis (PCA) (Figure 5) showed two environmental gradients along which the aquatic macroinvertebrate assemblages responds regarding its characterization of the multidimensional functional space and functional diversity indices. On the one hand, the gradient marked by good oxygenation levels associated with the highest FRic, FSpe, and FOri in the main streams is similar to the one reported by [71]. The second gradient, represented by the best vegetation conditions in terms of NDVI, habitat quality, and water quality, was found to be related to high functional diversity indices. In contrast, the Extoraz stream in July 2017 showed the most severe disturbance impacts. Besides, this stream showed high conductivity values (due to the calcareous nature of the basin), which is consistent with [72]. Although the Jalpan river (in June 2019) was located to the upper left quadrant of the biplot associated with the highest FEve, we propose that the lowest FRic recorded was mainly due to the effect of fires in the reserve that year. According to [73], the effects of urbanization on macroinvertebrate assemblages are still poorly understood. The Jalpan river runs across the most urbanized area of the reserve, where structural and functional diversity are subject to multiple stressors, including the adverse effects of forest fires on the aquatic macroinvertebrate assemblages, as reported by [74].

5. Conclusions

Our results represent the first approximation to characterize the multidimensional functional space of the aquatic macroinvertebrate assemblages in a Neotropical biosphere reserve. In general, the functional space of this assemblages within the SGBR is characterized by high values of functional diversity indices. However, some indices, such as functional richness, evenness, and specialization, were sensitive to disturbances in the Extoraz river in February 2017 and the Jalpan river in June 2019. Both findings add to the few published reports about the adverse effects of salinization from mining activities on the structure and function of the aquatic macroinvertebrate assemblages, as well as the impact of forest fires. The approach in this study integrated the responses of functional diversity indices across environmental gradients, which allowed us to identify the major drivers of functional diversity within the SGBR. The highest values of the functional richness, specialization, and originality indices were associated with the best water quality (well-oxygenated waters and low values of PO4, turbidity, suspended solids, and color) and the best habitat quality, NDVI, and natural vegetation cover. The responses of functional evenness and dispersion were correlated with the streams and seasons that showed impacts from mineralization (Extoraz river in February 2017) or forest fires (Jalpan river, June 2019). Finally, our results revealed that the relationships between the functional diversity indices and the different physicochemical parameters and environmental indices are suitable indicators to evaluate the conditions within the reserve.

Supplementary Materials

The following are available online at https://www.mdpi.com/article/10.3390/d13110546/s1, Table S1: List of macroinvertebrate family and abbreviations, Table S2: Functional traits, Table S3: Macroinvertebrate family per mainstream and study period.

Author Contributions

Conceptualization, E.L.-L., A.J.R.-R. and J.E.S.-D.; data curation, A.E.R.-S. and A.J.R.-R.; formal analysis, A.J.R.-R. and A.E.R.-S.; funding acquisition, E.L.-L. and J.E.S.-D.; investigation, A.J.R.-R. and E.L.-L.; methodology, A.J.R.-R. and A.E.R.-S.; supervision, E.L.-L. and J.E.S.-D.; writing—original draft, A.J.R.-R., A.E.R.-S. and E.L.-L.; writing—review and editing, E.L.-L. All authors have read and agreed to the published version of the manuscript.

Funding

This research was funded by the Secretariat of Research and Post-grade Studies at Instituto Politécnico Nacional SIP 20210132 and SIP 20210133.

Institutional Review Board Statement

Not applicable.

Informed Consent Statement

Not applicable.

Data Availability Statement

Not applicable.

Acknowledgments

We thank Maria Elena Sanchez-Salazar, who edited the English manuscript. We also thank CONACyT for granting a Ph.D. scholarship to one of the authors (A.J.R.-R.).

Conflicts of Interest

The authors declare no conflict of interest. “The funders had no role in the design of the study; in the collection, analyses, or interpretation of data; in the writing of the manuscript, or in the decision to publish the results”.

References

  1. Dudgeon, D. Multiple threats imperil freshwater biodiversity in the Anthropocene. Curr. Biol. 2019, 29, R960–R967. [Google Scholar] [CrossRef]
  2. Dudgeon, D.; Arthington, A.H.; Gessner, M.O.; Kawabata, Z.-I.; Knowler, D.J.; Lévêque, C.; Naiman, R.J.; Prieur-Richard, A.-H.; Soto, D.; Stiassny, M.L.J.; et al. Freshwater biodiversity: Importance, threats, status and conservation challenges. Biol. Rev. 2006, 81, 163–182. [Google Scholar] [CrossRef]
  3. Strayer, D.; Dudgeon, D. Freshwater biodiversity conservation: Recent progress and future challenges. J. North Am. Benthol. Soc. 2010, 29, 344–358. [Google Scholar] [CrossRef] [Green Version]
  4. Vörösmarty, C.J.; McIntyre, P.B.; Gessner, M.O.; Dudgeon, D.; Prusevich, A.; Green, P.; Glidden, S.; Bunn, S.E.; Sullivan, C.A.; Liermann, C.R.; et al. Global threats to human water security and river biodiversity. Nature 2010, 467, 555–561. [Google Scholar] [CrossRef] [PubMed]
  5. Mouillot, D.; Graham, N.; Villéger, S.; Mason, N.W.; Bellwood, D.R. A functional approach reveals community responses to disturbances. Trends Ecol. Evol. 2013, 28, 167–177. [Google Scholar] [CrossRef] [PubMed]
  6. Rico-Sánchez, A.E.; Sundermann, A.; López-López, E.; Torres-Olvera, M.J.; Mueller, S.A.; Haubrock, P.J. Biological diversity in protected areas: Not yet known but already threatened. Glob. Ecol. Conserv. 2020, 22, e01006. [Google Scholar] [CrossRef]
  7. Almeida, B.D.A.; Green, A.J.; Sebastián-González, E.; Dos Anjos, L. Comparing species richness, functional diversity and functional composition of waterbird communities along environmental gradients in the neotropics. PLoS ONE 2018, 13, e0200959. [Google Scholar] [CrossRef]
  8. Schmera, D.; Heino, J.; Podani, J.; Erős, T.; Dolédec, S. Functional diversity: A review of methodology and current knowledge in freshwater macroinvertebrate research. Hydrobiol. 2017, 787, 27–44. [Google Scholar] [CrossRef] [Green Version]
  9. Allan, J.D.; Castillo, M.M.; Capps, K.A. Stream Ecology: Structure and Function of Running Waters; Springer Nature: Berlin/Heidelberg, Germany, 2020. [Google Scholar] [CrossRef]
  10. Cardinale, B.J.; Duffy, J.E.; Gonzalez, A.; Hooper, D.U.; Perrings, C.; Venail, P.; Narwani, A.; Mace, G.M.; Tilman, D.; Wardle, D.A.; et al. Biodiversity loss and its impact on humanity. Nature 2012, 486, 59–67. [Google Scholar] [CrossRef]
  11. Luiza-Andrade, A.; Montag, L.; Juen, L. Functional diversity in studies of aquatic macroinvertebrates community. Science 2017, 111, 1643–1656. [Google Scholar] [CrossRef]
  12. Rezende, R.S.; Santos, A.M.; Henke-Oliveira, C.; Gonçalves, J.F., Jr. Effects of spatial and environmental factors on benthic a macroinvertebrate community. Zoologia 2014, 31, 426–434. [Google Scholar] [CrossRef] [Green Version]
  13. Melo, A.S.; Froehlich, C.G. Macroinvertebrates in neotropical streams: Richness patterns along a catchment and assemblage structure between 2 seasons. J. N. Am. Benthol. Soc. 2001, 20, 1–16. [Google Scholar] [CrossRef] [Green Version]
  14. Resh, V.H. Which group is best? Attributes of different biological assemblages used in freshwater biomonitoring programs. Environ. Monit. Assess. 2008, 138, 131–138. [Google Scholar] [CrossRef]
  15. Oliveira, A.; Callisto, M. Benthic macroinvertebrates as bioindicators of water quality in an Atlantic forest fragment. Iheringia Série Zool. 2010, 100, 291–300. [Google Scholar] [CrossRef]
  16. Ruiz-Picos, R.A.; Kohlmann, B.; Sedeño-Díaz, J.E.; López-López, E. Assessing ecological impairments in Neotropical rivers of Mexico: Calibration and validation of the Biomonitoring Working Party Index. Int. J. Environ. Sci. Technol. 2017, 14, 1835–1852. [Google Scholar] [CrossRef]
  17. Serna, D.J.; Tamaris-Turizo, C.E.; Gutiérrez Moreno, L.C. Spatial and temporal distribution of Trichoptera (Insecta) larvae in the Manzanares river Sierra Nevada of Santa Marta (Colombia). Rev. Biol. Trop. 2015, 63, 465–477. [Google Scholar] [CrossRef]
  18. Moretti, M.S.; Loyola, R.D.; Becker, B.; Callisto, M. Leaf abundance and phenolic concentrations codetermine the selection of case-building materials by Phylloicus sp. (Trichoptera, Calamoceratidae). Hydrobiologia 2009, 630, 199–206. [Google Scholar] [CrossRef]
  19. Kohlmann, B.; Vásquez, D.; Arroyo, A.; Springer, M. Taxonomic and Functional Diversity of Aquatic Macroinvertebrate Assemblages and Water Quality in Rivers of the Dry Tropics of Costa Rica. Front. Environ. Sci. 2021, 309. [Google Scholar] [CrossRef]
  20. Colzani, E.; Siqueira, T.; Suriano, M.T.; Roque, F.O. Responses of aquatic insect functional diversity to landscape changes in Atlantic forest. Biotropica 2013, 45, 343–350. [Google Scholar] [CrossRef]
  21. Motta Díaz, A.J.; Longo, M.; Aranguren-Riaño, N. Temporal variation of taxonomic diversity and functional traits of aquatic macroinvertebrates in temporary rivers on Old Providence Island, Colombia. Actual. Biológicas 2017, 39, 82–100. [Google Scholar] [CrossRef] [Green Version]
  22. Violle, C.; Navas, M.L.; Vile, D.; Kazakou, E.; Fortunel, C.; Hummel, I.; Garnier, E. Let the concept of trait be functional! Oikos 2007, 116, 882–892. [Google Scholar] [CrossRef]
  23. Mason, N.W.; Mouillot, D.; Lee, W.G.; Wilson, J.B. Functional richness, functional evenness and functional divergence: The primary components of functional diversity. Oikos 2005, 111, 112–118. [Google Scholar] [CrossRef]
  24. Morrone, J.J. Biogeographic regionalization of the mexican transition zone. In The Mexican Transition Zone; Springer: Cham, Switzerland, 2020; pp. 103–155. [Google Scholar] [CrossRef]
  25. Servicio Geológico Mexicano Conoce GeoInfoMex en 3D. Available online: https://www.gob.mx/sgm/articulos/conoce-el-sistema-de-consulta-de-informacion-geocientifica-geoinfomex?idiom=es (accessed on 18 February 2021).
  26. Carabias Lillo, J.; Provencio, E.; de la Maza Elvira, J.; Ruiz Corzo, M. Programa de Manejo Reserva de la Biosfera Sierra Gorda. 1999. Available online: http://www.paot.org.mx/centro/ine-semarnat/anp/AN15.pdf (accessed on 18 September 2021).
  27. Ejecutivo, P. Decreto de la Reserva de la Biosfera Sierra Gorda. 1997, pp. 1–11. Available online: http://dof.gob.mx/nota_detalle.php?codigo=4879875&fecha=19/05/1997 (accessed on 18 February 2021).
  28. Sanginés, A.E. Pobreza y Medio Ambiente en México: Teoría y Evaluación de una Política Pública; Instituto Nacional de Ecología/Universidad Iberoamericana/Instituto Nacional de Administración: Ciudad de México, Mexico, 2003; ISBN 9688594520. [Google Scholar]
  29. Instituto Nacional de Estadística, G.e I. México en Cifras. Available online: https://www.inegi.org.mx/app/areasgeograficas/?ag=22 (accessed on 25 August 2021).
  30. Baird, R.B. Standard Methods for the Examination of Water and Wastewater, 23rd ed.; American Public Health Association: Washington, DC, USA, 2017; ISBN 9780875532875. [Google Scholar]
  31. Barbour, M.T.; Stribling, J.B.; Verdonschot, P.F.M. The multihabitat approach of USEPA’s rapid bioassessment protocols: Benthic macroinvertebrates. Limnetica 2006. [Google Scholar] [CrossRef]
  32. Cornejo, A.; Lopez, E.; Bernal, J. Protocolo de Biomonitoreo para la Vigilancia de la Calidad del Agua en Afluentes Superficiales de Panama; Instituto Conmemorativo Gorgas de Estudios de la Salud: Panamá, Panama, 2019; 81p, ISBN 978-9962-13-053-6. [Google Scholar]
  33. Rodríguez-Romero, A.J.; Rico-Sánchez, A.E.; Mendoza-Martínez, E.; Gómez-Ruiz, A.; Sedeño-Díaz, J.E.; López-López, E. Impact of changes of land use on water quality, from tropical forest to anthropogenic occupation: A multivariate approach. Water 2018, 10, 1518. [Google Scholar] [CrossRef] [Green Version]
  34. INEGI Instituto Nacional de Estadística, Geografía e Informática. 2020. Available online: https://www.inegi.org.mx/temas/mapadigital/ (accessed on 14 September 2021).
  35. Glovis, Servicio Geológico de EE. UU. Servicio Geológico. 2021. Available online: https://glovis.usgs.gov/app (accessed on 15 July 2021).
  36. Tarpley, J.D.; Schneider, S.R.; Money, R.L. Global Vegetation Indices from the NOAA-7 Meteorological Satellite. J. Clim. Appl. Meteorol. 1984, 23, 491–494. [Google Scholar] [CrossRef]
  37. Dinius, S.H. Design of an Index of Water Quality. JAWRA J. Am. Water Resour. Assoc. 1987, 23, 833–843. [Google Scholar] [CrossRef]
  38. Mueller, M.; Pander, J.; Geist, J. Taxonomic sufficiency in freshwater ecosystems: Effects of taxonomic resolution, functional traits, and data transformation. Freshw. Sci. 2013, 32, 762–778. [Google Scholar] [CrossRef]
  39. Thorp and Covich’s Freshwater Invertebrates. In Thorp and Covich’s Freshwater Invertebrates; Academic Press: Cambridge, MA, USA, 2018. [CrossRef]
  40. Thorp, J.H.; Rogers, D.C. Thorp, J.H.; Rogers, D.C. Thorp and Covich’s Freshwater Invertebrates. In Ecology and Classification of North American Freshwater Invertebrates; Academic press: Cambridge, MA, USA, 2014; ISBN 9780080889818. [Google Scholar]
  41. Merritt, R.W.; Cummins, K.W. (Eds.) An Introduction to the Aquatic Insects of North America; Kendall Hunt: Dubuque, IA, USA, 2008. [Google Scholar]
  42. Poff, N.L.; Olden, J.D.; Vieira, N.K.; Finn, D.S.; Simmons, M.P.; Kondratieff, B.C. Functional trait niches of North American lotic insects: Traits-based ecological applications in light of phylogenetic relationships. J. N. Am. Benthol. Soc. 2006, 25, 730–755. [Google Scholar] [CrossRef] [Green Version]
  43. Vieira, N.K.; Poff, N.L.; Carlisle, D.M.; Moulton, S.R.; Koski, M.L.; Kondratieff, B.C. A database of lotic invertebrate traits for North America. US Geol. Surv. Data Ser. 2006, 187, 1–15. [Google Scholar] [CrossRef]
  44. Jesus, T.M.G.M.D. Ecological, anatomical and physiological traits of benthic macroinvertebrates: Their use on the health characterization of freshwater ecosystems. Limnetica 2008, 27, 079–092. [Google Scholar]
  45. Ramírez, A.; Gutiérrez-Fonseca, P.E. Functional feeding groups of aquatic insect families in Latin America: A critical analysis and review of existing literature. Rev. Biol. Trop. 2014, 62, 155–167. [Google Scholar] [CrossRef]
  46. Mondy, C.P.; Usseglio-Polatera, P. Using fuzzy-coded traits to elucidate the non-random role of anthropogenic stress in the functional homogenisation of invertebrate assemblages. Freshw. Biol. 2014, 59, 584–600. [Google Scholar] [CrossRef]
  47. Villéger, S.; Grenouillet, G.; Brosse, S. Decomposing functional β-diversity reveals that low functional β-diversity is driven by low functional turnover in E uropean fish assemblages. Glob. Ecol. Biogeogr. 2013, 22, 671–681. [Google Scholar] [CrossRef]
  48. Laliberté, E.; Legendre, P. A distance-based framework for measuring functional diversity from multiple traits. Ecology 2010, 91, 299–305. [Google Scholar] [CrossRef] [PubMed]
  49. Villéger, S.; Mason, N.W.; Mouillot, D. New multidimensional functional diversity indices for a multifaceted framework in functional ecology. Ecology 2008, 89, 2290–2301. [Google Scholar] [CrossRef] [PubMed] [Green Version]
  50. Sundar, S.; Heino, J.; Roque, F.D.O.; Simaika, J.P.; Melo, A.S.; Tonkin, J.D.; Silva, D.P. Conservation of freshwater macroinvertebrate biodiversity in tropical regions. Aquat. Conserv. Mar. Freshw. Ecosyst. 2020, 30, 1238–1250. [Google Scholar] [CrossRef]
  51. Torres-Olvera, M.J.; Durán-Rodríguez, O.Y.; Torres-García, U.; Pineda-López, R.; Ramírez-Herrejón, J.P. Validation of an index of biological integrity based on aquatic macroinvertebrates assemblages in two subtropical basins of central Mexico. Lat. Am. J. Aquat. Res. 2018, 46, 945–960. [Google Scholar] [CrossRef]
  52. Voß, K.; Schäfer, R.B. Taxonomic and functional diversity of stream invertebrates along an environmental stress gradient. Ecol. Indic. 2017, 81, 235–242. [Google Scholar] [CrossRef]
  53. White, J.C.; Hill, M.J.; Bickerton, M.A.; Wood, P.J. Macroinvertebrate taxonomic and functional trait compositions within lotic habitats affected by river restoration practices. Environ. Manag. 2017, 60, 513–525. [Google Scholar] [CrossRef] [PubMed] [Green Version]
  54. Maasri, A. A global and unified trait database for aquatic macroinvertebrates: The missing piece in a global approach. Front. Environ. Sci. 2019, 7, 65. [Google Scholar] [CrossRef]
  55. Usseglio-Polatera, P.; Bournaud, M.; Richoux, P.; Tachet, H. Biomonitoring through biological traits of benthic macroinvertebrates: How to use species trait databases? In Assessing the Ecological Integrity of Running Waters; Springer: Dordrecht, The Netherlands, 2000; pp. 153–162. [Google Scholar] [CrossRef]
  56. Tomanova, S.; Moya, N.; Oberdorff, T. Using macroinvertebrate biological traits for assessing biotic integrity of neotropical streams. River Res. Appl. 2008, 24, 1230–1239. [Google Scholar] [CrossRef]
  57. Martini, S.; Larras, F.; Boyé, A.; Faure, E.; Aberle, N.; Archambault, P.; Ayata, S.D. Functional trait-based approaches as a common framework for aquatic ecologists. Limnol. Oceanogr. 2021, 66, 965–994. [Google Scholar] [CrossRef]
  58. Díaz-Rojas, C.A.; Motta-Díaz, Á.J.; Aranguren-Riaño, N. Study of the taxonomic and functional diversity of the macroinvertebrate assemblages in an Andean mountain river. Rev. Biol. Trop. 2020, 68, 132–149. [Google Scholar] [CrossRef]
  59. Washko, S.; Bogan, M.T. Global patterns of aquatic macroinvertebrate dispersal and functional feeding traits in aridland rock pools. Front. Environ. Sci. 2019, 7, 106. [Google Scholar] [CrossRef]
  60. Theodoropoulos, C.; Vourka, A.; Stamou, A.; Rutschmann, P.; Skoulikidis, N. Response of freshwater macroinvertebrates to rainfall-induced high flows: A hydroecological approach. Ecol. Indic. 2017, 73, 432–442. [Google Scholar] [CrossRef]
  61. Martínez-Trinidad, S.; Hernández Silva, G.; Ramírez Islas, M.E.; Martínez Reyes, J.; Solorio Munguía, G.; Solís Valdez, S.; García Martínez, R. Total mercury in terrestrial systems (air-soil-plant-water) at the mining region of San Joaquín, Queretaro, Mexico. Geofísica Int. 2013, 52, 43–58. [Google Scholar] [CrossRef] [Green Version]
  62. Rico-Sánchez, A.E.; Rodríguez-Romero, A.J.; Sedeño-Díaz, J.E.; López-López, E.; Sundermann, A. Aquatic Macroinvertebrate Assemblages in Rivers Under the Influence of Mining Activities. Sci. Rep. 2021, in press. [Google Scholar] [CrossRef]
  63. Wang, Z.; Wang, W.; Zhang, Z.; Hou, X.; Ma, Z.; Chen, B. River-groundwater interaction affected species composition and diversity perpendicular to a regulated river in an arid riparian zone. Glob. Ecol. Conserv. 2021, 27, e01595. [Google Scholar] [CrossRef]
  64. Sowa, A.; Krodkiewska, M.; Halabowski, D. How does mining salinisation gradient affect the structure and functioning of macroinvertebrate communities? Water Air Soil Pollut. 2020, 231, 1–19. [Google Scholar] [CrossRef]
  65. La Jornada. 2019. Available online: https://www.jornada.com.mx/2019/05/24/estados/028n1est (accessed on 22 August 2021).
  66. Williams-Subiza, E.A.; Brand, C. Functional response of benthic macroinvertebrates to fire disturbance in patagonian streams. Hydrobiologia 2021, 848, 1575–1591. [Google Scholar] [CrossRef]
  67. Juvigny-Khenafou, N.P.; Piggott, J.J.; Atkinson, D.; Zhang, Y.; Macaulay, S.J.; Wu, N.; Matthaei, C.D. Impacts of multiple anthropogenic stressors on stream macroinvertebrate community composition and functional diversity. Ecol. Evol. 2021, 11, 133–152. [Google Scholar] [CrossRef] [PubMed]
  68. Barnum, T.R.; Weller, D.E.; Williams, M. Urbanization reduces and homogenizes trait diversity in stream macroinvertebrate communities. Ecol. Appl. 2017, 27, 2428–2442. [Google Scholar] [CrossRef]
  69. Hillebrand, H.; Bennett, D.M.; Cadotte, M.W. Consecuencias del dominio: Una revisión de los efectos de la uniformidad en los procesos de los ecosistemas locales y regionales. Ecología 2008, 89, 1510–1520. [Google Scholar] [CrossRef] [PubMed]
  70. Mykrä, H.; Heino, J. Decreased habitat specialization in macroinvertebrate assemblages in anthropogenically disturbed streams. Ecol. Complex. 2017, 31, 181–188. [Google Scholar] [CrossRef]
  71. Croijmans, L.; De Jong, J.F.; Prins, H.H.T. Oxygen is a better predictor of macroinvertebrate richness than temperature—a systematic review. Environ. Res. Lett. 2021, 16, 023002. [Google Scholar] [CrossRef]
  72. Carrera-Villacrés, D.V.; Crisanto-Perrazo, T.; Ortega-Escobar, H.; Ramírez-García, J.; Espinosa-Victoria, D.; Ramírez-Ayala, C.; Sánchez-Bernal, E. Salinidad cuantitativa y cualitativa del sistema hidrográfico Santa María-Río Verde, México. Tecnol. Cienc. Del Agua 2015, 6, 69–83. [Google Scholar]
  73. Gál, B.; Szivák, I.; Heino, J.; Schmera, D. The effect of urbanization on freshwater macroinvertebrates–knowledge gaps and future research directions. Ecol. Indic. 2019, 104, 357–364. [Google Scholar] [CrossRef] [Green Version]
  74. Verkaik, I.; Vila-Escale, M.; Rieradevall, M.; Baxter, C.V.; Lake, P.S.; Minshall, G.W.; Prat, N. Stream macroinvertebrate community responses to fire: Are they the same in different fire-prone biogeographic regions? Freshw. Sci. 2015, 34, 1527–1541. [Google Scholar] [CrossRef]
Figure 1. Study area in the Sierra Gorda Biosphere Reserve. Fifteen sampling sites were selected along three streams (Extoraz, Jalpan, and Concá-Ayutla-Santa María rivers): four sites in core zones (BC: Bucareli, AY: Ayutla, SM: Santa María, AT: Autopista 190) and 11 in buffer zones (PB: Peña Blanca, EP: El Paraíso, RQ: Rancho Quemado, ES: Escanela, EN: Escanelilla, AH: Ahuacatlán, PI: Pizquintla, JL: Jalpan, PA: Purísima de Arista, VC: Vegas Cuatas, CN: Concá). The Extoraz river includes PB, EP, RQ and BC; the Jalpan river includes ES, EN, AH, PI, JL, and PA; the Concá-Ayutla-Santa María river includes VC, CN, AY, SM, and AT.
Diversity 13 00546 g001
Figure 2. Average monthly temperature (line) and precipitation (bar) values in the Sierra Gorda Biosphere Reserve for the period 2017–2019.
Diversity 13 00546 g002
Figure 3. Multidimensional functional space of the aquatic macroinvertebrate assemblages in the SGRB and functional diversity indices for the entire SGRB throughout the monitoring seasons. (a) The box in the upper left corner includes the location of taxa (families) in the functional space of the entire SGRB. The meaning of abbreviations is found in the supplementary material. The diameter of the blue dots indicates the abundance of the respective taxon; (b) FDis; (c) FRic; (d) FDiv; (e) FEve; (f) FSpe; and (g) FOri indices for the entire SGRB.
Diversity 13 00546 g003
Figure 4. Average values of functional diversity indices for the main streams and monitoring seasons studied. (a) FDis, (b) FRic, (c) FDiv, (d) FEve, (e) FSpe and (f) FOri. Letters above the dispersion values of all indices (ae) indicate statistically significant differences (p < 0.05).
Diversity 13 00546 g004
Figure 5. Biplot of the PCA of study sites and seasons (observations) and environmental variables measured in situ and in the laboratory, as well as functional diversity and environmental indices. Upper left quadrant. pH = pH values, NDVI = Normalized Difference Vegetation Index, SV = Secondary vegetation, WQI = Water Quality Index, Hab = Habitat quality, NV = Natural vegetation, %Sat-O2 = Oxygen saturation (%); Lower left quadrant. FRic = Functional richness, FSpe = Functional specialization, FOri = Functional originality, BOD = Biochemical oxygen demand, Alk = Alkalinity, FDiv = Functional divergence; Upper right quadrant. FEve = Functional evenness, IG = Induced grasslands, PO4 = Orthophosphates, Tur = Turbidity, Color = Color; Lower right quadrant. SS = Suspended solids, FDis = Functional dispersion, Temp = Water temperature, Tot-P = Total phosphorus, Tot-N = Total nitrogen, AG = Agriculture, NO2, NO3, NH3 = Nitrites, nitrates, and ammonia nitrogen, Fecal col = Fecal coliforms, Hardness = Hardness, HS & UZ = Human Settlements and Urban Zones, Sulf = Sulfates, Cond = Conductivity, Sal = Salinity, Cl = Chlorides.
Diversity 13 00546 g005
Table 1. Mean values and SE (±) of the physicochemical environmental variables recorded in the three main streams of SGRB.
Environmental Variables/MainstreamExtoraz_Feb_17Extoraz_Jul_17Jalpan_Feb_17Jalpan_Jul_17Jalpan_Jun_19Concá_Ayutla_StMaría_Feb_17Concá_Ayutla_StMaría_Jul_17
Temperature (°C)22.65 ± 1.0125.31 ± 1.0317.57 ± 0.6722.00 ± 1.3524.52 ± 1.8523.22 ± 0.8124.94 ± 0.47
Conductivity (ms/cm)0.70 ± 0.220.89 ± 0.170.33 ± 0.010.37 ± 0.030.38 ± 0.020.53 ± 0.030.28 ± 0.02
Disolved oxygen (mg/L)9.60 ± 0.557.30 ± 0.339.41 ± 0.307.63 ± 0.327.67 ± 1.049.68 ± 0.328.10 ± 0.20
Oxygen saturation (%)110.00 ± 6.6692.21 ± 1.65103.00 ± 3.0589.94 ± 3.7294.62 ± 11.52106.46 ± 3.9893.74 ± 1.84
pH8.06 ± 0.077.77 ± 0.128.07 ± 0.068.01 ± 0.158.48 ± 0.087.84 ± 0.067.83 ± 0.06
Turbidity (NTU)17.07 ± 10.91251.57 ± 130.4315.87 ± 6.6541.16 ± 21.407.69 ± 2.7514.78 ± 6.301002.42 ± 403.33
Salinity (UPS)0.32 ± 0.080.43 ± 0.080.16 ± 0.000.18 ± 0.010.18 ± 0.010.25 ± 0.010.15 ± 0.01
NO2 (mg/L)0.01 ± 0.000.03 ± 0.010.12 ± 0.090.06 ± 0.060.07 ± 0.070.01 ± 0.000.03 ± 0.01
NO3 (mg/L)1.28 ± 0.293.55 ± 2.641.63 ± 0.170.43 ± 0.150.97 ± 0.201.57 ± 0.111.16 ± 0.32
NH3 (mg/L)0.20 ± 0.041.32 ± 0.350.56 ± 0.270.42 ± 0.110.22 ± 0.170.79 ± 0.653.89 ± 2.73
Total Nitrogen (mg/L)3.03 ± 0.978.07 ± 1.632.65 ± 0.346.63 ± 0.562.99 ± 0.241.95 ± 0.3813.45 ± 3.27
PO4 (mg/L)0.16 ± 0.040.47 ± 0.280.26 ± 0.050.35 ± 0.090.52 ± 0.270.18 ± 0.080.70 ± 0.25
Total Phosphorous (mg/L)1.51 ± 0.981.35 ± 0.410.34 ± 0.041.40 ± 0.821.13 ± 0.350.37 ± 0.081.34 ± 0.52
SO4 (mg/L)81.12 ± 14.0692.37 ± 20.8312.70 ± 0.5115.50 ± 0.8516.00 ± 0.8572.30 ± 18.8421.80 ± 7.70
Chlorides (mg/L)20.36 ± 7.2421.24 ± 6.088.99 ± 0.407.28 ± 0.760.99 ± 0.3810.29 ± 1.318.69 ± 1.77
Alkalinity (mg/L)193.12 ± 8.40233.00 ± 13.77195.80 ± 11.49224.50 ± 18.62183.63 ± 6.66192.40 ± 6.76109.40 ± 30.28
Hardness (mg/L)126.75 ± 43.33244.50 ± 81.4359.40 ± 8.66179.66 ± 13.18159.40 ± 3.1899.60 ± 33.1799.80 ± 17.61
Suspended solids (mg/L)14.25 ± 11.60281.25 ± 123.761.24 ± 0.5130.66 ± 17.0913.40 ± 5.294.62 ± 3.36733.00 ± 289.88
Color (Pt/Co U.)2.75 ± 1.1820.75 ± 4.171.00 ± 0.017.83 ± 3.459.20 ± 3.152.00 ± 0.6340.60 ± 16.15
Fecal coliforms (MPN/100 mL)24.00 ± 6.64645.75 ± 265.32301.00 ± 186.00658.83 ± 205.06243.42 ± 214.80111.40 ± 88.13133.60 ± 82.32
BOD5 (mg/L)3.15 ± 0.913.03 ± 0.325.14 ± 0.783.18 ± 0.470.30 ± 0.132.57 ± 0.462.62 ± 0.32
Publisher’s Note: MDPI stays neutral with regard to jurisdictional claims in published maps and institutional affiliations.

