Article

Breeding Density and Collision Mortality of Loggerhead Shrike (Lanius ludovicianus) in the Altamont Pass Wind Resource Area

by
K. Shawn Smallwood
* and
Noriko L. Smallwood
3108 Finch Street, Davis, CA 95616, USA
*
Author to whom correspondence should be addressed.
Diversity 2021, 13(11), 540; https://doi.org/10.3390/d13110540
Submission received: 30 September 2021 / Revised: 25 October 2021 / Accepted: 26 October 2021 / Published: 28 October 2021
(This article belongs to the Collection Feature Papers in Animal Diversity)

Abstract

:
Loggerhead shrike (Lanius ludovicianus) has declined across most or all of its geographic range. The species’ raptorial behavior requires maintenance of large territories, which means populations of breeding shrikes require large areas of habitat and are therefore sensitive to habitat loss and habitat fragmentation. We estimated breeding densities of loggerhead shrikes in the Altamont Pass Wind Resource Area (APWRA), California, where annual shrike mortality caused by wind turbine collisions was high until just before our study began in 2016. Based on surveys across an annual average 50 randomized sampling plots in 2016–2019, we estimated an average 129 breeding pairs/year across the 167.6-km2 APWRA. Relative to the size of the study area, density in the APWRA was relatively high compared to densities reported from other study sites across North America. It was higher than predicted by application of the Partners in Flight estimator, which was based on Breeding Bird Surveys along roads. We also found that loggerhead shrikes in the APWRA were limited by the availability of nest substrate and by California ground squirrels (Otospermophilus beecheyi) and their burrow complexes, which have keystone effects on vegetation and wildlife in the APWRA. To most effectively conserve loggerhead shrikes in the APWRA, wind turbine mortality should be minimized, ground squirrels conserved instead of eradicated as pests, and appropriate trees and shrubs cultivated where they are needed.

1. Introduction

The habitat of loggerhead shrike (Lanius ludovicianus) in grassland, sagebrush, and savannah environments has rapidly diminished as these environments have been converted to intensive anthropogenic uses [1,2,3]. Due to habitat loss and habitat fragmentation, regional abundances of loggerhead shrike have declined in California, including a significant decline in Breeding Bird Survey data from 1968 through 2004 [4]. Since 2004, the spread of West Nile Virus (WNV) across North America 1999–2005, and into California by 2005, might have contributed to the decline [5]. These declines prompted designations of special status to the species. A subspecies was listed as federally endangered on San Clemente Island, California. The U.S. Fish and Wildlife Service listed loggerhead shrike as a bird species of conservation concern in Bird Conservation Region 32, which encompasses coastal California. The California Department of Fish and Wildlife listed loggerhead shrike as a California species of special concern, priority level 2.
Although the loggerhead shrike is a passerine, members of the species behave like diurnal raptors. Loggerhead shrikes are predatory and territorial, and they occupy and defend large home ranges during the breeding season. Distance between neighboring breeding pairs averaged 203 m at one study site and 328 m at another site in southwestern Idaho [6] and 545.7 m in Virginia [7]. Given the relatively large areas of habitat needed to support a population, loggerhead shrike is sensitive to habitat loss [8], habitat degradation, and excess mortality. A fundamental question, however, is what qualifies as a population of loggerhead shrikes; that is, how many breeding pairs of shrikes compose what is commonly referred to as a population? Related questions go to what metrics most effectively express population performance and how best to measure them, and whether they are intended to represent a snapshot in time or a longer-term trend.
Perhaps the most common method for estimating relative abundance across space and time is the roadside survey [9], such as that of the North American Breeding Bird Survey (BBS). Roadside surveys have been used to estimate loggerhead shrike abundance of 0.42 breeding pairs/km in Missouri [10], 0.11 and 0.14 breeding pairs/km in Iowa [11], and 0.22 breeding pairs/km on the San Clemente Island off the coast of California [12]. Where there are no accessible roads, however, numerical rates based on road counts might not be comparable. Breeding pairs/km of road can also inaccurately represent numerical trends if breeding loggerhead shrikes generally avoid roads or if avoidance/attraction varies by type of road or by variation in traffic volume. Partners in Flight (PIF) developed a regional population estimator based on BBS survey outcomes (https://pif.birdconservancy.org/ accessed on 29 September 2021), but the assumptions of the estimator have been criticized [13]. We add our additional criticism that it mischaracterizes the population concept as a term of convenience more than a biologically determined unit of demography.
The more direct method for estimating population size and distribution is census of breeding pairs within a study area. Most study areas used for numerical estimation of loggerhead shrike have been single, contiguous units of land. The sizes of these study areas have also varied, and this variation could bear on the demographic unit sampled by the census [14]. Furthermore, the variation in study area size could correlate with population density, as it has for species of raptor [15,16,17]. We had the opportunity to estimate loggerhead shrike breeding density in the Altamont Pass Wind Resource Area (APWRA), California, where one of us (K. S. Smallwood) has performed research since 1999 on wildlife mortality caused by wind turbines. Loggerhead shrikes contributed to the annual toll of fatalities taken by the APWRA.
Our primary objective was to estimate the number of loggerhead shrike breeding pairs within the 16,760-ha Altamont Pass Wind Resource Area (APWRA), based on randomized sampling plots. Our second objective was to assess the degree to which loggerhead shrike density responded to the availability of suitable nest substrate and to the availability of the keystone animal species of the APWRA—the California ground squirrel (Otospermophilus beecheyi). Our third objective was to contextualize our density estimates derived from sampling plots to those of other studies. Our fourth objective was to assess our density estimates in light of estimated fatality rates of loggerhead shrikes that collided with the wind turbines of the APWRA.

2. Materials and Methods
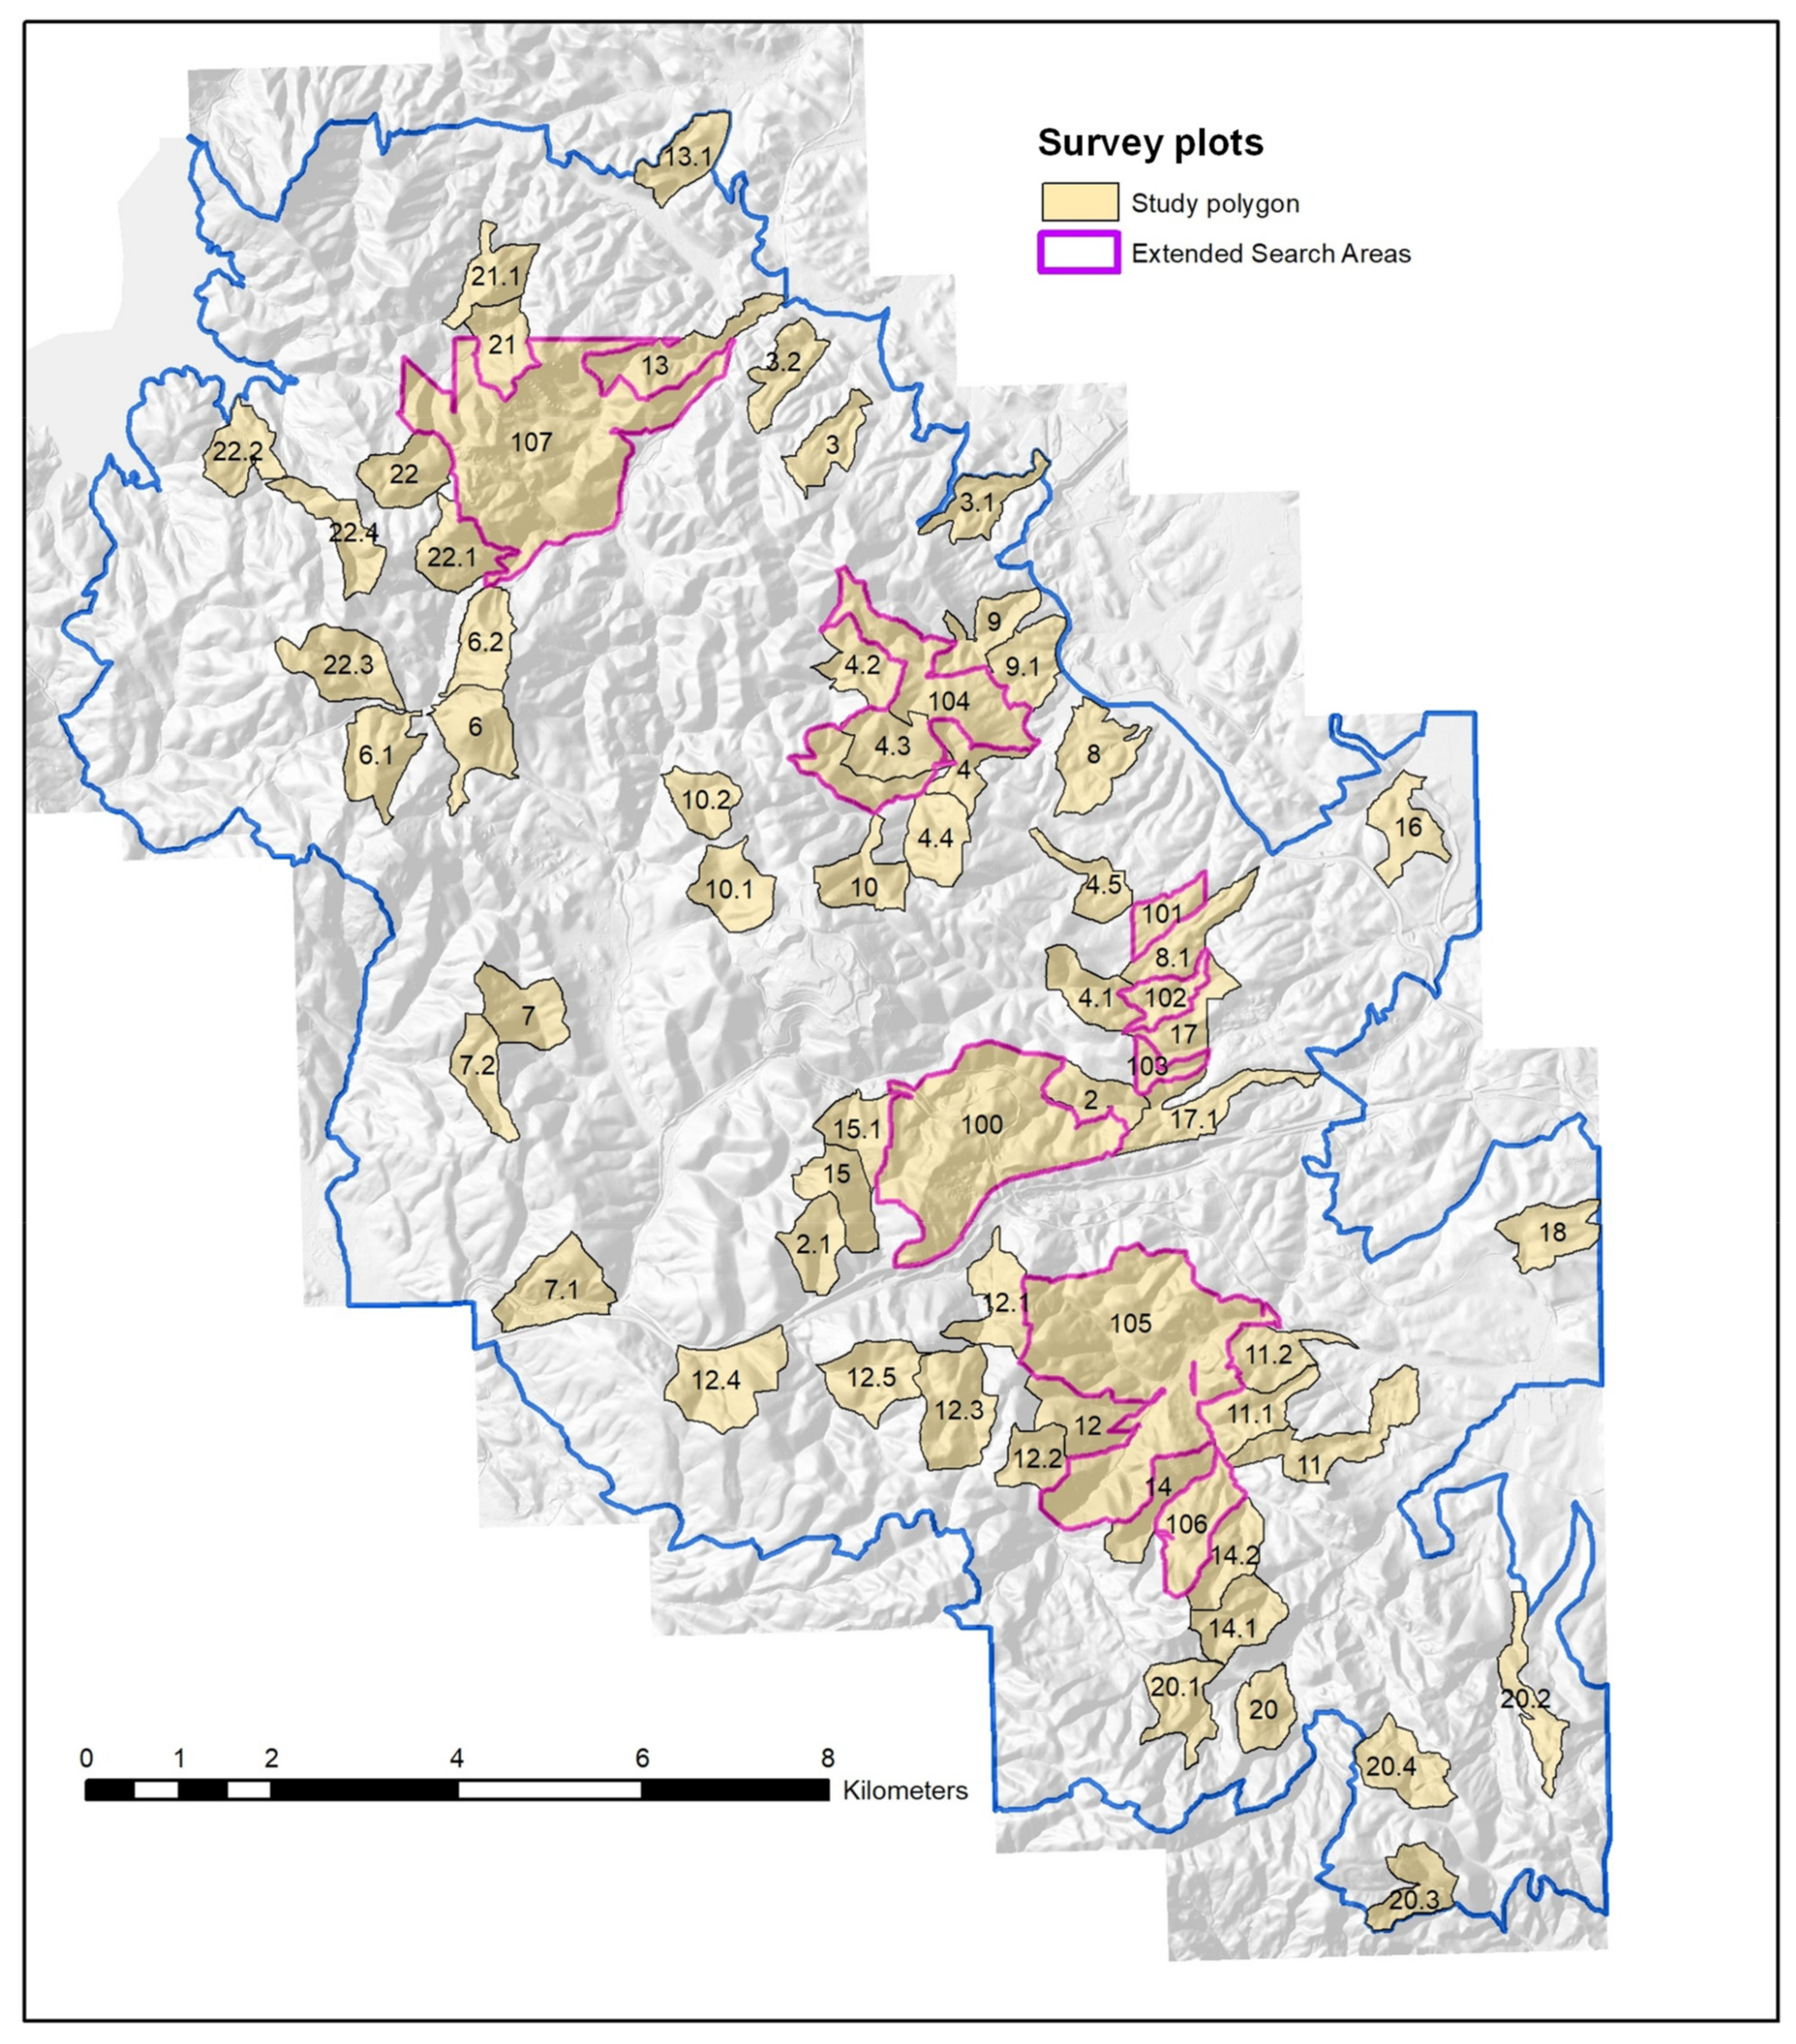
2.1. Study Area

The 167.6-km2 Altamont Pass Wind Resource Area (APWRA) is so-defined for its use in generating electricity from wind channeled through a low pass between mountains of the Diablo Range in eastern Contra Costa and Alameda Counties, California (Figure 1). Wind turbines of multiple models, sizes, and ownership operate mostly from ridge crests and hill peaks of the APWRA, which range 40 m to 500 m in elevation. The hilly terrain is drained by ephemeral streams, which support riparian vegetation such as willows. Upland ground cover consists mostly of non-native annual grasses, which are grazed by cattle over most of the APWRA, and by sheep in the 540-ha Vasco Caves Regional Preserve (Vasco Caves) in the north-central aspect of the APWRA. Trees in the upland areas include isolated copses of California buckeye, valley oak, and blue gum eucalyptus (Eucalyptus globulus). Shrubs in the upland areas include mostly coyote bush, poison oak, and blue elderberry. East Bay Regional Park District owns and manages Vasco Caves and the land on which the Buena Vista Wind Energy Project operates, but most of the rest of the APWRA is privately held. Barbed-wire fences and gates bound lands by ownership and animal stocking rates. Land stewardship also varies by ownership, particularly in the intensity of control efforts directed towards California ground squirrels (Otospermophilus beecheyi), which are a keystone species of the APWRA for their roles as prey of large predators, excavators of burrows used by many other animal species, and modifiers of vegetation through consumption and seed dispersal (Figure 2 and Figure 3).
Only modern wind turbines operated in the APWRA at the time of our study. These turbines ranged in rated capacity from 660 kilowatts (KW) to 2.3 megawatts (MW), and totaled 268.58 MW within the APWRA. Before our study, thousands of old-generation wind turbines composed the APWRA, ranging in size from 40 KW to 400 KW. However, these old-generation wind turbines underwent repowering from 2002 through 2015, which involved the project-by-project replacements of old turbines with larger modern wind turbines. The installed capacity of wind turbines therefore varied. We tracked the installed capacity from 1999 through 2019, and we tracked which turbines were monitored for collision fatalities of birds and bats.

2.2. Field Methods to Estimate Density

We utilized an existing proportional random sample of survey plots that was first established in 2011 for burrowing owls [18]. From within 19 fields of wind turbines defined by shared ownership, turbine model and size, and general location within the APWRA, we used GIS to sample proportionately to the spatial extent of each field (Figure 4). The spatial grain of the sampling was the slope bordered by its apex or crest and its valley bottom, and between streambeds draining into the valley bottom. Each slope served as a sampling unit, 952 of which composed the 19 turbine fields. Each randomly selected slope served as the starting point from which additional adjacent slopes were appended using a set of rules to build each survey plot of ≥40 ha in size [18]. Randomized plots varied in size depending on the size of the final GIS slope polygon to be appended to achieve the minimum size of 40 ha. This form of sampling enabled quick and accurate determinations of plot boundaries by comparing the observer’s viewshed to handheld photos of the plot.
We lost access to some turbine fields before we began surveying for loggerhead shrikes. Therefore, where feasible, we added plots using the same proportional random sampling approach to select slopes, and we used the same rules to build survey plots. We later regained access to all but three of the originally selected plots numbered 9, 9.1, and 100. We also searched for loggerhead shrikes across seven extended survey areas that had been established for burrowing owls. One extended area included all of the 540-ha Vasco Caves Regional Preserve (Plot 107 in Figure 4), and the others were located between survey plots where burrowing owl densities were highest in 2011–2012.
We surveyed during April through August of each year, 2016–2019. Surveys began as visual scans from vantage points, most of which were located along wind turbine access roads. We waited until mid-May and June before walking onto portions of survey plots not visible from wind turbine access roads, and before mapping nest sites using a Trimble GeoXT geographic positioning system (GPS). When mapping nests and checking on nest status, we carefully approached nest sites when satisfied we were unobserved by potential nest predators such as raptors and common ravens (Corvus corax). However, we mostly refrained from checking on nest status because the risk of exposing the nests to predators was too great. We used binoculars to view nests from as far away as possible. To minimize our time near the nest, we relied on averages of three GPS positions at 5-s intervals. To maximize our distance from the nest, we used a rangefinder and compass to measure distance and bearing as inputs to a GPS offset function. Nest locations and nest status were also recorded by K. S. Smallwood during his many routine visits to raptor behavior observation stations located throughout the APWRA.
Nest site detection typically began with detection of loggerhead shrike foraging activity within an area, which we would identify with a hand-drawn circle on a printed photo of the survey plot. Food delivery to nests often enabled us to find the nest site (Figure 5). However, loggerhead shrikes often refrained from returning to nest sites while aware of our presence. We therefore updated our maps with subsequent visits, eventually observing the center of loggerhead shrike activity or where shrikes made food deliveries when unaware of us. Emergence of fledglings also revealed nest sites. Except for two plots (plots 7.1 and 12.4), we surveyed every plot until we were confident that we detected all nest sites.
Each year we tallied nest sites in each survey plot and we calculated density as nest sites/km2. We assumed perfect detection of nest sites per survey plot, so we estimated density without adjustment for detection rates. We calculated mean and 95% confidence intervals from each year of surveys. We also compared our mean annual density estimate to densities estimated elsewhere to assess population status of loggerhead shrikes in the APWRA. An important part of this comparison was the size of the study area used to make the density estimate, because most of the variation in density was explained by study area size for other species of birds [15,16,17].
We also related mean annual nest attempts/km2 of loggerhead shrikes to availability of nest substrate on the sampling plot, ground squirrel abundance, and whether squirrel control was known to have been implemented during the same or the previous year of each survey. We measured availability of nest substrate as: 0 = none, 1 = scarce (1 or 2 shrubs or trees or patches of shrubs or trees on the plot), and 2 = moderate (≥3 shrubs or trees or patches of shrubs or trees, where a patch would not support >1 typical nest territory). We measured ground squirrel abundance as: 0 = none, 1 = scarce or a few, and 2 = moderate to many on the plot. We also compared nest density against a composite predictor variable defined as: 0 = no nest substrate, 1 = nest substrate but no ground squirrels, and 2 = nest substrate and presence of ground squirrels on the plot.

2.3. Wind Turbine Fatality Estimates

We integrated avian fatality monitoring data from wherever it was monitored in the APWRA 1999–2019. Monitoring at the old-generation wind turbines, 1999–2014, was conducted by human searchers who, at an average 39 days between searches, walked parallel transects spaced 4–6 m apart and extending to 50 m from each wind turbine [19,20,21]. The repowered Vasco Winds Energy Project was also searched by human searchers, 2012–2015, but at this project, transect spacing was 10 m and the search area extended to 105 m from each wind turbine [22]. At Vasco Winds, half the wind turbines were searched at weekly intervals, and half were searched at monthly intervals. Starting in 2017, half of the wind turbines in the repowered Golden Hills Wind Energy Project were searched monthly by humans, and half were searched weekly by scent-detection dogs [23]. At Golden Hills, the search area extended to 105 m, and transect spacing was 10 m for human searchers but dogs did not search a regular pattern. We estimated fatalities using the following estimator: F ^ = F D d , where the estimate F ^ was the fatality count F adjusted by the product of two probabilities, D and d. D was carcass detection probability estimated from the outcomes of carcass detection trials that were integrated into routine fatality monitoring and then logit-regressed on the log10 body mass (g) of the placed carcasses [19,20,22]. d was the probability that the carcass would be found within the search area [21], the data for which were updated by the pattern of carcass distances from turbines that was discerned from more recent use of leashed scent-detection dogs in fatality monitoring [24]. We estimated F ^ /MW/year for each monitored wind turbine, and we extrapolated the mean among turbines to each wind energy project to which the turbines belonged. We then estimated APWRA-wide fatalities as the weighted mean among projects that were installed in each year.

3. Results

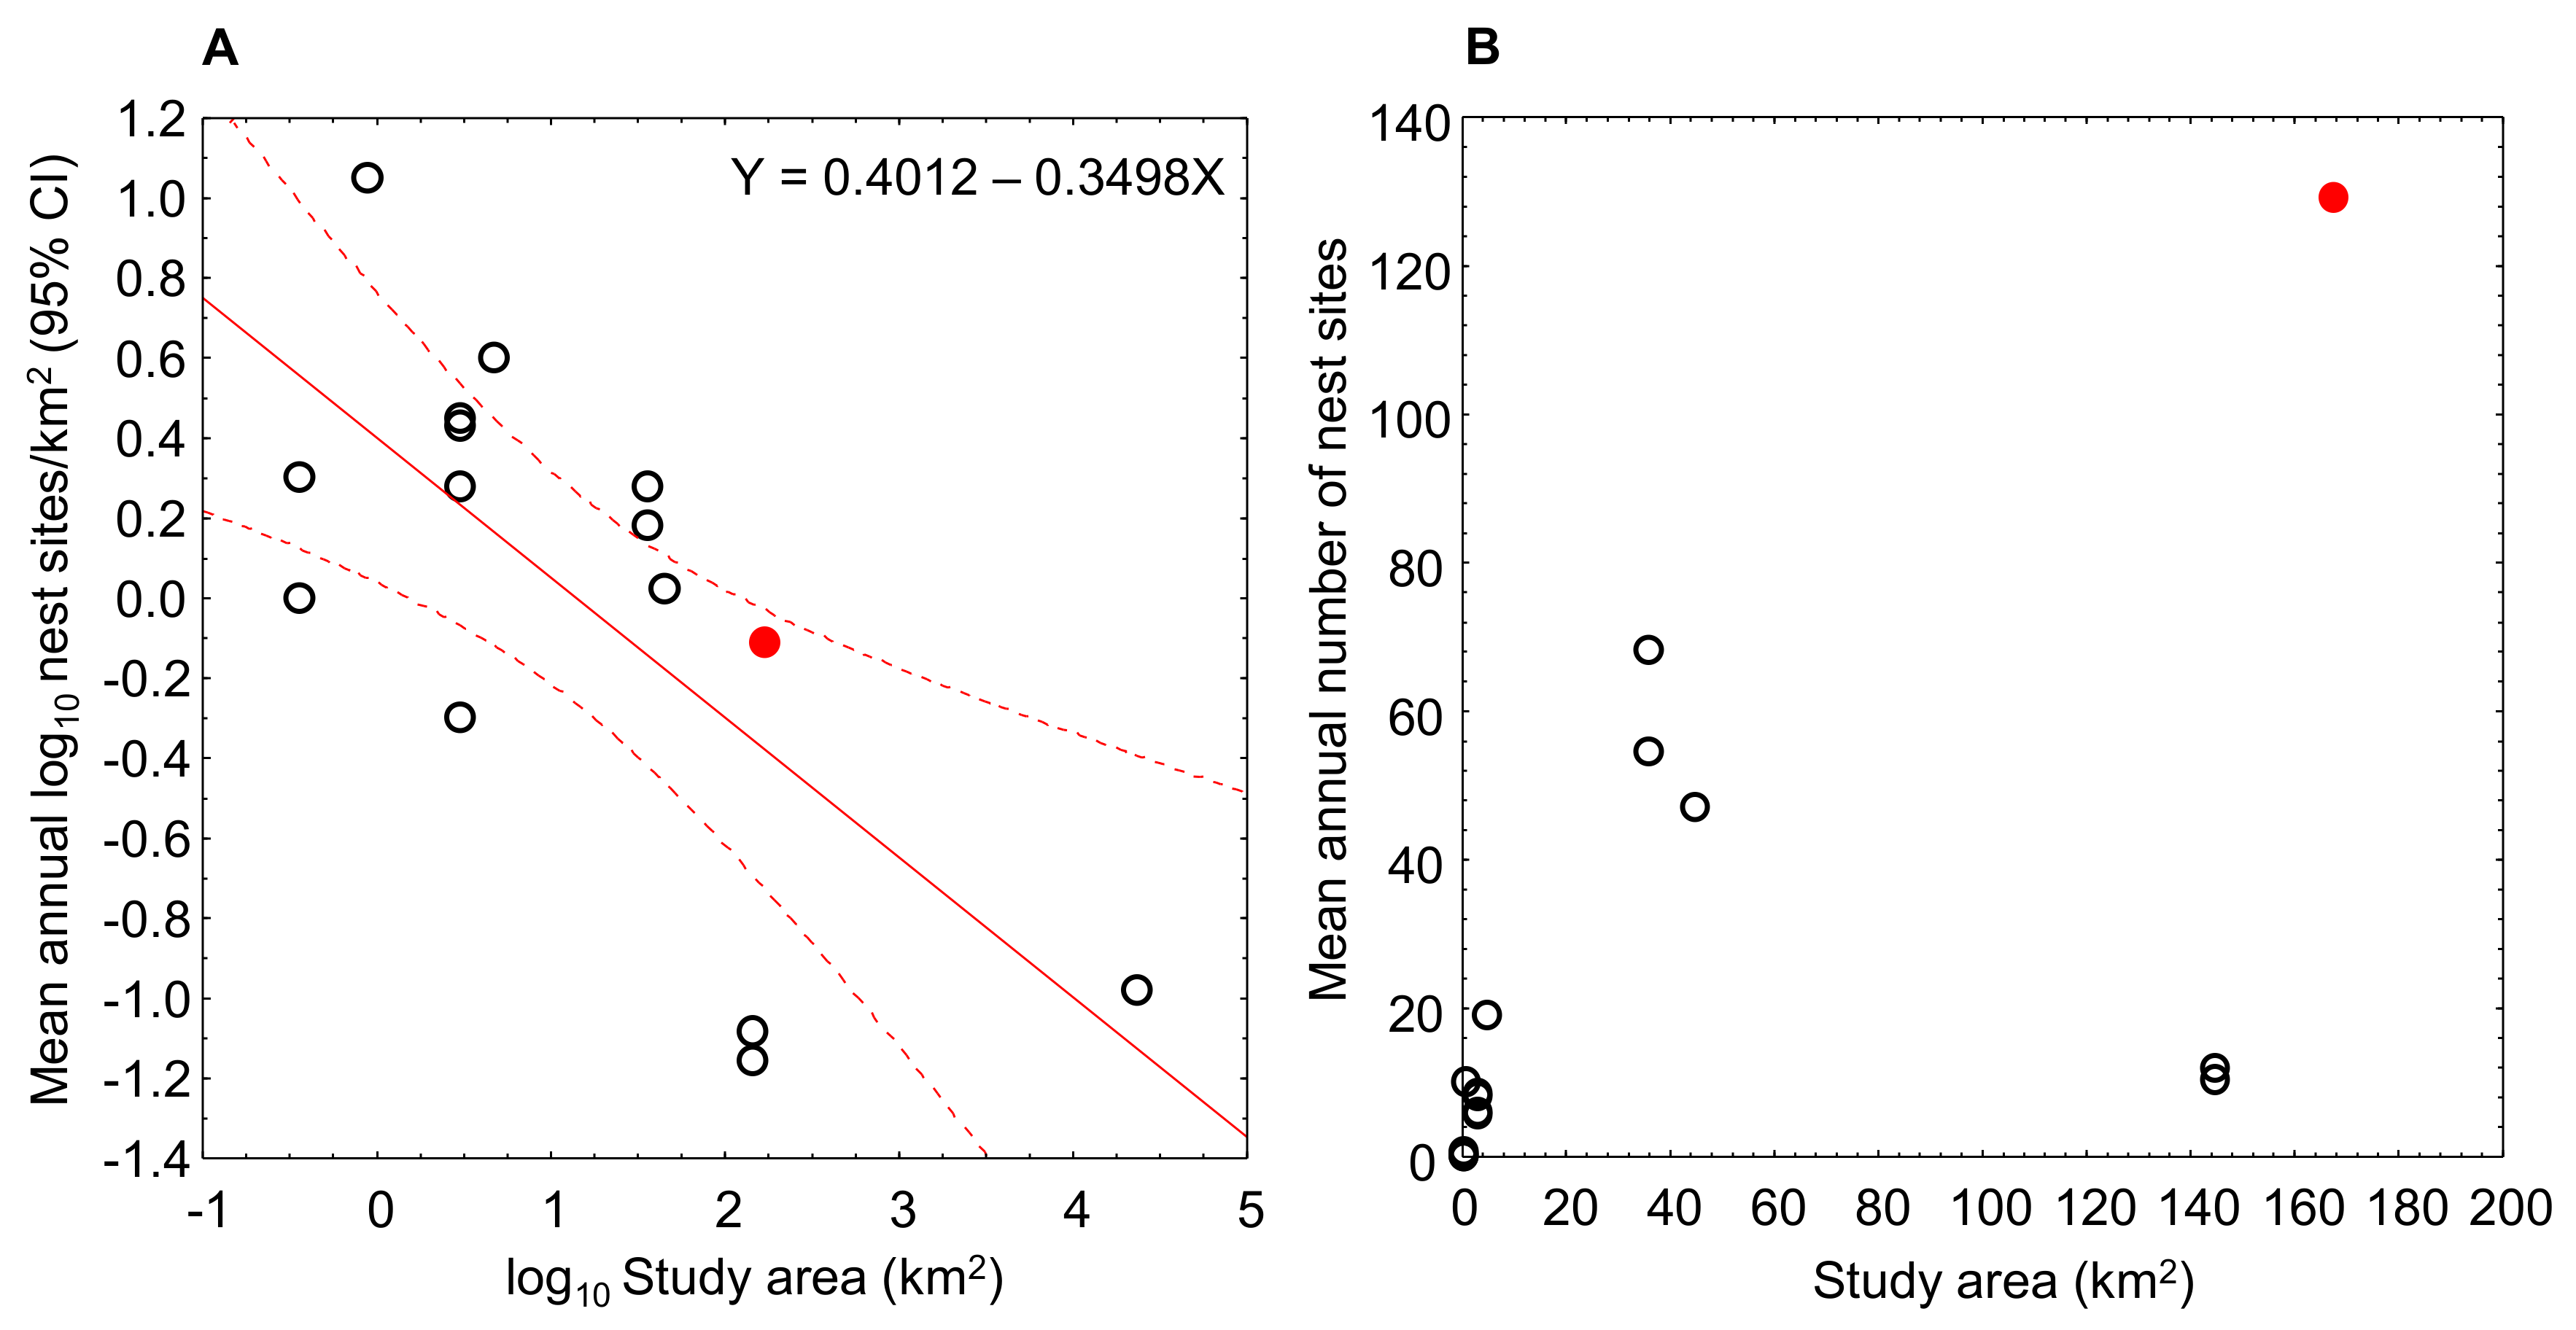
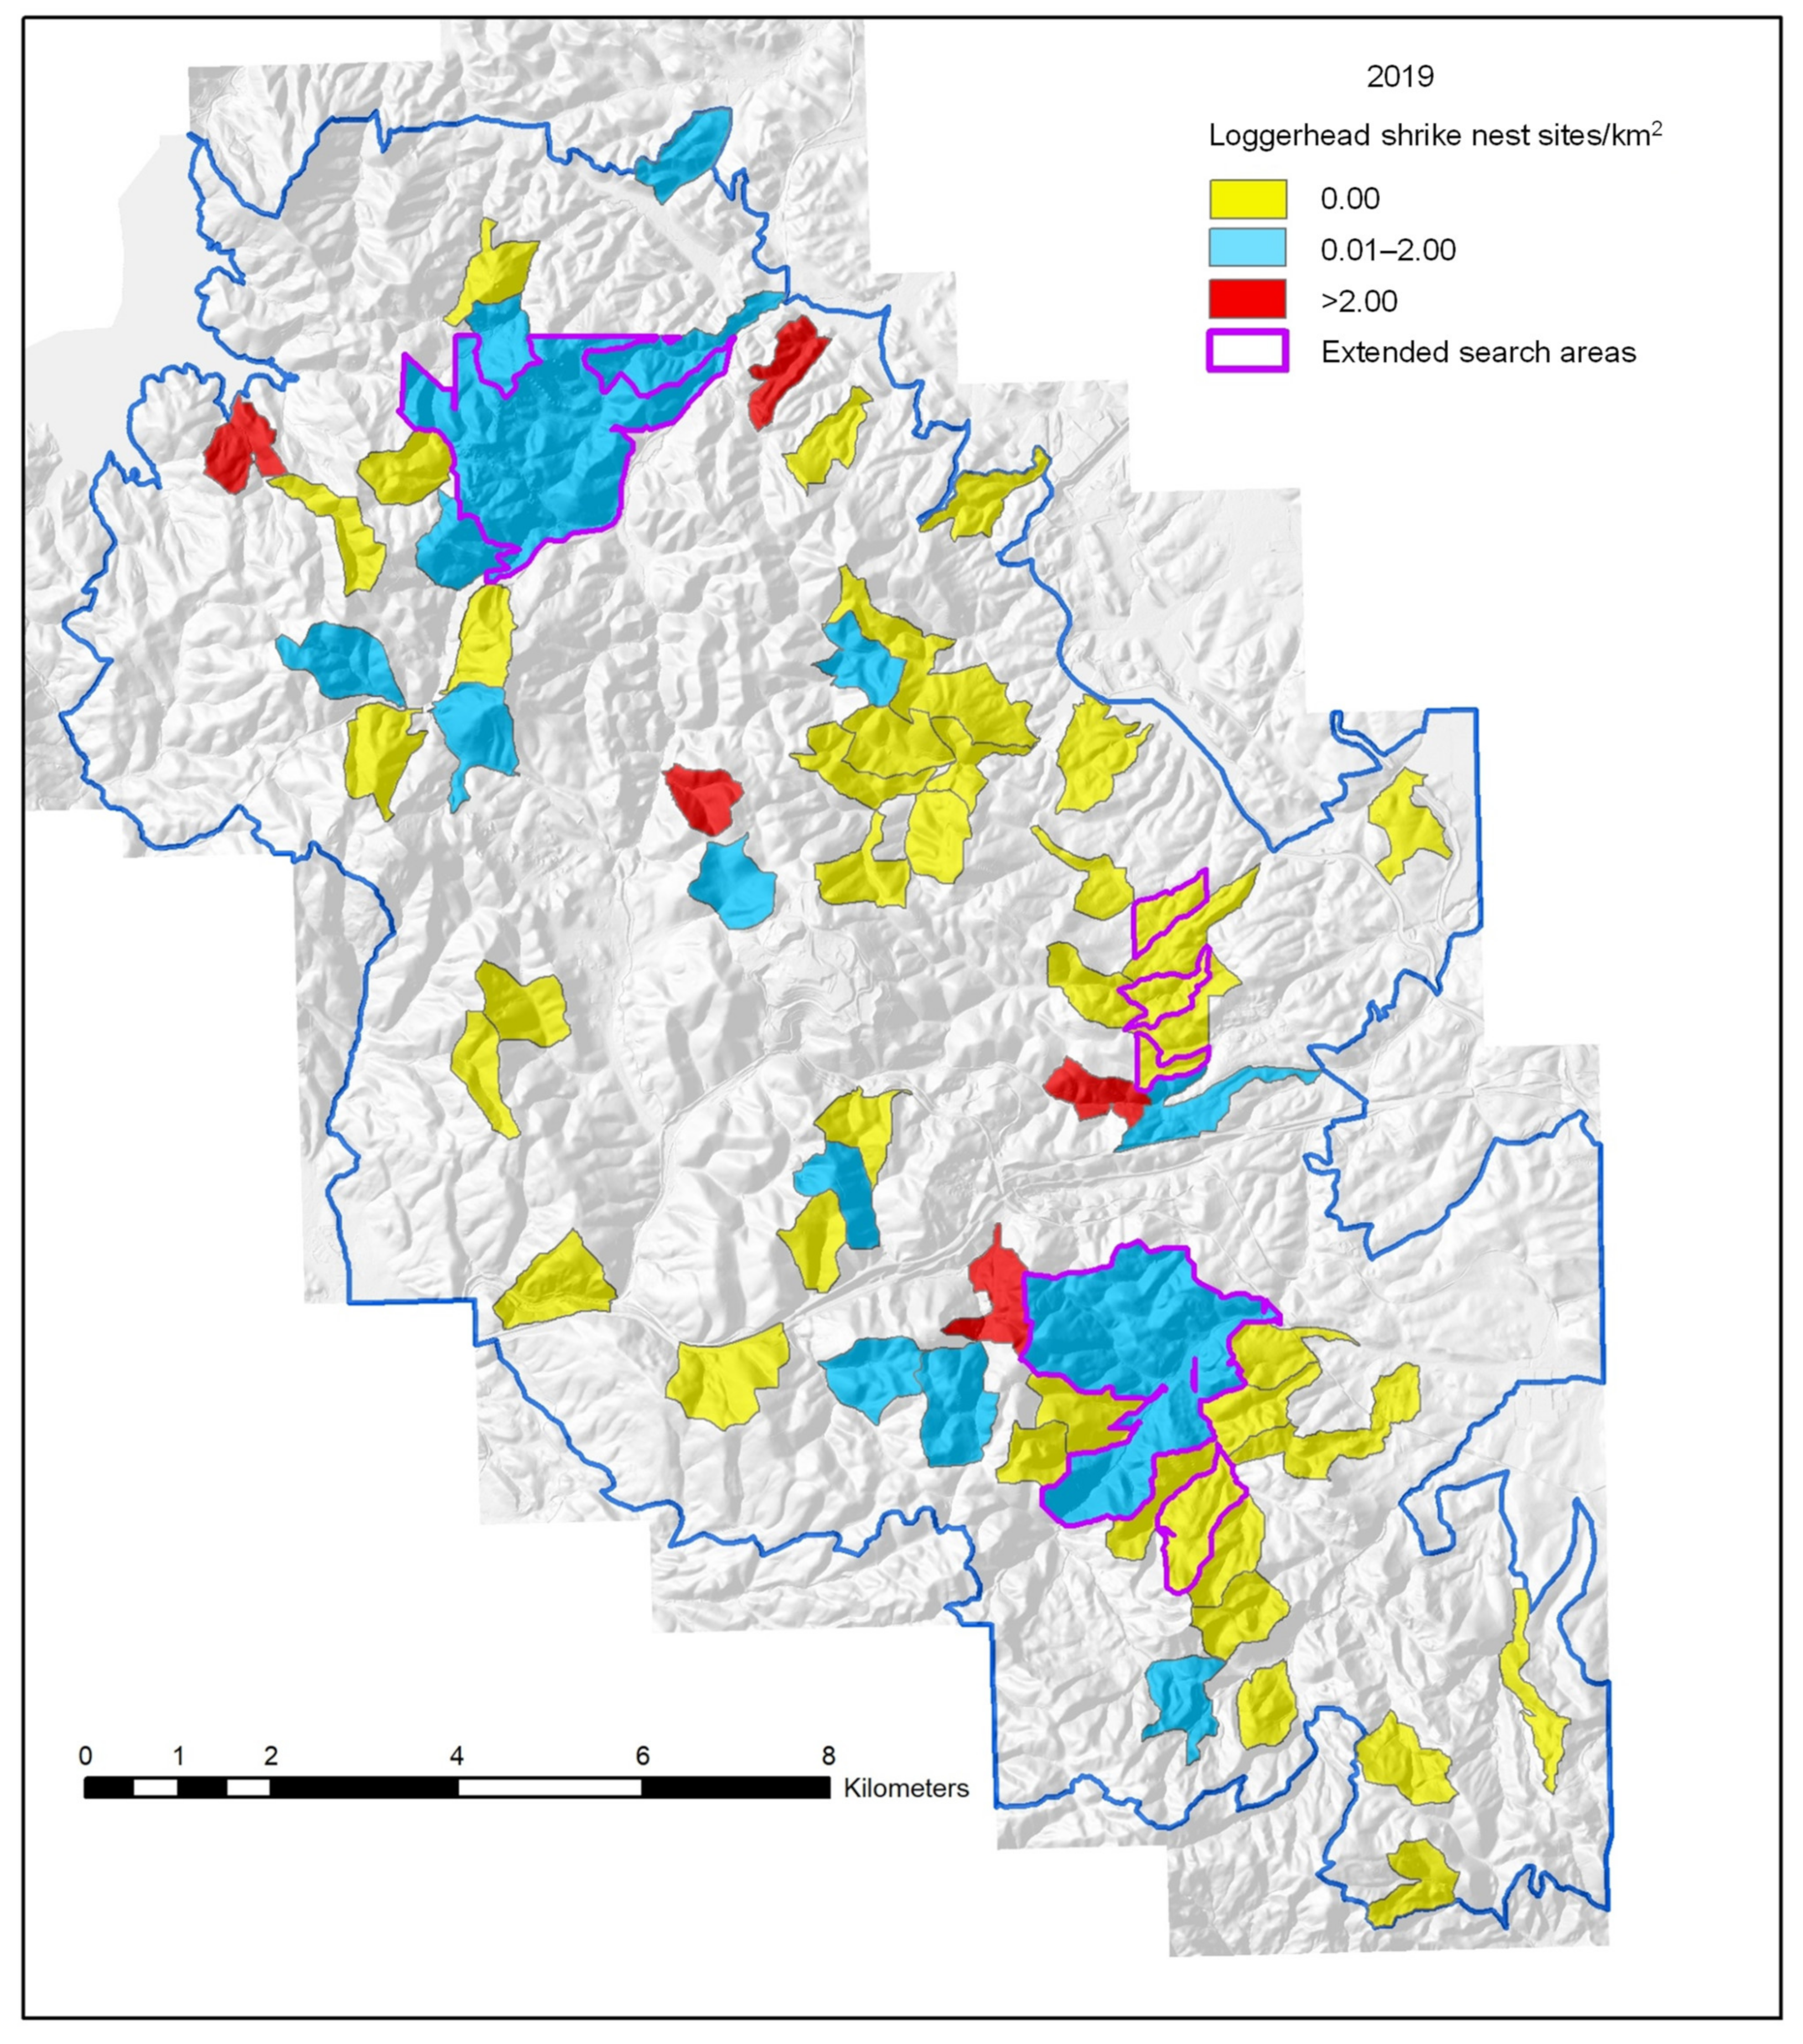
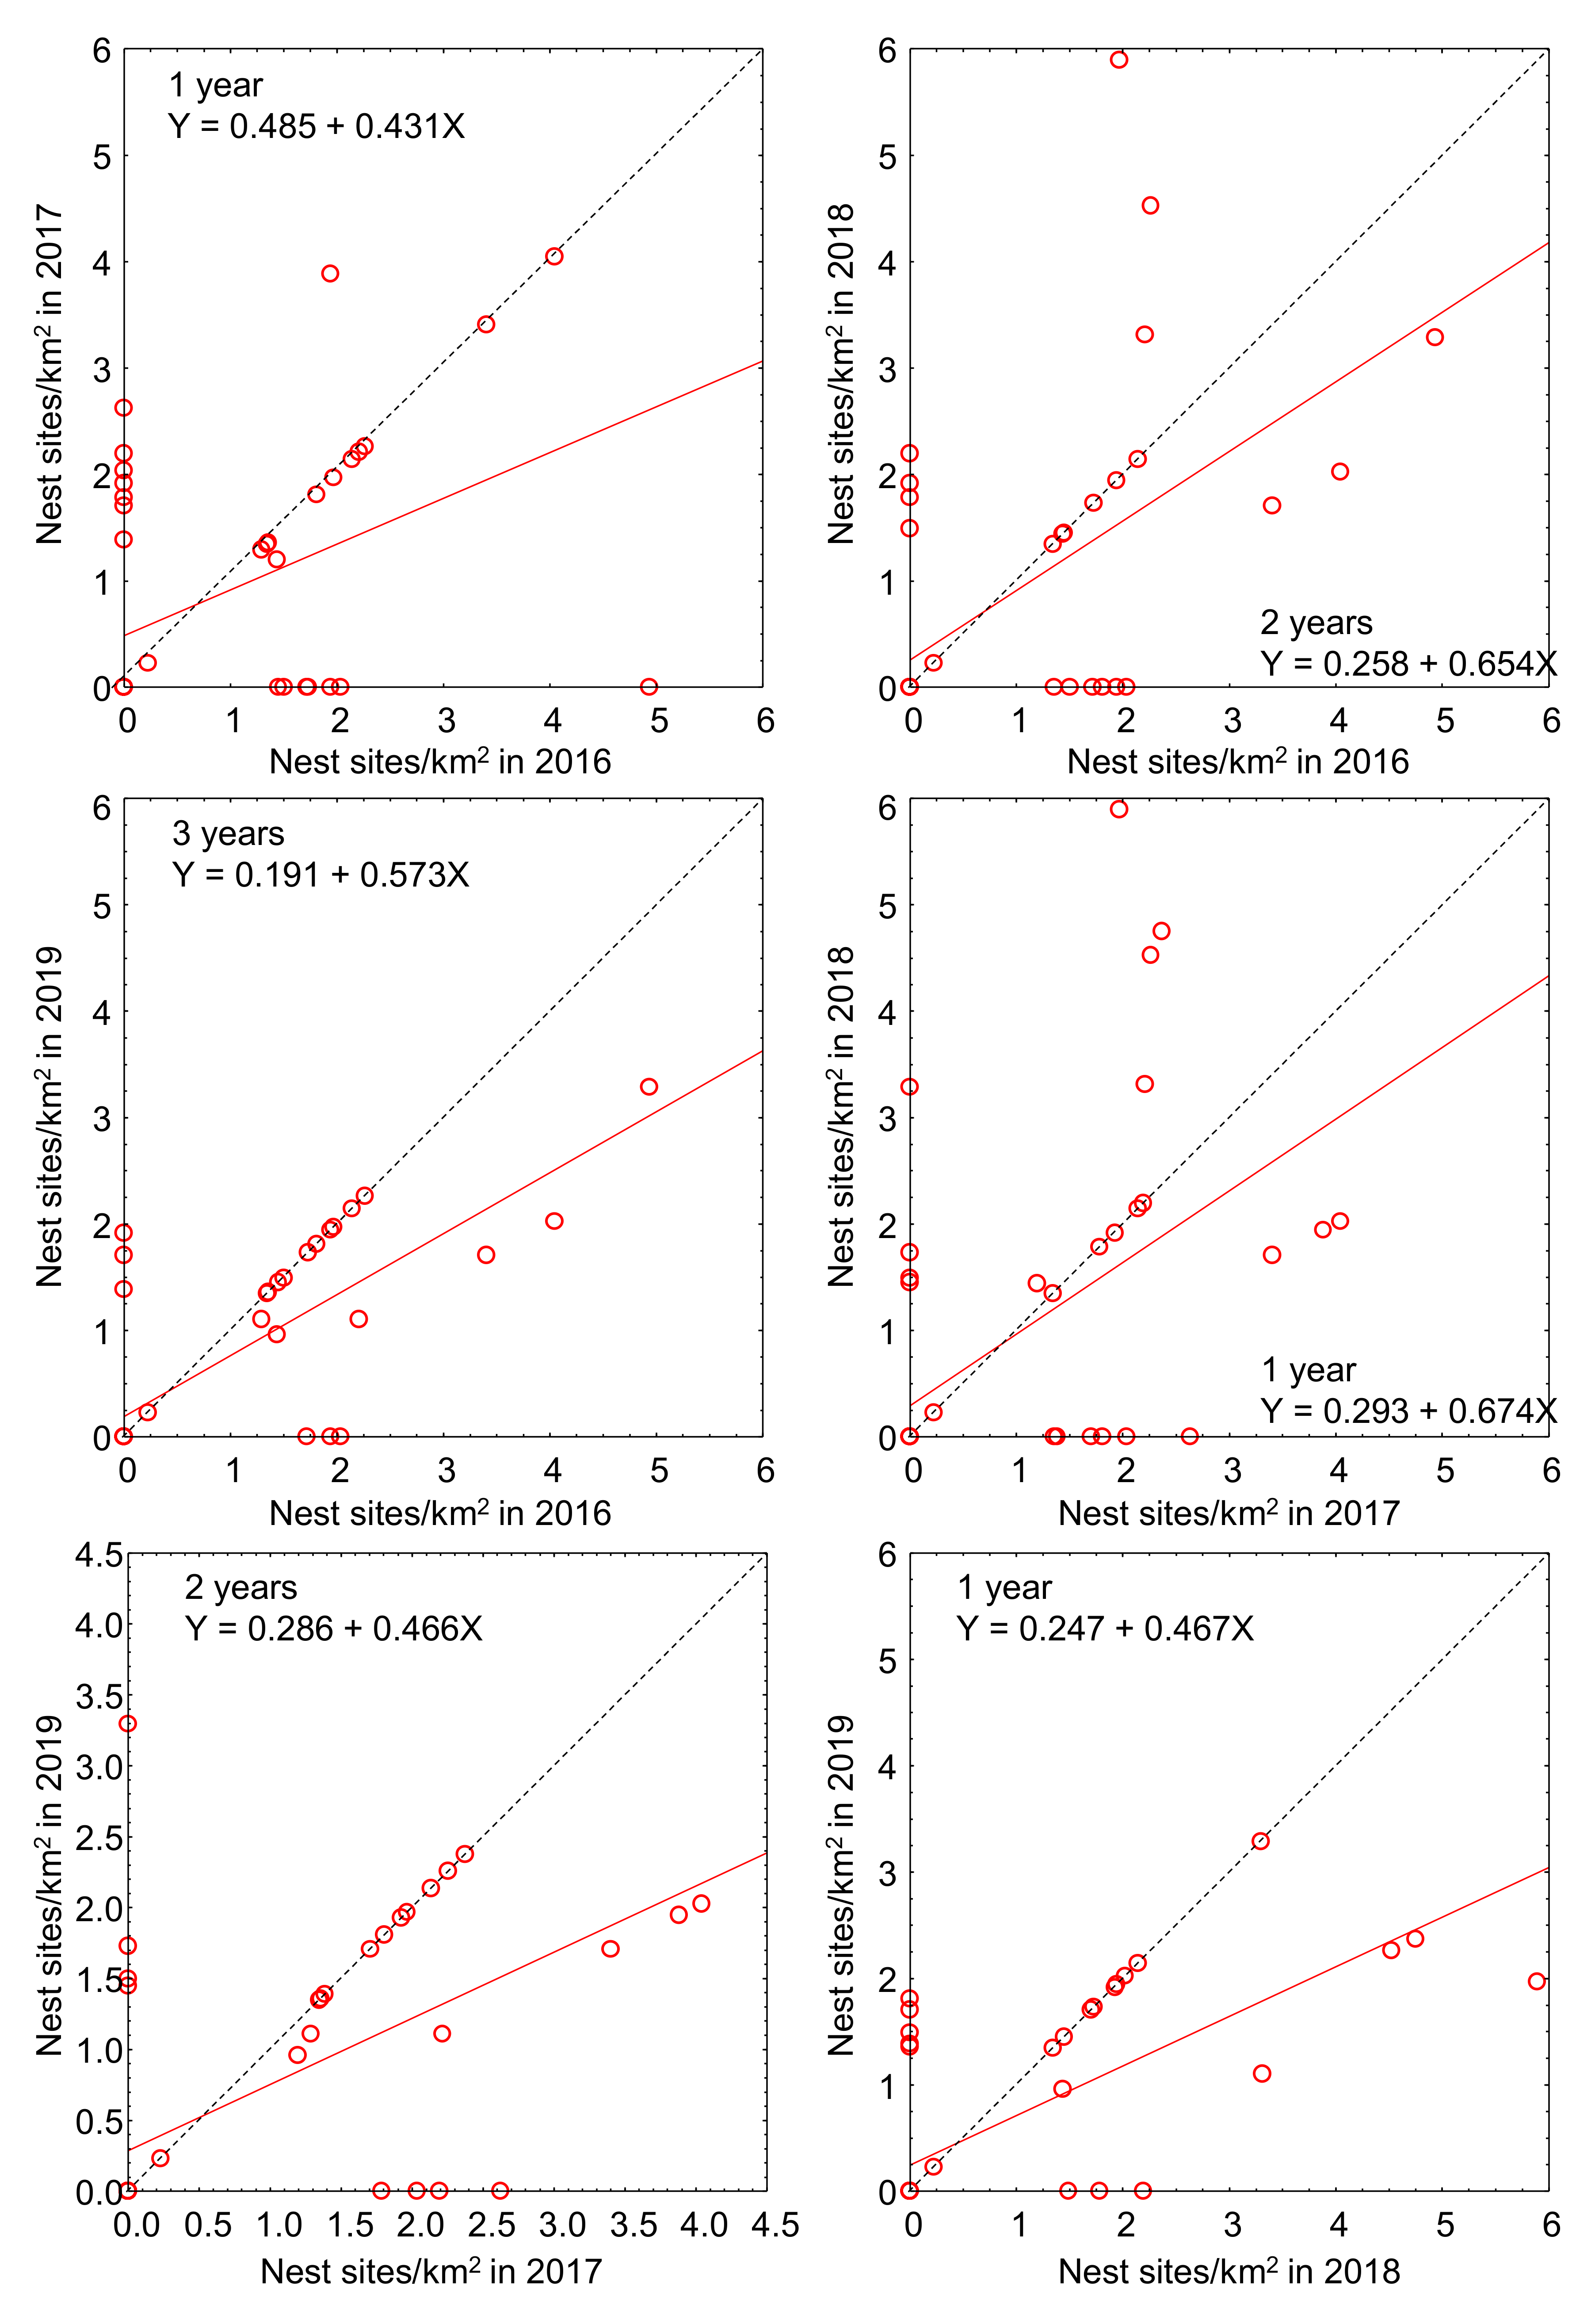
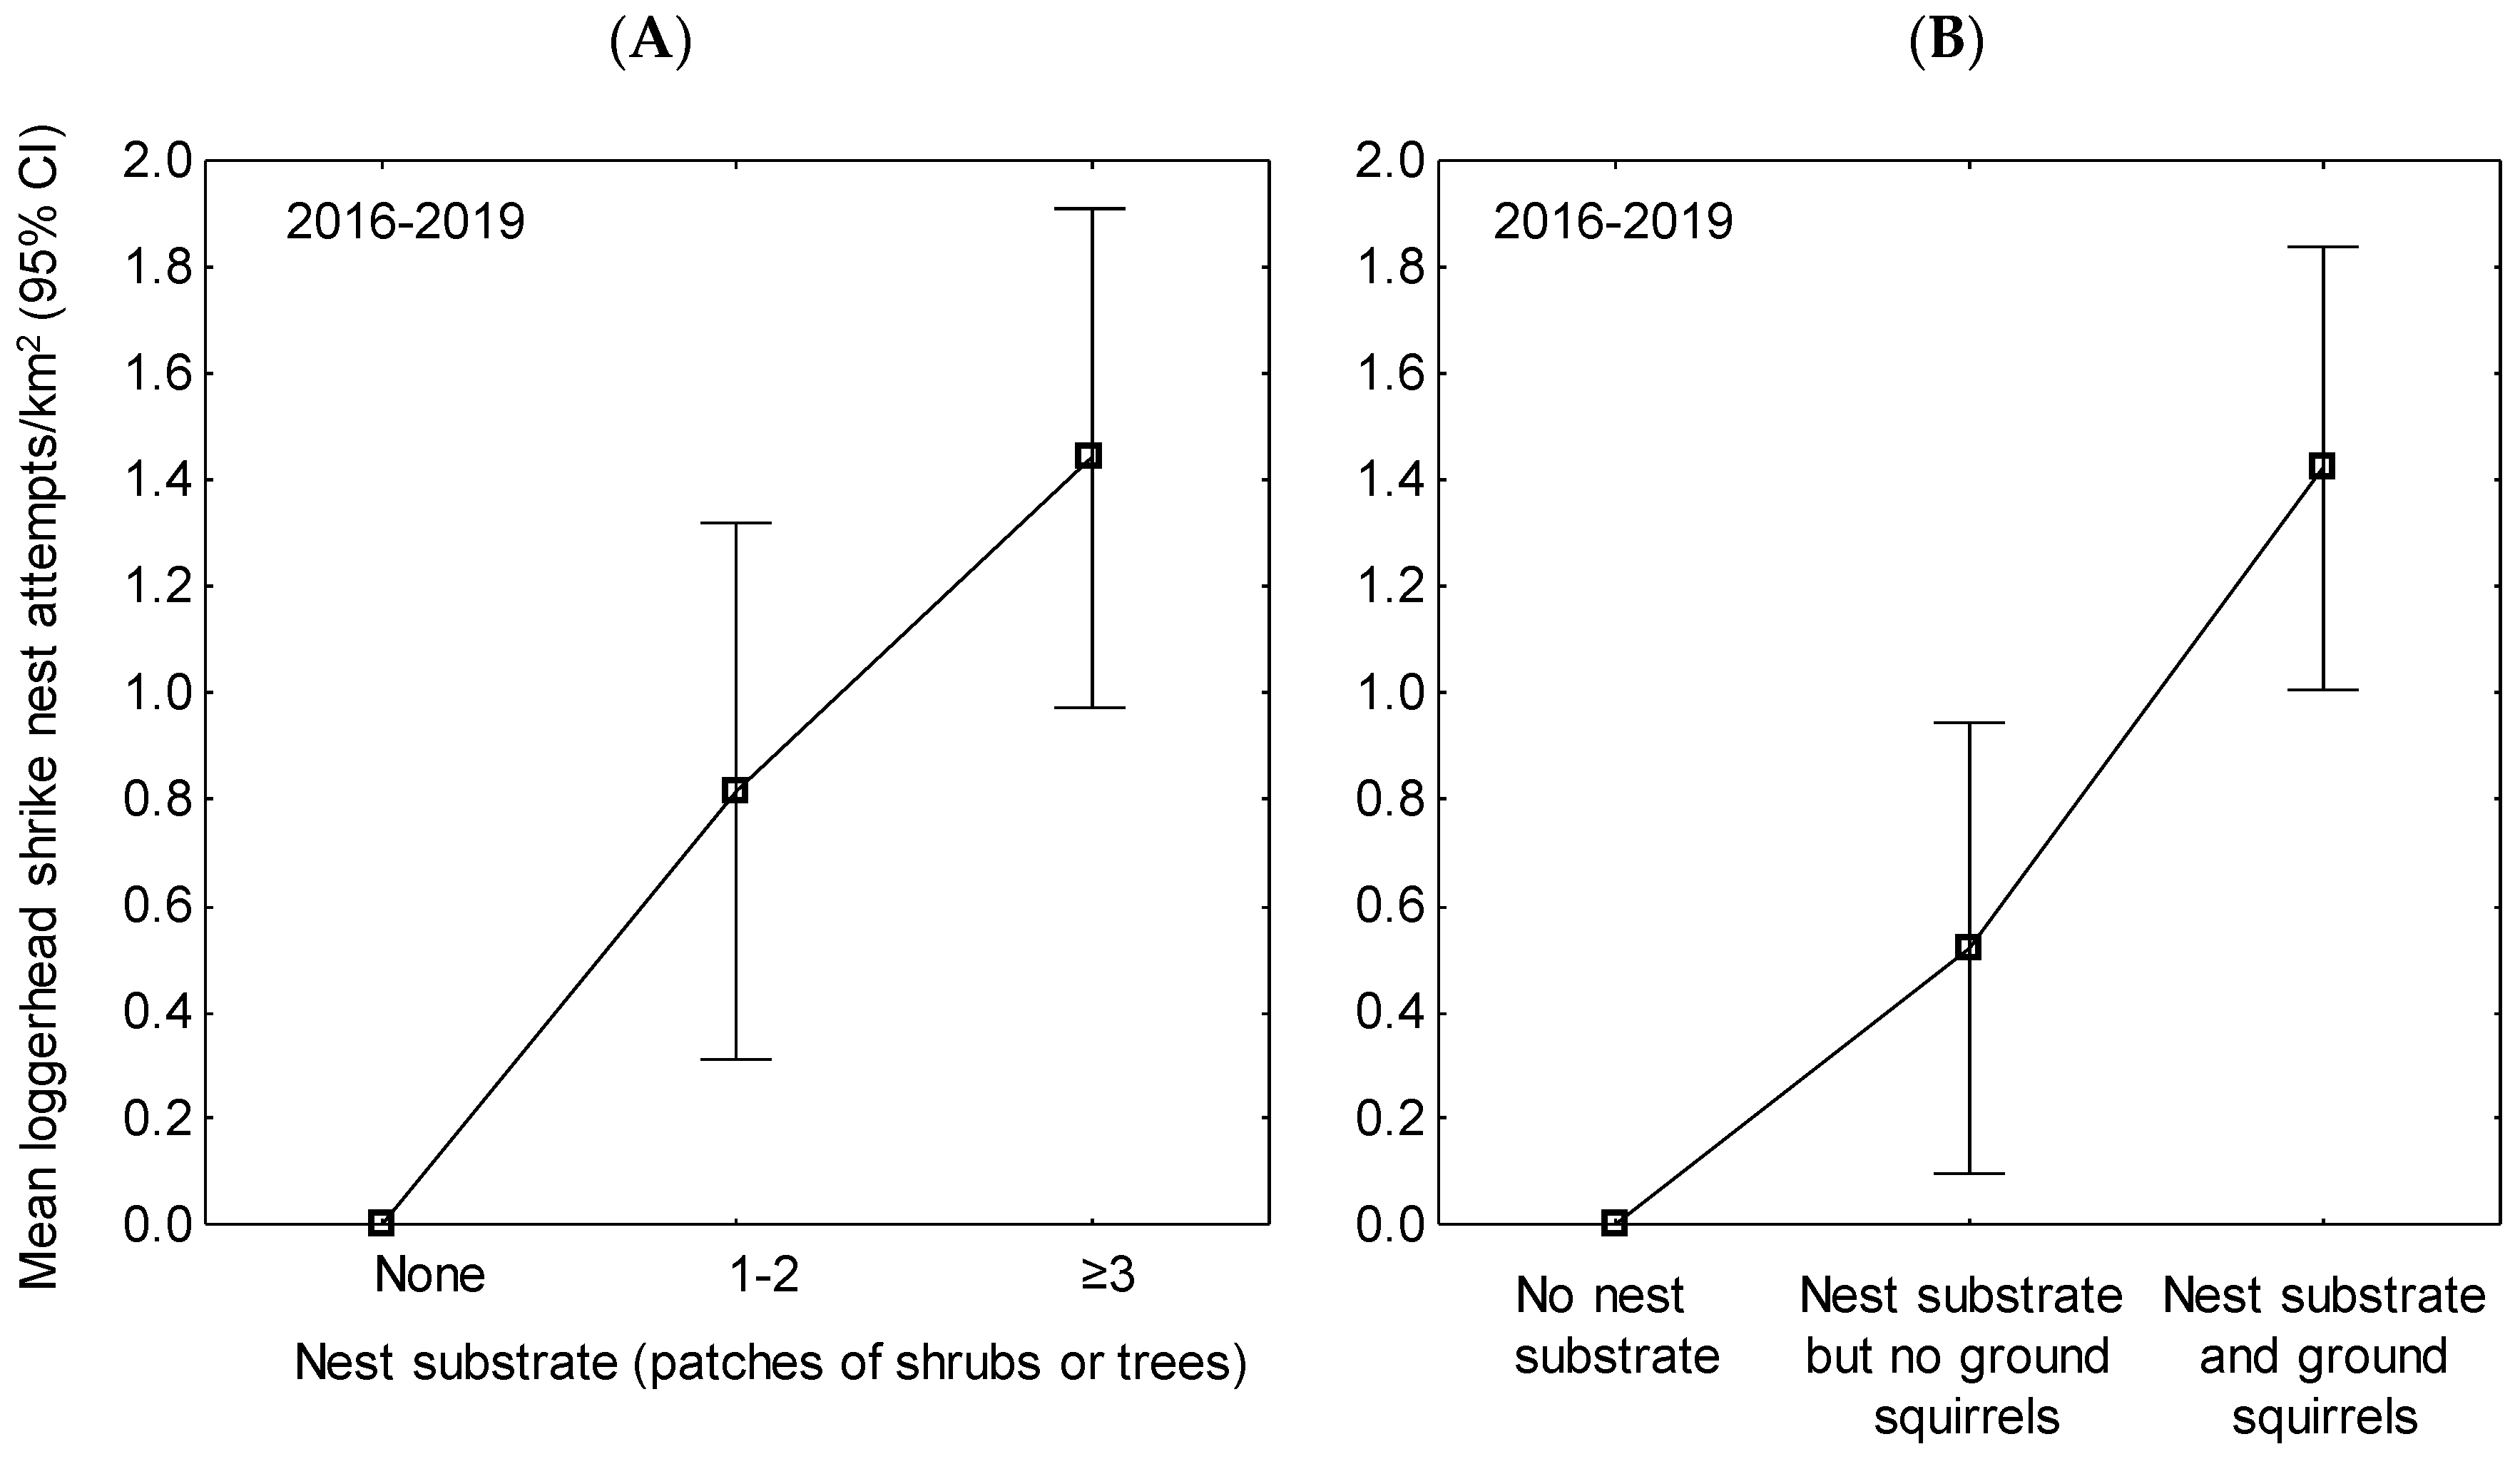
3.1. Breeding Density Estimates

We detected nest sites of loggerhead shrikes on 26 of the 51 (51%) randomized survey plots that we searched through ≥1 breeding seasons. Among the randomized plots that we searched all four breeding seasons, 2016–2019, we detected nest sites on 26 of 46 (57%) of them. We estimated a mean 129 nest sites per year across the AWRA, with a high of 138 nest sites in 2017 and a low of 106 nest sites in 2019 (Table 1).
Mean annual density estimates among studies [6,12,25,26,27,28,29,30,31] declined with increasing study area size (r2 = 0.45, SE = 0.90, p = 0.0038; Figure 6A). Compared to density estimates at other study sites, and considering the effect of the size of the study area on density estimates, loggerhead shrikes in the APWRA represented a relatively high density (Figure 6B). With mean annual estimate of 129 pairs, the APWRA estimate likely represented a metapopulation composed of about six breeding populations.
Among survey plots, density averaged highest in plots 10.2 and 22.2, which were in the north-central and northwestern Vasco Winds portions of the APWRA (Table 2). The most consistently high-density plots included 2, 3.2, 12.1, and 22.2, all of which were bisected by streams that supported shrubs or trees (Figure 7, Figure 8, Figure 9 and Figure 10). Despite the interannual consistency among these high-density plots, the pattern of density among randomized survey plots was poorly predictive from one year to the next (Figure 11).
Among the 25 randomized survey plots that consistently supported no loggerhead shrike nest sites, 21 (84%) lacked nest substrate. Of the four plots that consistently supported no loggerhead shrike nest sites but which did have at least minimally available nest substrate, two (50%) lacked California ground squirrels, and one supported only a few squirrels.
Nest sites/km2 averaged 1.087 (95% CI: 0.694–1.481) in 35 plot-years where ground squirrels were not controlled. Nest sites/km2 averaged 0.696 (95% CI: 0.153–1.239) in 21 plot-years where squirrels had been controlled in the past but where it was unclear whether they were controlled during the past year. Nest sites/km2 averaged 0 in 9 plot-years where ground squirrels were certainly controlled during the past year. The differences were significant (F = 3.76, DF = 2,62, p = 0.02869). Despite the implication of squirrel control in the preceding test, mean annual nest sites/km2 did not differ by availability and abundance of ground squirrels (F = 1.04, DF = 2, p = 0.36). However, this test outcome was performed without consideration of the availability of nest substrate. Mean annual nest sites/km2 differed significantly by availability of nest substrate in the plot (F = 22.77, DF = 2, p < 0.0001) (Figure 12A). In 2-factor analysis of variance, the nest substrate × ground squirrel interaction effect was significant (F = 3.04, DF = 4, p = 0.0252). Mean annual nest sites/km2 differed significantly by whether plots included nest substrate and ground squirrels (F = 26.65, df = 2, p < 0.0001) (Figure 12B).
Over the four years of our study, we recorded 45 nest sites where nesting was attempted from 1 to 4 years of the study. We recorded 31 nest attempts in red willow (Salix laevigata), 16 in blue gum eucalyptus, 8 in blue elderberry (Sambucus nigra ssp. caerulea), 5 in poison oak (Toxicodendron diversilobum), 4 in oak gooseberry (Ribes quercetorum), 4 in blue oak (Quercus douglasii), 4 in ornamental trees at former home sites (1 in a fir, 1 in a pine), 3 in coast live oak (Quercus agrifolia), 3 in Fremont cottonwood (Populus fremontii), 3 in yucca (Yucca sp.), 3 in salt cedar (Tamarix sp.), 3 in coyote bush (Baccharis pilularis), 2 in iodine bush (Allenrolfea occidentalis), 2 in California buckeye (Aesculus californica), 2 in almond (Prunus dulcis), 1 in fig (Ficus carica), 1 in a wood pile, and 3 on unknown substrate, but possibly milk thistle (Silybum marianum). Nest attempts in red willow occurred both within and outside riparian zones, but those in Fremont cottonwood and blue oak were along streambeds. Nest attempts in blue elderberry were on isolated plants in upland areas (Figure 13). Nests in oak gooseberry were within the only patch of oak gooseberry of which we were aware in the APWRA (Figure 14 and Figure 15). The three nest sites in coyote bush were on shrubs whose main stems emerged from the rising waters of Los Vaqueros Reservoir, and which were doomed by the Reservoir expansion. Nests in poison oak were in large patches of tall, mature poison oak. The nests in the almond and fig were in the only almond and fig trees of which we were aware in the APWRA. The nest in a wood pile was within the only plausible nest substrate on that particular survey plot.

3.2. Wind Turbine Fatality Estimates

Prior to our study, and while old-generation wind turbines continued to operate, estimates of wind-turbine-caused fatalities of loggerhead shrikes averaged 93.4 per year (95% CI: 93.2–93.6). During our study, and after old-generation wind turbines had been removed from the APWRA, estimates of wind-turbine-caused fatalities of loggerhead shrikes averaged 10.6 per year (95% CI: 10.3–10.8). Estimated fatalities varied greatly between years, but both the magnitude and variation in fatalities lessened substantially once the old-generation wind turbines were removed (Figure 16).

4. Discussion

A substantial number of loggerhead shrikes breed in the APWRA, averaging 129 breeding pairs per year. However, our estimates might have been of a metapopulation long suppressed by wind turbine collision fatalities. We estimated an annual fatality rate over the preceding 15 years that averaged 36% of the number of breeding shrikes we estimated during our study. Until the old-generation wind turbines were removed, the APWRA might have served as an ecological sink for loggerhead shrikes.
Based on the trend in fatality rates, the repowering of the APWRA should substantially reduce loggerhead shrike mortality. Blades of modern turbines tend to sweep the airspace higher off the ground than did the old-generation turbines. However, annual mortality of loggerhead shrike will likely increase in the APWRA. More repowering is proposed, and two new projects have already been approved. The installed capacity of modern turbines that existed during our study could nearly double within a few years, thereby increasing loggerhead shrike mortality to about 20 per year in the APWRA. This increased mortality would be twice the mortality during our study, but still much lower than the mortality before our study.
We hypothesize two behaviors that contributed to loggerhead shrike collisions with wind turbines. One was hovering in high winds while scanning the ground below for prey items. Just as American kestrels (Falco sparverius) and red-tailed hawks (Buteo jamaicensis) behave, loggerhead shrikes hover and kite in the slope-deflected updrafts near the tops of slopes, which is where most of the wind turbines are sited. Another was the frequent and determined chasing of birds of other species. Once a chase begins, loggerhead shrikes pursue fleeing birds for up to hundreds of meters. Both of these behaviors, hovering and chasing, distract shrikes from the threat posed by wind turbines. However, it is possible that an entirely different causal factor is at work.
Additional limiting factors for loggerhead shrikes in the APWRA include the availability of nest substrate and California ground squirrels. As the APWRA is repowered, nest substrate is lost to construction grading for wind turbine pads and access roads. Nest substrate is also lost to slope failures and other forms of soil erosion caused by the cutting of slopes for construction grading. Construction grading also destroys California ground squirrels and their burrow complexes. The greater threat to ground squirrels, however, is the expanding and intensifying efforts to eradicate ground squirrels, which are often accused of competing with cattle for forage. Over the decade leading to the end of our study, the extent of ground squirrel burrow complexes in the APWRA declined >65% (K. S. Smallwood, unpublished data). Only rarely did we find loggerhead shrikes breeding on sampling plots without the presence of California ground squirrels.
Although we did not quantify functional relationships between loggerhead shrikes and ground squirrels, we often observed evidence of the relationship. Tall herbaceous vegetation clusters at ground squirrel burrow complexes and serves as hunting perches for loggerhead shrikes. Ground squirrels also attract many small mammals, grassland birds, and arthropods, which benefit from the squirrels’ subterranean burrows and from the cleared ground around squirrel burrow complexes. Loggerhead shrikes can perch at squirrel burrow complexes, putting them close to potential prey that are also often more visible on the open ground amid the burrows. We observed loggerhead shrikes capture prey items, which the shrikes would either deliver to the nest or pin onto a nearby thistle, sharp stem of a dried plant, or barbs of barbed-wire fences. The prey that were pinned to sharp objects were often eaten by the shrikes, but many were left dead or dying without having been consumed.
Loggerhead shrikes in the APWRA shifted locations interannually to the degrees that they were able, given the availability of nest substrate and ground squirrels. Densities of nest sites in one year could only poorly predict nest site densities the following year. That loggerhead shrike densities were spatially dynamic was consistent with the tendency of animal populations to shift activity centers every generation or so [32]. The persistence of shrikes in the APWRA might also depend on the capacity of breeding pairs to shift locations between years to exploit food resources where they have been rested and to escape parasite and predator loads. It might also be important for new breeders to move away from natal areas.
Loggerhead shrikes exhibited the tendency to shift activity areas between years, but a few nest sites were used repeatedly. These nest sites tended to be located where alternative nest sites were unavailable, or where squirrels were abundant or the nest substrate offered greater protection against predators. Oak gooseberry appeared particularly protective of shrike nests, as it bore many long, sharp thorns and often hosted northern Pacific rattlesnakes. Each year that we checked on the nest site amid oak gooseberry, we saw numerous fledglings. The site was productive. Another nest site that fared well was located just above a hornets’ nest in a blue gum eucalyptus. Another was within a yucca, the sharp leaves of which probably discouraged most potential predators. Nests within red willow were typically constructed deep into the interior amid thickets of branches. We found that loggerhead shrikes selected shrubs and trees that provided protection from predators, consistent with findings elsewhere [33].
Although it has been asserted that shrikes are attracted to roads due to the barbed-wire fences and shrubs often lining roads [2], we located few nest sites near roads. Portions of plots with the highest densities of nest sites tended to be in the remotest portions of the APWRA. The canyon with the most nest sites required a half day’s hike over difficult terrain to access vantage points to observe the shrikes. Most other nest sites were accessible by ranch roads or short hikes from wind turbine access roads. The pattern of distribution we observed did not support the notion that regional population estimates could be accurately made from roadside counts. Indeed, the Partners in Flight estimate for Bird Conservation Region 32, projected to the area of the APWRA, would predict 160.6 (95% CI: 82.3–281.0) shrikes. Assuming our estimated number of breeding pairs included all of the adult loggerhead shrikes in the APWRA, which we realize it probably did not, we estimated 258 adult loggerhead shrikes in the APWRA in the average year. Even without accounting for floaters, our estimate was 1.6 times more than the PIF prediction. In our experience, loggerhead shrike abundance increased at greater distances from roads.

5. Conclusions

The Altamont Pass Wind Resource Area supports substantial numbers of breeding loggerhead shrikes in California, but until recently might have also served as an ecological sink for shrikes due to wind turbine collision mortality. Repowering the APWRA reduced mortality caused by wind turbines, but as repowering continues towards the capacity desired by Alameda County, more loggerhead shrikes will be killed by wind turbines than the 10 per year during our study.
Loggerhead shrikes in the APWRA are limited in their nesting distribution by availability of nest substrate and California ground squirrels. These limitations are increasing as construction grading removes shrubs and trees, as well as ground squirrels and their burrow complexes. Already, half of the APWRA is unused by loggerhead shrikes for nesting. The trend could be reversed by conserving nest substrate and ground squirrels, and by cultivating trees and shrubs that offer superior protection against predators. Oak gooseberry would be an ideal candidate for cultivation to conserve loggerhead shrikes.
Our findings were at odds with the often-repeated assertion that loggerhead shrikes are attracted to roads, and therefore that road counts can support accurate regional estimates of abundance. Partners in Flight’s estimator substantially underestimated the number of loggerhead shrikes in the APWRA. We found that where feasible, loggerhead shrikes established nest sites in the remotest portions of our study area. Where feasible, census of loggerhead shrikes across study plots would likely contribute to more accurate estimates of distribution and abundance than would roadside counts.

Author Contributions

K.S.S. conceived of the study, acquired funding, developed the methods, and analyzed data. Both K.S.S. and N.L.S. performed surveys and contributed to the writing of the manuscript. All authors have read and agreed to the published version of the manuscript.

Funding

This research was funded by a mitigation fund paid for by NextEra Energy Resources per a settlement agreement with the California Attorney General’s Office and Audubon Society.

Institutional Review Board Statement

Not applicable.

Data Availability Statement

Data on loggerhead shrike breeding densities among randomized sampling plots in the APWRA are held by K.S. Smallwood and can be available upon request.

Acknowledgments

We thank Lee Neher for his GIS support. We thank private landowners and East Bay Regional Park District for access to the study area.

Conflicts of Interest

The authors declare no conflict of interest.

References

  1. Yosef, R.; Layne, J.N.; Lohrer, F.E. Trends in numbers of loggerhead shrikes on roadside censuses in Peninsular Florida, 1974–1992. Fla. Sci. 1993, 56, 92–97. [Google Scholar]
  2. Cade, T.J.; Woods, C.P. Changes in distribution and abundance of the Loggerhead Shrike. Conserv. Biol. 1997, 11, 21–31. [Google Scholar] [CrossRef]
  3. Sauer, J.R.; Hines, J.E.; Fallon, J.E.; Pardieck, K.L.; Ziolkowski, D.J., Jr.; Link, W.A. The North American Breeding Bird Survey, Results and Analysis 1966–2010; Version 12.07.2011; USGS Patuxent Wildlife Research Center: Laurel, MD, USA, 2011.
  4. Shuford, W.D.; Gardali, T. (Eds.) California Bird Species of Special Concern: A Ranked Assessment of Species, Subspecies, and Distinct Populations of Birds of Immediate Conservation Concern in California; Studies of Western Birds 1; Western Field Ornithologists: Camarillo, CA, USA, 2008. [Google Scholar]
  5. Smallwood, K.S.; Nakamoto, B. Impacts of West Nile Virus Epizootic on Yellow-Billed Magpie, American Crow, and other Birds in the Sacramento Valley, California. Condor 2009, 111, 247–254. [Google Scholar] [CrossRef]
  6. Woods, C.P. Status of loggerhead shrikes in the sagebrush habitat of southwestern Idaho. Proc. West. Found. Vertebr. Zool. 1995, 6, 150–154. [Google Scholar]
  7. Luukkonen, D.R. Status and Breeding Ecology of the Loggerhead Shrike in Virginia. Master’s Thesis, Virginia Polytechnical Institute and State University, Blacksburg, VA, USA, 1987. [Google Scholar]
  8. Novak, P.G. Habitat selection by breeding Loggerhead Shrikes in northern New York. Proc. West. Found. Vertebr. Zool. 1995, 6, 176–181. [Google Scholar]
  9. Andersen, D.E.; Rongstad, O.J. Surveys for wintering birds of prey in southeastern Colorado: 1983–1988. J. Raptor Res. 1989, 23, 152–156. [Google Scholar]
  10. Kridelbaugh, A. Nesting ecology of the Loggerhead Shrike in Central Missouri. Wilson Bull. 1983, 95, 303–308. [Google Scholar]
  11. DeGeus, D.W. Productivity and Habitat Preferences of Loggerhead Shrikes Inhabiting Roadsides in a Midwestern Agroenvironment. Iowa State University Retrospective Theses and Dissertations. 1990. Available online: https://lib.dr.iastate.edu/rtd/16818 (accessed on 27 October 2021).
  12. Scott, T.A.; Morrison, M.L. Natural history and management of the San Clemente loggerhead shrike. Proc. West. Found. Vertebr. Zool. 1990, 4, 23–57. [Google Scholar]
  13. Thogmartin, W.E.; Howe, F.P.; James, F.C.; Johnson, D.H.; Reed, E.T.; Sauer, J.R.; Thompson, F.R., III. A review of the population estimation approach of the North American Landbird Conservation Plan. Auk 2006, 123, 892–904. [Google Scholar] [CrossRef]
  14. Smallwood, K.S. Linking habitat restoration to meaningful units of animal demography. Restor. Ecol. 2001, 9, 253–261. [Google Scholar] [CrossRef]
  15. Smallwood, K.S. Scaling Swainson’s hawk population density for assessing habitat-use across an agricultural landscape. J. Raptor Res. 1995, 29, 172–178. [Google Scholar]
  16. Smallwood, K.S. On the evidence needed for listing northern goshawks (Accipter gentilis) under the Endangered Species Act: A reply to Kennedy. J. Raptor Res. 1998, 32, 323–329. [Google Scholar]
  17. Smallwood, K.S.; Morrison, M.L. Nest-site selection in a high-density colony of burrowing owls. J. Raptor Res. 2018, 52, 454–470. [Google Scholar] [CrossRef]
  18. Smallwood, K.S.; Neher, L.; Mount, J.; Culver, R.C.E. Nesting Burrowing Owl Abundance in the Altamont Pass Wind Resource Area, California. Wildl. Soc. Bull. 2013, 37, 787–795. [Google Scholar] [CrossRef]
  19. Smallwood, K.S. Long search intervals under-estimate bird and bat fatalities caused by wind turbines. Wildl. Soc. Bull. 2017, 41, 224–230. [Google Scholar] [CrossRef]
  20. Smallwood, K.S.; Bell, D.A.; Walther, E.L.; Leyvas, E.; Standish, S.; Mount, J.; Karas, B. Estimating wind turbine fatalities using integrated detection trials. J. Wildl. Manag. 2018, 82, 1169–1184. [Google Scholar] [CrossRef]
  21. Smallwood, K.S. Comparing bird and bat fatality-rate estimates among North American wind-energy projects. Wildl. Soc. Bull. 2013, 37, 19–33. [Google Scholar] [CrossRef]
  22. Brown, K.; Smallwood, K.S.; Szewczak, J.; Karas, B. Final 2012–2015 Report Avian and Bat Monitoring Project Vasco Winds; LLC. Prepared for NextEra Energy Resources: Livermore, CA, USA, 2016. [Google Scholar]
  23. T. Harvey & Associates. Golden Hills Wind Energy Center Post-Construction Fatality Monitoring Report: Final 3-Year Report; Prepared for Golden Hills Wind, LLC: Livermore, CA, USA, 2020. [Google Scholar]
  24. Smallwood, K.S.; Bell, D.A.; Standish, S. Dogs detect larger wind energy impacts on bats and birds. J. Wildl. Manag. 2020, 84, 852–864. [Google Scholar] [CrossRef] [Green Version]
  25. Morrison, M.L.; Kuehler, C.M.; Scott, T.A.; Lieberman, A.A.; Everett, W.T.; Phillips, R.B.; Koehler, C.E.; Aigner, P.A.; Winchell, C.; Burr, T. San Clemente loggerhead shrike: Recovery plan for an endangered species. Proc. West. Found. Vertebr. Zool. 1995, 6, 293–295. [Google Scholar]
  26. Bjorge, R.R.; Prescott, D.R.C. Population estimate and habitat associations of the loggerhead shrike, Lanius ludovicianus, in southeastern Alberta. Can. Field-Nat. 1996, 110, 445–449. [Google Scholar]
  27. Collister, D.M.; de Smet, K. Breeders and natural dispersal in the loggerhead shrike. J. Field Ornithol. 1997, 68, 273–282. [Google Scholar]
  28. Medin, D.E. Grazing and Passerine breeding birds in a Great Basin low-shrub desert. Great Basin Nat. 1986, 46, 567–572. [Google Scholar]
  29. Gawlik, D.E.; Bildstein, K.L. Reproductive success and nesting habitat of loggerhead shrikes in north-central South Carolina. Wilson Bull. 1990, 102, 37–48. [Google Scholar]
  30. Poole, L.D. Reproductive Success and Nesting Habitat of Loggerhead Shrikes in Shrubsteppe Communities. Master’s Thesis, Oregon State University, Corvallis, OR, USA, 1992. [Google Scholar]
  31. Collister, D.M.; Wilson, S. Territory size and foraging habitat of loggerhead shrikes (Lanius ludovicianus) in southeastern Alberta. J. Raptor Res. 2007, 41, 130–138. [Google Scholar] [CrossRef]
  32. Taylor, R.A.J.; Taylor, L.R. A behavioral model for the evolution of spatial dynamics. In Population Dynamics; Anderson, R.M., Turner, B.D., Taylor, L.R., Eds.; Blackwell Scientific Publications: Oxford, UK, 1979; pp. 1–28. [Google Scholar]
  33. Guo, X.; He, Y.; Wilmshurst, J.F. Managing Loggerhead Shrike Habitat Using Remote Sensing Products. In Proceedings of the American Society of Photogrammetry and Remote Sensing Annual Confernce, ASPRS 2009, Baltimore, MD, USA, 8–13 March 2009; Available online: https://www.asprs.org/a/publications/proceedings/baltimore09/0027.pdf (accessed on 30 September 2021).
Figure 1. A westward view of a portion of the Altamont Pass Wind Resource Area including Siemans 2.3 MW wind turbines of the Vasco Wind Energy Project in the background and Vestas 660 KW wind turbines of the Diablo Winds Project in the foreground, 14 June 2017.
Diversity 13 00540 g001
Figure 2. Loggerhead shrike hunting from the stem of a large plant that had grown near ground squirrel burrows. Not only did ground squirrels provide perch opportunities, but also bare ground where prey items were exposed to shrikes.
Diversity 13 00540 g002
Figure 3. Loggerhead shrike hunting from thistle that grew from a ground squirrel burrow complex on survey plot 14, Altamont Pass Wind Resource Area, 30 July 2019. Note the presence of three ground squirrels under the plant.
Diversity 13 00540 g003
Figure 4. Randomly selected survey plots (black boundaries) and extended plots (purple boundaries) searched for loggerhead shrikes in the Altamont Pass Wind Resource Area, California, 2016–2019. The sampling was originally designed for burrowing owls. Plot 100 was inaccessible during surveys for loggerhead shrike. Our surveys for loggerhead shrikes were insufficient in plots 7.1 and 12.4, so they were omitted from analysis. The APWRA was located between the Cities of Livermore and Tracy.
Diversity 13 00540 g004
Figure 5. Loggerhead shrike carrying a lizard’s tail to a nest in a nearby yucca that had been planted as an ornamental on the south side of a cattle ranch in the northern aspect of the Altamont Pass Wind Resource Area, May 2016.
Diversity 13 00540 g005
Figure 6. Density of loggerhead shrike nest sites related as an inverse power function to increasing size of the study area used to make the density estimate (A), and the mean annual number of nest sites increased with increasing study area size (B) where the estimate at the largest study area was omitted so that the pattern of the relationship could be seen. The filled red circle represented the mean annual density estimate in the Altamont Pass Wind Resource Area, 2016–2019. The open circles far below the trend represented densities at San Clemente Island, where the species was endangered [12,25].
Diversity 13 00540 g006
Figure 7. Pattern of loggerhead shrike nest-site density among survey plots of the Altamont Pass Wind Resource Area in 2016, Alameda and Contra Costa Counties, California.
Diversity 13 00540 g007
Figure 8. Pattern of loggerhead shrike nest-site density among survey plots of the Altamont Pass Wind Resource Area in 2017, Alameda and Contra Costa Counties, California.
Diversity 13 00540 g008
Figure 9. Pattern of loggerhead shrike nest-site density among survey plots of the Altamont Pass Wind Resource Area in 2018, Alameda and Contra Costa Counties, California.
Diversity 13 00540 g009
Figure 10. Pattern of loggerhead shrike nest-site density among survey plots of the Altamont Pass Wind Resource Area in 2019, Alameda and Contra Costa Counties, California.
Diversity 13 00540 g010
Figure 11. Breeding densities of loggerhead shrikes among randomized plots regressed on breeding densities 1–3 years earlier, Altamont Pass Wind Resource Area, California, 2016–2019. Dashed lines are theoretical lines of equivalence between years.
Diversity 13 00540 g011
Figure 12. Responses of breeding loggerhead shrike density to variation in nest substrate (A) and both nest substrate and ground squirrel presence (B) among randomized sampling plots in the Altamont Pass Wind Resource Area, California, 2016–2019.
Diversity 13 00540 g012
Figure 13. Nest site of loggerhead shrike within a lone blue elderberry in Vasco Caves Regional Preserve. The photo was taken 14 May 2018.
Diversity 13 00540 g013
Figure 14. An oak gooseberry in which loggerhead shrikes nested in 2016 on survey plot 20.1 of the Altamont Pass Wind Resource Area. This oak gooseberry was 1 of about 10 on the same slope, which was the only slope of which we were aware that this species occurred in the APWRA. These shrubs often harbored northern Pacific rattlesnake (Crotalus viridis oreganus), which likely added predator defense in addition to the long sharp thorns of oak gooseberry.
Diversity 13 00540 g014
Figure 15. A loggerhead shrike fledgling at its nest site on oak gooseberry—the only patch of oak gooseberry of which we were aware occurred in the Altamont Pass Wind Resource Area. This patch of oak gooseberry was used as a nest site all four years of our study, and produced fledglings every year. Photo was taken 2 May 2018.
Diversity 13 00540 g015
Figure 16. Annual estimates of loggerhead shrike fatalities caused by wind turbines in the Altamont Pass Wind Resource Area, 1999–2019.
Diversity 13 00540 g016
Table 1. Annual mean nest-site density among survey plots and estimated number of nest sites of loggerhead shrikes across the 16,760-ha Altamont Pass Wind Resource Area, Alameda and Contra Costa Counties, California.
YearNumber of PlotsNest Attempts/km2APWRA Nest Attempts
x95% CIx95% CI
2016470.8040.444–1.165134.874.4–195.2
2017490.8260.483–1.168138.481.0–195.8
2018510.8140.412–1.215136.469.1–203.7
2019520.6350.377–0.893106.463.1–149.6
Table 2. Estimates of loggerhead shrike breeding pairs by sampling plot in the Altamont Pass Wind Resource Area, Alameda and Contra Costa Counties, California, 2011–2019.
PlotArea, HaYearsNest Attempts/km2Ground Squirrel AbundanceNest Substrate
x95% CI
249.08542.8241.027–4.622Very fewModerate
2.144.25740.5090.000–2.130Very fewScarce
345.73940.000 ManyNone
3.147.0640.000 ModerateNone
3.246.73742.1402.140–2.140ManyScarce
441.00840.000 ModerateNone
4.150.7540.000 Very fewNone
4.251.48142.4280.883–3.974ModerateModerate
4.366.6540.000 ManyNone
4.466.9440.000 SomeNone
4.538.0540.6570.000–2.748SomeModerate
672.17640.6930.000–1.966ModerateModerate
6.16740.3730.000–1.561NoneModerate
6.257.22740.000 NoneScarce
761.18530.000 ModerateNone
7.248.76930.000 SomeNone
872.79230.000 ManyNone
8.157.41140.000 ManyNone
1053.51940.000 FewNone
10.158.64340.8530.000–2.419ModerateScarce
10.242.14833.1630.000–6.566ModerateModerate
1184.23440.000 Very fewNone
11.153.70140.000 Very fewNone
11.253.3840.000 NoneNone
1261.75940.000 SomeNone
12.160.73842.8810.000–6.178Very fewModerate
12.241.26140.000 Very fewNone
12.390.47542.2110.775–3.647FewModerate
12.593.02740.7490.000–2.125ManyModerate
1374.08441.3501.350–1.350FewModerate
13.150.88542.9480.000–6.075ModerateScarce
1451.33140.4870.000–2.037FewScarce
14.158.14940.4300.000–1.798FewScarce
14.253.19740.000 FewNone
1555.3641.3550.000–2.792FewModerate
15.148.77340.000 FewScarce
1652.77330.000 ModerateScarce
1757.95340.000 FewNone
17.169.08741.0860.000–2.237ModerateScarce
1854.59710.000 NoneNone
2045.53141.0980.000–3.116NoneModerate
20.158.71842.5550.990–4.119FewModerate
20.263.10840.000 NoneScarce
20.349.81940.000 FewNone
20.462.35740.000 NoneNone
2151.99341.4430.000–2.973Very fewScarce
21.149.03140.5100.000–2.133ModerateScarce
2256.01540.8930.000–2.533NoneModerate
22.157.81741.2970.000–2.673NoneModerate
22.249.44543.0341.176–4.892Very fewModerate
22.373.67641.0180.000–2.098NoneScarce
22.455.19310.000 NoneModerate
1013220.000 ModerateNone
1023420.000 ManyNone
1032220.000 ManyNone
10425030.000 FewNone
10543940.2280.228–0.228ModerateModerate
1067120.000 FewNone
10745641.2620.896–1.629Very fewModerate
Publisher’s Note: MDPI stays neutral with regard to jurisdictional claims in published maps and institutional affiliations.

