Article

The Natural Capital Value of the Seagrass Posidonia oceanica in the North-Western Mediterranean

1
Department of Earth, Environment and Life Science (DISTAV), University of Genoa, Corso Europa 26, 16132 Genoa, Italy
2
Equipe Ecosystèmes Littoraux, FRES 3041/UMR SPE 6134, Université de Corse, BP 52, 20250 Corte, France
*
Authors to whom correspondence should be addressed.
Diversity 2021, 13(10), 499; https://doi.org/10.3390/d13100499
Submission received: 24 August 2021 / Revised: 4 October 2021 / Accepted: 4 October 2021 / Published: 15 October 2021
(This article belongs to the Special Issue Biodiversity Conservation in Mediterranean Sea)

Abstract

:
Posidonia oceanica is an endemic Mediterranean seagrass used as a ‘biological quality element’ in monitoring programmes of the EU Water Framework Directive, providing information about coastal ecosystems status. The regression of P. oceanica meadows caused a growing interest among policy makers to assess the value of seagrasses and to increase their protection. An evaluation of P. oceanica meadows located in the Ligurian-Provençal basin (NW Mediterranean) through a biophysical approach is here developed. Six meadows located in Liguria (Italy) and Corsica (France) were investigated by applying the emergy analysis to assess the natural capital (NC) stocked by leaves and rhizomes components. Results highlighted the importance of carrying out an analysis of the variations in the NC value in both components: rhizomes defined the growth stage and the capacity to store NC over time; leaves provided information on the variability due to disturbances in the water column. Emergy analysis allows defining the NC, in terms of resources needed to maintain the meadows and to provide services to coastal communities. This research is inserted into the effort of incorporating the NC evaluation into marine planning and decision making to achieve nature conservation goals, while ensuring the sustainable exploitation of marine resources.

Graphical Abstract

1. Introduction

Marine coastal ecosystems are among the most productive ecosystems in the world [1,2], and they are able to provide a series of ecosystem services vital to human well-being [2,3], such as food provision, coastal protection against storms and floods, water purification, nutrients cycling, carbon sequestration, tourism and recreational and spiritual benefits [4,5,6,7]. The entire stock of natural assets (living organisms, oxygen, water, substrate and geological resources) that make up these ecosystems represents the natural capital [3,8]. From this natural capital, ecosystems functions and services arise, from which mankind obtains benefits. Thus, degradation of natural ecosystems, resulting in a natural capital loss, can in turn lead to the incapacity of ecosystems to deliver benefits to humans [9,10,11]. Therefore, protection and sustainable management of the natural capital, through effective nature conservation strategies are necessary for continued or enhanced ecosystem service delivery [12]. In the Fourth Italian Natural Capital Report of 2021, it is stated that in the six years from 2012 to 2018, there has been a decrease in the flow of many ecosystem services (e.g., biomass supply, fisheries, water quality, erosion protection, etc.) as a result of the loss of natural capital that generates them, and these losses are almost always negatively reflected in the economic values dependent on them [13]. Because of this, a proper natural capital assessment is necessary in order to manage and preserve the natural capital itself over time.
Natural capital has become increasingly important for ecosystem protection and conservation strategies. For example, the “ecosystem services cascade” [14] highlighted how human activities and, consequently, human well-being depend on the presence and status of natural capital. The cascade can be interpreted as the pathway from the ecosystem structure and processes to human welfare [15]. All the functions originate from biophysical components, which constitute the natural capital stock. Only a part of ecosystem functions is exploited by humans. This part constitutes the set of ecosystem services [16]. For instance, coastal ecosystems (biophysical component) produce fishes biomass, which constitutes natural capital stock. The natural capital maintains the coastal trophic chain and the nutrient cycling (functions). Some species that compose the coastal trophic chain are then exploited by humans for nutrition purposes (ecosystem services). The harvested fish is sold on the market, providing economic revenues and organoleptic benefits to the human population.
At the political level, natural capital accounting has been recognised by the United Nations, more recently through the definition of the Sustainable Development Goals (SDGs) of the 2030 Agenda, particularly for targets 6, 13, 14 and 15.
Natural capital accounting may provide important input for the analytical methods in designing, implementing and reviewing evidence-based SDG policies, but experience demonstrated that natural capital accounting is under-exploited in national SDG policy processes [17].
Nevertheless, natural capital accounting is seen as a useful integrated information framework to inform the SDG policy process and ensure integration and consistency between several of the SDG indicators, especially where different custodian agencies are involved. Given the coherent and structured setup of this evaluation, natural capital accounting can help these processes by promoting a systems-based approach and by creating institutional conditions for more integrated data compilation, analysis and policymaking.
The seagrass Posidonia oceanica (L.) Delile forms dense meadows widely distributed throughout the Mediterranean Sea covering approximately 1.1% of its surface (~28,000 km2) [18]. It can develop from 0.5 m down to over 40 m depth [19], representing one of the most valuable habitats in coastal waters. Thanks to its ecological role, P. oceanica is protected by EU legislation (Habitats Directive 92/43/EEC) and classified as a Least Concern species on the IUCN Red List [20]. P. oceanica meadows constitute a substantial part of natural capital providing a range of ecosystem functions and services for human well-being. For this reason, this seagrass has a very important role under both ecological and economical views [21,22,23,24].
The P. oceanica meadows represent the main source of coastal primary production also acting as nursery area and permanent habitat for numerous plant and animal species [21,24,25]. The considerable leaf biomass that characterizes meadows reduces hydrodynamic energy, preventing shoreline erosion [26] and promoting the sedimentation of particulate matter, which results in an increase of water transparency [24]. Despite this species being one of the main targets of conservation actions, the regression of P. oceanica meadows is well-documented over the whole Mediterranean basin and mainly in the north-western sector [26,27,28,29,30,31]. P. oceanica is highly threatened by the presence of important urban settlements and human activities [14,32] that are primarily responsible for environmental changes and coastal pollution [33,34,35,36]. Due to its sensitivity to anthropic pressure, P. oceanica is considered as a biological indicator able to define the quality of water bodies (Water Framework Directive 2000/60/EC).
In this research, both the leaves and the rhizomes parts of P. oceanica meadows were analysed aiming at an overall quantification of the stored natural capital within the meadows and at assessing possible changes in natural capital values due to the seagrass growth and to the anthropogenic pressures along the coast. A biophysical framework to assess the natural capital value of P. oceanica meadows is here proposed by means of emergy evaluation. Emergy is an accounting method able to evaluate the convergence of matter and energy (several inputs) in a system on a common basis. Odum [37] defined emergy as “the availability of energy of one kind that is used up in transformations directly and indirectly to make a product or service”. Emergy represents a measure of the work done by nature to generate and maintain a system, a flow or a service calculated on the basis of the solar energy processed (and memorized) in space and time [38]. As a matter of fact, emergy allows the quantification on a common basis of all the inputs that feed a system. From a biophysical perspective, this quantification represents the cost of production of a natural system and may be interpreted as a metric of the value of the system itself. Thus, emergy may be considered as a proxy of the natural capital stored and of the functions generated by ecosystems [39]. The use of this approach allows a deeper knowledge of the status of the coastal ecosystem in order to better manage and protect the natural capital stocked and the services provided by P. oceanica meadows.

2. Materials and Methods

2.1. Study Area

The study was carried out in two coastal areas located along the eastern coast of Liguria (NW Italy) and in Sant’Amanza Bay (SE Corsica, France). In total, six P. oceanica meadows were surveyed through underwater sampling of two stations for each meadow at 15 m depth (Figure 1 and Table 1).
Each site represents a different level of ‘naturalness’, according to the degree of human pressure along the coast and to the protection regime [40]. Camogli and Punta Pedale belong to the Marine Protected Area (MPA) of Portofino (zone C, partial reserve according to Italian classification) while Monterosso al Mare belongs to the Cinque Terre MPA (zone B zone, general reserve) and the site of Sant’Amanza belongs the Natural Reserve of Corsica “Bouches de Bonifacio”. The other investigated sites are located outside MPAs, in areas affected by a higher degree of human pressure due to the vicinity of settlements and nautical tourism.

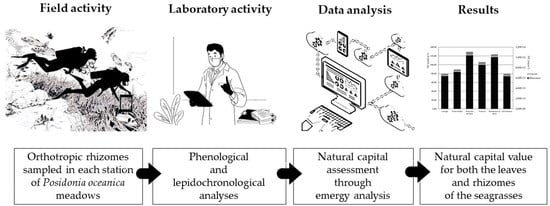
2.2. Field and Laboratory Activities

Sampling activities were carried out during the summer seasons of 2017 and 2020 by scuba diving. The shoots density was counted using a 40 × 40 cm quadrat. The number of replicates made for each summer season was chosen according to the national protocol of the two countries: 9 replicates for the Italian meadows, based on the ISPRA monitoring protocol (www.isprambiente.gov.it/it, accessed on 24 August 2021), and 5 replicates for the Corsican meadows in adequation with the French practice [41]. At 15 m depth, orthotropic (vertical) rhizomes were sampled in not-contiguous zones for laboratory analysis: 18 rhizomes were collected in each station for the Ligurian meadows during the 2017 summer season and 10 for the Corsican one during the 2020 summer season.
Thereafter, in the laboratory, the phenological analyses, carried out on the leaves of P. oceanica of sampled shoots, and the lepidocronological analyses, carried out on the sampled rhizomes, were made using a standardized method [42,43] that allows getting information about the current status of the meadow. The leaves in each sampled shoot were counted and their lengths and widths measured. Thus, through phenological analysis, it was possible to find the number of leaves (n_leaves·shoot−1), leaf width (cm) and leaf length (cm), which allows to calculate the leaf surface for shoot (cm2·shoot−1). After that, all the epiphytes were accurately scraped off from the leaves; the leaves biomass was estimated as grams of dry weight, dried at 70 °C for 48 h and then converted in grams of carbon (gC·m−2) [42,43,44,45,46].
For the analysis of rhizomes, it was necessary to estimate the life cycles of the plant. Annual life cycle is considered as the period starting from the spring season, when the plant produces the new juvenile leaves, to the spring of the following year, when it loses all its adult leaves. Life cycles were studied through lepidochronological analysis, a retrospective technique that provides reliable estimation of seagrass growth performance, expressed as annual vertical growth (namely rhizome elongation, mm·a−1) and leaf production (g·m−2·a−1) [47]. This retrodating technique allows estimating the life cycles of the rhizome, by isolating and dating rhizome segments corresponding to a one-year period (lepidochronological year). Each lepidochronological year is dated starting from the rhizome apex (sampling year) downward and backdating the sequence of cycles with their corresponding rhizome segment [48]. In this study, for each rhizome, only the three most recent lepidochronological years (henceforth “three-year period”), excluding the first two years from the apex which are still in the growth phase, were considered in the laboratory analysis since they are representative of the condition of the meadows at the sampling time.
It was not possible to sample the entire rhizome due to the consequent mechanical damage on the meadows. Excluding the apex part, the rhizome is indeed belowground: sampling it entirely would imply technical constraints and would be highly destructive. Consequently, to estimate the number of life cycles of each meadow, it was possible to consider an average total rhizome length (beyond the “three-year period”) of 30 cm length [49]. Considering this length was necessary to estimate the number of life cycles [49] of each meadow. The length of the rhizome divided into a number of segments equal to the number of life cycles determines the annual rhizome growth [50]. Therefore, the number of segments that characterizes the life cycles were distinguished in the rhizomes.
Lepidochronological analysis, moreover, allowed to obtain the yearly rhizome biomass (gC·m−2) through the weight of the segments obtained, to count the number of leaves produced annually during the “three-year period” (n·a−1) and to estimate the leaf production considering the scales thickness of each rhizome segment (g·m−2·a−1).

2.3. Emergy Application

Meadows were analysed to quantify the variability between sites within the ecosystem using emergy stored as a metric of the natural capital. Emergy analysis was applied to assess the effort made by a natural system (measured as resources, space and time invested) to produce a biomass stock [51,52]. Emergy is a biophysical evaluation method, able to quantify physical features [37,53,54,55], which is why it is considered particularly suitable for environmental accounting [15].
Emergy is a thermodynamic methodology introduced in the 1980s by H.T. Odum [37,56], which is based on the detailed inventory of all resources directly or indirectly exploited to obtain a product or maintain a process. Its unit is solar emergy Joules (sej) because it is expressed as the solar energy used to generate or maintain biomass of all the organisms within the habitat [52]. The emergy content of a system or a flow is often translated in an equivalent monetary value by means of a combination of emergy and economic value, called “emergy-to-money ratio” (EMR). This is calculated as the ratio of the emergy flow to a nation to its GDP (gross domestic product), expressed in sej€−1, and it represents how much emergy corresponds, on average, to one unit of money produced by the national economy. Dividing the emergy content of a system by the EMR, it is possible to translate in monetary units the natural value of the system. This conversion does not change the meaning of emergy accounting but translates the value of the biosphere’s investment in a common representation of value (money), helping to bridge the gap between biophysical and economic assessments. Thus, invested resources are then expressed in monetary terms (emergy euros-em€) employing the 9.60 × 10¹¹ sej/€ ratio [57]. In this study, emergy is calculated adopting the baseline of 15.20 × 1024 sej [58].
Using data obtained through laboratory activities (leaf and rhizome biomasses), emergy analysis was applied to get the natural capital value of the P. oceanica meadows following the procedure described by Paoli [51] and Vassallo [52].
The differences in natural capital stored by the rhizomes and leaves were also investigated together with the analysis of change in the natural capital value due to the geographical position and natural or anthropogenic drivers that insist on P. oceanica meadows.
The model of natural capital assessment that was followed consists of three main steps: (1) trophodynamic analysis (estimation of the primary productivity supporting the benthic trophic web); (2) biophysical accounting (estimation of the biophysical value of natural capital that support the biocenosis in terms of emergy associated with the natural resource flows (e.g., nutrients, sun, rain) that enabled the formation of the natural capital stock); (3) monetary conversion (conversion of the biophysical value into monetary units).

2.4. Trophodynamic Analysis

For the first step (trophodynamic analysis), the biomasses were obtained through both the laboratory activity and the literature. The biomasses of leaves and rhizomes were obtained during laboratory activities. Instead, the main taxonomic groups associated to the habitat of P. oceanica, reported in Appendix A (Table A1), and their biomasses were estimated through literature [32,59,60,61,62,63,64,65,66,67,68,69,70,71,72,73,74,75,76,77,78,79]. These biomasses were found in grams of dry weight and then transformed into the corresponding primary productivity with the following procedure. The primary productivity sustains the trophic network and can be calculated by applying a specially formulated approach developed by Pauly and Christensen [80] taking into account two parameters:
-
Trophic level of the species;
-
The rate of energy transfer from one trophic level to the next, assumed to be 15% for coastal systems [81].
According to the original formula from Pauly and Christensen [80], considering a transfer efficiency equal to 10% among trophic levels, primary productivity that sustains the biocenosis can be calculated as:
P = B × 10(T−1)
If the 15% transfer efficiency is considered, the formula becomes as follows:
P = B × 7(T−1)
where:
P = primary productivity;
B = biomass of each taxonomic group present within the biocenosis;
T = trophic level.
In this way, starting from the biomass values, it is possible to calculate all the primary productivity, in terms of quantity of carbon that is necessary to obtain the biomass stocked yearly by each taxonomic group and which hence sustains the biocenosis.

2.5. Biophysical Accounting

For the second step of the natural capital assessment (biophysical accounting), all the natural resources (i.e., carbon, nitrogen, phosphorus, solar radiation, chemical potential of rain, wind, kinetic current, geopotential current, geothermal heat, tides, runoff) that enable the creation of this primary productivity are identified. The amounts of nitrogen and phosphorus assimilated in organic matter are calculated according to the ratio C:N:P of 41:7:1 [82]. For other natural flows, the formulas described in Appendix B (Table A2) are applied [37]. All these inputs are then converted into emergy units by using specific Unit Emergy Values (UEVs), i.e., the emergy required to generate one unit of output [37], reported in Appendix C (Table A3).
The inputs, transformed into emergy value, are summed to assess the emergy density value of the natural capital (sej m−2). Only the maximum among co-products (nutrients and solar radiation, rain, wind and currents) is chosen and included in the sum to avoid double counting for the final result. On the contrary, tides, geothermal heat and runoff are considered separately because they are generated by different processes at global scale [83,84].

2.6. Monetary Conversion

As the last step of the assessment (monetary conversion), results obtained are converted into monetary terms (em€) using the EMR ratio for Europe explained above.

3. Results

3.1. Field and Laboratory Activities

Results for both leaves and rhizomes obtained through field surveys and laboratory analysis are reported below (Table 2 and Table 3).
Results are expressed as the average between the two stations of each meadow. Considering leaves, shoot density exhibited average higher values for the meadows of Framura (454.17 shoot·m−2) and Sant’Amanza (436.73 shoot·m−2) and lower value for the meadow of Monterosso al Mare (352.78 shoot·m−2).
The average number of leaves per shoot varied between 4.97 (Prelo-San Michele, Framura, Monterosso al Mare and Sant’Amanza) located out of protected areas exapted for Monterosso al Mare and 6.03 (Camogli and Punta Pedale), located in the Portofino MPA. The average leaf width showed similar values in all the sampled sites. Conversely, the leaf length resulted higher for the meadows of Camogli 37.09 cm) and Sant’Amanza (37.01 cm) and lower for those of Framura (24.88 cm) and Monterosso al Mare (23.49 cm). The average leaf surface per shoot was higher for the meadows of Camogli (320.08 cm2·shoot−1) and Punta Pedale (298.47 cm2·shoot−1), followed by Sant’Amanza (228.65 cm2·shoot−1), Prelo-San Michele (207.551 cm2·shoot−1), and lower for Monterosso al Mare (155.23 cm2·shoot−1) and Framura (153.70 cm2·shoot−1).
The average leaf biomass was higher in Sant’Amanza (154.85 gC·m−2) and lower in Monterosso al Mare (90.26 gC·m−2).
Regarding rhizome, the Camogli meadow exhibited the highest average elongation of the rhizome with a value of 8.13 mm·a−1, while the lowest one was found in the Prelo-San Michele meadow, with 4.83 mm·a−1. The average higher number of life cycles was found for the meadows of Prelo-San Michele and Monterosso al Mare (60–62 life cycles) while the lower number of cycles corresponded to the meadows of Punta Pedale and Camogli (37–42 life cycles).
Furthermore, the regression between the elongation of rhizomes and the number of life cycles, useful to detect the change in elongation due to age, showed that they are inversely related (linear regression: r = 0.99; N = 6; p < 0.001).
The average production of leaves was greater in Camogli (1158.24 g·m−2·a−1), located in the Portofino MPA, while the lowest value was found in Prelo-San Michele (192.49 g·m−2·a−1), out of the same protected area. Rhizomes exhibited a higher leaf production in the meadows of Punta Pedale (7.85 leaves per year on average) and Camogli (7.55 leaves per year on average) and a lower leaf production in Prelo-San Michele (6.50 leaves per year on average) and Sant’Amanza (5.00 leaves per year on average).
The average rhizome biomass showed the highest value in Camogli (730.90 gC·m−2) and the lowest in Monterosso al Mare (377.87 gC·m−2).

3.2. Emergy Application

Natural resources associated to the study area, which permit the creation of the primary productivity and consequently generate and maintain natural capital stocks through time, were identified and calculated through the formulas reported in Appendix B. The results obtained for each resource (Table 4) were then converted into emergy units by using specific UEVs reported in Appendix C (Table 5).
It can be seen that the dominant input was run off (row 11 in Table 5) and that Prelo-San Michele and Monterosso al Mare required the greatest amount of resources to produce and maintain the natural capital stock.
As for natural capital results, both the leaves and rhizomes showed average higher values in the meadows of Prelo-San Michele (leaves: 6.99 × 10¹² sej m−2 a−1–7.28 em€ m−2; rhizomes: 1.04 × 10¹⁴ sej m−2 a1–108.29 em€ m−2) and Monterosso al Mare (leaves: 5.17 × 10¹² sej m−2 a−1–5.38 em€ m−2; rhizomes: 1.01 × 10¹⁴ sej m−2 a−1–105.03 em€ m−2) sites. On the contrary, the natural capital stocked in Sant’Amanza (leaves: 4.70 × 10¹² sej m−2 a−1–4.90 em€ m−2; rhizomes: 6.37 × 10¹² sej m−2 a−1–66.35 em€ m−2) and Camogli (leaves: 4.51 × 10¹² sej m−2 a−1–4.70 em€ m−2; rhizomes: 6.39 × 10¹³ sej m−2 a−1–66.58 em€ m−2) was lower (Figure 2). The greatest part of the natural capital was stored in the rhizomes and preserved over years.
Additionally, the regression between the annual rhizome elongation and the storage of natural capital in the rhizomes of the different meadows reported a significant inverse correlation (linear regression: r = 0.98; N = 6; p < 0.001).
In addition, the stored natural capital per unit of time is analysed. The results are shown in Table 6, where it is possible to identify the greatest annual accumulation of natural capital for the Camogli meadow (1.76 × 10¹³ sej·m−2·a−1, 18.36 em€·m−2·a−1) and the smallest in Prelo-San Michele (5.50 × 10¹² sej·m−2·a−1, 5.73 em€·m−2·a−1).

4. Discussion

This study analyses the natural capital stored in several meadows through a biophysical approach, using emergy analysis. The evaluation was performed in order to assess the status of both leaves and rhizomes of each meadow. The differences found between the meadows in the Ligurian-Provençal basin allowed investigating variations in the natural capital values of P. oceanica due to current and past disturbance events, characteristic changes due to different ages and geographical locations.
The analysis of rhizomes allowed characterising meadows with different development stages and classifying them accordingly. Specifically, the elongation of rhizomes is inversely proportional to the number of life cycles of the seagrass. This means that shorter segments of rhizomes correspond to more adult stages than longer ones. This is in agreement with previous studies [51,85,86,87,88,89,90,91,92], which highlighted that rhizome elongation decreases with shoot ageing as a consequence of a decrease in vertical growth rate [48]. The respiration of rhizome tissues, which, contrarily to leaves, are not deciduous, may be responsible for a considerable proportion of total respiration [22]. Consequently, when rhizomes reach high elongation, they subtract carbon that would be potentially fixed by photosynthesis (as primary production of leaves and new rhizomes) [93]. Especially in P. oceanica, which belongs to the group of large seagrasses [94], rhizomes respiration requires higher costs than in small plants, in terms of resources for constructing and maintaining the segments that compose the rhizome [95,96].
Accordingly, our study found that meadows with a lower number of life cycles have high net community production in the short term (as leaf production and rhizome elongation) [94], demonstrating to be in a growing stage: Camogli, Punta Pedale and Sant’Amanza. On the other hand, meadows with higher number of life cycles and low net community production can be considered mature: Prelo-San Michele, Monterosso al Mare and Framura.
Meadows showed similar behaviour when analysing in more detail both the leaves and rhizomes of the seagrass. Taking into account the ratio between production and biomass at the rhizome level, it can be seen that growing meadows produce rhizome biomass about three times more than mature ones. Nonetheless, growing meadows were not able to store a greater amount of natural capital in comparison with mature ones. This behaviour was also assumed by the plant at leaf level, where the old Prelo-San Michele meadow had leaf length and leaf surface smaller than the young Camogli, Punta Pedale and Sant’Amanza ones (Table 2). Analysing the ratio between leaf production and leaf biomass, in growing meadows the ratio was about double than in the mature ones. These outcomes demonstrated that the growing meadows were able to produce much in a short time as opposed to old ones. On the other hand, mature meadows stored more natural capital, reaching the homeostasis stages that have allowed them to maintain themselves over time [97]. This is why they imply greater cost, in terms of resources exploitation, also to maintain the unbalanced ratio among respiration and photosynthesis. A further confirmation was given by the significant inverse correlation between annual rhizome elongation and storage of natural capital in the rhizomes of different meadows, which showed that lower annual rhizome elongation involves a higher natural capital value. The rhizome is a sink of natural capital, tracking changes that occur over time and whose analysis can provide important information about meadows functionality.
Since in this study the most recent three years were examined and taken as representative of the rhizome in order to define its life cycles, this research did not allow to provide information about the period prior to recent years. Therefore, the lower rhizome elongation capacity for the Prelo-San Michele and Monterosso al Mare meadows could also be due to other disturbing factors not related to the number of life cycles. Age, in this way, could be a confounding factor [8,50] because, if a disturbance has an effect on growth and the distribution of considered meadows is unbalanced between disturbed and undisturbed areas, ignoring age may change the ability to detect the impact and to estimate its magnitude. Therefore, it would be better to exclude the number of life cycles in order to define also what other disturbances influence the meadows status. To do this, it is important to take into account the leaves of P. oceanica meadows because they are more responsive to anthropogenic pressures than the rhizomes [8,50], giving a snapshot of the current ecological status. In fact, changes that happened recently along the water column were quickly recorded by the leaf component, while changes due to long lasting environmental conditions were recorded in the rhizome, which tends to buffer the result and to lose information over time.
Thus, the lower rhizome elongation in Prelo-San Michele and Monterosso al Mare, as well as the shorter leaf length and leaf surface, can be interpreted, excluding the age factor, as responses to possible disturbances to which the meadows are subjected.
Likewise, the analysis of the leaf natural capital stored per unit time identified the Camogli and Punta Pedale meadows as more efficient than others, in particular more than Prelo-San Michele, probably also thanks to the protective measures of Portofino MPA where they are integrated and which may allow more efficient capital storage (Table 6). MPAs have a fundamental role in the protection of the marine environment and, at the same time, in promoting the enhancement of a sustainable socioeconomic development of local community [51,98,99,100].
Nevertheless, the same leaf natural capital storage per unit time was not showed by the Monterosso al Mare meadow, located in Cinque Terre MPA. Due to its worldwide fame, this area is subjected to human pressure, being affected by a more massive tourism than Portofino, characterized on the contrary by an elite-type tourism [48]: this can influence the capacity of meadows to produce natural capital. The same consideration can be done for the Sant’Amanza meadow, which is included in an MPA but submitted to an important level of anchoring on P. oceanica (https://plateforme.medtrix.fr, accessed on 24 August 2021), causing an intense mechanical impact on the meadow [101,102].
Regarding the meadows outside MPAs, they had lower values of natural capital stored per year in the rhizome and leaf components because they were still subjected to greater and not regulated pressures. The Framura meadow is fragmented with signs of regression [103] also because it is located in an area that had seen numerous silting events due to the release into the sea of waste materials from excavations and quarrying activities for the construction of the railway line along the coast [104]. Prelo-San Michele meadow showed an even lower efficiency in natural capital production due to the poor performance of the mature plant stages but also to the disturbances to which it is or has been subjected for many years [105,106]. The lower natural capital value at shallow portions may be the consequence of a multitude of human impacts from the shore, ranging from beach replenishment [107] to coastal structure building [108], and of the long-established practice of deploying the anchoring chain system during summer [101]. Before the installation in this site of a seagrass friendly mooring technology, adopted for preserving the integrity from intense anchoring and mooring activities [109], about 25–40% of shoots were removed and uprooted by the action of the chains in Prelo-San Michele [102]. Moreover, the storage capacity of Prelo-San Michele meadow may be negatively influenced by the two close little towns (Santa Margherita and Rapallo) highly visited by tourists during the summer period and by the influence of current along the east side of the Portofino promontory [110,111] which can lead pollutants from the nearby Entella River [112]. It is recognised that structurally damaged ecosystems have little resilience: the low shoot density values, recorded in Prelo-San Michele meadow, indicate that here P. oceanica is far from the good status and optimum vigour that lie behind ecosystem health [16,102,113] even if its growth mature stages have allowed it to accumulate a lot of natural capital over time. A low shoot density reduces sediment retention [114], increases current and wave action [115], and depresses plant growth [116] causing the inability of the system to recover its primordial structure.
The ecological importance of seagrasses is linked to a large extent to its three-dimensional structure [78]: repeated actions for long period of time of ripping-out shoots by chains could disrupt such structure [117] and, as a consequence, a slow production of natural capital and a reduction of its ecological role. Indeed, damages do not only affect the plant but the entire ecosystem, causing, in some cases, even changes in the trophic structure of the habitat [118].
Additionally, it has been demonstrated in the literature [119,120] that disturbances have a direct effect on the age structure of the meadow. Therefore, the slower rhizome growth that we recorded in Prelo-San Michele compared to nearby Punta Pedale may be due to an alteration caused by the pressure exerted over time by anchoring on the P. oceanica meadow in the former meadow. These appraisals need to be further verified with more detailed studies, for instance, investigating different geographic sites and seasons. Moreover, the relationship between anthropogenic disturbances and ecosystem health and natural capital needs to be surveyed in order to verify if intermediate intensities of anthropogenic pressures may have positive effects on ecosystem performances. In particular, the Intermediate Disturbances Hypothesis (IDH) declares that diversity of competing species should be increased at intermediate intensities of disturbance [121]. Although the IDH has been recently criticized [122], it remains a widely adopted model that cannot be neglected. Notwithstanding, it should be also taken into account “that nature is more complicated than our oversimplified theories” [122]. For instance, multiple factors, which we may not be able to detect, can generate disturbances on diversity very different from those predicted. As a consequence, in the absence of more detailed studies, a precautionary approach should be adopted in order to avoid irreversible damages. Thus, anthropized areas will require extraordinary management efforts [109] to ensure the recovery of seagrass and its good ecological status, even though some may even be considered irrecoverable [123]. The load from human activities should not exceed the carrying capacity of the environment, but it is important to preserve habitats in order to keep the natural capital intact [15,124].

5. Conclusions

In this study, emergy analysis was applied to six Posidonia oceanica meadows in the NW Mediterranean, in Liguria (Italy) and Corsica (France), to investigate the value of natural capital stored within seagrass meadows in both their rhizomes and leaves. This allowed identifying a decrease in rhizome elongation, as the number of life cycles increases, and a greater storage of natural capital over time for meadows with a greater number of life cycles. Seagrass meadows in growing stage were, therefore, faster in growth and elongation in both rhizomes and leaves but had a lower storage capacity. Considering the status and natural capital of leaves, it was possible also to identify those meadows influenced by anthropogenic disturbances along the water column. Indeed, some of them located in MPA are less affected by human activities than others in areas of greater anthropogenic disturbances. In conclusion, this research highlighted the importance of the application of emergy analysis, which allowed for a comprehensive scrutiny of all the resources invested by the seagrass to store its natural capital. This approach permitted to describe the status of the meadows in more detail, even better, by investigating both leaves and rhizomes because one could be incomplete without comparison with the other.

Author Contributions

Conceptualization, I.R., G.D., C.P. and P.V.; software, C.P. and P.V.; methodology, C.P.-M., G.P., C.P. and P.V.; formal analysis, I.R. and A.O.; investigation, I.R.; resources, I.R., C.P.-M., G.P., G.D., A.O., M.M., C.N.B., C.M. and P.V.; data curation, I.R.; writing—original draft preparation, I.R.; writing—review and editing, I.R., C.P.-M., G.P., G.D., A.O., M.M., C.N.B., C.M. and P.V.; visualization, I.R.; supervision, G.D., C.P. and P.V., project administration: C.P., P.V., C.P.-M. and G.P. All authors have read and agreed to the published version of the manuscript.

Funding

This research was partially funded by the INTERREG Maritime GIREPAM (Integrated Management of Ecological Networks through Parks and Marine Areas) project for sampling and data processing for some meadows. GIREPAM is a strategic three-year project started in January 2017, with a budget of over 5.6 million. It is 85% funded by the European Regional Development Fund. Its funding number is 115.

Institutional Review Board Statement

Not applicable.

Data Availability Statement

The data presented in this study are available in tables within the main text and in Appendix A and Appendix B.

Conflicts of Interest

The authors declare no conflict of interest.

Appendix A. Main Taxonomic Groups Associated to the Habitat of P. oceanica

Below the main taxonomic groups associated to the habitat of P. oceanica are reported.
Table A1. List of the main taxonomic groups selected in literature [33,60,61,62,63,64,65,66,67,68,69,70,71,72,73,74,75,76,77,78,79,80] for the emergy application.
Main Taxonomic Groups
Fitoplancton
Microphytobenthos
Macroalgae
Bryozoa
Porifera
Cnidaria
Ascidiacea
Foraminifera
Echinodermata
Crustacea
Mollusca
Anellida
Sipunculida

Appendix B. Formulas Employed for Emergy Application

The formulas used for the quantitative assessment of the natural inputs that support primary production within the biocenosis are reported below. Time for stock formation was calculated using appropriate P/B ratios that identify the time required to obtain the biomass that constitutes the habitat.
Table A2. Formulas used to calculate all the resources invested to support primary production within the biocenosis.
ItemsFormulaUnitReferences
CarbonBenthic biomass obtained in the laboratorygThis study
NitrogenBenthic biomass obtained in the laboratory ×7/41gThis study
PhosphorusBenthic biomass obtained in the laboratory/41gThis study
Solar radiationannual solar radiation per unit area area × (1-albedo) × area × time for stocks formationJThis study
Rain (chemical energy)annual rainfall × Gibbs free energy × water density × area × time for stocks formationJ[37]
Windair density × drag coeff. × (wind speed · geostrophic wind velocity)3 × area × seconds per year × time for stocks formationJ[37]
Kinetic current½ × height of water evaporated on average in the Mediterranean due to currents× velocity2 × water sea density × time for stocks formationJ[84]
Geopotential current½ × height of water evaporated on average in the Mediterranean due to currents2 × water sea density × gravity ×time for stocks formationJ[84]
Geothermal heatarea × geothermal flux × time for stocks formationJ[125,126]
Tides½×number of tides per year × (height)2 × density × gravity × area × time for stocks formationJ[125,127]
Runoff(annual rainfall−evaporation−aquifer infiltration) × water density × Gibbs free energy × catchment areaJ[37]

Appendix C. UEVs Employed for Emergy Application

Below Unit Emergy Values (UEVs) used to convert natural inputs into emergy units, are reported associated to its references.
Table A3. UEVs used to convert all resources invested to support primary production (Table A2) into emergy units.
ItemsUEVsReferences
Carbon1.02 × 108[128]
Nitrogen7.40 × 109[37]
Phosphorus2.86 × 100[37]
Solar radiation1.00 × 100[37]
Rain (chemical energy)2.93 × 10⁴[37]
Wind2.41 × 103[37]
Kinetic current1.77 × 107[37]
Geopotential current3.80 × 104[37]
Geothermal heat5.53 × 104[37]
Tides2.71 × 104[37]
Runoff6.61 × 104[37]

References

  1. UNEP World Conservation Monitoring Centre, & Census of Marine Life on Seamounts (Programme). Data Analysis Working Group. Seamounts, Deep-Sea Corals and Fisheries: Vulnerability of Deep-Sea Corals to Fishing on Seamounts beyond Areas of National Jurisdiction (No. 183); UNEP/Earthprint: Nairobi, Kenya, 2006. [Google Scholar]
  2. Hattam, C.; Atkins, J.P.; Beaumont, N.; Börger, T.; Böhnke-Henrichs, A.; Burdon, D.; Austen, M.C. Marine ecosystem services: Linking indicators to their classification. Ecol. Indic. 2015, 49, 61–75. [Google Scholar] [CrossRef]
  3. UNESCO IOC. MSP in Support of Sustainable Ocean Based Economy; 2017; Available online: https://wedocs.unep.org/handle/20.500.11822/20218 (accessed on 24 August 2021).
  4. Costanza, R.; d’Arge, R.; De Groot, R.; Farber, S.; Grasso, M.; Hannon, B.; Van Den Belt, M. The value of the world’s ecosystem services and natural capital. Nature 1997, 387, 253–260. [Google Scholar] [CrossRef]
  5. Böhnke-Henrichs, A.; Baulcomb, C.; Koss, R.; Hussain, S.S.; de Groot, R.S. Typology and indicators of ecosystem services for marine spatial planning and management. J. Environ. Manag. 2013, 130, 135–145. [Google Scholar] [CrossRef] [PubMed]
  6. Liquete, C.; Zulian, G.; Delgado, I.; Stips, A.; Maes, J. Assessment of coastal protection as an ecosystem service in Europe. Ecol. Indic. 2013, 30, 205–217. [Google Scholar] [CrossRef] [Green Version]
  7. Costanza, R.; De Groot, R.; Sutton, P.; Van der Ploeg, S.; Anderson, S.J.; Kubiszewski, I.; Turner, R.K. Changes in the global value of ecosystem services. Glob. Environ. Chang. 2014, 26, 152–158. [Google Scholar] [CrossRef]
  8. Tomasello, A.; Sciandra, M.; Muggeo, V.M.R.; Pirrotta, M.; Di Maida, G.; Calvo, S. Reference growth charts for Posidonia oceanica seagrass: An effective tool for assessing growth performance by age and depth. Ecol. Indic. 2016, 69, 50–58. [Google Scholar] [CrossRef]
  9. Haines-Young, R.; Potschin, M. The links between biodiversity, ecosystem services and human well-being. Ecosyst. Ecol. A New Synth. 2010, 1, 110–139. [Google Scholar] [CrossRef]
  10. Cardinale, B.J.; Duffy, J.E.; Gonzalez, A.; Hooper, D.U.; Perrings, C.; Venail, P.; Naeem, S. Biodiversity loss and its impact on humanity. Nature 2012, 486, 59–67. [Google Scholar] [CrossRef]
  11. Vihervaara, P.; Franzese, P.P.; Buonocore, E. Information, energy, and eco-exergy as indicators of ecosystem complexity. Ecol. Model. 2019, 395, 23–27. [Google Scholar] [CrossRef]
  12. Buonocore, E.; Appolloni, L.; Russo, G.F.; Franzese, P.P. Assessing natural capital value in marine ecosystems through an environmental accounting model: A case study in Southern Italy. Ecol. Model. 2020, 419, 108958. [Google Scholar] [CrossRef]
  13. Comitato Capitale Naturale. Quarto Rapporto sullo Stato del Capitale Naturale in Italia, Roma. 2021. Available online: https://www.mite.gov.it/sites/default/files/archivio/allegati/CapitaleNaturale/iv_rapporto_cn_2021.pdf (accessed on 24 August 2021).
  14. Haines-Young, R.; Potschin, M. Common international classification of ecosystem services (CICES): 2011 Update. Nottm. Rep. Eur. Environ. Agency 2011. [Google Scholar]
  15. Paoli, C.; Vassallo, P.; Pozzi, M.; Massa, F.; Rigo, I.; Fanciulli, G.; Cappanera, V.; Merotto, L.; Venturini, S.; Lavarello, I.; et al. Towards strong sustainability: A framework for economic and ecological management of marine protected areas. Vie Milieu Life Environ. 2020, 70, 209–223. [Google Scholar]
  16. TEEB. The Economics of Ecosystems and Biodiversity Ecological and Economic Foundations; Kumar, P., Ed.; Earthscan: London, UK; Washington, DC, USA, 2010. [Google Scholar]
  17. Ruijs, A.; van der Heide, M.; van den Berg, J. Natural Capital Accounting for the Sustainable Development Goals: Current and Potential Uses and Steps Forward; PBL Netherlands Environmental Assessment Agency: The Hague, The Netherlands, 2018. [Google Scholar]
  18. Pergent-Martini, C.; Pergent, G.; Monnier, B.; Boudouresque, C.-F.; Mori, C.; Valette-Sansevin, A. Contribution of Posidonia oceanica meadows in the context of climate change mitigation in the Mediterranean Sea. Mar. Environ. Res. 2021, 165, 105236. [Google Scholar] [CrossRef] [PubMed]
  19. Telesca, L.; Belluscio, A.; Criscoli, A.; Ardizzone, G.; Apostolaki, E.T.; Fraschetti, S.; Gristina, M.; Salomidi, M. Seagrass meadows (Posidonia oceanica) distribution and trajectories of change. Sci. Rep. 2015, 5, 1–14. [Google Scholar] [CrossRef] [Green Version]
  20. IUCN. Posidonia oceanica. Available online: https://www.iucnredlist.org/species/153534/135156882 (accessed on 24 August 2021).
  21. Bay, D. A field study of the growth dynamics and productivity of Posidonia oceanica (L.) Delile in Calvi Bay, Corsica. Aquat. Bot. 1984, 20, 43–64. [Google Scholar] [CrossRef]
  22. Hemminga, M.A.; Duarte, C.M. Seagrass Ecology; Cambridge University Press: Cambridge, UK, 2000. [Google Scholar] [CrossRef]
  23. Borum, J. European Seagrasses: An Introduction to Monitoring and Management; Duarte, C.M., Greve, T.M., Krause-Jensen, D., Eds.; M & MS Project, 2004; p. 2006. Available online: https://pdf4pro.com/amp/view/european-seagrasses-an-introduction-to-monitoring-and-45613d.html (accessed on 24 August 2021).
  24. Boudouresque, C.F.; Verlaque, M. An overview of species introduction and invasion processes in marine and coastal lagoon habitats. Cah. Biol. Mar. 2012, 53, 309. [Google Scholar]
  25. Vassallo, P.; Paoli, C.; Rovere, A.; Montefalcone, M.; Morri, C.; Bianchi, C.N. The value of the seagrass Posidonia oceanica: A natural capital assessment. Mar. Pollut. Bull. 2013, 75, 157–167. [Google Scholar] [CrossRef]
  26. Boudouresque, C.F.; Bernard, G.; Pergent, G.; Shili, A.; Verlaque, M. Regression of Mediterranean seagrasses caused by natural processes and anthropogenic disturbances and stress: A critical review. Botanica Marina 2009, 52, 395–418. [Google Scholar] [CrossRef]
  27. Montefalcone, M.; Albertelli, G.; Morri, C.; Parravicini, V.; Bianchi, C.N. Legal protection is not enough: Posidonia oceanica meadows in marine protected areas are not healthier than those in unprotected areas of the northwest Mediterranean Sea. Mar. Pollut. Bull. 2009, 58, 515–519. [Google Scholar] [CrossRef] [PubMed]
  28. Bonacorsi, M.; Pergent-Martini, C.; Breand, N.; Pergent, G. Is Posidonia oceanica regression a general feature in the Mediterranean Sea? Mediterr. Mar. Sci. 2013, 14, 193–203. [Google Scholar] [CrossRef]
  29. Marbà, N.; Díaz-Almela, E.; Duarte, C.M. Mediterranean seagrass (Posidonia oceanica) loss between 1842 and 2009. Biol. Conserv. 2014, 176, 183–190. [Google Scholar] [CrossRef]
  30. Holon, F.; Boissery, P.; Guilbert, A.; Freschet, E.; Deter, J. The impact of 85 years of coastal development on shallow seagrass beds (Posidonia oceanica (L.) Delile) in South Eastern France: A slow but steady loss without recovery. Estuar. Coast. Shelf Sci. 2015, 165, 204–212. [Google Scholar] [CrossRef] [Green Version]
  31. Burgos, E.; Montefalcone, M.; Ferrari, M.; Paoli, C.; Vassallo, P.; Morri, C.; Bianchi, C.N. Ecosystem functions and economic wealth: Trajectories of change in seagrass meadows. J. Clean. Prod. 2017, 168, 1108–1119. [Google Scholar] [CrossRef]
  32. Sanchez-Lizaso, J.L. Estudio De La Pradera De Posidonia oceanica (L.) Delile de la Reserva Marina de Tabarca (Alicante): Fenologia y Produccion Primaria. Ph.D. Thesis, Universidad de Alicante, San Vicente del Raspeig, Spain, 1993; 130p. [Google Scholar]
  33. Campanella, L.; Conti, M.E.; Cubadda, F.; Sucapane, C. Trace metals in seagrass, algae and molluscs from an uncontaminated area in the Mediterranean. Environ. Pollut. 2001, 111, 117–126. [Google Scholar] [CrossRef]
  34. Lafabrie, C.; Pergent-Martini, C.; Pergent, G. Metal contamination of Posidonia oceanica meadows along the Corsican coastline (Mediterranean). Environ. Pollut. 2008, 151, 262–268. [Google Scholar] [CrossRef]
  35. Pergent-Martini, C.; Pergent, G. Marine phanerogams as a tool in the evaluation of marine trace-metal contamination: An example from the Mediterranean. Int. J. Environ. Poll. 2000, 13, 126–147. [Google Scholar] [CrossRef]
  36. Warnau, M.; Ledent, G.; Temara, A.; Bouquegneau, J.M.; Jangoux, M.; Dubois, P. Heavy metals in Posidonia oceanica and Paracentrotus lividus from seagrass beds of the north-western Mediterranean. Sci. Total Environ. 1995, 171, 95–99. [Google Scholar] [CrossRef]
  37. Odum, H.T. Environmental Accounting: Emergy and Environmental Decision Making; Wiley: Hoboken, NJ, USA, 1996; 370p. [Google Scholar]
  38. Pulselli, F.M.; Patrizi, N.; Focardi, S. Calculation of the unit emergy value of water in an Italian watershed. Ecol. Model. 2011, 222, 2929–2938. [Google Scholar] [CrossRef]
  39. Franzese, P.P.; Buonocore, E.; Paoli, C.; Massa, F.; Donati, S.; Fanciulli, G.; Miccio, A.; Mollica, M.; Navone, A.; Russo, G.F.; et al. Environmental accounting in marine protected areas: The EAMPA project. J. Environ. Account. Manag. 2015, 3, 324–332. [Google Scholar] [CrossRef]
  40. Diviacco, G. Indagine Sulla Qualità DELL’AMBIENTE Marino in Liguria (Stato di Conservazione Delle Biocenosi Bentiche Costiere); Ufficio Parchi e Aree Protette Regione Liguria: Regione Liguria, Italy, 1998; pp. 1–46. [Google Scholar]
  41. Pergent, G.; Pergent-Martini, C.; Boudouresque, C.-F. Utilisation de l’herbier à Posidonia oceanica comme indicateur biologique de la qualité du milieu littoral en Méditerranée: Etat des connaissances. Mésogée 1995, 54, 3–29. [Google Scholar]
  42. Giraud, G. Contribution À La Description Et À La Phénologie Quantitative Des Herbiers à Posidonia oceanica (L.). Ph.D. Thesis, University Aix-Marseille II, Marseille, France, 1977; 150p. [Google Scholar]
  43. Buia, M.C.; Gambi, M.C.; Dappiano, M. Seagrass systems. Biol. Mar. Medit. 2004, 10 (Suppl. 1), 133–183. [Google Scholar]
  44. Giraud, G.; Boudouresque, C.F.; Cinelli, F.; Fresi, E.; Mazzella, L. Observations sur l’herbier de Posidonia oceanica (L.) Delile autour de l’île d’Ischia (Italie). Plant. Biosyst. 1979, 113, 261–274. [Google Scholar] [CrossRef]
  45. Pergent, G.; Pergent-Martini, C. Leaf renewal cycle and primary production of Posidonia oceanica in the bay of Lacco Ameno (Ischia, Italy) using lepidochronological analysis. Aquat. Bot. 1991, 42, 49–66. [Google Scholar] [CrossRef]
  46. Cancemi, G.; De Falco, G.; Pergent, G. Effects of organic matter input from a fish farming facility on a Posidonia oceanica meadow. Estuar. Coast. Shelf Sci. 2003, 56, 961–968. [Google Scholar] [CrossRef]
  47. Pergent-Martini, C.; Leoni, V.; Pasqualini, V.; Ardizzone, G.D.; Balestri, E.; Bedini, R.; Belluscio, A.; Belsher, T.; Borg, J.; Boudouresque, C.F.; et al. Descriptors of Posidonia oceanica meadows: Use and application. Ecol. Indic. 2005, 5, 213–230. [Google Scholar] [CrossRef]
  48. Pergent, G. Lepidochronological analysis of the seagrass Posidonia oceanica (L.) Delile: A standardized approach. Aquat. Bot. 1990, 37, 39–54. [Google Scholar] [CrossRef]
  49. Francour, P. Root and rhizome biomass of Posidonia oceanica bed. Rapp. Comm. Int. Mer Medit. 1985, 29, 5. [Google Scholar]
  50. Tomasello, A.; Calvo, S.; Di Maida, G.; Lovison, G.; Pirrotta, M.; Sciandra, M. Shoot age as a confounding factor on detecting the effect of human-induced disturbance on Posidonia oceanica growth performance. J. Exp. Mar. Biol. Ecol. 2007, 343, 166–175. [Google Scholar] [CrossRef]
  51. Paoli, C.; Povero, P.; Burgos, E.; Dapueto, G.; Fanciulli, G.; Massa, F.; Scarpellini, P.; Vassallo, P. Natural capital and environmental flows assessment in marine protected areas: The case study of Liguria region (NW Mediterranean Sea). Ecol. Model. 2018, 368, 121–135. [Google Scholar] [CrossRef]
  52. Vassallo, P.; Paoli, C.; Buonocore, E.; Franzese, P.P.; Russo, G.F.; Povero, P. Assessing the value of natural capital in marine protected areas: A biophysical and trophodynamic environmental accounting model. Ecol. Model. 2017, 355, 12–17. [Google Scholar] [CrossRef]
  53. Wackernagel, M.; Onisto, L.; Bello, P.; Linares, A.C.; Falfán, I.S.L.; Garcıa, J.M.; Suarez-Guerrero, A.I.; Suarez-Guerrero, M.G. National natural capital accounting with the ecological footprint concept. Ecol. Econ. 1999, 29, 375–390. [Google Scholar] [CrossRef]
  54. Jørgensen, S.E. Ecosystem services, sustainability and thermodynamic indicators. Ecol. Complex. 2010, 7, 311–313. [Google Scholar] [CrossRef]
  55. Müller, F.; Burkhard, B. The indicator side of ecosystem services. Ecosyst. Serv. 2012, 1, 26–30. [Google Scholar] [CrossRef] [Green Version]
  56. Odum, H.T. Systems Ecology: An Introduction; Wiley: Hoboken, NJ, USA, 1983; 644p. [Google Scholar]
  57. Pereira, L.; Zucaro, A.; Ortega, E.; Ulgiati, S. Wealth, trade and the environment: Carrying capacity, economic performance and wellbeing in Brazil and Italy. J. Environ. Account. Manag. 2013, 1, 159–188. [Google Scholar] [CrossRef]
  58. Brown, M.T.; Ulgiati, S. Updated evaluation of exergy and emergy driving the geobiosphere: A review and refinement of the emergy baseline. Ecol. Model. 2010, 221, 2501–2508. [Google Scholar] [CrossRef]
  59. Bellan-Santini, D. Contribution à l’ètude des peuplements infralittoraux sur substrat rocheux. Rec. Trav. Stat. Mar. Endoume 1969, 63, 1–294. [Google Scholar]
  60. True, M.A. étude quantitative de quatre peuplements sciaphiles sur substrat rocheux dans la region marsellaise. Bull. Inst. Océanogr. Monaco 1970, 69, 1–48. [Google Scholar]
  61. Albertelli, G.; Cattaneo, M.; Drago, N. Indagine qualitativa e quantitativa su due biocenosi della platea continentale ligure. Atti III Congr. AIOL 1978, 1980, 231–237. [Google Scholar]
  62. Albertelli, G.; Angelino, M.; Cattaneo, M.; Della Croce, N.; Drago, N.; Fabiano, M.; Salemi Picone, P.E.; Zunini Sertorio, T. Produzione delle acque e dei fondi in Mar Ligure: Platea continentale. In Proceedings of the Convegno delle Unità Operative afferenti ai sotto progetti delle Risorse Biologiche e Inquinamento marino, Roma, Italy, 10–11 November 1981; pp. 61–69. [Google Scholar]
  63. Albertelli, G.; Cattaneo, M.; Della Croce, N.; Drago, N. Benthos Della Piattaforma Continentale Ligure Alassio Savona Chiavari Corniglia (1977–1981); Tech. Rep. n. 14; Università di Genova, Cattedra di Idrobiologia e Pescicoltura, Facoltà di Scienze Fisiche, Matematiche e Naturali: Genova, Italy, 1981. [Google Scholar]
  64. Willsie, A. Zonation de la macrofaune endogée de la matte d’herbier de Posidonia oceanica (L.) Delile. Rapp. Comm. Int. Mer Medit. 1983, 28, 165–168. [Google Scholar]
  65. Libes, M. Production Primaire D’un Herbier à Posidonia oceanica Mesurée in Situ Par La Méthode Du Carbone 14. Thèse de doctorat de specialité en Écologie, University Aix-Marseille, Faculty Science Luminy, Marseille, France, 1984; pp. 1–199. [Google Scholar]
  66. Albertelli, G.; D’ambrosio, N. Alcuni Aspetti ecologici del macrobenthos della zona pilota di Chiavari. Boll. Mus. Ist. Biol. Univ. Genova 1986, 52, 125–137. [Google Scholar]
  67. Albertelli, G.; Rossi, G.L. Studio del popolamento macrobentonico di un fondale posto in prossimità di un effluente urbano (1976–1980). Atti VII Congr. AIOL 1986, 1987, 91–100. [Google Scholar]
  68. Bianchi, C.N.; Cevasco, M.G.; Diviacco, G.; Morri, C. Primi risultati di una ricerca ecologica sulla Grotta Marina di Bergeggi (Savona). Boll. Mus. Ist. Biol. Univ. Genova 1986, 52, 267–293. [Google Scholar]
  69. Cocito, S.; Fanucci, S.; Niccolai, I.; Morri, C.; Bianchi, C.N. Relationships between trophic organization of benthic communities and organic matter content in Tyrrhenian Sea sediments. Hydrobiologia 1990, 207, 53–60. [Google Scholar] [CrossRef]
  70. Canals, M.; Ballesteros, E. Production of carbonate sediments by phytobenthic communities in the Mallorca-Minorca shelf, north western Mediterranean Sea. Deep. Sea Res. 1997, 44, 611–629. [Google Scholar] [CrossRef]
  71. Sánchez-Jerez, P.; Barberà Cebrián, C.B.; Ramos Esplá, A.A. Comparison of the epifauna spatial distribution in Posidonia oceanica, Cymodocea nodosa and unvegetated bottoms: Importance of meadow edges. Acta Oecol. 1999, 20, 391–405. [Google Scholar] [CrossRef]
  72. Cerrano, C.; Bavestrello, G.; Bianchi, C.N.; Cattaneo Vietti, R.; Bava, S.; Morganti, C.; Morri, C.; Picco, P.; Sarà, G.; Schiaparelli, S.; et al. A catastrophic mass mortality episode of gorgonians and other organisms in the Ligurian Sea (North western Mediterranean), summer 1999. Ecol. Lett. 2000, 3, 284–293. [Google Scholar] [CrossRef]
  73. Guidetti, P.; Lorenti, M.; Buia, M.C.; Mazzella, L. Temporal dynamic and biomass partioning in three Adriatic seagrass species: Posidonia oceanica, Cymodocea nodosa, Zostera marina. Mar. Ecol. 2002, 23, 51–67. [Google Scholar] [CrossRef]
  74. Agostini, S.; Pergent, G.; Marchand, B. Growth and primary production of Cymodocea nodosa in a coastal lagoon. Aquat. Bot. 2003, 76, 185–193. [Google Scholar] [CrossRef]
  75. Barron, C.; Marbà, N.; Terrados, J.; Kennedy, H.; Duarte, C.M. Community metabolism and carbon budget along a gradient of seagrass (Cymodocea nodosa) colonization. Limnol. Oceanogr. 2004, 49, 1642–1651. [Google Scholar] [CrossRef] [Green Version]
  76. Antoniadou, C.; Koutsoubas, D.; Chintiroglou, C. Mollusca fauna from infralittoral hard substrate assemblages in the North Aegean Sea. Belg. J. Zool. 2005, 135, 119–126. [Google Scholar] [CrossRef]
  77. Ballesteros, E. Mediterranean coralligenous assemblages: A synthesis of present knowledge. Oceanogr. Mar. Biol. Annu. Rev. 2006, 44, 123–195. [Google Scholar] [CrossRef]
  78. Boudouresque, C.F.; Bernard, G.; Bonhomme, P.; Charbonnel, E.; Diviacco, G.; Meinesz, A.; Pergent, G.; Pergent-Martini, C.; Ruitton, S.; Tunesi, L. Préservation et Conservation des Herbiers à Posidonia Oceanica; RaMoGe Publ.: Monaco, Monaco, 2006; 200p. [Google Scholar]
  79. Cerrano, C.; Totti, C.; Sponga, F.; Bavestrello, G. Summer disease in Parazoanthus axinellae (Schmidt, 1862) (Cnidaria, Zoanthidea). Ital. J. Zool. 2006, 73, 355–361. [Google Scholar] [CrossRef]
  80. Pauly, D.; Christensen, V. Primary production required to sustain global fisheries. Nature 1995, 374, 255–257. [Google Scholar] [CrossRef]
  81. Christensen, V.; Pauly, D. Trophic models of aquatic ecosystems. ICLARM Conf. Proc. 1993, 26, 390. [Google Scholar]
  82. Redfield, A.C.; Ketchum, B.H.; Richards, F.A. The Influence of Organisms on the Composition of Sea-Water. In The Sea; Hill, N.M., Ed.; Wiley: London, UK, 1963; Volume 2, pp. 27–77. [Google Scholar]
  83. Brown, M.T.; Tennenbaum, S.; Odum, H.T. Emergy Analysis and Policy Perspectives for the Sea of Cortez, Mexico; University of Florida, Center for Wetlands and Water Resources: Gainesville, FL, USA, 1991. [Google Scholar]
  84. Campbell, D.E.; Brandt-Williams, S.; Meisch, M.A. Environmental Accounting Using Emergy: Evaluation of the State of West Virginia; U.S. Environmental Protection Agency: Washington, DC, USA, 2005.
  85. Kira, T.; Shidei, T. Primary production and turnover of organic matter in different forest ecosystems of the western Pacific. Jpn. J. Conserv. Ecol. 1967, 17, 70–93. [Google Scholar]
  86. Peet, R.K. Changes in biomass and production during secondary forest succession. In Forest Succession Concepts and Application; West, D.C., Shugart, H.H., Botkin, D.B., Eds.; Springer: New York, NY, USA, 1980; pp. 324–338. [Google Scholar]
  87. Waring, R.H.; Schlesinger, W.H. Forest Ecosystems Concepts and Management; Academic Press: Orlando, FL, USA, 1985. [Google Scholar] [CrossRef]
  88. Kozlowski, T.T.; Kramer, P.J.; Pallardy, S.G. The Physiological Ecology of Woody Plants; Academic Press: Cambridge, MA, USA, 1991. [Google Scholar]
  89. Yoder, B.J.; Ryan, M.G.; Waring, R.H.; Schoettle, A.W.; Kaufmann, M.R. Evidence of reduced photosynthetic rates in old trees. Forensic Sci. Int. 1994, 40, 513–527. [Google Scholar] [CrossRef]
  90. Hunt, E.R.; Lavigne, M.B.; Franklin, S.E. Factors controlling the decline of net primary production with stand age for balsam fir in Newfoundland assessed using an ecosystem simulation model. Ecol. Model. 1999, 122, 151–164. [Google Scholar] [CrossRef]
  91. Kimura, M.; Simbolon, H. Allometry and life history of a forest understory palm Pinanga coronata (Arecaceae) on Mount Halimun. West Java. Ecol. Res. 2002, 17, 323–338. [Google Scholar] [CrossRef]
  92. Calvo, S.; Lovison, G.; Pirrotta, M.; Di Maida, G.; Tomasello, A.; Sciandra, M. Modelling the relationship between sexual reproduction and rhizome growth in Posidonia oceanica (L.) Delile. Mar. Ecol. 2006, 27, 361–371. [Google Scholar] [CrossRef]
  93. Den Hartog, C. The Seagrasses of the World. In Verhand. Kon. Ned Akad. Wetensch. Afd. Natuurkunde; Tweede Reeks, deel 59; North-Holland Publishing Company: Amsterdam, The Netherlands; London, UK, 1970. [Google Scholar]
  94. Lepoint, G.; Millet, S.; Dauby, P.; Gobert, S.; Bouquegneau, J.M. Annual nitrogen budget of the seagrass Posidonia oceanica as determined by in situ uptake experiments. Mar. Ecol. Prog. Ser. 2002, 237, 87–96. [Google Scholar] [CrossRef] [Green Version]
  95. Duarte, C.M. Allometric scaling of seagrass form and productivity. Mar. Ecol. Prog. Ser. 1991, 77, 289–300. [Google Scholar] [CrossRef]
  96. Marbà, N.; Walker, D.I. Growth, flowering, and population dynamics of temperate Western Australian seagrasses. Mar. Ecol. Prog. Ser. 1999, 184, 105–118. [Google Scholar] [CrossRef] [Green Version]
  97. Odum, E.P. The Strategy of Ecosystem Development. Science 1969, 164, 262–270. [Google Scholar] [CrossRef] [Green Version]
  98. Paoli, C.; Vassallo, P.; Dapueto, G.; Fanciulli, G.; Massa, F.; Venturini, S.; Povero, P. The economic revenues and the emergy costs of cruise tourism. J. Clean. Prod. 2017, 166, 1462–1478. [Google Scholar] [CrossRef]
  99. Vassallo, P.; Bianchi, C.N.; Paoli, C.; Holon, F.; Navone, A.; Bavestrello, G.; Cattaneo Vietti, R.; Morri, C. A predictive approach to benthic marine habitat mapping: Efficacy and management implications. Mar. Pollut. Bull. 2018, 131, 218–232. [Google Scholar] [CrossRef]
  100. Dapueto, G.; Paoli, C.; Vassallo, P.; Pozzi, M.; Massa, F.; Rigo, I.; Fanciulli, G.; Venturini, S.; Merotto, L.; Cappanera, V.; et al. A spatial decision support system for the sustainable management of fishing in marine protected areas. Vie Milieu Life Environ. 2020, 70, 183–195. [Google Scholar]
  101. Montefalcone, M.; Lasagna, R.; Bianchi, C.N.; Morri, C. Anchoring damage on Posidonia oceanica meadow cover: A case study in Prelo Cove (Ligurian Sea, NW Mediterranean). Chem. Ecol. 2006, 22, 207–217. [Google Scholar] [CrossRef]
  102. Montefalcone, M.; Chiantore, M.; Lanzone, A.; Morri, C.; Albertelli, G.; Bianchi, C.N. BACI design reveals the decline of the seagrass Posidonia oceanica induced by anchoring. Mar. Pollut. Bull. 2008, 56, 1637–1645. [Google Scholar] [CrossRef] [PubMed]
  103. Diviacco, G.; Coppo, S. Atlante Degli Habitat Marini Della Liguria: Descrizione e Cartografia Delle Praterie di Posidonia Oceanica e Dei Principali Popolamenti Costieri; Centro Stampa Offset: Chiusanico, Italy, 2006. [Google Scholar]
  104. Bianchi, C.N.; Peirano, A. Atlante Delle Fanerogame Marine Della Liguria: Posidonia Oceanica e Cymodocea Nodosa; ENEA, Centro Ricerche Ambiente Marino La Spezia: La Spezia, Italy, 1995; pp. 1–146. [Google Scholar]
  105. Lasagna, R.; Montefalcone, M.; Albertelli, G.; Corradi, N.; Ferrari, M.; Morri, C.; Bianchi, C.N. Much damage for little advantage: Field studies and morphodynamic modelling highlighted the environmental impact of an apparently small coastal mismanagement. Estuar. Coast. Shelf Sci. 2011, 94, 255–262. [Google Scholar] [CrossRef]
  106. Oprandi, A.; Mucerino, L.; De Leo, F.; Bianchi, C.N.; Morri, C.; Azzola, A.; Benelli, F.; Besio, G.; Ferrari, M.; Montefalcone, M. Effects of a severe storm on seagrass meadows. Sci. Total Environ. 2020, 748, 141373. [Google Scholar] [CrossRef]
  107. Guidetti, P. Detecting environmental impacts on the Mediterranean seagrass Posidonia oceanica (L.) Delile: The use of reconstructive methods in combination with ‘beyond BACI’ designs. J. Exp. Mar. Biol. Ecol. 2001, 260, 27–39. [Google Scholar] [CrossRef]
  108. Lasagna, R.; Montefalcone, M.; Bianchi, C.N.; Morri, C.; Albertelli, G. Morphology of a Posidonia oceanica meadow under altered sedimentary budget. Biol. Mar. Medit. 2006, 13, 245–249. [Google Scholar]
  109. Francour, P.; Harmelin, J.G.; Pollard, D.; Sartoretto, S. A review of marine protected areas in the northwestern Mediterranean region: Siting, usage, zonation and management. Aquat. Conserv. 2001, 11, 155–188. [Google Scholar] [CrossRef]
  110. Astraldi, M.; Manzella, G. Some observations on current measurements on the east Ligurian shelf, Mediterranean Sea. Cont. Shelf. Res. 1983, 2, 183–193. [Google Scholar] [CrossRef]
  111. Baldi, P.; Marri, A.; Schirone, A. Applicazione di un Modello Per la Simulazione Del Trasporto e Della Diluizione Di Inquinanti Nelle Acque Costiere; Tech. Rep. n.1, ENEA, RTI/AMB/GEM–MAR/97/04/RL2/A1.4; ENEA: La Spezia, Italy, 1997. [Google Scholar]
  112. Parravicini, V.; Micheli, F.; Montefalcone, M.; Morri, C.; Villa, E.; Castellano, M.; Povero, P.; Bianchi, C.N. Conserving biodiversity in a human-dominated world: Degradation of marine sessile communities within a protected area with conflicting human uses. PLoS ONE 2013, 8, e75767. [Google Scholar] [CrossRef] [PubMed] [Green Version]
  113. Mancini, I.; Rigo, I.; Oprandi, A.; Montefalcone, M.; Morri, C.; Peirano, A.; Vassallo, P.; Paoli, C.; Bianchi, C.N. What biotic indices tell us about ecosystem change: Lessons from the seagrass Posidonia oceanica. Vie Milieu Life Environ. 2020, 70, 3–4. [Google Scholar]
  114. Gacia, E.; Duarte, C.M. Elucidating sediment retention by seagrasses: Sediment deposition and resuspension in a Mediterranean (Posidonia oceanica) meadow. Estuar. Coast. Shelf Sci. 2001, 52, 505–514. [Google Scholar] [CrossRef]
  115. Borg, J.A.; Attrill, M.J.; Rowden, A.A.; Schembri, P.J.; Jones, M.B. Architectural characteristics of two bed types of the seagrass Posidonia oceanica over different spatial scales. Estuar. Coast. Shelf Sci. 2005, 62, 667–678. [Google Scholar] [CrossRef]
  116. Ruiz, J.M.; Romero, J. Effects of disturbances caused by coastal constructions on spatial structure, growth dynamics and photosynthesis of the seagrass Posidonia oceanica. Mar. Pollut. Bull. 2003, 46, 1523–1533. [Google Scholar] [CrossRef]
  117. Montefalcone, M.; Albertelli, G.; Bianchi, C.N.; Mariani, M.; Morri, C. A new synthetic index and a protocol for monitoring the status of Posidonia oceanica meadows: A case study at Sanremo (Ligurian Sea, NW Mediterranean). Aquat. Conserv. 2006, 16, 29–42. [Google Scholar] [CrossRef]
  118. Backhurst, M.K.; Cole, R.G. Biological impacts of boating at Kawau Island, north-eastern New Zealand. J. Environ. Manag. 2000, 60, 239–251. [Google Scholar] [CrossRef]
  119. Perez, M.; Duarte, C.M.; Romero, J.; Sand-Jensen, K.; Alcoverro, T. Growth plasticity in Cymodocea nodosa stands: The importance of nutrient supply. Aquat. Bot. 1994, 47, 249–264. [Google Scholar] [CrossRef]
  120. Cunha, A.H.; Duarte, C.M. Population age structure and rhizome growth of Cymodocea nodosa in the Ria Formosa (southern Portugal). Mar. Biol. 2005, 146, 841–847. [Google Scholar] [CrossRef]
  121. Connell, J. Popliteal vein entrapment. Br. J. Surg. 1978, 65, 351. [Google Scholar] [CrossRef]
  122. Fox, J.W. The intermediate disturbance hypothesis should be abandoned. Trends Ecol. Evol. 2013, 28, 86–92. [Google Scholar] [CrossRef]
  123. Montefalcone, M.; Albertelli, G.; Morri, C.; Bianchi, C.N. Urban seagrass: Status of Posidonia oceanica facing the Genoa city waterfront (Italy) and implications for management. Mar. Pollut. Bull. 2007, 54, 206–213. [Google Scholar] [CrossRef]
  124. Rigo, I.; Dapueto, G.; Paoli, C.; Massa, F.; Oprandi, A.; Venturini, S.; Merotto, L.; Fanciulli, G.; Cappanera, V.; Montefalcone, M.; et al. Changes in the ecological status and natural capital of Posidonia oceanica meadows due to human pressure and extreme events. Vie Milieu Life Environ. 2020, 70, 3–4. [Google Scholar]
  125. Odum, H.T. Handbook of Emergy Evaluation Folio #2: Emergy of Global Processes; Center for Environmental Policy, University of Florida: Gainesville, FL, USA, 2000; 30p. [Google Scholar]
  126. De Gaetano, P.; Doglioli, A.M.; Magaldi, M.G.; Vassallo, P.; Fabiano, M. FOAM, a new simple benthic degradative module for the LAMP3D model: An application to a Mediterranean fish farm. Aquacult. Res. 2008, 39, 1229–1242. [Google Scholar] [CrossRef]
  127. Cataldi, R.; Mongelli, F.; Squarci, P.; Taffi, L.; Zito, G.; Calore, C. Geothermal ranking of Italian territory. Geothermics 1995, 24, 115–129. [Google Scholar] [CrossRef]
  128. Campbell, D.E.; Lu, H.; Lin, B.L. Emergy evaluations of the global biogeochemical cycles of six biologically active elements and two compounds. Ecol. Model. 2014, 271, 32–51. [Google Scholar] [CrossRef]
Figure 1. Study area including six P. oceanica meadows in the regions of Liguria (Italy) and Corsica (France), located in the north-west of Mediterranean Sea.
Diversity 13 00499 g001
Figure 2. Natural Capital (NC) stocked by the leaves and rhizomes components of P. oceanica, expressed as sej·m2 and em€·m2, in the meadows investigated.
Diversity 13 00499 g002
Table 1. Coordinates of the two transects surveyed in each of the six meadows investigated.
Meadow LocationRegionProtected AreaStation 1Station 2
CamogliLiguriax44°19.650′ N, 9°9.000′ E44°20.517′ N, 9°9.267′ E
Punta PedaleLiguriax44°19.215′ N, 9°12.790′ E44°19.086′ N, 9°12.703′ E
Prelo-San MicheleLiguria 44°20.216′ N, 9°13.454′ E44°20.426′ N, 9°13.467′ E
FramuraLiguria 44°12.363′ N, 9°32.304′ E44°12.372′ N, 9°32.386′ E
Monterosso al MareLiguriax44°8.559′ N, 9°38.554′ E44°8.264′ N, 9°38.406′ E
SantAmanzaCorsicax41°27.795′ N, 9°15.737′ E41°26.102′ N, 9°13.605′ E
Table 2. Results for the leaves of Posidonia oceanica meadows obtained through field surveys and laboratory analysis Values are expressed as the average between the two stations of each meadow.
Unit of MeasureCamogliPunta PedalePrelo-San MicheleFramuraMonterosso al MareSant’Amanza
shoot densityshoot·m−2405.56362.50365.28454.17352.78436.73
leaves numberno. leaves·shoot−16.035.675.424.975.365.00
leaf widthcm0.880.920.710.730.790.76
leaf lengthcm37.0934.7330.1224.8823.4937.01
leaf surfacecm2shoot−1320.08298.47207.55153.70155.23228.65
leaf biomassgC·m−2110.9593.23118.64136.5190.26154.85
Table 3. Results for the rhizomes of Posidonia oceanica meadows obtained through laboratory analysis. Values are expressed as the average between the two stations of each meadow.
Unit of MeasureCamogliPunta PedalePrelo-San MicheleFramuraMonterosso al MareSant’Amanza
number of life cyclesNo.374262516044
rhizome elongationmm·a−18.137.174.836.575.027.40
leaf productiong·m−2·a−11158.24688.17192.49459.85376.80608.99
leaves number per yearNo. leaves·a−17.557.856.507.257.205.00
rhizome biomassgC·m−2730.90625.27412.18533.61377.87412.10
Table 4. Quantity of natural resources necessary to sustain primary production of the meadows analysed.
Quantity
Unit of MeasureCamogliPunta PedalePrelo-San MicheleFramuraMonterosso al MareSant’ Amanza
1Carbong2.03 × 1031.91 × 1031.72 × 1031.86 × 1031.72 × 1031.66 × 103
2Nitrogeng3.47 × 1023.26 × 1022.94 × 1023.18 × 1022.94 × 1022.83 × 102
3Phosphorusg4.96 × 1014.66 × 1014.20 × 1014.54 × 1014.20 × 1014.05 × 101
4Solar radiationJ1.97 × 10112.22 × 10113.26 × 10112.66 × 10113.26 × 10113.11 × 1011
5Rain (chemical potential)J2.07 × 1082.33 × 1083.41 × 1082.79 × 1083.41 × 1083.26 × 108
6WindJ5.38 × 1086.07 × 1088.89 × 1087.25 × 1088.89 × 1088.49 × 108
7Kinetic currentJ1.85 × 1032.09 × 1033.06 × 1032.50 × 1033.06 × 1032.92 × 103
8Geopotential currentJ4.07 × 1054.59 × 1056.72 × 1055.48 × 1056.72 × 1056.42 × 105
9Geothermal heatJ9.73 × 1071.10 × 1081.61 × 1081.31 × 1081.61 × 1081.53 × 108
10TidesJ4.69 × 1065.29 × 1067.75 × 1066.32 × 1067.75 × 1067.40 × 106
11Run offJ8.21 × 1089.26 × 1081.36 × 1091.11 × 1091.36 × 1091.30 × 109
Table 5. Quantity of natural resources, expressed as emergy units, necessary to sustain primary production of the meadows analysed.
Emergy
Unit of MeasureCamogliPunta PedalePrelo-San MicheleFramuraMonterosso al MareSant’ Amanza
1Carbonsej2.07 × 10111.95 × 10111.76 × 10111.90 × 10111.69 × 10111.79 × 1011
2Nitrogensej2.57 × 10122.41 × 10122.18 × 10122.35 × 10122.10 × 10122.22 × 1012
3Phosphorussej1.42 × 10121.33 × 10121.20 × 10121.30 × 10121.16 × 10121.23 × 1012
4Solar radiationsej1.97 × 10112.22 × 10113.26 × 10112.66 × 10113.11 × 10113.24 × 1011
5Rain (chemical potential)sej6.06 × 10126.83 × 10121.00 × 10138.16 × 10129.55 × 10123.85 × 1012
6Windsej1.30 × 10121.46 × 10122.14 × 10121.75 × 10122.05 × 10124.62 × 1012
7Kinetic currentsej3.28 × 10103.70 × 10105.42 × 10104.42 × 10105.17 × 10102.47 × 1010
8Geopotential currentsej1.55 × 10101.74 × 10102.55 × 10102.08 × 10102.44 × 10101.82 × 1010
9Geothermal heatsej5.38 × 10126.06 × 10128.88 × 10127.25 × 10128.49 × 10124.22 × 1012
10Tidessej1.27 × 10111.43 × 10112.10 × 10111.71 × 10112.01 × 10116.33 × 1011
11Run offsej5.43 × 10136.12 × 10138.97 × 10137.32 × 10138.57 × 10135.67 × 1013
Totalsej6.84 × 10137.66 × 10131.11 × 10149.11 × 10131.06 × 10146.84 × 1013
Table 6. Natural Capital stocked per time unit by the leaves and rhizomes components of P. oceanica and overall, expressed as sej m2·a1 and em€·m2·a1, in the investigated sites.
Unit of MeasureCamogliPunta PedalePrelo-San MicheleFramuraMonterosso al MareSant’ Amanza
annual NC of leavessej·m−2·a−11.59 × 10131.17 × 10133.83 × 10126.25 × 10127.28 × 10126.14 × 1012
em€·m−2·a−11.66 × 1011.21 × 1013.99 × 1006.51 × 1007.58 × 1006.40 × 100
annual NC of rhizomessej·m−2·a−11.73 × 10121.71 × 10121.67 × 10121.69 × 10121.67 × 10121.46 × 1012
em€·m−2·a−11.80 × 1001.78 × 1001.74 × 1001.76 × 1001.74 × 1001.52 × 100
total annual NCsej·m−2·a−11.76 × 10131.34 × 10135.50 × 10127.94 × 10128.95 × 10127.60 × 1012
em€·m−2·a−11.84 × 1011.39 × 1015.73 × 1008.27 × 1009.33 × 1007.92 × 100
Publisher’s Note: MDPI stays neutral with regard to jurisdictional claims in published maps and institutional affiliations.

