Article

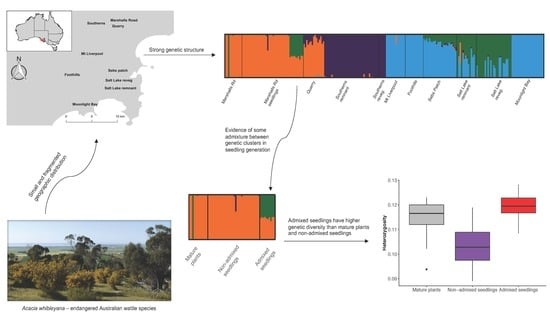
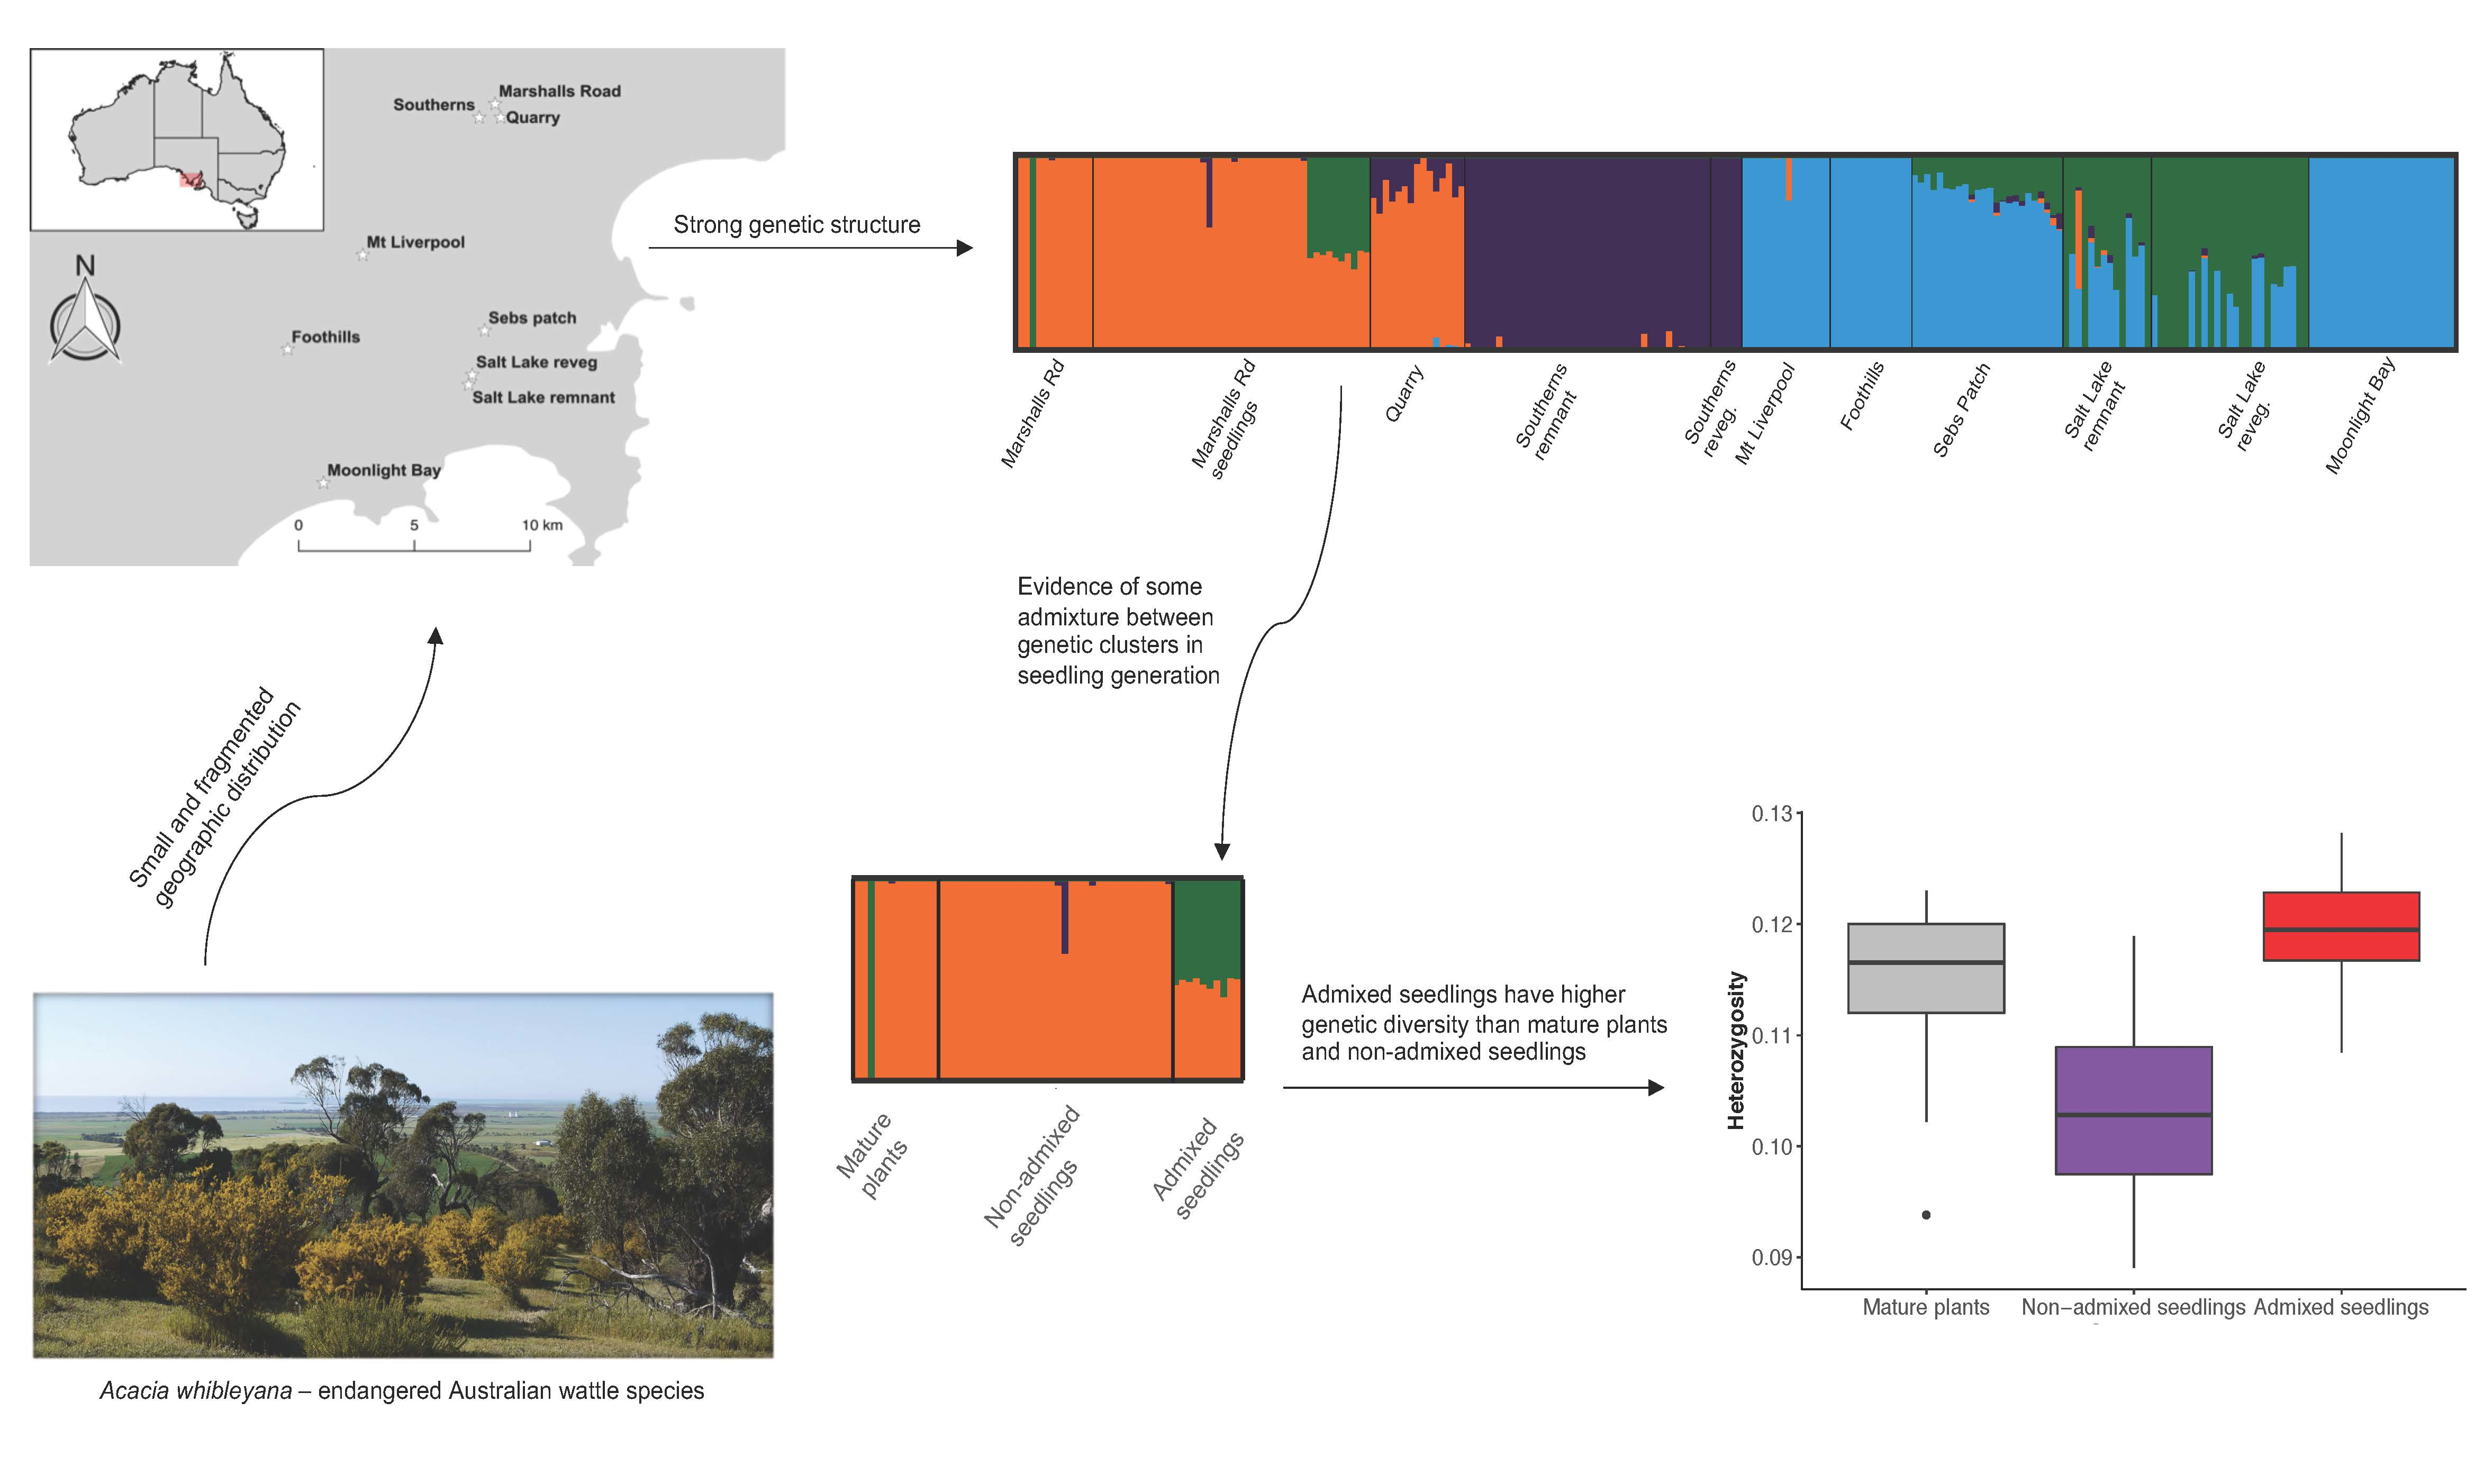
Increased Genetic Diversity via Gene Flow Provides Hope for Acacia whibleyana, an Endangered Wattle Facing Extinction

1
School of Biological Sciences, University of Adelaide, North Terrace, SA 5005, Australia
2
Group on Earth Observations Biodiversity Observation Network (GEO BON) Genetic Composition Working Group, 04103 Leipzig, Germany
3
Department of Medical Biochemistry and Microbiology, Uppsala University, Uppsala 753 41, Sweden
4
Northern Territory Herbarium, Palmerston, NT 0831, Australia
5
Environment Institute, University of Adelaide, North Terrace, SA 5005, Australia
6
College of Science and Engineering, Flinders University, Bedford Park, SA 5042, Australia
*
Authors to whom correspondence should be addressed.
Diversity 2020, 12(8), 299; https://doi.org/10.3390/d12080299
Submission received: 29 June 2020 / Revised: 23 July 2020 / Accepted: 24 July 2020 / Published: 30 July 2020
(This article belongs to the Special Issue Evolutionary Ecology and Conservation of Native Plants)

Abstract

:
In this paper we apply a conservation genomics approach to make evidence-based management recommendations for Acacia whibleyana, an endangered shrub endemic to Eyre Peninsula, South Australia. We used population genomic analysis to assess genetic connectivity, diversity, and historical inbreeding across all known stands of the species sampling remnant stands, revegetated stands of unknown origin, and a post-fire seedling cohort. Our results indicate a degree of historical connectivity across the landscape, but habitat loss and/or pollinator community disruption are potential causes of strong genetic structure across the remnant stands. Remnant stands had low genetic diversity and showed evidence of historical inbreeding, but only low levels of intra-stand relatedness indicating that risks of contemporary inbreeding are low. Analysis of a post-fire first generation cohort of seedlings showed they likely resulted from intra-stand matings, resulting in reduced genetic diversity compared to the parents. However, admixed seedlings in this cohort showed an increase in heterozygosity relative to likely sources and the non-admixed seedlings of the same stand. Assisted inter-stand gene flow may prove an effective management strategy to boost heterozygosity and corresponding increases in adapting capacity in this endangered species.

Graphical Abstract

1. Introduction

The likelihood that a species is able to adapt to both short-term environmental variability and long-term change is positively correlated with its level of genetic diversity [1]. Small and/or fragmented populations often suffer from restricted gene flow and small effective population sizes, which increase the effects of genetic drift. In small populations, the chances of inbreeding are high, resulting in further reductions in genetic diversity. Genetic drift and inbreeding are therefore potential drivers of the extinction vortex and reduce the adaptive potential of small populations [1,2,3,4,5,6]. The maintenance and, where possible, enhancement of genetic diversity is therefore a critical aim of conservation genetic strategies and can be achieved through increasing connectivity and gene flow between subpopulations [7].
Connecting isolated populations via the translocation of individuals involves an element of risk [7]. Admixture may in fact lead to reduced population fitness due to outbreeding depression, where the introduction of non-local genotypes can disrupt local adaptation and/or lead to the breakdown of adaptive gene complexes [8]. In the case of rare and threatened species, however, the risks of outbreeding depression are often outweighed by the consequences of inbreeding and low adaptive potential if no action is taken [7,9,10]. Indeed, the primary risks for threatened species, especially those that occur in small and fragmented populations, are the deleterious inbreeding and genetic drift effects [9,10]. In such situations, the introduction of non-local genotypes may instead increase a population’s chances of survival due to a genetic rescue effect [11,12,13].
The development of high throughput sequencing technologies over the last decade has facilitated research into conservation genetics in plant species, with an aim to inform conservation practice on the appropriate management of genomic diversity for improved conservation outcomes [14,15,16]. Such studies can provide insights into the genetic diversity within plant populations, and the historical gene flow between populations, as well as identifying where genetic breaks may occur [16]. This information can be used to guide when and how to enhance the genetic diversity of an endangered species while minimising the risks associated with moving genetic material across large genetic breaks in a species range, such as outbreeding depression [16]. As a result of such studies, there have been increasing calls for a paradigm shift in conservation management thinking—away from the separate management of isolated populations and towards a strategy that seeks to increase connectivity and diversity across the range of a species in the hope it will lead to genetic rescue [13,17].
First described in the 1990s, the endangered Acacia whibleyana (family Fabaceae) is restricted to the Tumby Bay area of the Eyre Peninsula, South Australia. There have been significant investments to aid its conservation, and it is part of the Australian Government’s 30 by 2020 Threatened Species Strategy [18]. Land clearing has limited its suitable habitat, and ongoing low seed set and lack of natural recruitment, as well as competition from weeds, are some of its key threatening processes [19,20,21]. One of the priority conservation actions for A. whibleyana is to establish new translocated populations [19,20,21]. Conservation management decisions should ideally be underpinned by a sound understanding of its genetic structure. However, to date, there has been no published research on the levels of genetic variation and structure within this species.
Here, we address this knowledge gap by using high throughput sequencing to construct a high-resolution picture of the population genetic structure and diversity in A. whibleyana. We generated a genome-wide single nucleotide polymorphism (SNP) dataset for the last remaining stands of A. whibleyana, including all remnant and revegetated stands, plus a cohort of seedlings that recruited post-fire. We used this population genomic information to provide practical conservation management recommendations for the conservation of this species.

2. Materials and Methods

2.1. Study Species and Sampling

Acacia whibleyana is a narrow-ranged endemic shrub that is restricted to five subpopulations near Tumby Bay, Eyre Peninsula, South Australia (Figure 1). The species is not known to hybridise [21].
Acacias have an important nitrogen fixation and nutrient cycling role in many ecosystems, which is of particular ecological importance in the predominantly arid, nutrient poor soils of Australia [22]. It produces flowers between August and October [23], with fruits maturing from December to January. It has four to six seeds per pod, and seed dispersal is believed to be assisted by ants [23]. Like other wattle species, the seeds of A. whibleyana have a hard seed-coat dormancy mechanism that requires disturbance to scarify the seed and trigger germination.
A species census in April 2019 recorded ~1800 individuals across all known subpopulations. The maximum geographic distance between subpopulations was 38 km. The total area of occupancy of Acacia whibleyana was 14.2 ha (0.142 km2) based on site-validated data of each remnant stand. Many plants were restricted to remnant vegetation on roadside verges, with some found on privately-owned land which is grazed by livestock [21] (Table A1 in Appendix A). One of the existing stands (Marshalls Rd) was established in 2004 through two separate translocations, with plants from the Quarry stand. The oldest Marshalls Rd stand was experimentally burned in October 2018 to explore the effect of fire on recruitment.
Initially, we collected A. whibleyana samples in late 2017. Sampling was rangewide and included 5 remnant stands and a revegetated stand. On average, we aimed to collect 20 individuals per stand where possible to allow for extraction and genotyping failures, but this varied depending on census size and accessibility (Table A1). We targeted young leaves to maximise DNA quality, and once picked, leaves were placed in gauze bags and desiccated on silica gel until DNA extraction.
In May 2018, a prescribed burn of the revegetated Marshalls Rd stand was done to encourage natural regeneration. An additional 46 seedlings were collected in October 2018 post-burn for genotyping. Seedling leaves were placed directly into DNA extraction plates for processing of the fresh leaf material.
In February 2019, an additional sampling trip took place, at which time samples were collected from both a newly-discovered stand of A. whibleyana within the Salt Lake subpopulation and from a known stand previously not sampled. Samples were also collected from a site on the western edge of the Quarry subpopulation referred to as Southerns.

2.2. DNA Extraction, Sequencing and Filtering

DNA extraction, library preparation, and sequencing were done at the Australian Genome Research Facility. We used the Machery-Nagel Nucleospin Plant II Kit for DNA extraction. Double digest restriction-associated DNA sequencing (ddRADseq; [24] was used to generate reduced representations of the genome for SNP calling across all samples. Full details of the method can be found in Peterson, Weber [24]. Briefly, ddRAD library preparation protocol involved the following steps: (1) DNA digestion with two restriction enzymes (Pstl and MseI); (2) ligation of barcoded adaptors, specific to each sample, to restriction site overhangs; (3) a wide size selection of pooled digested-ligated fragments 280–342bp using Blue Pippin (Sage Science, Beverly, MA, USA) (Wide); (4) amplification of library via polymerase chain reaction (PCR) for 11 cycles using indexed primers. The libraries were assessed by gel electrophoresis (Agilent D1000 ScreenTape Assay), quantified by quantitative polymerase chain reaction (qPCR; KAPA Library Quantification Kits for Illumina) and then sequenced with 150 bp single reads on the NextSeq 500 system using NextSeq 500 high Output Kit v2 (150 cycles) reagents.
Following sequencing, reads were processed with the STACKS pipeline [25,26] at Australian Genome Research Facility(AGRF; Melbourne, Australia). Briefly, reads were deconvoluted by inline barcodes, checked for read quality, and for the presence of a restriction site, creating per-sample FASTQ files. These FASTQ files were then trimmed to the size of the shortest read minus 2 bp to compensate for differences in read length due to any variation in barcode length. After trimming, stacks of similar reads were created for each sample individually; these read stacks are also known as tags. Tags which appear across all samples were collated (catalogue tags), and genotypes were then allocated to the common polymorphic sites. The collated SNPs across all individuals were then filtered with the following settings: minimum number of reads required at a stack to call a homozygous genotype = 5; minor allele frequency, below which a stack is called a homozygote = 0.05; minimum minor allele frequency to call a heterozygote = 0.1 (above 0.05 but below 0.1, a stack is called ‘unknown’). Computed genotypes were then exported as a single .vcf file for further filtering and analysis.
We used VCFtools [27] to remove SNPs that had a minimum depth of coverage of <10 reads per individual or a minor allele frequency of <0.1. VCFtools was also used to assess missing data, removing SNPs if they had >25% missing data across all individuals and removing individuals if they had >25% missing SNP calls. The --indep-pairwise command in PLINK [28] was then used to identify SNPs in linkage disequilibrium, whereby one SNP in a pair of linked SNPs (r2 > 0.8) was pruned from the data set.
Inbreeding coefficient (F) values were estimated using the G-stats calculator in GENODIVE v. 3.2 [29] for each SNP across all samples, and SNPs with significantly negative F removed using VCFtools (significance assessed using permutation tests with 10,000 permutations and a significance threshold of p < 0.05). Negative F indicates greater than expected heterozygosity under Hardy-Weinberg equilibrium, which may be indicative of paralogous reads being stacked together in the STACKS pipeline [30].

2.3. SNP Calling

We generated 467,346,192 sequences across the 237 A. whibleyana samples in our study. A total of 281,779 SNPs were called after read alignment. After filtering on depth of coverage, minimum minor allele frequency, percentage of missing data, linkage disequilibrium, and outliers, 16,776 SNPs across 228 individuals remained in our dataset (see Table 3 for final sample sizes). Computed genotypes were then exported as a single .vcf file for further filtering and analysis (Supplementary file S1). The final, filtered SNP set was then used to investigate population genetic structure, diversity, and inbreeding.

2.4. Genetic Structure Analysis

We estimated pairwise genetic differentiation (FST) between all 11 stands (including the remnant, revegetated, translocated, and the seedling cohort) in GENODIVE v3.2 [29]. We also used two different genetic clustering analyses to identify the most likely number of genetic clusters (K) in our dataset. Firstly, we used the non-model based Discriminant Analysis of Principal Components (DAPC) using the R package adegenet [31]. DAPC is a multivariate approach that is not based on population genetic models, but rather seeks discriminating functions between groups of individuals while minimising variation within clusters. Genetic data were first transformed into uncorrelated components using principal component analysis (PCA). The number of genetic clusters was then defined using k-means, a clustering algorithm that looks for the value of K that maximises the variation between groups. The Bayesian Information Criterion (BIC) was calculated for K = 1 to 20, and the K value with the lowest BIC was selected as the optimal number of clusters. A discriminant analysis was then performed on the first 80 principal components using the function dapc, implemented in R, in order to efficiently describe the genetic clusters and assign samples to each cluster.
The model-based genetic clustering algorithm ADMIXTURE [32] was also used to estimate the most likely number of clusters (K) in our dataset. ADMIXTURE includes a cross-validation procedure for identifying the value of K for which the model has best predictive accuracy (see ADMIXTURE manual for full details of model and cross validation procedure). ADMIXTURE was also run for K values 1 to 10 and the most likely value of K was assessed by comparing the cross-validation errors (cv errors) between runs, with the lowest cv error indicating greatest support. We repeated each ADMIXTURE analysis ten times and used CLUMPAK to combine the results and construct bar plots of individual assignment to clusters for the most supported values of K using DISTRUCT [33,34].
GENODIVE v3.2 [29] was used to run a nested analysis of molecular variance (AMOVA) to explore genetic variation within individuals, among individuals nested within collection stand, and among collection stands.

2.5. Genetic Diversity and Inbreeding Analysis

We used GENODIVE to estimate the inbreeding coefficient (F), and observed (HO) and expected (HE) heterozygosity. We also ran these analyses on only Marshalls Rd and the Marshalls Rd seedlings, comparing admixed and non-admixed individuals (as identified from the DAPC and ADMIXTURE analyses) in the seedling cohort. In order to compare levels of heterozygosity in the Marshalls Rd seedlings that were identified as admixed and non-admixed (see results), we calculated individual heterozygosity using the -het flag in VCFTools. These values were then imported into R for plotting using the ggplot2 package [35]. To further explore historical inbreeding and future risks of inbreeding, we estimated pairwise kinship coefficients in GENODIVE. Kinship varies between 0 and 1, where 0 indicates no genetic evidence of recent co-ancestry and 1 indicates samples are genetically identical (i.e., clones).

2.6. Redundancy Analysis

All stands were located in close proximity to each other (the maximum distance between any two stands was 38 km). We ran a redundancy analysis (RDA) on the allele frequencies of all SNPs in order to assess how much of the genetic variation among our populations can be explained by spatial factors (i.e., resulting from isolation by distance) using the VEGAN analytical package v2.5-6 in R (https://cran.r-project.org/web/packages/vegan/). First, spatial coordinates for each sampling stand were centred and converted into third degree polynomials. An RDA of allele frequencies~all spatial polynomials was then performed using the ‘rda’ function. Analysis of variance (ANOVA) was used to assess the significance of the RDA using the ‘anova.cca’ function.

3. Results

3.1. Genetic Structure Analysis

Both the DAPC and ADMIXTURE analyses indicated significant genetic structure in our data (Figure 2). The BIC values from DAPC revealed similar levels of support for K = 3, 4, or 5. Cross validation error values from the ADMIXTURE analysis showed greatest support for K-values of 5–7. However, beyond K = 5 the ADMIXTURE results appeared noisy and clustering closely matched individual source population for K values below six.
At K = 3, individuals were clustered into groups that aligned with geography: a northern cluster containing samples from Quarry and all but the one above-mentioned Marshalls Rd individual (Cluster 1), and a second cluster containing all samples from Southerns (Cluster 2), and a southern cluster, containing all individuals collected from stands in the south (Salt Lake reveg. and remnant, Sebs Patch, Moonlight Bay, Foothills Rd, and Mt Liverpool, and one individual from Marshalls Rd; Cluster 3). In the ADMIXTURE analysis, ten of the Marshalls Rd seedlings showed approximately 50/50 admixture between Clusters 1 and 3 and, in the DAPC analysis, clustered with Cluster 3.
For K = 4, substructure was revealed within the revegetated and remnant Salt Lake stands, with 17 individuals having almost 100% assignment to this 4th cluster (Cluster 4), with the rest displaying admixture between clusters 1 and 4. Individuals from the nearby Sebs Patch stand displayed a low level of admixture with Cluster 4 (average assignment 16%). The Marshalls Rd individual that showed 100% assignment to Cluster 3 when K = 3 had 100% assignment to Cluster 4, and the admixed seedlings showed 50% assignment to Cluster 4. Further substructure was revealed for K = 5, in Foothills Rd and Mt Liverpool, with the Foothills Rd and Mt Liverpool stands forming a distinct genetic cluster (Cluster 5) which distinguished them from Moonlight Bay plants.
The majority of the Marshalls Rd seedlings clustered with the Quarry and Marshalls Rd samples in all genetic structure analyses. However, of the 46 seedlings genotyped, 10 of the samples showed ca. 50/50 ancestry with Marshalls Rd and Salt Lake in the ADMIXTURE analysis, suggesting that they are likely to be offspring from a cross between a Marshalls Rd individual and a Salt Lake individual. These seedlings were also located halfway between the Marshalls Rd samples and Salt Lake samples in the PCA, and clustered with some Salt Lake revegetation and remnant samples in the DAPC (Figure 1).
The genetic proximity of clusters generally reflected geographic proximity. This was supported by results of pairwise genetic differentiation (FST) between stands (Table 1) and the RDA. Pairwise FST between stands was reasonably high (a maximum of 0.193, Table 1). However, there was high differentiation between the two geographically close stands Foothills and Mt Liverpool (pairwise FST = 0.185, Table 1). These stands also displayed comparatively high genetic differentiation from all other stands (Mt Liverpool pairwise FST = 0.100 to 0.185 and Foothills pairwise FST = 0.129 to 0.193, Table 1). The redundancy analyses of allele frequencies ~ space revealed that the spatial variables explained 83% of the variation in allele frequencies among stands (ANOVA, F = 6.43, p = 0.017), showing spatial variation to be a strong explanatory variable of the observed patterns of genetic differentiation.
Results showed all historical revegetated stands clustered with their nearby remnant stands. Marshalls Rd (revegetated) and Quarry (remnant) were genetically very similar (Pairwise FST = 0.017, Table 1) and clustered together in PCA, DAPC, and ADMIXTURE analyses, most likely reflecting the use of the Quarry stand as the source population for the Marshalls Rd stand. The samples taken from Salt Lake revegetation were genetically similar to samples taken from the remnant individuals at Salt Lake (Pairwise FST = 0.000; Table 1.) and also clustered together in the PCA, DAPC, and ADMIXTURE analyses. Similarly, the samples collected from the Southerns revegetation stand were genetically similar to those from the Southerns remnant stand (Pairwise FST = 0.013; Table 1.), again corroborated by the PCA, DAPC and ADMIXTURE analyses.
Analysis of molecular variance revealed that the majority of genetic variation is found among all individuals (73.6%). Significant levels of genetic variation are also found among individuals within a collection stand (15.7%, p < 0.001), as well as between collection stands (10.7%, p < 0.001, Table 2), as highlighted by the genetic structure analysis.

3.2. Genetic Diversity and Inbreeding

Expected heterozygosity varied significantly but by a small degree between stands (HE = 0.117 to 0.141, Table 3). Observed heterozygosity was consistently lower and less variable than expected heterozygosity (HO = 0.102 to 0.118, Table 3), which is reflected in the positive inbreeding coefficients (F) found in all collection stands (F ranged from 0.110 to 0.226; Table 3), indicating the likely presence of historical inbreeding. Mt Liverpool and Foothills had significantly lower inbreeding coefficients than other stands (F = 0.11, 0.13 respectively, Table 3). Moonlight Bay, Sebs Patch, and Salt Lake remnant stands had the highest inbreeding coefficients (F = 0.226 to 0.211, Table 3). The confidence intervals from the kinship analysis spanned zero for every stand, suggesting that relatedness, and therefore contemporary inbreeding, was low within stands (Table 3).
We found significant differences in HE, HO and F between the mature Marshalls Rd plants and both the non-admixed and admixed seedlings (Table 3, Figure A2). The non-admixed seedlings displayed lower heterozygosity and higher F compared to the mature plants (Table 3, Figure A2). In contrast, the admixed seedlings had higher heterozygosity compared to both the non-admixed seedlings and mature plants (Table 3, Figure A2). Further, we found the inbreeding coefficient was significantly lower in the admixed seedlings compared to the non-admixed seedlings (F = 0.036 and 0.181 respectively, Table 3, Figure A2).

4. Discussion

Our analysis of genomic diversity and differentiation among the remaining stands of the endangered Acacia whibleyana has revealed many of the hallmarks of a species trapped in an extinction vortex. There was strong genetic structure among stands, indicating that gene flow between stands is likely restricted and genetic drift has driven divergence among stands. Positive inbreeding coefficients across all stands suggest the presence of historical inbreeding, however analysis of kinship shows the relatedness of remaining plants to be low within stands, suggesting the risks of contemporary inbreeding are low and potentially that this species has mechanisms for inbreeding avoidance. We found that seedlings resulting from admixture events between the distinct genetic clusters had higher genetic diversity compared to progeny of single-parent stands. Together, these results indicate that while the species presents low risks of contemporary inbreeding, the establishment of mixed genetic cluster stands may be required to boost the genetic diversity of subsequent generations and provide an escape route from the extinction vortex this species is facing.

4.1. Genetic Structure and Sources of Genetic Variation

The level of genetic structure found among A. whibleyena stands was high, given the small geographic range of the species (<38 km), and spatial location was a strong explanatory variable of the genetic variation in the species. The fact that the remaining A. whibleyana plants were distributed across small subpopulations suggests that genetic drift has played a part in shaping the genetic differentiation of the stands, as has been found for other endangered plant species, including the comparable Acacia pinguifolia [36]. Acacias are mostly pollinated by generalists, with bees their most common pollinators [37]. Concerns have been raised over the generalised threat of pollinator limitation to genetic diversity and inbreeding [38], with supporting evidence from other endangered Acacias [37]. Pollinator limitation could, therefore, be part of the explanation for the high genetic structure and low levels of genetic diversity found in A. whibleyana and may represent a major threat to the long-term survival of the species. Another possible contributing factor is that the seed is predominantly dispersed by ants and therefore only over short distances [39]. This, coupled with the lack of alternative suitable habitats for seed to disperse to, may also limit gene flow, however pollen dispersal is thought to have a far greater effect on genetic structure [40].
Interestingly, we found strong genetic structure among stands that were closely located. The Southerns site was found to be significantly differentiated from the Marshalls Rd and Quarry sites despite its proximity to them (<1 km). Further, the highest level of genetic differentiation was between two of the most geographically proximate stands—Foothills and Mt Liverpool. Despite the high FST between these stands reflecting large differences in allele frequencies, they cluster together and separately from all other sites at K = 5 in the ADMIXTURE analysis, suggesting that they share variation not found elsewhere. The small population size of these stands is likely to have led to a pronounced effect of genetic drift increasing relative divergence between them.

4.2. Opportunistic Test of Admixture on Genetic Diversity

We present evidence that seedlings at Marshalls Rd likely resulted from crosses between individuals from distinct genetic clusters. The likely source of this admixture is a single Marshalls Rd adult that clusters with Salt Lake individuals. This individual is likely to have originated from a translocation event, such as from seed from the Salt Lake site that was included in the original Quarry/Marshalls Rd translocation project. Plants were propagated for revegetation projects at both sites in the same nursery during this time, so we believe this genetic transfer is likely (Geraldine Turner, pers. Comm, May 2020.). While we cannot rule out the presence of other Salt Lake-like individuals at the Marshalls Rd site, as we did not genotype all mature plants and seedlings, the presence of at least one Salt Lake-like individual is strongly indicative of an occurrence of within-stand mating resulting in the admixed seedlings, rather than gene flow between the geographically distant Marshalls Rd and Salt Lake stands.
The admixed seedlings provided us with an unexpected opportunity to explore the effects of inter-population crossing on heterozygosity and inbreeding. When comparing the admixed to the non-admixed seedlings, our results show a striking reduction in the inbreeding coefficient and increase in observed heterozygosity in the admixed seedlings (admixed vs. non-admixed seedlings: F = 0.181 vs. 0.036; Ho = 0.103 vs. 0.120; He = 0.126 vs. 0.125). These large differences suggest that including individuals from a non-local population could bolster the genetic diversity of a population by encouraging matings between genetically dissimilar individuals. We also saw reduced observed heterozygosity in the non-admixed seedlings compared to mature Marshalls Rd plants, indicating that the species is experiencing a reduction in genetic diversity across generations, likely due to increased inbreeding, pushing the species further down the extinction vortex. Alternatively, these results could indicate that the seedlings included in our study were more inbred than would normally make it to maturity, and that insufficient time has passed for inbreeding depression to manifest.
Unfortunately, all of the seedlings genotyped in this study died, and so the fitness effects of higher or lower genetic diversity in the admixed and non-admixed seedlings respectively is unknown. Whilst it is promising to see that the admixed progeny display increased levels of heterozygosity, whether assisted gene flow among genetic clusters would prove an effective conservation strategy for increasing fitness in future generations is unclear. We see this as the next research goal for this species, with controlled crosses and genotype-fitness associations required to test these ideas.

4.3. Genetic Diversity and Inbreeding

Levels of heterozygosity were similar across all stands and observed heterozygosity was consistently lower than expected heterozygosity in all stands, which is indicative of historical inbreeding. It is difficult to assess whether or not genetic diversity is low in this species in the absence of a reference species, ideally a more widespread Acacia species. To our knowledge, no other studies using genome-wide SNP markers have been carried out on Acacia species. However, studies on other predominantly outcrossing tree species that have utilised SNP markers report heterozygosity values of between 0.1 and 0.4 [41,42,43,44,45], suggesting that A. whibleyana is at the lower end of this range. Additionally, the increase in heterozygosity that we observe in the admixed seedlings demonstrate that the genetic diversity we observe is not evenly distributed among the stands and can potentially be boosted in future generations via admixture. However, the fitness consequences of this boost in genetic diversity requires further exploration.
Australian Acacia species are generally preferential outcrossers [46,47,48], and therefore are likely to display mechanisms of inbreeding avoidance. In a study of Acacia myrtifolia [46], it was found that as relatedness between individuals increased, the number of set seed pods decreased. Low seed set has been observed in some stands of A. whibleyana [49], however our kinship analysis revealed relatedness among individuals in stands to be low. We also show there to be substantial genetic variation within individuals, meaning that the risks of contemporary inbreeding are low. There has also been suggestion that some endangered Acacia are intrinsically rare or can at least adapt to having lowered genetic diversity and small population size by increasing the levels of selfing or, in extreme cases, reproduce vegetatively [50,51]. It is unclear if A. whibleyana could respond in this manner.

4.4. Management Recommendations

The results we present here demonstrate that the remaining stands of A. whibleyana exhibit low inter-stand gene flow with evidence that genetic drift, and potentially inbreeding, will draw the species further down the extinction vortex in subsequent generations. Our findings are supported by demographic observations of A. whibleyana, where low seed set, a lack of recruitment, and poor seedling survival have been identified as threats to the its survival [21]. Similar patterns were also observed for A. pinguifolia, which is another threatened species endemic to a similar region to A. whibleyana. A. pinguifolia presented high levels of historical inbreeding, strong fine-scale genetic structure, and limited inter-stand gene flow [36]. Crossing between populations was recommended as a strategy to help reduce the risk of extinction in this species [36].
The boost to genetic diversity that we observed in the seedlings resulting from natural crossings between two of the genetic clusters provides hope for the species and a potential escape from the extinction vortex. These chance crossings demonstrate that genetic diversity can substantially increase within a single generation. However, since a significant proportion of the diversity found between the remaining stands is an ongoing concern, we suggest that a long-term genetic rescue trial should be established. This trial should focus on simultaneously determining the effects and trade-offs of inbreeding vs. outbreeding depression, heterosis as a result from inter-stand crosses, and pollination deficiency. This trial would require experimentally crossing a range of selfed, intra-stand, and inter-stand individuals, spanning the extent of genetic distance observed, and monitoring plants into adulthood. This genetic rescue trial could be efficiently combined with an assessment of pollination deficiency; this pollination/pollinator effect is important to determine as it may be contributing to the poor demographic rates observed [21,38].

5. Concluding Remarks

All too often, it is easy to lose optimism when managing an endangered species faced with extinction. Here, through an unexpected natural experiment, we have been given a glimmer of hope and guidance for the management of Acacia whibleyana. Through the analysis of the seedlings, we have evidence that mixing between genetically different stands can increase genetic diversity, at least for a period of time in the first generation. Further, our results suggest that without action, we may experience a decrease in genetic diversity with each generation. We hope that a cautious approach to genetic recue will help lessen the extinction risk faced by Acacia whibleyana by increasing its levels of genetic diversity and hopefully its adaptability in the face of environmental change.

Supplementary Materials

The following are available online at https://www.mdpi.com/1424-2818/12/8/299/s1, Supplementary file S1—The variant call format (vcf) file is available as supplementary (Acacia_whibleyana_paper.vcf). Reads and mapping files will be archived at the NCBI SRA (accession number TBA).

Author Contributions

Conceptualization, C.B., M.F.B., A.J.L. and D.C.B.; Data curation, C.B. and M.F.B.; Formal analysis, C.B., M.J.C. and M.F.B.; Funding acquisition, M.F.B., A.J.L. and C.B.; Methodology, C.B., M.F.B., M.J.C., A.J.L., D.C.B., J.G.P. and R.F.; Project administration, C.B., M.F.B., M.J.C., A.J.L, D.C.B., J.G.P. and R.F.; Resources, M.F.B.; Supervision, M.F.B., A.J.L. and M.J.C.; Visualization, C.B., M.F.B., and M.J.C.; Writing—Original draft, C.B.; Writing—Review & editing, C.B., M.F.B., M.J.C., A.J.L., D.C.B., J.G.P., R.F. All authors have read and agreed to the published version of the manuscript.

Funding

This research was funded by the Commonwealth Government’s Threatened Species Recovery Fund, Eyre Peninsula Natural Resources Management Board (EPNRMB), and the Australian Research Council (grant numbers DE150100542 and DP150103414). This project was supported by The Holsworth Wildlife Research Endowment & The Ecological Society of Australia.

Acknowledgments

The authors wish to thank Geraldine Turner and Seb Drewer from the Eyre Peninsula Natural Resources Management Board (EPNRMB) for providing their assistance and expertise throughout this study, and everyone else who assisted us with sample collection. Thanks also go to Sam Turner-Blyth for help early on in the writing process. Finally, a special thanks to Jeremy Austin for his assistance behind the scenes.

Conflicts of Interest

The authors declare no conflict of interest.

Appendix A

Table A1. Summary of collection stands, habitat type, census counts, sample size after filtering (n), and land use history of Acacia whibleyana.
Collection StandHabitat TypeCensus CountnLand Use History
Marshalls RoadRoadside vegetation.42 reveg.12Road reserve. Control burn in 2018 resulted in A. whibleyana plants emerging post fire.
100+ seedlings44
QuarryPost-disturbance regeneration in disused quarry, surrounded by remnant eucalypt woodland189 remnant15Council-owned land. Quarried up to 1950’s, stockpiling gravel then woodchips (to 1993).
SouthernsRemnant eucalypt woodland.59 remnant39Private land. 40ha fenced to exclude stock in May 2012.
8 reveg.5
Mount LiverpoolRemnant eucalypt woodland.50 remnant14Private land subdivided for rural living & stock removed 2005.
Foothills RoadRoadside vegetation.17 remnant13Road reserve, burnt in 2005 bushfires. A. whibleyana plants emerged post fire.
Sebs PatchRemnant chenopod scrub along salt-scalded drainage line and salt lake.107 remnant24Private land under different land management regimes (grazed by sheep intermittently, a small portion fenced & revegetated)
Salt LakeRemnant chenopod scrub adjacent to salt lake.137 remnant14Council-owned land of road intersection, fenced in 1995 to exclude vehicles and rabbits.
26 reveg.25
Moonlight BayRemnant mallee woodland on salt lake lunettes. 557 remnant23Private land. Approx. one third of population fenced from stock. Remainder accessible to sheep on intermittent basis. Area around salt lake burnt in 2005 bushfires.
Note. Adapted from Faast, R.; Blyth, C.; Breed, M.F.; Packer, J.G. Acacia Whibleyana: Part 1—Literature Synthesis to Inform Conservation of a Threatend Acacia; Eyre Peninsula Natural Resources Management Board, 2019, Port Lincoln, South Australia, Australia.
Figure A1. (a) ADMIXTURE error results - the cv errors are plotted for K = 1–10, with the lowest cv error indicating greatest support at K = 7. (b) Bar plots represent individual genetic cluster assignment from ADMIXTURE results from K = 2 to K = 10.
Diversity 12 00299 g0a1
Figure A2. Boxplots of the Marshalls Rd mature plants, admixed seedlings, and non-admixed seedlings. (A) proportions of single nucleotide polymorphisms (SNPs) that are heterozygous, (B) inbreeding coefficient (F), and (C) the kinship values. Homogeneous subgroups are indicated by a, b, and c. Note the greater proportion of heterozygous SNPs in admixed seedlings, demonstrating that admixture between genetic clusters may lead to greater genetic diversity compared to non-admixed seedlings and the parent populations.
Diversity 12 00299 g0a2

References

  1. Reed, D.H.; Frankham, R. Correlation between fitness and genetic diversity. Conserv. Biol. 2003, 17, 230–237. [Google Scholar] [CrossRef]
  2. Nicotra, A.B.; Beever, E.A.; Robertson, A.L.; Hofmann, G.E.; O’Leary, J. Assessing the components of adaptive capacity to improve conservation and management efforts under global change. Conserv. Biol. 2015, 29, 1268–1278. [Google Scholar] [CrossRef] [PubMed]
  3. Leimu, R.; Mutikainen, P.; Koricheva, J.; Fischer, M. How general are positive relationships between plant population size, fitness and genetic variation? J. Ecol. 2006, 94, 942–952. [Google Scholar] [CrossRef]
  4. Aguilar, R.; Quesada, M.; Ashworth, L.; Herrerías-Diego, Y.; Lobo, J. Genetic consequences of habitat fragmentation in plant populations: Susceptible signals in plant traits and methodological approaches. Mol. Ecol. 2008, 17, 5177–5188. [Google Scholar] [CrossRef]
  5. Keller, L. Inbreeding effects in wild populations. Trends Ecol. Evol. 2002, 17, 230–241. [Google Scholar] [CrossRef]
  6. Spielman, D.; Brook, B.W.; Frankham, R. Most species are not driven to extinction before genetic factors impact them. Proc. Natl. Acad. Sci. USA 2004, 101, 15261–15264. [Google Scholar] [CrossRef] [Green Version]
  7. Weeks, A.; Sgrò, C.M.; Young, A.G.; Frankham, R.; Mitchell, N.J.; Miller, K.A.; Byrne, M.; Coates, D.J.; Eldridge, M.D.B.; Sunnucks, P.; et al. Assessing the benefits and risks of translocations in changing environments: A genetic perspective. Evol. Appl. 2011, 4, 709–725. [Google Scholar] [CrossRef] [Green Version]
  8. Barmentlo, H.; Meirmans, P.G.; Luijten, S.H.; Triest, L.; Oostermeijer, G. Outbreeding depression and breeding system evolution in small, remnant populations of Primula vulgaris: Consequences for genetic rescue. Conserv. Genet. 2017, 19, 545–554. [Google Scholar] [CrossRef] [Green Version]
  9. Frankham, R.; Ballou, J.D.; Eldridge, M.D.B.; Lacy, R.C.; Ralls, K.; Dudash, M.R.; Fenster, C.B. Predicting the probability of outbreeding depression. Conserv. Biol. 2011, 25, 465–475. [Google Scholar] [CrossRef]
  10. Ralls, K.; Dudash, M.R.; Eldridge, M.D.B.; Fenster, C.B.; Sunnucks, P.; Ballou, J.D.; Lacy, R.; Frankham, R. Call for a paradigm shift in the genetic management of fragmented populations. Conserv. Lett. 2017, 11, e12412. [Google Scholar] [CrossRef]
  11. Pickup, M.; Field, D.L.; Rowell, D.M.; Young, A.G. Source population characteristics affect heterosis following genetic rescue of fragmented plant populations. Proc. R. Soc. B Biol. Sci. 2013, 280, 20122058. [Google Scholar] [CrossRef] [PubMed]
  12. Hoffmann, A.; Sgrò, C.M. Climate change and evolutionary adaptation. Nature 2011, 470, 479–485. [Google Scholar] [CrossRef] [PubMed]
  13. Bell, D.A.; Robinson, Z.L.; Funk, W.C.; Fitzpatrick, S.W.; Allendorf, F.W.; Tallmon, D.A.; Whiteley, A.R. The exciting potential and remaining uncertainties of genetic rescue. Trends Ecol. Evol. 2019, 34, 1070–1079. [Google Scholar] [CrossRef] [PubMed]
  14. Williams, A.V.; Nevill, P.G.; Krauss, S.L. Next generation restoration genetics: Applications and opportunities. Trends Plant Sci. 2014, 19, 529–537. [Google Scholar] [CrossRef] [PubMed]
  15. Carvalho, Y.G.S.; Vitorino, L.C.; De Souza, U.J.B.; Bessa, L.A. Recent trends in research on the genetic diversity of plants: Implications for conservation. Diversity 2019, 11, 62. [Google Scholar] [CrossRef] [Green Version]
  16. Breed, M.F.; Harrison, P.A.; Blyth, C.; Byrne, M.; Gaget, V.; Gellie, N.J.C.; Groom, S.V.; Hodgson, R.; Mills, J.G.; Prowse, T.A.A.; et al. The potential of genomics for restoring ecosystems and biodiversity. Nat. Rev. Genet. 2019, 20, 615–628. [Google Scholar] [CrossRef]
  17. Ottewell, K.; Bickerton, D.C.; Byrne, M.; Lowe, A.J. Bridging the gap: A genetic assessment framework for population-level threatened plant conservation prioritization and decision-making. Divers. Distrib. 2015, 22, 174–188. [Google Scholar] [CrossRef] [Green Version]
  18. Commonwealth of Australia. Threatened Species Strategy—Year One Report; Department of the Environment and Energy: Alice Springs, NT, Australia, 2016.
  19. Jusaitis, M. Translocation trials confirm specific factors affecting the establishment of three endangered plant species. Ecol. Manag. Restor. 2005, 6, 61–67. [Google Scholar] [CrossRef]
  20. Jusaitis, M.; Polomka, L. Weeds and propagule type influence translocation success in the endangered Whibley wattle, Acacia whibleyana (Leguminosae: Mimosoideae). Ecol. Manag. Restor. 2008, 9, 72–76. [Google Scholar] [CrossRef]
  21. Faast, R.; Blyth, C.; Breed, M.F.; Packer, J.G. Acacia Whibleyana: Part 1—Literature Synthesis to Inform Conservation of a Threatend Acacia; Eyre Peninsula Natural Resources Management Board: Port Lincoln, South Australia, 2019.
  22. Adams, M.; Attiwill, P. Role of Acacia spp. in nutrient balance and cycling in regenerating Eucalyptus regnans F. Muell. forests. I. Temporal changes in biomass and nutrient content. Aust. J. Bot. 1984, 32, 205–215. [Google Scholar] [CrossRef]
  23. Jusaitis, M.; Sorensen, B. Conservation Biology of Acacia Whibleyana; Black Hill Flora Centre, Botanic Gardens of Adelaide: Adelaide, Australia, 1998.
  24. Peterson, B.K.; Weber, J.N.; Kay, E.H.; Fisher, H.S.; Hoekstra, H.E. Double digest RADseq: An inexpensive method for de novo SNP discovery and genotyping in model and non-model species. PLoS ONE 2012, 7, e37135. [Google Scholar] [CrossRef] [PubMed] [Green Version]
  25. Catchen, J.M.; Amores, A.; Hohenlohe, P.; Cresko, W.A.; Postlethwait, J.H. Stacks: Building and genotyping loci de novo from short-read sequences. G3 Genes Genomes Genet. 2011, 1, 171–182. [Google Scholar] [CrossRef] [PubMed] [Green Version]
  26. Catchen, J.; Hohenlohe, P.A.; Bassham, S.; Amores, A.; Cresko, W.A. Stacks: An analysis tool set for population genomics. Mol. Ecol. 2013, 22, 3124–3140. [Google Scholar] [CrossRef] [PubMed] [Green Version]
  27. Danecek, P.; Auton, A.; Abecasis, G.; Albers, C.A.; Banks, E.; DePristo, M.A.; Handsaker, R.E.; Lunter, G.; Marth, G.T.; Sherry, S.T.; et al. The variant call format and VCFtools. Bioinformatics 2011, 27, 2156–2158. [Google Scholar] [CrossRef] [PubMed]
  28. Purcell, S.M.; Neale, B.; Todd-Brown, K.; Thomas, L.; Ferreira, M.A.R.; Bender, D.; Maller, J.B.; Sklar, P.; De Bakker, P.I.W.; Daly, M.J.; et al. PLINK: A tool set for whole-genome association and population-based linkage analyses. Am. J. Hum. Genet. 2007, 81, 559–575. [Google Scholar] [CrossRef] [Green Version]
  29. Meirmans, P.G. genodive version 3.0: Easy-to-use software for the analysis of genetic data of diploids and polyploids. Mol. Ecol. Resour. 2020. [Google Scholar] [CrossRef] [Green Version]
  30. Shafer, A.B.A.; Peart, C.R.; Tusso, S.; Maayan, I.; Brelsford, A.; Wheat, C.W.; Wolf, J.B.W. Bioinformatic processing of RAD-seq data dramatically impacts downstream population genetic inference. Methods Ecol. Evol. 2016, 8, 907–917. [Google Scholar] [CrossRef]
  31. Jombart, T.; Devillard, S.; Balloux, F. Discriminant analysis of principal components: A new method for the analysis of genetically structured populations. BMC Genet. 2010, 11, 94. [Google Scholar] [CrossRef] [Green Version]
  32. Alexander, D.H.; Novembre, J.; Lange, K. Fast model-based estimation of ancestry in unrelated individuals. Genome Res. 2009, 19, 1655–1664. [Google Scholar] [CrossRef] [Green Version]
  33. Rosenberg, N.A. Distruct: A program for the graphical display of population structure. Mol. Ecol. Notes 2003, 4, 137–138. [Google Scholar] [CrossRef]
  34. Kopelman, N.M.; Mayzel, J.; Jakobsson, M.; Rosenberg, N.A.; Mayrose, V.B. Clumpak: A program for identifying clustering modes and packaging population structure inferences across K. Mol. Ecol. Resour. 2015, 15, 1179–1191. [Google Scholar] [CrossRef] [PubMed] [Green Version]
  35. Wickham, H. ggplot2. Wiley Interdiscip. Rev. Comput. Stat. 2011, 3, 180–185. [Google Scholar] [CrossRef]
  36. Ottewell, K.; Bickerton, D.; Lowe, A.J. Can a seed bank provide demographic and genetic rescue in a declining population of the endangered shrub Acacia pinguifolia? Conserv. Genet. 2010, 12, 669–678. [Google Scholar] [CrossRef]
  37. Stone, G.N.; Raine, N.E.; Prescott, M.; Willmer, P.G. Pollination ecology of acacias (Fabaceae, Mimosoideae). Aust. Syst. Bot. 2003, 16, 103–118. [Google Scholar] [CrossRef]
  38. Breed, M.F.; Ottewell, K.; Gardner, M.G.; Marklund, M.H.K.; E Dormontt, E.; Lowe, A.J. Mating patterns and pollinator mobility are critical traits in forest fragmentation genetics. Heredity 2013, 115, 108–114. [Google Scholar] [CrossRef] [Green Version]
  39. Jusaitis, M.; Sorensen, B.; Polomka, L. Population structure, flowering and seed production in the endangered whibley wattle, Acacia whibleyana (Leguminosae: Mimosoideae). Open Conserv. Biol. J. 2009, 3, 4–13. [Google Scholar] [CrossRef]
  40. Petit, R.J.; Duminil, J.; Fineschi, S.; Hampe, A.; Salvini, D.; Vendramin, G.G. Comparative organization of chloroplast, mitochondrial and nuclear diversity in plant populations. Mol. Ecol. 2004, 14, 689–701. [Google Scholar] [CrossRef] [Green Version]
  41. Borrell, J.S.; Wang, N.; Nichols, R.A.; Buggs, R. Genetic diversity maintained among fragmented populations of a tree undergoing range contraction. Heredity 2018, 121, 304–318. [Google Scholar] [CrossRef] [Green Version]
  42. De Kort, H.; Vandepitte, K.; Bruun, H.H.; Closset-Kopp, D.; Honnay, O.; Mergeay, J. Landscape genomics and a common garden trial reveal adaptive differentiation to temperature across Europe in the tree speciesAlnus glutinosa. Mol. Ecol. 2014, 23, 4709–4721. [Google Scholar] [CrossRef]
  43. Johnson, J.; Gaddis, K.D.; Cairns, D.M.; Konganti, K.; Krutovsky, K.V. Landscape genomic insights into the historic migration of mountain hemlock in response to Holocene climate change. Am. J. Bot. 2017, 104, 439–450. [Google Scholar] [CrossRef] [Green Version]
  44. Pais, A.; Whetten, R.W.; Xiang, Q. (Jenny) Ecological genomics of local adaptation in Cornus florida L. by genotyping by sequencing. Ecol. Evol. 2016, 7, 441–465. [Google Scholar] [CrossRef] [PubMed]
  45. He, T.; D’Agui, H.; Lim, S.L.; Enright, N.J.; Luo, Y. Evolutionary potential and adaptation of Banksia attenuata (Proteaceae) to climate and fire regime in southwestern Australia, a global biodiversity hotspot. Sci. Rep. 2016, 6, 26315. [Google Scholar] [CrossRef] [PubMed] [Green Version]
  46. Kenrick, J.; Knox, R.B. Quantitative analysis of self-incompatibility in trees of seven species of Acacia. J. Hered. 1989, 80, 240–245. [Google Scholar] [CrossRef]
  47. Kenrick, J.; Kaul, V.; Williams, E.G. Self-incompatibility in Acacia retinodes: Site of pollen-tube arrest is the nucellus. Planta 1986, 169, 245–250. [Google Scholar] [CrossRef] [PubMed]
  48. Millar, M.A.; Byrne, M.; Nuberg, I.; Sedgley, M. High outcrossing and random pollen dispersal in a planted stand of Acacia saligna subsp. saligna revealed by paternity analysis using microsatellites. Tree Genet. Genomes 2007, 4, 367–377. [Google Scholar] [CrossRef]
  49. Lesica, P.; Allendorf, F.W. When are peripheral populations valuable for conservation? Conserv. Biol. 1995, 9, 753–760. [Google Scholar] [CrossRef]
  50. Coates, D.J.; Tischler, G.; McComb, J.A. Genetic variation and the mating system in the rare Acacia sciophanes compared with its common sister species Acacia anfractuosa (Mimosaceae). Conserv. Genet. 2006, 7, 931–944. [Google Scholar] [CrossRef]
  51. Nano, C.; Nano, T.; Gibson, J.; Pavey, C. Recovery Action Implementation for Threatened Arid Acacias: Distribution, Monitoring and Indigenous Ecological Knowledge of A. Peuce, A. Undoolyana, A. Pickardii and A. Latzii; Department of Natural Resources, Environment, Arts & Sport Northern Territory Government: Alice Springs, Australia, 2008.
Figure 1. Map of collection stands. The Southerns and Marshalls Rd locations had collections of more than one status (i.e., a combination of remnant, revegetated and/or seedling plants). The figure was generated using Quantum Geographic Information System (Quantum GIS Development Team, 2016, Open source geospatial foundation project, http://qgis.osgeo.org). Map layer was downloaded from https://www.diva-gis.org/Data.
Diversity 12 00299 g001
Figure 2. (A) The Bayesian Information Criterion (BIC) values for each number of clusters, with the lowest BIC indicating support for 3 or 4 clusters plus the ADMIXTURE cross-validation error (cv error) results. The cv errors are plotted for K = 1–10, with the lowest cv error indicating greatest support at K = 7. (B) Principal Component Analysis showing population genetic structure across all samples. Colours represent stands and solid line ellipses identify the genetic clusters (1–4) identified in the Discriminant Analysis of Principal Components (DAPC) analysis for K = 4. Circle with the dashed line highlights the seedlings that grouped with a different genetic cluster (cluster 4) to the Marshalls Rd mature plans and non-admixed seedlings (cluster 1). (C) Bar plots represent individual genetic cluster assignment from ADMIXTURE results from K = 3 to K = 5 (* note-beyond K = 5 the ADMIXTURE results appeared noisy but see Figure A1 for full output).
Diversity 12 00299 g002
Table 1. Pairwise genetic differentiation (measured by FST) between stands (values vary from 0-1 and values of 0 indicate no evidence of differentiation).
Collection StandMarshalls RdMarshalls Rd SeedlingsQuarrySoutherns RemnantSoutherns reveg.Mt LiverpoolFoothillsSebs PatchSalt Lake remnantSalt Lake reveg.Moonlight Bay
Marshalls Rd0
Marshalls Rd seedlings−0.0080
Quarry0.0170.0320
Southerns remnant0.0900.1010.0870
Southerns reveg.0.1010.1140.1010.0130
Mt Liverpool0.1560.1580.1530.1220.1450
Foothills0.1920.1930.1890.1470.1760.1850
Sebs Patch0.1090.1170.1110.0830.0900.1040.1340
Salt Lake remnant0.0880.0990.0970.0730.0770.1000.1290.0370
Salt Lake reveg.0.1150.1230.1260.0970.1040.1220.1480.0610.0000
Moonlight Bay0.1360.1450.1370.1110.1160.1350.1610.0840.0750.0970
Table 2. Nested analysis of molecular variance (AMOVA) including standard deviations (SD; obtained through jackknifing over loci) and 95% confidence intervals (c.i. 95%; obtained through bootstrapping over loci) of F statistics.
Source of VariationNested in%varF-ValueSDc.i.95%
Within Individual-73.60.2630.002±0.004
Among IndividualCollection stand 15.70.1750.002±0.004
Among Population 10.70.1070.001±0.002
Table 3. Stand status, sample size after filtering (n), census population size, location, observed (HO) and expected (HE) heterozygosity (both vary from 0 to 1, with 0 indicating no diversity), inbreeding coefficient (F) (varies from 0 to 1 and values of 0 indicate no evidence of inbreeding), and kinship (varies between 0 and 1, where 0 indicates no recent co-ancestry and 1 indicates samples are genetically identical). Includes a focused analysis for both the admixed and non-admixed Marshalls Rd seedlings.
Collection StandStatusnHOHEFKinship
All stands
Marshalls RdTranslocation120.114 (0.111 to 0.116) b,c0.137 (0.135 to 0.140) c,d0.173 (0.163 to 0.182) b−0.008 (0.018 to −0.027) a,b
Marshalls Rd seedlings (all)Seedlings440.107 (0.105 to 0.109) a,b0.131 (0.128 to 0.133) b0.183 (0.176 to 0.189) b0.001 (0.003 to −0.002) a
QuarryRemnant150.111 (0.109 to 0.114) b0.136 (0.134 to 0.139) c,d0.183 (0.174 to 0.192) b0.004 (0.011 to −0.003) a
Southerns remnantRemnant390.118 (0.116 to 0.121) c0.145 (0.142 to 0.147) d0.183 (0.177 to 0.189) b0.000 (0.003 to −0.003) a
Southerns reveg.Revegetation50.118 (0.115 to 0.121) c0.140 (0.137 to 0.143) c,d0.157 (0.143 to 0.170) b0.006 (0.043 to −0.031) a,b
Mt LiverpoolRemnant140.109 (0.107 to 0.112) b0.123 (0.120 to 0.126) a0.110 (0.100 to 0.121) a0.009 (0.026 to −0.007) a
FoothillsRemnant130.102 (0.099 to 0.105) a0.117 (0.114 to 0.120) a0.130 (0.119 to 0.141) a0.008 (0.023 to −0.006) a
Sebs PatchRemnant240.109 (0.107 to 0.111) b0.138 (0.136 to 0.141) c,d0.211 (0.204 to 0.218) c0.001 (0.006 to −0.003) a
Salt Lake remnantRemnant140.110 (0.108 to 0.112) b0.141 (0.139 to 0.144) d0.221 (0.212 to 0.229) c−0.011 (−0.008 to −0.014) b
Salt Lake reveg.Revegetation250.117 (0.115 to 0.120) b,c0.138 (0.136 to 0.141) c,d0.151 (0.144 to 0.159) b0.001 (0.009 to −0.006) a
Moonlight BayRemnant230.104 (0.102 to 0.106) a0.135 (0.132 to 0.137) b,c0.226 (0.219 to 0.234) c−0.004 (0.000 to −0.008) a,b
Marshalls Rd focus
Marshalls Rd adultsTranslocation120.114 (0.111 to 0.116) b0.137 (0.135 to 0.140) b0.173 (0.163 to 0.182) b−0.008 (0.018 to −0.027) a
Marshalls Rd seedlings (non-admixed only)Seedlings340.103 (0.101 to 0.106) a0.126 (0.124 to 0.129) a0.181 (0.173 to 0.188) b0.008 (0.010 to −0.002) a
Marshalls Rd seedlings (admixed only)Seedlings100.120 (0.117 to 0.123) c0.125 (0.122 to 0.127) a0.036 (0.023 to 0.049) a0.117 (0.122 to −0.005) a
95% confidence intervals in parentheses and homogeneous subgroups indicated by a, b, c, and d.

