Article

Sedimentary Organic Matter, Prokaryotes, and Meiofauna across a River-Lagoon-Sea Gradient

1
Dipartimento di Scienze della Vita e dell’Ambiente, Università Politecnica delle Marche, Via Brecce Bianche, 60131 Ancona, Italy
2
Dipartimento di Scienze Chimiche, della Vita e della Sostenibilità Ambientale, Università degli studi di Parma, Parco Area delle Scienze 11/A, 43124 Parma, Italy
3
Stazione Zoologica Anton Dorhn, Villa Comunale, 80121 Napoli, Italy
4
Dipartimento di Scienze della Vita e dell’Ambiente, Università degli Studi di Cagliari, Via Fiorelli 1, 09126 Cagliari, Italy
*
Author to whom correspondence should be addressed.
Diversity 2020, 12(5), 189; https://doi.org/10.3390/d12050189
Submission received: 16 April 2020 / Revised: 6 May 2020 / Accepted: 6 May 2020 / Published: 12 May 2020
(This article belongs to the Special Issue Meiofauna Biodiversity and Ecology)

Abstract

:
In benthic ecosystems, organic matter (OM), prokaryotes, and meiofauna represent a functional bottleneck in the energy transfer towards higher trophic levels and all respond to a variety of natural and anthropogenic disturbances. The relationships between OM and the different components of benthic communities are influenced by multiple environmental variables, which can vary across different habitats. However, analyses of these relationships have mostly been conducted by considering the different habitats separately, even though freshwater, transitional, and marine ecosystems, physically linked to each other, are not worlds apart. Here, we investigated the quantity and nutritional quality of sedimentary OM, along with the prokaryotic and meiofauna abundance, biomass, and biodiversity, in two sampling periods, corresponding to high vs. low freshwater inputs to the sea, along a river-to-sea transect. The highest values of sedimentary organic loads and their nutritional quality, prokaryotic and meiofaunal abundance, and biomass were consistently observed in lagoon systems. Differences in the prokaryotic Operational Taxonomic Units (OTUs) and meiofaunal taxonomic composition, rather than changes in the richness of taxa, were observed among the three habitats and, in each habitat, between sampling periods. Such differences were driven by either physical or trophic variables, though with differences between seasons. Overall, our results indicate that the apparent positive relationship between sedimentary OM, prokaryote and meiofaunal abundance, and biomass across the river-lagoon-sea transect under scrutiny is more the result of a pattern of specifically adapted prokaryotic and meiofaunal communities to different habitats, rather than an actually positive ‘response’ to OM enrichment. We conclude that the synoptic analysis of prokaryotes and meiofauna can provide useful information on the relative effect of organic enrichment and environmental settings across gradients of environmental continuums, including rivers, lagoons, and marine coastal ecosystems.

1. Introduction

Pathways and rates of sedimentary organic matter (OM) transfer to higher trophic levels in aquatic ecosystems depend on the OM quantity and nutritional quality [1,2]. In turn, both the quantity and nutritional quality of sedimentary OM depend on its origin (i.e., autotrophic, heterotrophic, and/or detrital), biochemical composition and bioavailability (i.e., refractory vs. labile fraction), and degradation rates [3]. Therefore, the benthic trophic status of an aquatic ecosystem is not only related to the availability of inorganic nutrients, which fuels in situ primary production, but also depends upon the supply rates of OM, including allochthonous and detrital (i.e., not living) sources [3,4,5,6]. This, in turn, can influence other ecosystem functions, including nutrient cycling and oxygen availability [3,7]. For instance, the accumulation of huge amounts of detrital OM in marine coastal sediments, triggering increased benthic O2 consumption and possibly inducing hypoxic and anoxic conditions, can be associated with a preferential accumulation of semi-labile compounds (e.g., the biopolymeric fraction of organic carbon (OC) [8]), particularly enriched in nitrogenous (protein-like) compounds [9]. In such conditions, the decoupling between the production/inputs of OM loads, heterotrophic consumption, and accumulation in sediments can determine strong modifications in the structure and functioning of benthic ecosystems [9,10,11,12,13].
The comprehension of the biogeochemical dynamics in aquatic environments characterized by variable biodiversity levels (e.g., transitional, estuaries, and coastal environments) is strongly limited by the complex and multiple interactions among different biotic components, including microbial and meio- and macrofaunal assemblages [14,15]. In this regard, it is noticeable that changes in the benthic trophic status and OM degradation rates mediated by microbes, through the so-called microbial loop, can be mirrored in changes in the composition and structure of the benthic communities, and vice-versa [16,17].
In benthic ecosystems, OM, prokaryotes, and meiofauna, being trophic resources for higher trophic levels and, at the same time, being responsible, with different roles, for OM cycling, represent a key functional bottleneck in the energy transfer towards a higher trophic level [18]. They also detectably and rapidly respond to a variety of natural and anthropogenic disturbances. Heterotrophic prokaryotes are responsible for detrital OM degradation and transformation and rapidly respond to variations in the quantity and composition of the available OM [19,20]. Meiofauna, due to their strong sensitivity to disturbances, high abundance, lack of pelagic larval dispersion, and short life cycles, rapidly respond to environmental changes in both marine [21,22] and freshwater ecosystems [23].
The relationships between OM and the different components of benthic communities are also influenced by multiple, often interacting, environmental variables, for example, currents and the substrate composition, which, in turn, enhance the levels and variance of natural disturbance, as well as habitat-specific conditions. Analyses of these relationships have mostly been conducted by considering the different benthic components separately. Moreover, freshwater, transitional, and marine coastal ecosystems, though physically linked to each other, have most often been considered as worlds apart, and such a reductive approach especially applies to the analysis of benthic ecosystems.
Here, to provide insights on this topic, we test the null hypothesis that OM quantity, biochemical composition and degradation rates, prokaryotic and meiofaunal biodiversity, and ecosystem functioning do not vary among different ecosystems along a strong salinity gradient in different periods of the year. To test this hypothesis, we investigated the OM quantity, nutritional quality, and degradation rates, along with the prokaryotic and meiofauna biodiversity, in two sampling periods (corresponding to high vs. low freshwater inputs to the sea) along a river-to-sea gradient, comprising Po River (Italy), the North Adriatic Sea, and the associated lagoonal system. The sampling strategy included stations located in the major tributaries of the Po River, in the Po main axis, in a coastal lagoon (Sacca di Goro Lagoon) intercepting Po River outflow, and in the coastal sediments of the North Adriatic Sea facing the lagoon and the Po River delta.

2. Materials and Methods
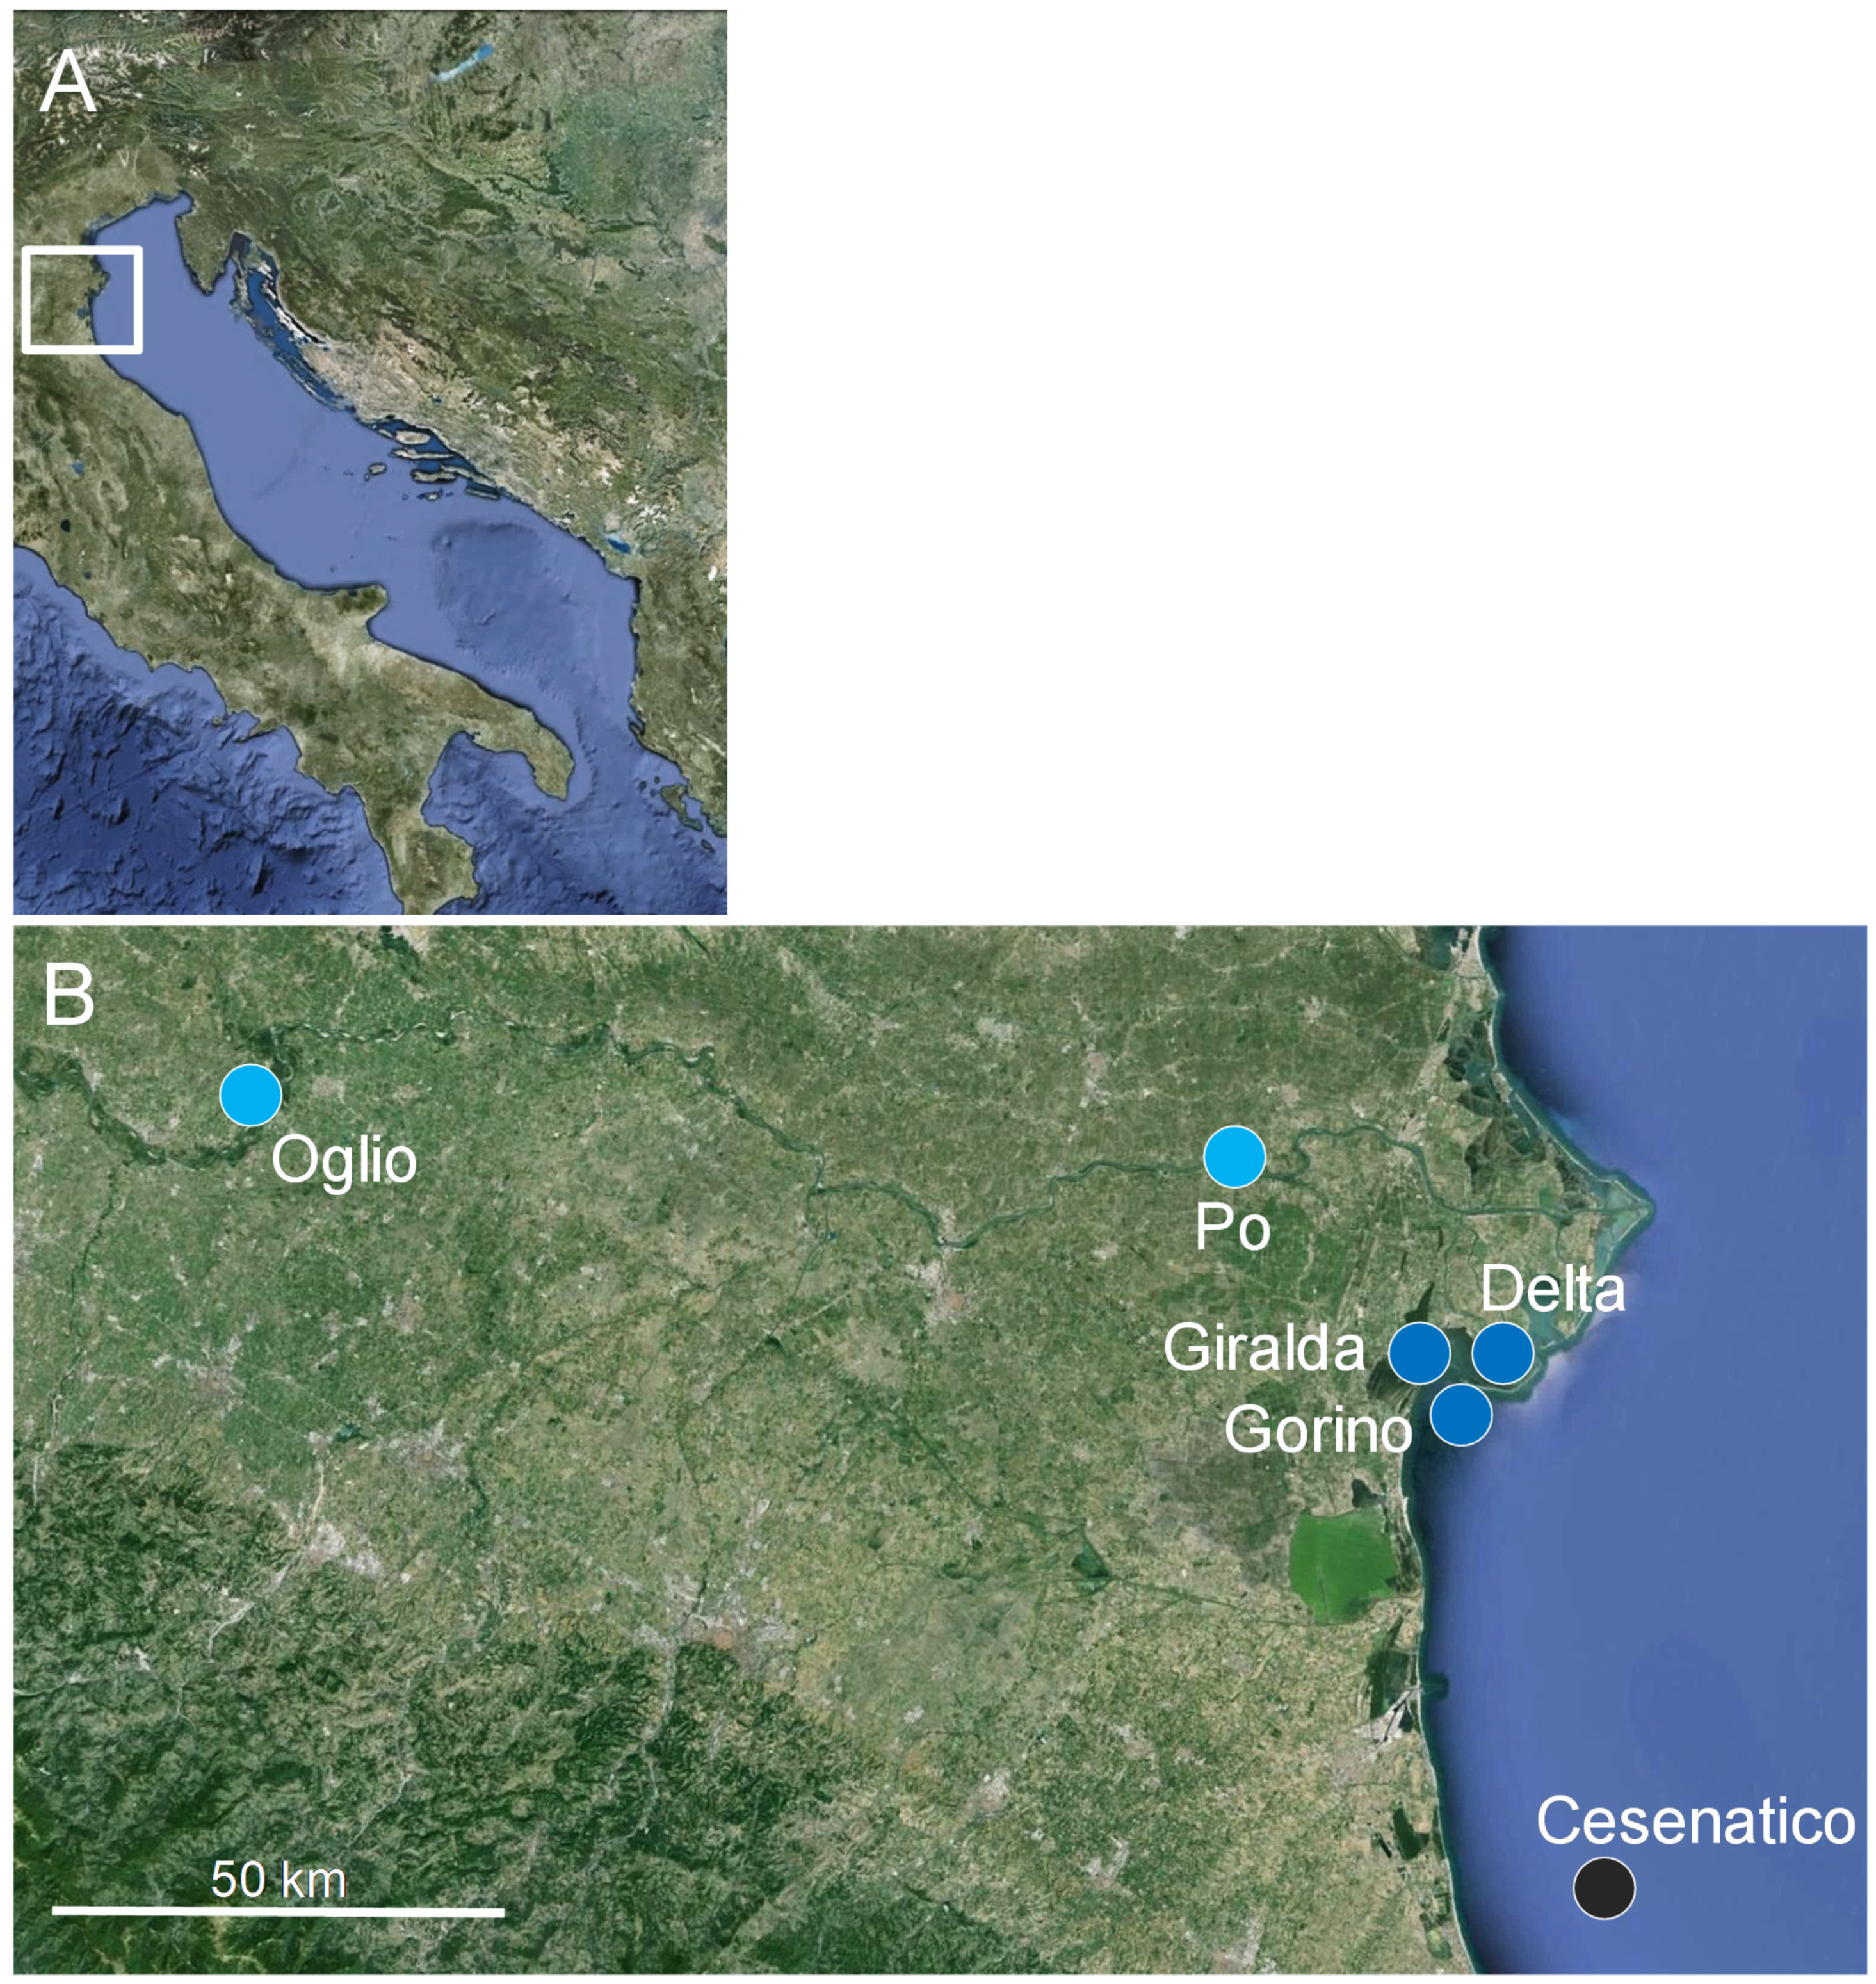
2.1. Study Area

The Po River is the most important Italian river, with a drainage basin of 71,000 km2, 44% of which is devoted to agricultural activities, and more than 15 million people. The mean flow discharge is characterized by two major flooding periods, due to snowmelt in the spring and rainfall in the autumn [24]. The Po River outflow of water and sediments is mostly constrained along the western coast of the Adriatic Sea, driven southward by the general circulation of the basin [25,26].
The Sacca di Goro Lagoon is a shallow (average depth 1.5 m) water embayment (27 km2) of the Po River Delta facing the northern Adriatic Sea from the Italian counterpart (Figure 1). This lagoon is characterized by strong daily variations of salinity and nutrient concentrations due to a microtidal regime (with a maximum amplitude < 1.0 m) and freshwater inputs from the Po River, and saline water input from the adjacent northern Adriatic Sea. The Sacca di Goro Lagoon, being one of the most economically relevant clam farming sites in Europe, whilst at the same time being threatened by dystrophic events [27,28,29], has largely been investigated in terms of the biogeochemistry [15,30,31], ecophysiology of blooming macroalgae [32], meio- and macrofauna communities [33,34,35], and ecosystem functions [36,37].
Due to the large inputs from the Po river (which alone accounts for ca. 50% of the terrigenous flux into the whole basin), the sediments of the north western Adriatic are characterized by a strong accumulation of organic loads [9,38,39,40,41,42], which have, for years, triggered hypoxic crises [43,44,45]. Indeed, the NW Adriatic Sea, which is the most productive basin of the entire Mediterranean Sea, has experienced huge and long-lasting anthropogenic environmental alterations in the last 50 years. Such changes have led to severe consequences for the whole ecosystem functioning, which have ultimately manifested as red tides, mucilage formation, and strong eutrophication along the entire Italian coastline of the basin [46,47].

2.2. Sampling

The sampling stations were located as follows: “Oglio” in the Oglio River (left tributary of the Po River), “Po” (within the Po River, just before the beginning of the Po-di-Goro River, which is part of the Po delta and flows into the Sacca di Goro Lagoon), “Gorino” (at the end of the Po-di-Goro river), “Giralda” (inside the Sacca di Goro Lagoon), “Delta” (located at the mouth of the Sacca di Goro Lagoon), and “Cesenatico” (located south of the lagoon, in the marine coastal environment) (Figure 1). The sampling was carried out in two different seasons: summer (September 2011) and winter (February 2012), identified as representative of periods of low (late summer) vs. high (winter) river outflow, respectively.
The bottom temperature and salinity were measured in situ by means of a multiparametric probe. Sediment samples were collected (three independent replicates per station and sampling period, for both OM and meiofauna) using plexiglass corers operated manually, kept at in situ temperature after being brought to the laboratory (within 4 h), and then immediately frozen once in the laboratory and kept at −20 °C until analysis (within 2 weeks). Only sediment aliquots for the measurement of OM degradation rates were immediately treated, as described below.

2.3. Sedimentary Organic Matter Quantity, Nutritional Quality, and Degradation Rates

Once in the laboratory, the top centimeter from each sediment core was used for analyses of the OM biochemical composition, in terms of the total phytopigment, protein, carbohydrate, and lipid contents. Chlorophyll-a and phaeopigments were analysed fluorometrically [48]. Total phytopigment concentrations were defined as the sum of chlorophyll-a and phaeopigment concentrations and utilized as an estimate of the organic material of algal origin [12]. Sediment phytopigment concentrations were converted into C equivalents using 40 µg C µg phytopigment−1 as a conversion factor [3]. Protein, carbohydrate, and lipid analyses were carried out spectrophotometrically [49]. For the analysis of each biochemical class of organic compound, blanks were made with the same sediment samples previously treated in a muffle furnace (450 °C, 2 h). Protein, carbohydrate, and lipid concentrations were converted into C equivalents using the conversion factors 0.49, 0.40, and 0.75 mg C mg−1, respectively, and their sum is referred to as the biopolymeric C (BPC) [50].
The fraction of biopolymeric C represented by relatively fresh algal material was assessed as the percentage contribution of phytopigment C to biopolymeric C contents and referred to as the algal fraction of biopolymeric C [3]. The algal and protein fractions of biopolymeric C and the values of the protein to carbohydrate ratio were also used as descriptors of OM nutritional quality (algal and protein fractions) and ageing (protein to carbohydrate ratio) [50,51].
OM degradation rates were estimated from aminopeptidase and beta-glucosidase activities determined by the cleavage of fluorogenic substrates (L-leucine-4-methylcoumarinyl- 7-amide, Leu-; 4-methylumbelliferone-β-D-glucopyranoside, respectively) at saturating concentrations. Briefly, 2.5 mL of sediment subsamples was incubated at in situ temperature in the dark for 2 h with 2.5 mL of filtered, sterile water containing 200 µM L-leucine-4-methylcumarinyl-7-amide and 50 µM 4-methylumbelliferyl β-D-glucopyranoside, respectively, separately for aminopeptidase and β-glucosidase determinations. After incubation, the sediment slurries were centrifuged and the supernatants were analysed fluorometrically [49]. Protease and glucosidase activities (µmol of substrate g−1 h−1) were converted into C equivalents using 72 as a conversion factor [13], and their sum is reported as the C degradation rate (µgC g−1 h−1).

2.4. Prokaryotic Abundance, Biomass, and Diversity

The prokaryotic abundance and biomass were determined as described by Danovaro (2009) [49]. Briefly, prokaryotic cells were extracted from the sediments according to standard procedures, stained with SYBR Green I, and counted by epifluorescence microscopy. For determination of the prokaryotic biomass, the cell biovolume was converted into the carbon content assuming 310 fg C µm−3 as a conversion factor [49]. The prokaryotic abundance and biomass were normalized to the sediment dry weight after desiccation (60 °C, 24 h).
The prokaryotic diversity was assessed according to Danovaro (2009) [49]. DNA was extracted from sediment with the UltraClean soil DNA isolation kit (MoBio Laboratories Inc., Carlsbad, CA USA). In all samples, extracted DNA was determined spectrofluorimetrically using SYBR Green I (Molecular Probes) and quantified vs. standard solutions of genomic DNA from Escherichia coli. The extracted DNA was amplified using universal bacterial primers 16S-1392F and 23S-125R, and the latter was fluorescently labeled with the fluorochrome HEX (MWGspa Biotech). PCRs were performed in 50-µL volumes in a thermal cycler (Biometra, Germany) using 30 PCR cycles. PCR products were checked on agarose–Tris-borate-EDTA (TBE) gels (1%). Four different reactions were run for each sample and then combined to form two duplicate PCRs, which were subsequently utilized for Automated Ribosomal Intergenic Spacer Analysis (ARISA). The quality of amplified fragments was checked, and the PCR products were purified and quantified spectrofluorimetrically. For each ARISA, about 5 ng of amplicons was mixed with 14 µL of internal size standard (GS2500-ROX; Applied Biosystems, Foster City, CA, USA) and the automated detection of ARISA fragments was carried out using the ABI Prism 3100 Genetic Analyzer (Applied Biosystems). ARISA fragments in the range of 390 to 1400 bp were determined using GeneScan analytical software version 2.02 (Applied Biosystems). Despite the fact that the DNA fingerprinting approach utilized in the present manuscript does not provide specific taxonomic information for the identified Operational Taxonomic Units (OTUs), it is still a largely utilized approach when assessing the patterns of prokaryotic diversity in environmental samples [52,53,54,55].

2.5. Meiofauna

Once in the laboratory, sediment samples for meiofaunal analyses were sliced into five sediment layers (i.e., 0–1, 1–3, 3–5, 5–10, and 10–15 cm), fixed with 4% buffered formalin, and stained with Rose Bengal (0.5 g L−1) until analysis. Sediments were sieved through a 500-µm mesh, and a 20-µm mesh was used to retain the smallest organisms. The fraction remaining on the latter sieve was re-suspended and centrifuged three times with Ludox HS40 [21,49] (diluted with water to a final density of 1.18 g cm−3). All animals remaining in the surnatant were again passed through a 20-µm mesh net, washed with tap water and, after staining with Rose Bengal, sorted under a stereomicroscope [49] (×40 magnification).
The meiofaunal biomass was assessed by bio-volumetric measurements for all specimens encountered. The nematode biomass was calculated from the biovolume, using the formula reported in Andrassy (1956) [56]: V = L × W2 × 0.063 × 10−5 (in which body length, L, and width, W, are expressed in mm). The body volumes of all other taxa were derived from measurements of body length (L, in mm) and width (W, in mm), using the formula V = L × W2 × C, where C is the approximate conversion factor for each meiofaunal taxon [57]. Each body volume was multiplied by an average density (1.13 g cm−3) to obtain the biomass (mg DW: mg WW = 0.25) and the carbon content was considered to be 40% of the dry weight [58]. The biomass was expressed as µgC 10 cm−2.

2.6. Statistical Analyses

For all of the investigated variables, differences among sampling stations and sampling periods were assessed using distance-based permutational nonparametric analyses of variance (PERMANOVA) in a univariate context [59]. When significant differences were observed, pairwise tests were also carried out to ascertain patterns of differences among stations and/or sampling times. The sampling design included two fixed orthogonal factors: Station (n = 6: Oglio, Po, Gorino, Giralda, Delta, and Cesenatico) and season (n = 2: summer and winter). Although time is typically a continuous source of variation, in this study, we considered the two sampling periods as levels of a fixed factor, assuming that they represented contrasting periods of the Po River discharge regime.
The same experimental design was used to test variations in i) the biochemical composition (in terms of protein, carbohydrate, lipid, and phytopigment contents) and nutritional quality (in terms of the protein to carbohydrate ratio, protein, and chlorophyll-a contributions to biopolymeric C) of sedimentary organic matter, and ii) the composition of OTUs and meiofaunal assemblages (based on abundance data only), again using PERMANOVA, in a multivariate context. The PERMANOVA analyses were based on matrixes of the Euclidean distance after normalization of the data (OM) and Bray Curtis similarity matrixes after square root transformations (prokaryotes and meiofauna) [60].
To visualize differences among stations and seasons in the biochemical composition, the nutritional quality of sedimentary organic matter, and the composition of OTUs and meiofaunal assemblages, bi-plots after a canonical analysis of the principal coordinates (CAP) were also produced [61]. Additionally, a Similarity percentage (SIMPER) analysis was carried out to assess the percentage dissimilarity in the meiofaunal taxonomic composition among systems and seasons. All statistical analyses were performed with the software PRIMER 6+ [62].
To assess whether the sedimentary organic matter content or nutritional quality explained significant differences in the prokaryotic and meiofaunal community composition, non-parametric multivariate multiple regression analyses, based on Euclidean distances, were also carried out using the DISTLM forward routine [60]. The forward selection of predictor variables was carried out with tests by permutation. P values were obtained using 9999 permutations of raw data for the marginal tests (tests of individual variables), whereas, for all of the conditional tests, the routine used 9999 permutations of residuals under a reduced model. Linear regressions were carried out using the Excel software.

3. Results

3.1. Environmental Parameters

The water temperature and salinity measured during the study period are reported in Table 1A. In summer, the temperature ranged from 17 to 25 °C, with the lowest values at sea (Cesenatico) and highest at the river (Oglio) sampling station, respectively. In winter, the temperature ranged from 8 to 13 °C, with the lowest values at the river and lagoon stations (Oglio, Gorino, and Giralda) and highest at the lagoon mouth station (Delta), respectively. In both summer and winter, the salinity ranged from 0 to 35, at the sampling stations located within the rivers (i.e., Oglio and Po) and at sea (Cesenatico), respectively.

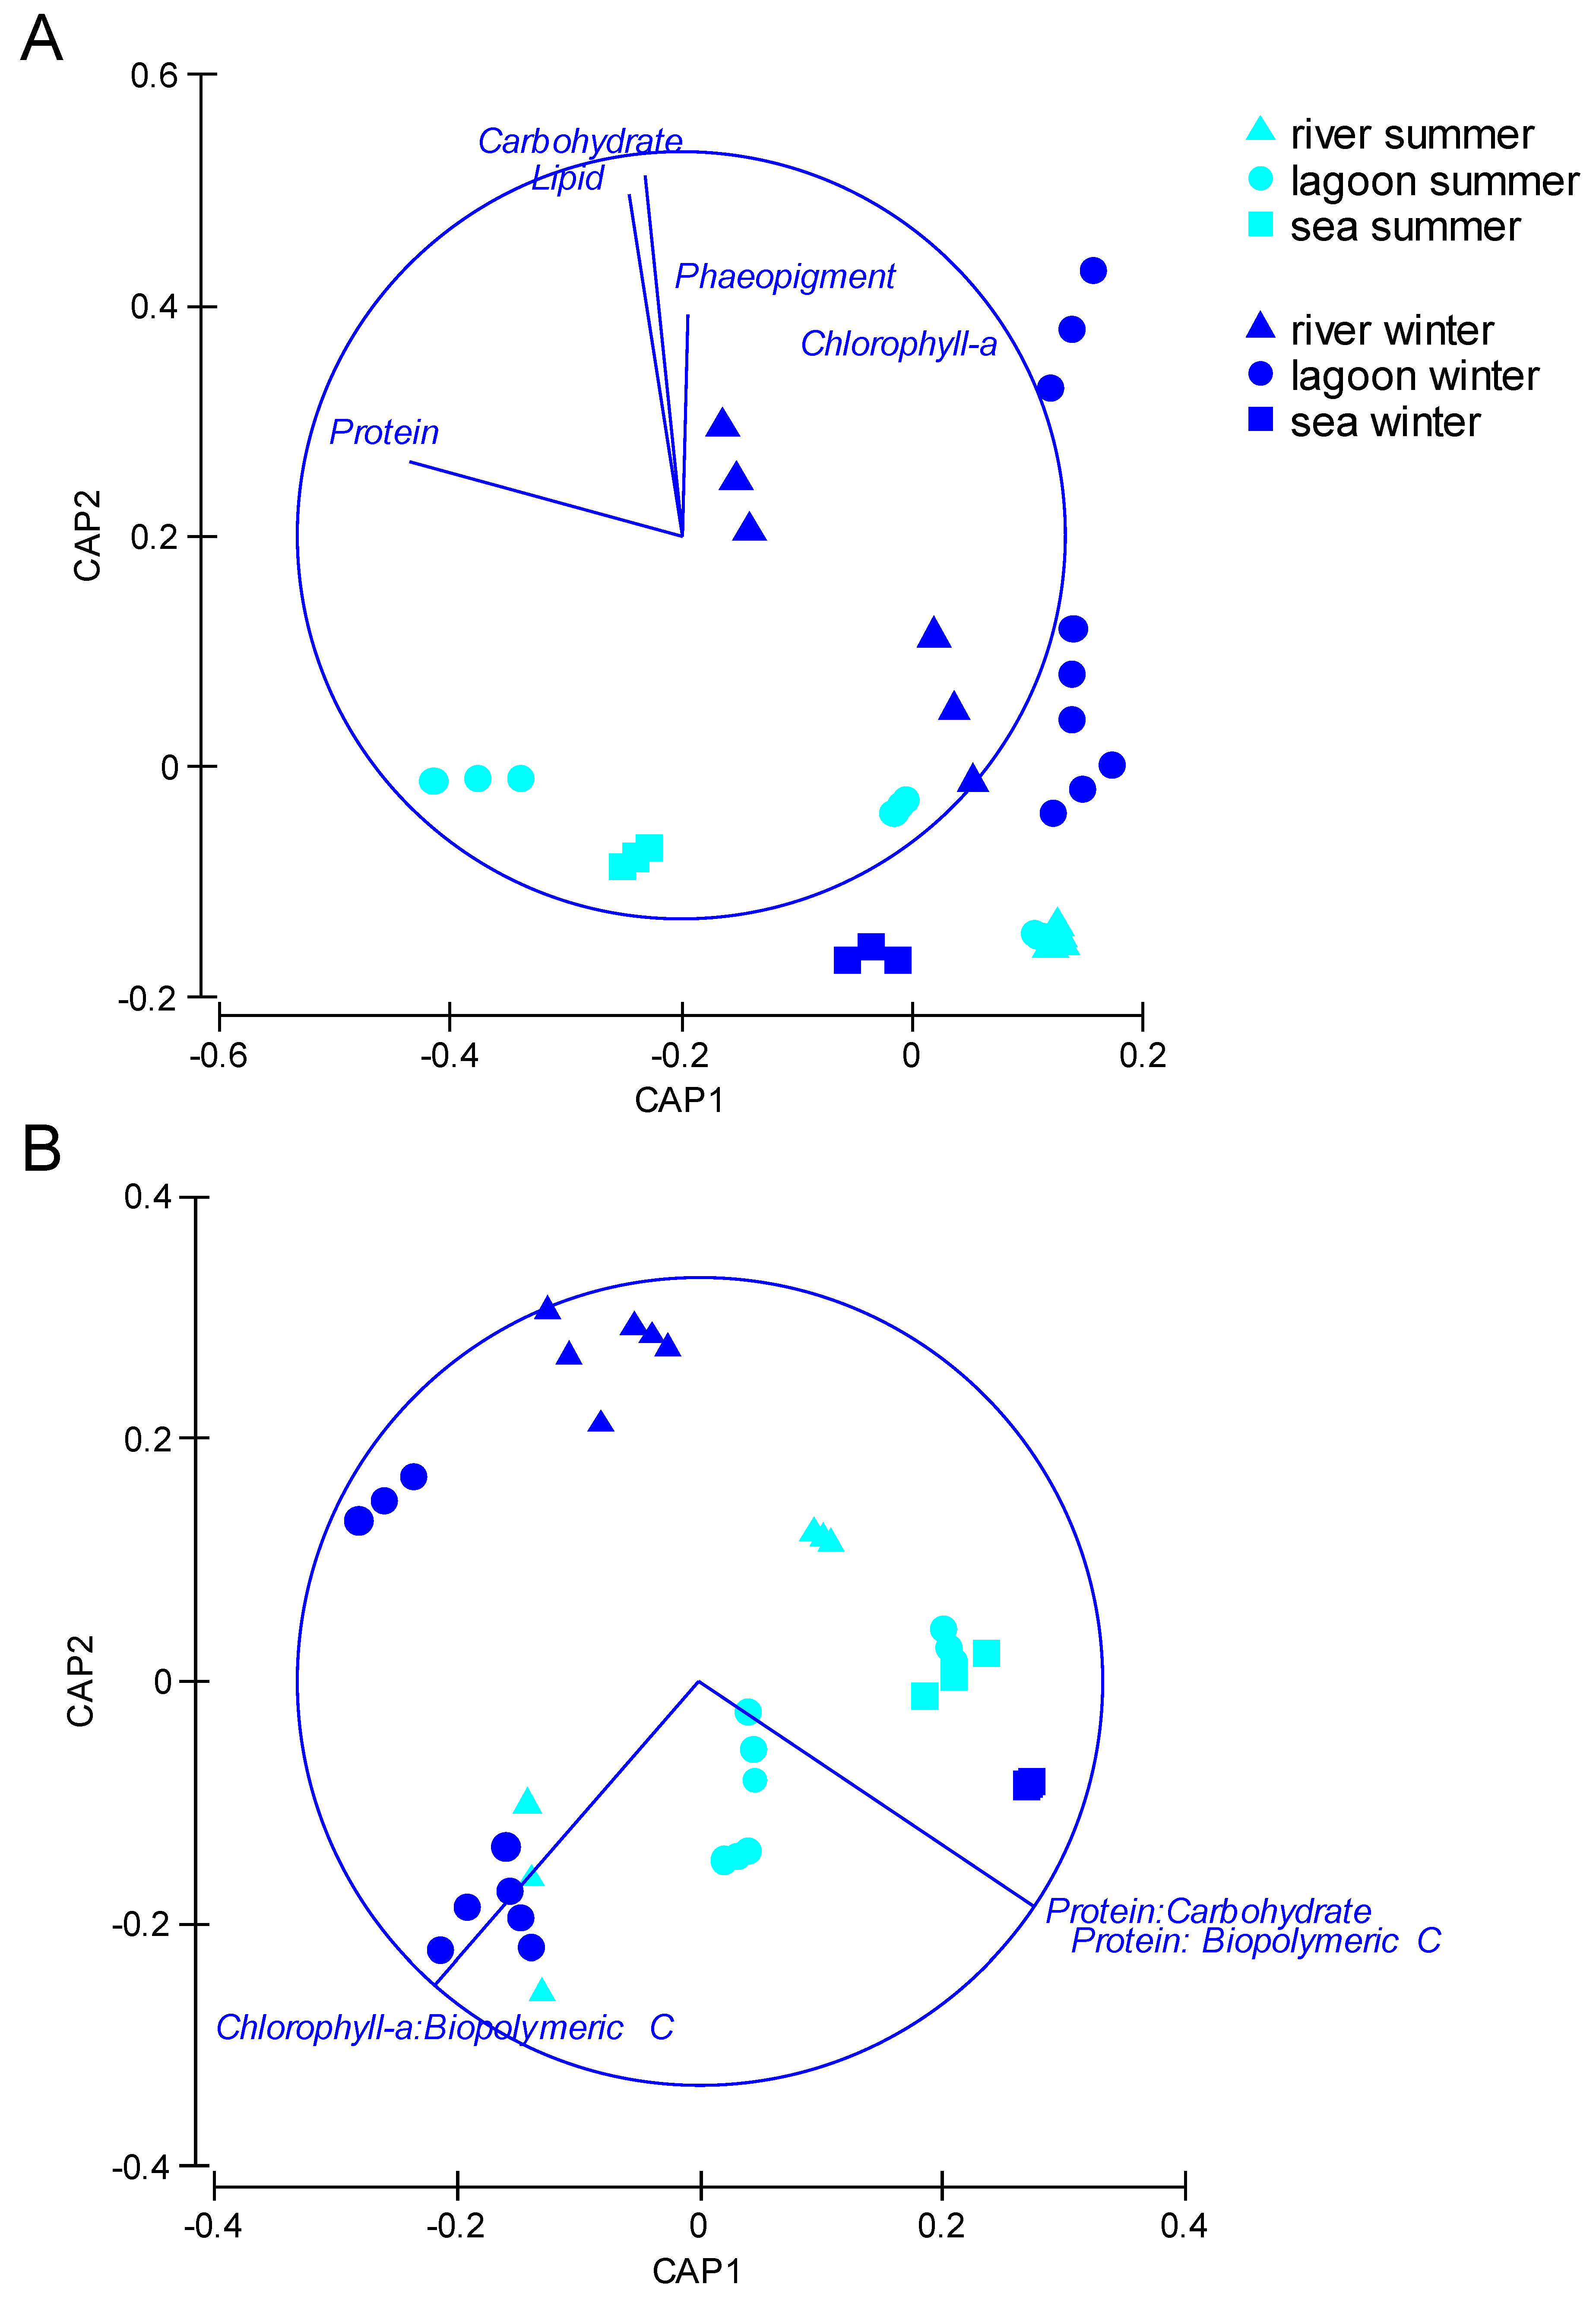
3.2. Content, Biochemical Composition, Nutritional Quality, and Degradation Rates of Organic Matter

The chlorophyll-a, phaeopigment, total phytopigment, protein, carbohydrate, lipid, and biopolymeric C contents; algal and protein contributions to biopolymeric C; values of the protein to carbohydrate ratio; and OM degradation rates are reported in Table 1A,B.
The results of one-way PERMANOVA tests reveal a significant effect of the factor Station × Season for organic matter contents (Table S1A). In both seasons, the contents of almost all investigated variables, with only a few exceptions, were significantly the highest at the lagoon stations (Giralda and Gorino). At each station, almost all variables displayed contents in winter that were significantly higher than those in summer, with the exception for those at sea (Cesenatico), where the highest values occurred in summer.
The results of the multivariate PERMANOVA test also show a significant effect of the factor Station × Season on the OM biochemical composition, with significant differences among sampling stations in both seasons and between seasons at each station (Figure 2A).
The results of univariate PERMANOVA tests on the nutritional quality and ageing of OM are reported in Table S1B. The factor Station × Season had a significant effect on all descriptors of OM nutritional quality, with values varying significantly among stations in both seasons and between seasons at almost all stations. Specifically, in summer, the algal fraction of biopolymeric C was the highest at the Po River station and lowest at the Oglio River, lagoon (Goro), and sea (Cesenatico) stations; in winter, values at the lagoon stations Delta and Giralda were higher than those in all other stations, whereas the lowest values occurred at the Po River station. The algal fraction of biopolymeric C was only higher in summer than in winter at the Po River station.
In both seasons, the protein fraction of biopolymeric C and the values of the protein to carbohydrate ratio were highest at sea (Cesenatico) and higher in summer than in winter at all sampling stations, except for the marine station (Cesenatico). Overall, the nutritional quality of OM varied significantly among all sampling stations in each season and between seasons at each sampling station (Figure 2B).
The results of one-way PERMANOVA and the consequent pair wise tests carried out on enzymatic activities are reported in Table S1C. In both seasons, the aminopeptidase activity was highest at the lagoon stations Giralda and Gorino, and significantly higher in summer than in winter at the Po River and Cesenatico (sea) stations. The β-glucosidase activity was highest at the lagoon station Giralda in summer and at the lagoon Delta and Po and Oglio River stations in winter. Values of the β-glucosidase activity were higher in winter than in summer at Oglio and Po River stations and at the lagoon Delta station, whereas at sea (Cesenatico), the highest values occurred in summer. In both seasons, the alkaline-phosphatase activity was highest at the lagoon Giralda station. Moreover, it was higher in summer than in winter at Po, Giralda, and Cesenatico stations, with the opposite pattern at Oglio and Delta stations.

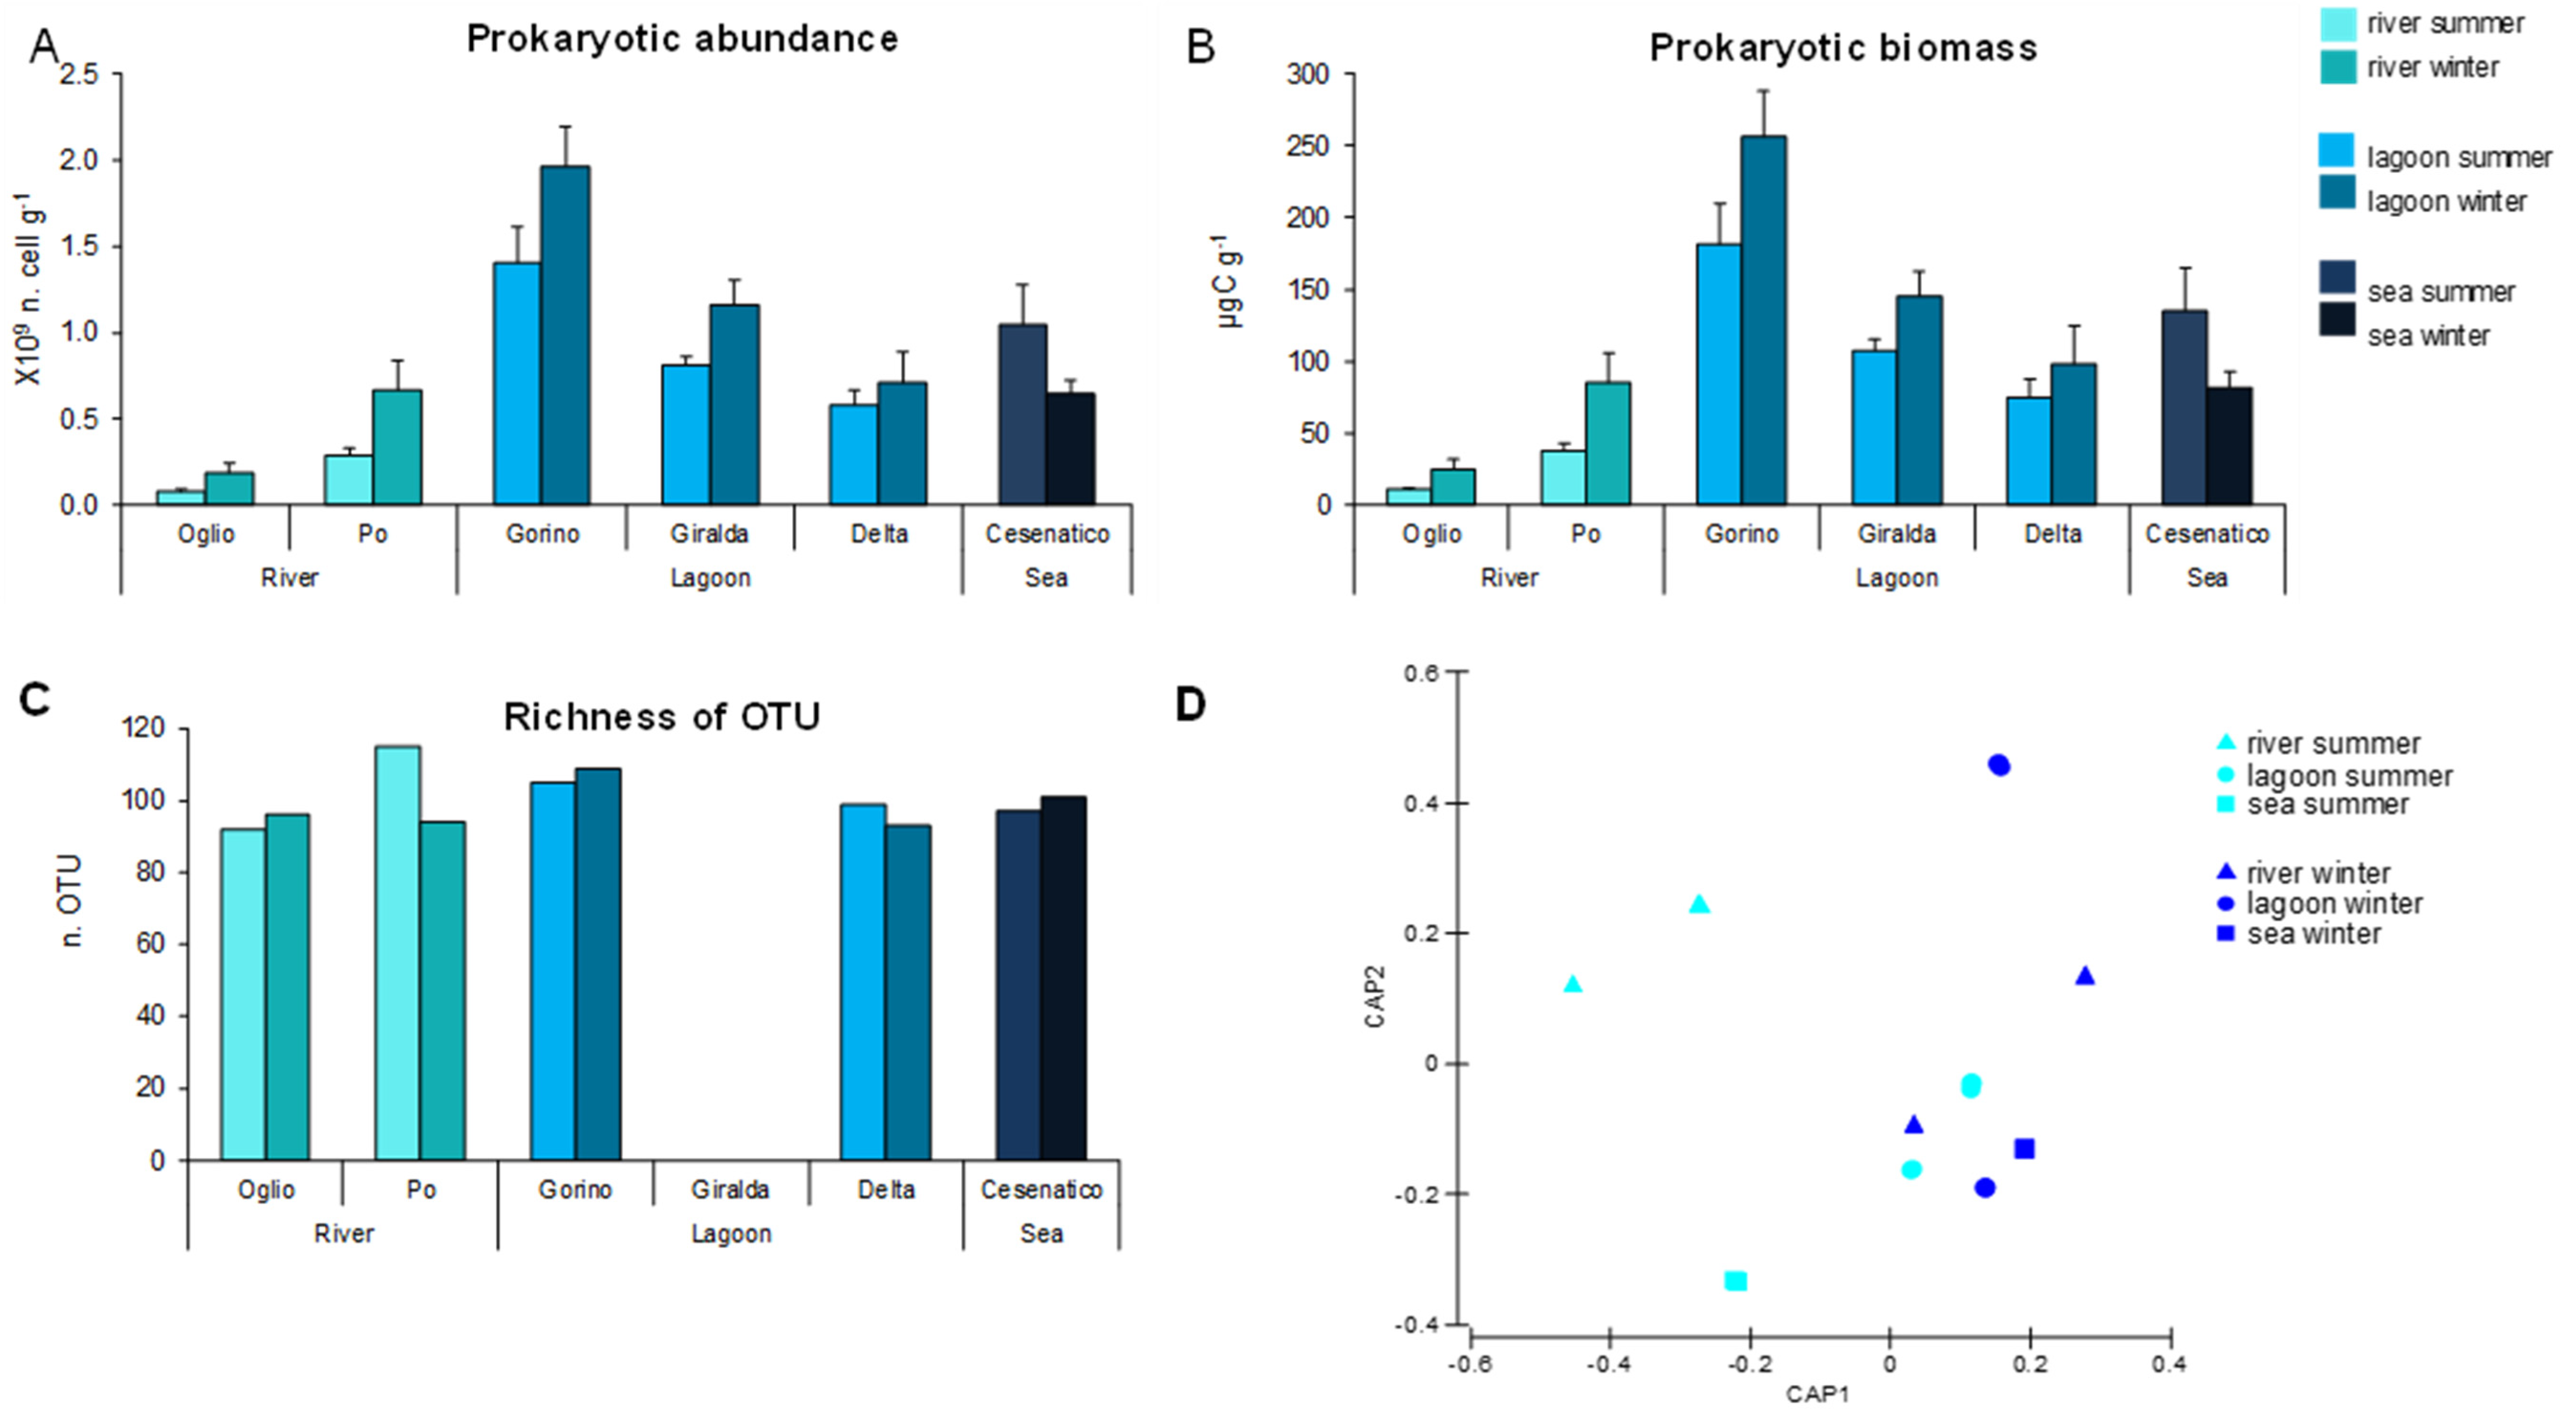
3.3. Prokaryotic Abundance, Biomass, and Diversity

The prokaryotic abundance, biomass, richness of OTU, and OTU composition are illustrated in Figure 3A–D. The results of PERMANOVA tests reveal a significant effect of the interaction Station × Season on the prokaryotic abundance, biomass, and OTU composition (Table S2A). Both in summer and winter, the prokaryotic abundance and biomass were the highest at the lagoon (Gorino and Giralda) and sea (Cesenatico) stations. At all stations, with exceptions for the Delta and sea stations, the prokaryotic abundance and biomass were higher in winter than in summer. The richness of prokaryotic OTU was highest at the Po River station in summer and at the Gorino Lagoon station in winter. At all stations, except for the Oglio and Po River and lagoon Delta stations, the richness of prokaryotic OTU was higher in winter than in summer (Figure 3C). The bi-plot produced after the CAP confirms the presence of strong spatial and temporal variations in the OTU composition of prokaryotic assemblages (Figure 3D).

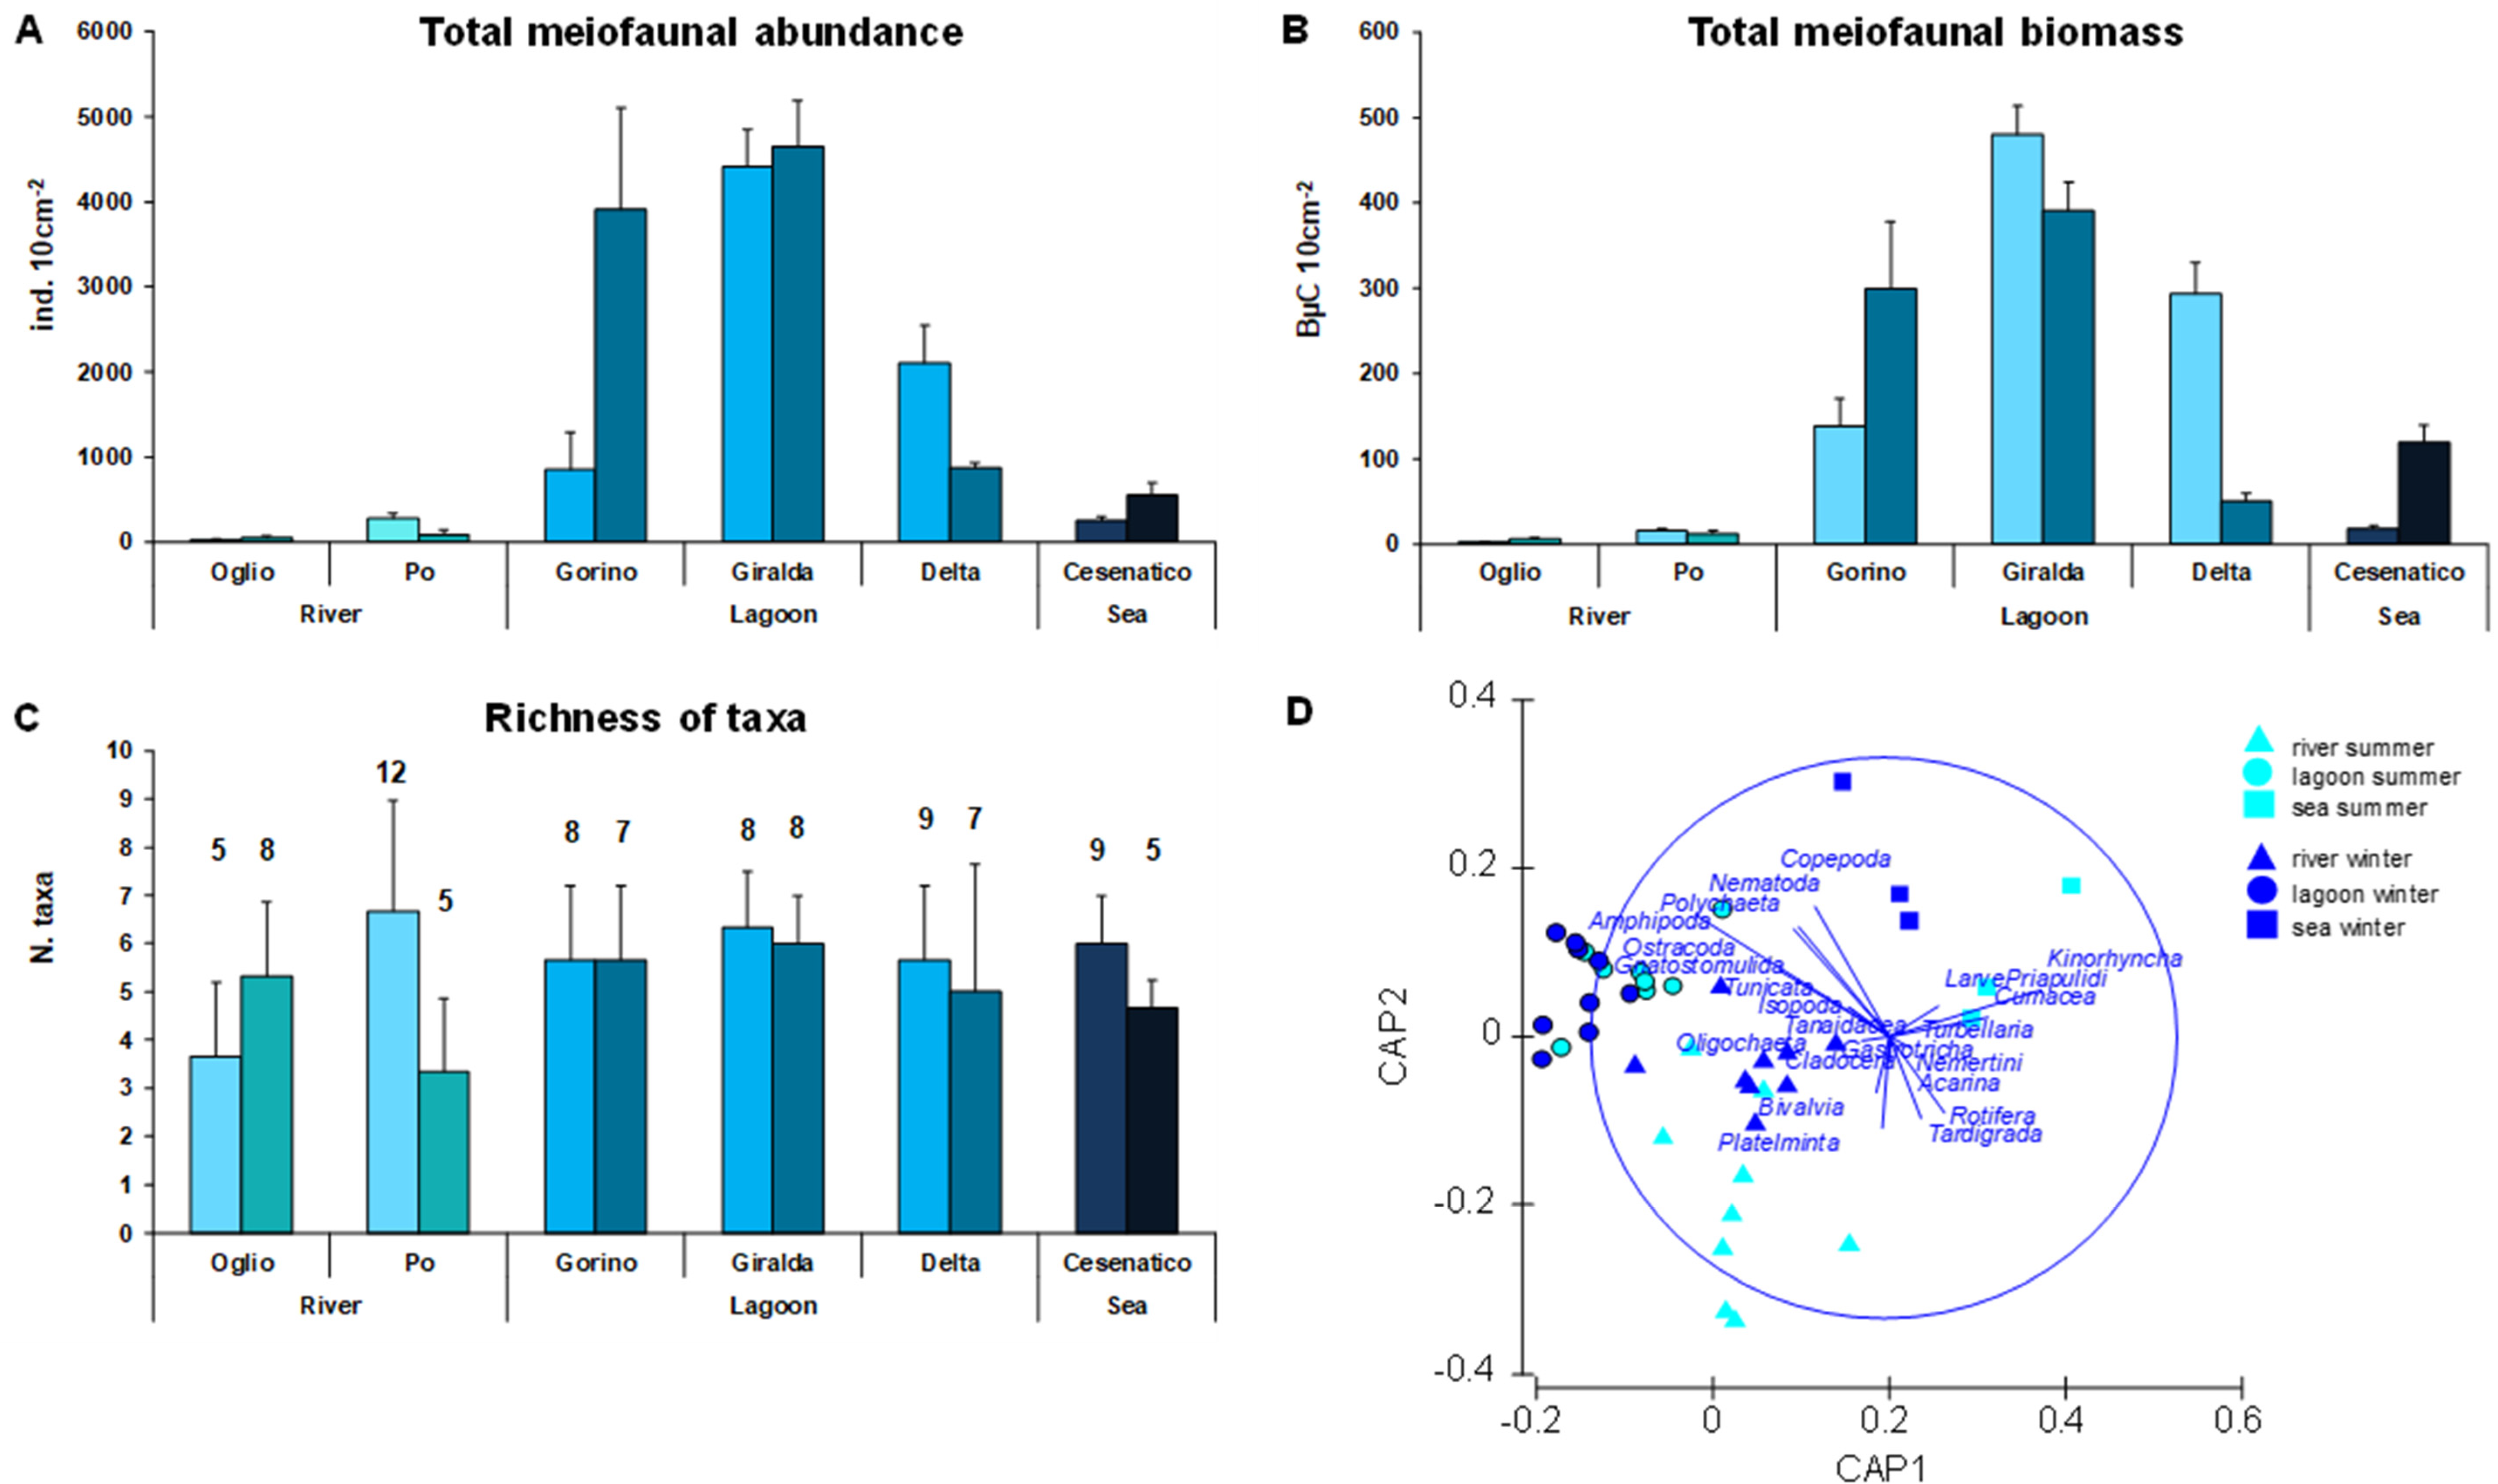
3.4. Meiofaunal Abundance, Richness of Taxa, and Community Structure

The meiofaunal abundance, biomass, richness of taxa, and taxonomic composition are reported in Figure 4A–D. The results of two-way PERMANOVA tests reveal a significant effect of the interaction Station × Season on the meiofaunal abundance, biomass, and taxonomic composition (Table S2B). The results of the pair wise tests (Table S2B) reveal that both the meiofaunal abundance and biomass varied significantly among stations in both seasons and between seasons at almost all sampling stations. Specifically, the highest meiofaunal abundance and biomass occurred at lagoon stations in both seasons (Giralda in summer and Gorino and Giralda in winter). At the Po River and Delta lagoon stations, the meiofaunal abundance was higher in summer than in winter, whereas at the Gorino Lagoon (Gorino) and marine (Cesenatico) stations, values were the highest in winter. At the Delta lagoon station, the meiofaunal biomass was higher in summer than in winter, whereas at sea (Cesenatico), the highest values occurred in winter.
The richness of meiofaunal taxa did not display significant differences among sampling stations, or between seasons (Table S2B). At all stations and in both seasons, the meiofaunal community was dominated by nematodes (51–98%), followed by copepods (1–22%). “Other” taxa included Bivalvia, Kinorhyncha, Cumacea, Isopoda, Nemertea, Platelminta, Tunicata, and Gnatostomulida, each accounting for <1% of the total meiofaunal abundance.
The results of the multivariate PERMANOVA tests reveal a significant effect of the factors Station and Station × Season on the meiofaunal taxonomic composition (Table S2B). Specifically, the results of the pair wise tests show that the meiofaunal taxonomic composition varied significantly among sampling stations in both seasons and between seasons at four of six sampling stations (Po, Gorino, Delta, and Cesenatico). The bi-plot produced after the CAP analysis confirms the presence of strong spatial and temporal variations in the meiofaunal taxonomic composition (Figure 4D).
SIMPER analysis (Table 2) revealed that the % dissimilarity among different systems was 50–76% in summer and 64–80% in winter, and that the observed % was mainly due to the higher contribution of nematodes in the lagoon community structure and to the absence/reduction of the other taxa, in both seasons.
The % dissimilarity between summer and winter was lowest at sea (31%) and highest in river (38%) systems, and such differences were driven by different sets of taxa, depending on the system.

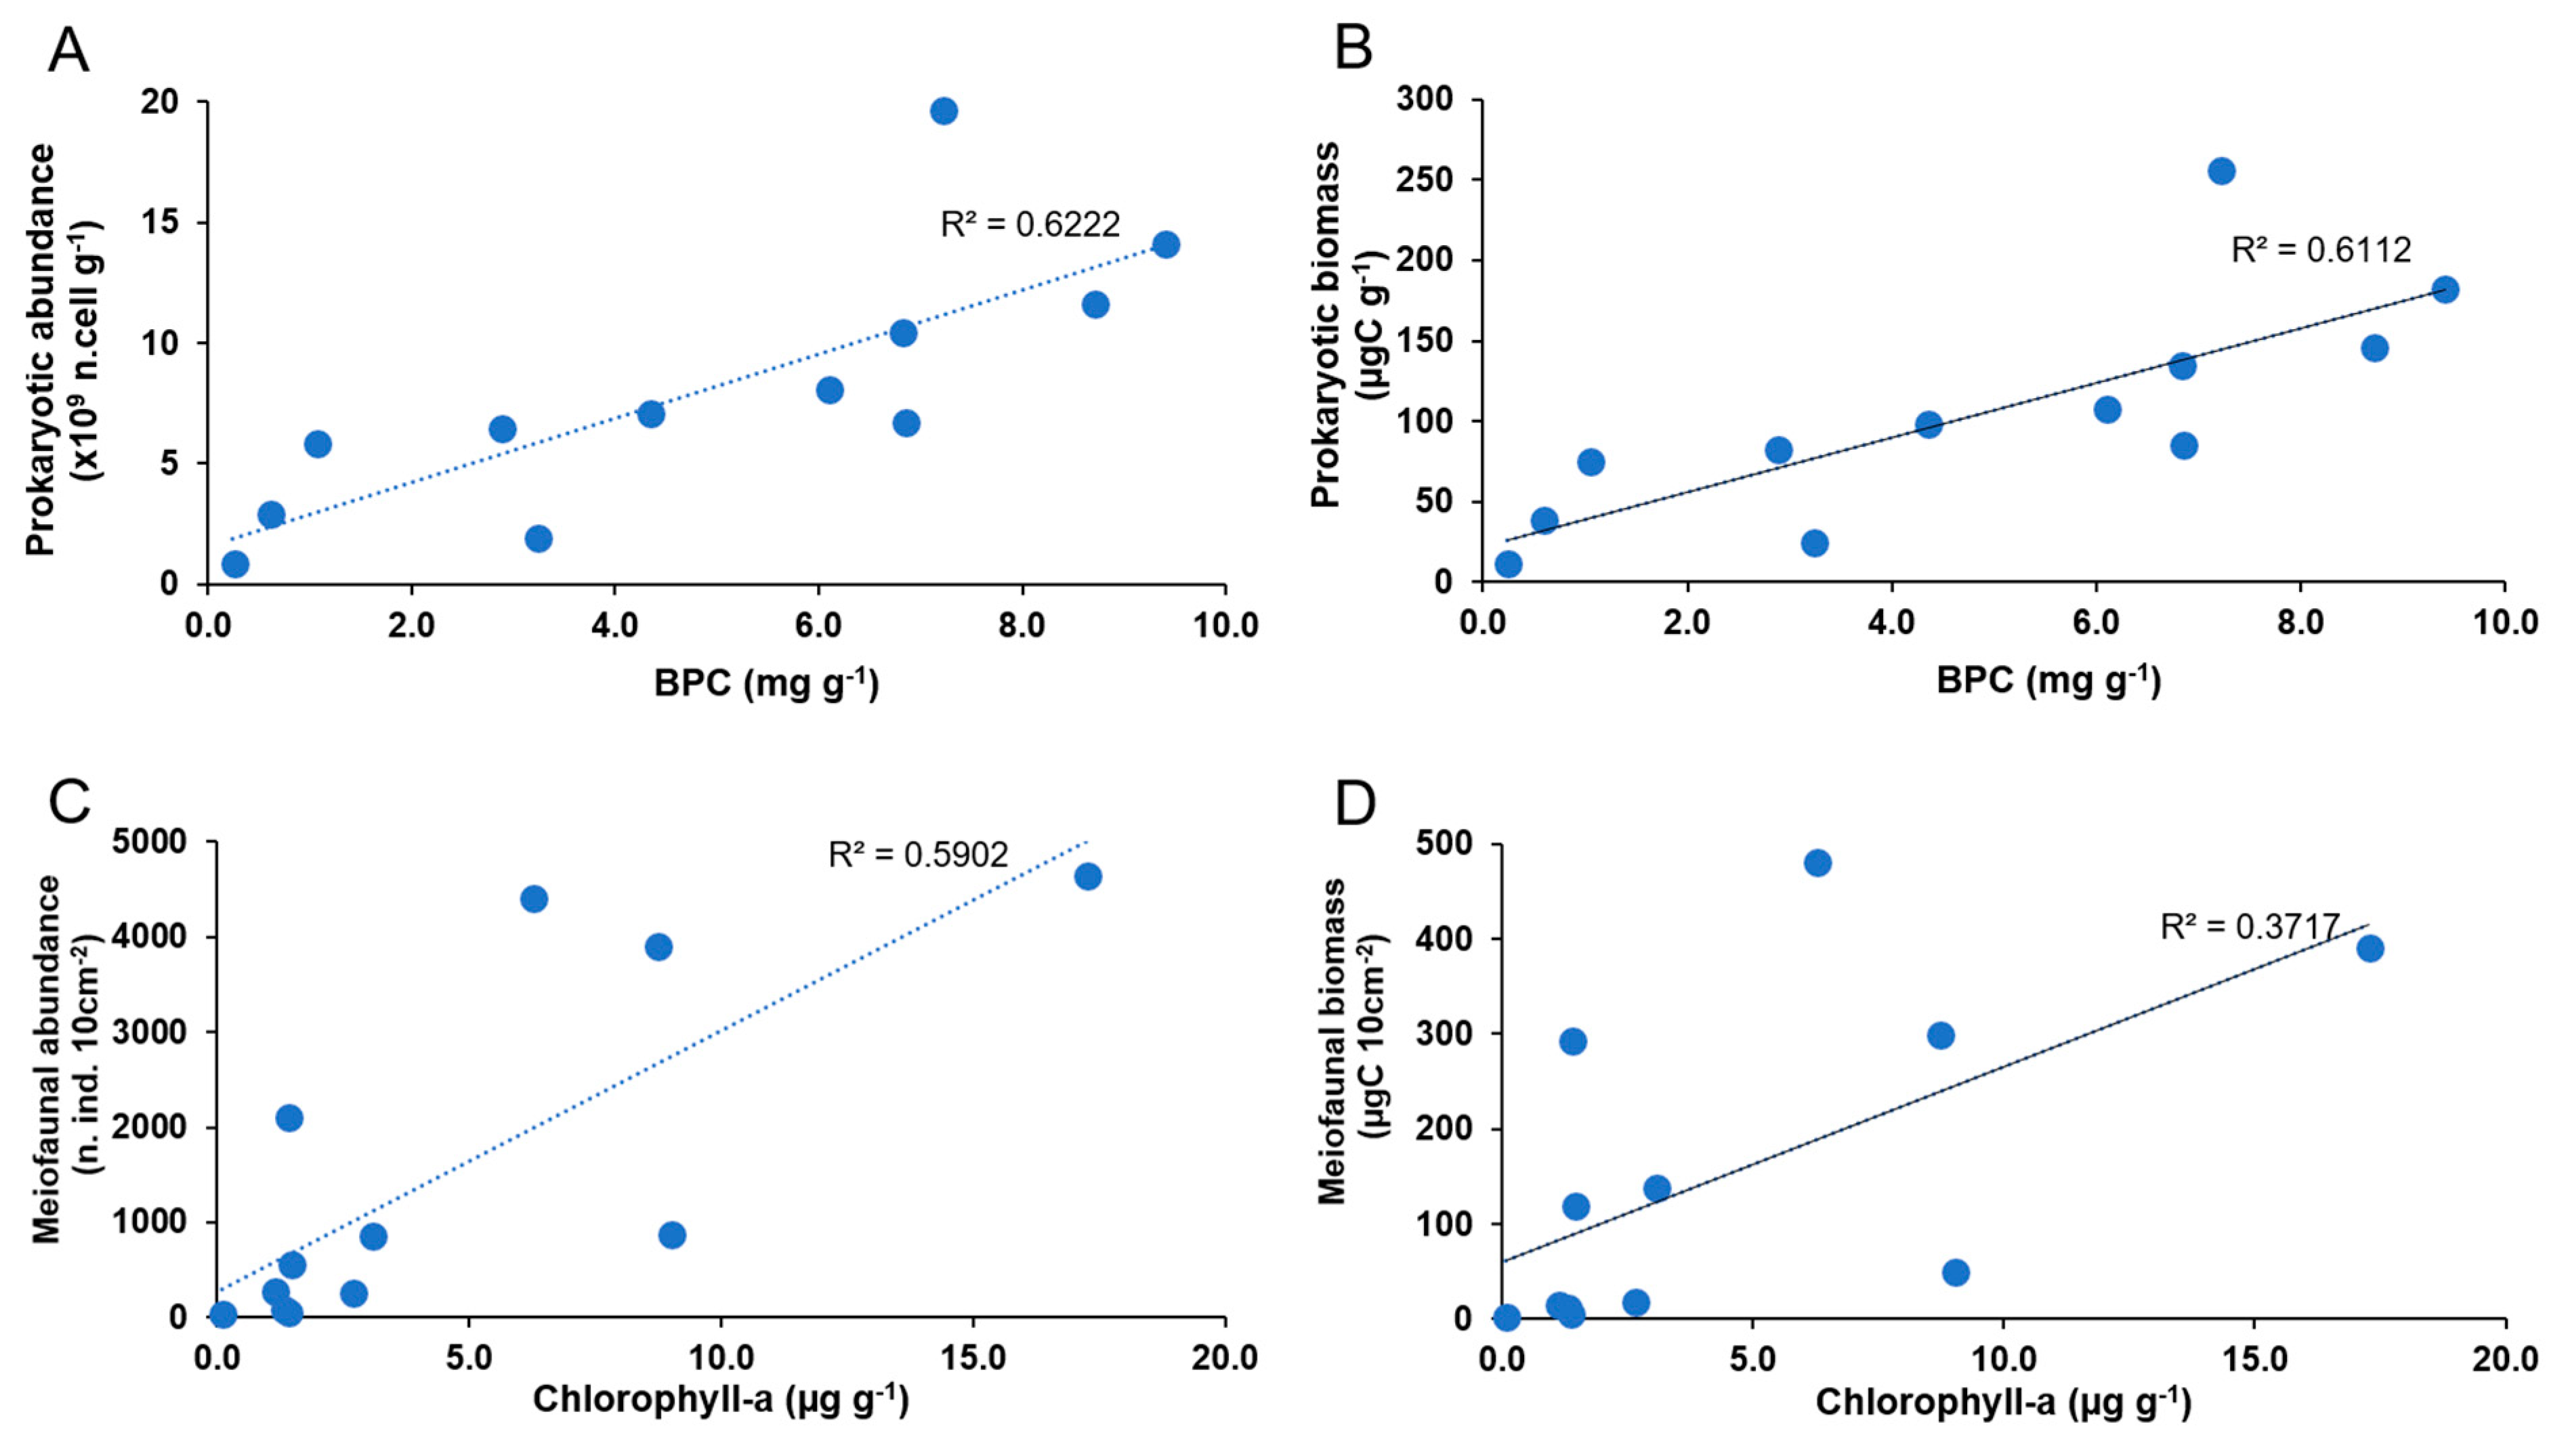
3.5. Relationships between Prokaryotes, Meiofauna, Organic Matter, and Environmental Characteristics

The results of the linear regression analyses indicate a significant and positive relationship between the BPC sedimentary contents and prokaryotic abundance (p < 0.05, R2 0.622; Figure 5A) and biomass (p < 0.01, R2 0.611; Figure 5B), as well as between the chlorophyll-a sedimentary contents and meiofaunal abundance (p < 0.05, R2 0.590; Figure 5C) and biomass (p < 0.05, R2 0.372; Figure 5D).
The results of the multivariate multiple regression analysis (DISTLM forward; Table 3), conducted on the composition of prokaryotic OTUs and meiofaunal assemblages, reveal that, when pooling together all data irrespective of season and station, the sub-set of variables that explained significant variations in the prokaryotic OTU composition explained a total of ca. 85% of variance and included all of the considered variables, with the exception of the protein to carbohydrate ratio.
The multivariate multiple regression analysis also reveals that, when pooling together all data irrespective of season and station, a total of 75% of variation in the meiofaunal community composition is significantly explained by the phaeopigment, salinity, chlorophyll-a to biopolymeric C, protein, carbohydrate, protein to carbohydrate ratio, chlorophyll-a, and temperature.
The DISTLM forward analysis carried out separately for the two seasons revealed that two different sub-sets of variables significantly explained the observed variations (ca. 91% and 90% in summer and winter, respectively). In summer, the most important variables explaining the observed variations in the meiofaunal taxonomic composition were chlorophyll-a and temperature, whereas in winter, they were phaeopigment and salinity.

4. Discussion

The rapid increase of human activities has substantially altered the biogeochemical cycles of carbon, nitrogen, and phosphorous, thus becoming, in the last decades, a major issue for most of the freshwater and coastal marine ecosystems worldwide [63,64].
For many years, the North Adriatic Sea has been the most productive region of the whole Mediterranean Sea, with high marine production at all trophic levels, from phytoplankton to fish. Nevertheless, during the last decades, this basin has experienced severe eutrophication, beside hypoxic/anoxic crises and mucilage spreads [47,65]. These events have caused the mass mortality of pelagic and benthic organisms, as well as a deep degradation of the benthic compartment [66]. In the last two decades, the combination of reduced nutrient loads (due to recent regulations limiting detergent use and to a continuously diminished runoff due to climate change [67]) has caused an overall trend of oligotrophication in the basin [68], although some authors recently highlighted that the continental loads of nutrients are still high [63,69].
According to previous studies [3,70], the sedimentary trophic status can be assessed through rankings based on the quantity, biochemical composition, and nutritional quality of organic matter, and their combinations. Such studies have proposed a marine benthic trophic status classification based on the sedimentary contents of protein, carbohydrate, and biopolymeric C and the algal fraction of biopolymeric C [3,70]. In this study, applying the classifications proposed above, all of the investigated sediments can be ranked as meso-eutrophic. Specifically, we observed that, during our study, either the marine or lagoon sediments can be ranked only partially as eutrophic. Our results, when compared with early studies carried out in the same area [3,9,16,33,38,71], pinpoint the decrease of the benthic trophic status, and confirm the “regime shift” of the Adriatic Sea towards progressively more oligotrophic conditions [68,72,73,74].
Extending the classification proposed by Dell’Anno et al. (2002) [70] and Pusceddu et al. (2009) [3] to the river sediments, the Po and its tributary sediments would be meso-eutrophic. Unfortunately, the lack of similar data from previous study periods in Po River sediments does not allow any inference on temporal changes in the benthic trophic status of the riverine station. Nevertheless, the overall BPC contents in the Po River sediments during our study were in the lowest range observed in other rivers, although in largely different ecological contexts and latitudes [75]. This would suggest that, most likely due to the increased use of inner freshwaters for human usage [76], the sediments of the Po River could also have recently experienced a decrease in the benthic trophic status. However, most recent studies have demonstrated that excessive simplification of the landscape due to the removal of buffer strips and riparian wetlands has accelerated the nutrient transfer to water bodies [37,63].
The results of our study indicate that, in both seasons, the lagoon sediments (i.e., Gorino, Giralda, and Delta stations) were characterized by the highest sedimentary organic loads and OM nutritional quality. This result is in agreement with the general view of Mediterranean coastal lagoons as transitional water sites of high production [77], where the accumulation of organic matter turns these ecosystems into ‘detritus traps’ [16,78], and they are net heterotrophic [79,80].
Moreover, according to previous studies [16,20], both the lagoon and marine sites under scrutiny, showing the highest sedimentary BPC concentrations, were characterized by the highest values of prokaryotic abundance, biomass, and diversity. This result confirms the presence of an overwhelming positive effect of OM quantity and bioavailability on benthic prokaryotes [19], but it can also be interpreted on the basis of concurrent physical-chemical gradients along the investigated transect. Indeed, a strong difference in the prokaryote assemblage’s composition was observed along the salinity gradient across the river-lagoon-sea transect and was accompanied by an increasing dominance of exclusive taxa in each of the investigated systems. This result corroborates previous investigations showing either an increasing presence of freshwater taxa at stations more influenced by the river discharge or a core microbiome present across all study areas [81]. Unfortunately, as our results do not allow us to provide information on the prokaryotic taxonomic identity (due to the limitations of the ARISA molecular technique, which does not allow DNA sequencing), we cannot make inferences about the specific ecological role of the different prokaryotic groups in each investigated system. Despite this, we observed the highest values of extracellular enzymatic activities in the lagoon sediments, where the highest prokaryotic biomass and diversity were also observed. These results let us hypothesize that lagoons not only behave as ‘detritus traps’ (sensu [78]), but also as OM degradation hot spots, such as deltas and estuaries, already identified as metabolic reactors for OM and nutrients [63]. The rates of enzymatic OM degradation have been repeatedly used as proxies of benthic ecosystem functioning [12,13]. We report here a clear coupling between OM degradation and prokaryotic and meiofaunal biomass and diversity, so we can infer that the investigated lagoon sediments are hotspots of ecosystem functioning, and that this, at least partially, is promoted by either prokaryotes [19] or meiofauna.
Our results also provided evidence of a concurrent positive relationship between sedimentary OM and meiofaunal abundance and biomass. Meiofauna are considered to be highly sensitive to environmental changes, so they can provide useful information about the benthic component response to ecosystem “regime shifts” in a variety of aquatic ecosystems [16,82,83,84]. Previous studies carried out in typically oligotrophic conditions (like the coastal W Mediterranean Sea) reported an evident decrease of the abundance, biomass, and richness of higher meiofaunal taxa exposed to high (excess) organic loads [82]. In contrast, our results, obtained in even more eutrophic conditions, show that the higher the organic loads, the higher the values of meiofaunal abundance and biomass. This result suggests that the apparent positive relationship between sedimentary OM and meiofaunal abundance and biomass observed across the river-lagoon-sea transect is more the result of a pattern of prokaryotic and meiofaunal communities specifically adapted to different habitats, rather than an actually ‘positive’ response to OM enrichment. Accordingly, despite no differences being observed in the richness of prokaryotic OTUs and meiofaunal higher taxa among stations or between seasons, the multivariate analysis revealed that different stations in the two seasons were characterized by very different prokaryotic and meiofaunal assemblages. In this regard, SIMPER analyses also revealed a high % of dissimilarity among systems (particularly between river and lagoon/sea systems) and seasons in each system. These results suggest that meiofaunal assemblages retrieved in the different investigated environments appear well-adapted to the specific trophic and environmental characteristics they face in each environment. Indeed, when the data are presence/absence transformed, different sets of taxa are responsible for the observed dissimilarity (mostly rare taxa, i.e., accounting for <1% of the total assemblage, each, [16]).
In this regard, the results of the multiple multi-regression analysis (DISTLM forward) indicated that both the compositions of prokaryotic OTUs and meiofaunal assemblages were significantly affected by environmental settings (temperature and salinity, cumulatively explaining ca. 24% and 19% of the observed variance in prokaryote and meiofauna assemblages, respectively), the trophic resource quantity (cumulatively 46% and 43%, respectively), and the nutritional quality (cumulatively 16% and 13%, respectively).

5. Conclusions

Our results allow us to reject the null hypothesis that the OM quantity, biochemical composition and degradation rates, prokaryotic and meiofaunal biodiversity, and ecosystem functioning do not vary among different ecosystems along a strong salinity gradient in different periods of the year.
Overall, the results of this study also allow us to conclude that the synoptic analysis of prokaryotes and meiofauna can provide useful information on the relative effects of organic enrichment and environmental settings across gradients of the environmental continuum. Our results also pinpoint that transitional water systems, including rivers, lagoons, and marine coastal ecosystems, represent a sort of end-of-pipe of the watershed continuum connecting the terrestrial and coastal domains, and acting as either a filter or source for nutrients and contaminants [64].

Supplementary Materials

The following are available online at https://www.mdpi.com/1424-2818/12/5/189/s1, Table S1. Results of the one-way PERMANOVA testing for differences in the concentration of biochemical compounds and composition (A), descriptors of nutritional quality (B) of organic matter in the sediment between sampling stations and seasons. Table S2. Results of multivariate PERMANOVA and pair wise test on prokaryotic (A) and meiofaunal (B) abundance, biomass, richness of meiofaunal taxa and taxonomic composition in the sediment among stations and sampling seasons.

Author Contributions

Conceptualization, P.V. and A.P.; methodology, S.B., D.N., M.B., P.V., E.R., and A.P.; writing, S.B. and A.P., revision, S.B., D.N., M.B., P.V., E.R., and A.P. All authors have read and agreed to the published version of the manuscript.

Funding

This study has been carried out in the frame of the project “Origin, composition and fate of organic nitrogen loads in the NW Adriatic: from the Po River to the sea”, funded by the Italian Ministry of University and Research under the PRIN 2008 call.

Acknowledgments

The authors are indebted to M. Lo Martire for the precious help during sampling activities.

Conflicts of Interest

The authors declare no conflicts of interest.

References

  1. Cebrián, J.; Williams, M.; McClelland, J.; Valiela, I. The dependence of heterotrophic consumption and C accumulation on autotrophic nutrient concentration in ecosystems. Ecol. Lett. 1998, 1, 165–170. [Google Scholar] [CrossRef]
  2. Huxel, G.R. On the influence of food quality in consumer-resource interactions. Ecol. Lett. 1999, 2, 256–261. [Google Scholar] [CrossRef]
  3. Pusceddu, A.; Dell’Anno, A.; Fabiano, M.; Danovaro, R. Quantity, biochemical composition and bioavailability of sediment organic matter as complementary signatures of benthic trophic status. Mar. Ecol. Prog. Ser. 2009, 375, 41–52. [Google Scholar] [CrossRef] [Green Version]
  4. Nixon, S.W. Coastal marine eutrophication: A definition, social causes, and future concerns. Ophelia 1995, 41, 199–219. [Google Scholar] [CrossRef]
  5. Grall, J.; Chauvaud, L. Marine eutrophication and benthos: The need for new approaches and concepts. Global Chang. Biol. 2002, 8, 813–830. [Google Scholar] [CrossRef]
  6. Torres, A.I.; Rivera Hernández, J.R.; Giarratano, E.; Faleschini, M.; Green Ruiz, C.R.; Gil, M.N. Potentially toxic elements and biochemical components in surface sediments of NW Mexico: An assessment of contamination and trophic status. Mar. Pollut. Bull. 2019, 149, 110633. [Google Scholar] [CrossRef]
  7. Cloern, J.E. Our evolving conceptual model of the coastal eutrophication problem. Mar. Ecol. Prog. Ser. 2001, 210, 223–253. [Google Scholar] [CrossRef]
  8. Fabiano, M.; Danovaro, R.; Fraschetti, S. A three-year time series of elemental and biochemical composition of organic matter in subtidal sandy sediments of the Ligurian Sea (northwestern Mediterranean). Cont. Shelf Res. 1995, 15, 1453–1469. [Google Scholar] [CrossRef]
  9. Dell’Anno, A.; Pusceddu, A.; Langone, L.; Danovaro, R. Biochemical composition and early diagenesis of organic matter in coastal sediments of the NW Adriatic Sea influenced by riverine inputs. Chem. Ecol. 2008, 24, 75–85. [Google Scholar] [CrossRef]
  10. Welsh, D.T. It’s a dirty job but someone has to do it: The role of marine benthic macrofauna in organic matter turnover and nutrient recycling to the water column. Chem. Ecol. 2003, 19, 321–342. [Google Scholar] [CrossRef]
  11. Danovaro, R.; Gambi, C.; Manini, E.; Fabiano, M. Meiofauna response to a dynamic river plume front. Mar. Biol. 2000, 137, 359–370. [Google Scholar] [CrossRef]
  12. Pusceddu, A.; Gambi, C.; Manini, E.; Danovaro, R. Trophic state, ecosystem efficiency and biodiversity of transitional aquatic ecosystems: Analysis of environmental quality based on different benthic indicators. Chem. Ecol. 2007, 23, 505–515. [Google Scholar] [CrossRef]
  13. Pusceddu, A.; Danovaro, R. Exergy, ecosystem functioning and efficiency in a coastal lagoon: The role of auxiliary energy. Estuar. Coast. Shelf Sci. 2009, 84, 227–236. [Google Scholar] [CrossRef]
  14. Magri, M.; Benelli, S.; Bondavalli, C.; Bartoli, M.; Christian, R.R.; Bodini, A. Benthic N pathways in illuminated and bioturbated sediments studied with network analysis. Limnol. Oceanogr. 2018, 63, S68–S84. [Google Scholar] [CrossRef]
  15. Politi, T.; Zilius, M.; Castaldelli, G.; Bartoli, M.; Daunys, D. Estuarine macrofauna affects benthic biogeochemistry in a hypertrophic lagoon. Water 2019, 11, 1186. [Google Scholar] [CrossRef] [Green Version]
  16. Pusceddu, A.; Bianchelli, S.; Gambi, C.; Danovaro, R. Assessment of benthic trophic status of marine coastal ecosystems: Significance of meiofaunal rare taxa. Estuar. Coast. Shelf Sci. 2011, 93, 420–430. [Google Scholar] [CrossRef]
  17. Foti, A.; Fenzi, G.A.; Di Pippo, F.; Gravina, M.F.; Magni, P. Testing the saprobity hypothesis in a Mediterranean lagoon: Effects of confinement and organic enrichment on benthic communities. Mar. Environ. Res. 2014, 99, 85–94. [Google Scholar] [CrossRef]
  18. Zobrist, E.C.; Coull, B.C. Meiobenthic interactions with microbenthic larvae and juveniles: An experimental assessment of the meiofaunal bottleneck. Mar. Ecol. Prog. Ser. 1992, 88, 1–8. [Google Scholar] [CrossRef]
  19. Danovaro, R.; Pusceddu, A. Biodiversity and ecosystem functioning in coastal lagoons: Does microbial diversity play any role? Estuar. Coast. Shelf Sci. 2007, 75, 4–12. [Google Scholar] [CrossRef]
  20. Cibic, T.; Franzo, A.; Celussi, M.; Fabbro, C.; Del Negro, P. Benthic ecosystem functioning in hydrocarbon and heavy-metal contaminated sediments of an Adriatic lagoon. Mar. Ecol. Prog. Ser. 2012, 458, 69–87. [Google Scholar] [CrossRef] [Green Version]
  21. Heip, C.; Vincx, M.; Vranken, G. The ecology of marine nematodes. Oceanogr. Mar. Biol. Ann. Rev. 1985, 23, 399–489. [Google Scholar]
  22. Semprucci, F.; Losi, V.; Moreno, M. A review of Italian research on free-living marine nematodes and the future perspectives on their use as Ecological Indicators (EcoInds). Mediterr. Mar. Sci. 2015, 16, 352–365. [Google Scholar] [CrossRef] [Green Version]
  23. Magliozzi, C.; Usseglio-Polatera, P.; Meyer, A.; Grabowski, R.C. Functional traits of hyporheic and benthic invertebrates reveal importance of wood-driven geomorphological processes in rivers. Funct. Ecol. 2019, 33, 1758–1770. [Google Scholar] [CrossRef]
  24. Tedesco, L.; Socal, G.; Acri, F.; Veneri, D.; Vichi, M. NW Adriatic Sea biogeochemical variability in the last 20 years (1986-2005). Biogeosciences 2007, 4, 673–687. [Google Scholar] [CrossRef] [Green Version]
  25. Wang, X.H.; Pinardi, N. Modelling the dynamics of sediment transport and resuspension in the northern Adriatic Sea. J. Geophys. Res. Atmos. 2002, 107, 3225. [Google Scholar] [CrossRef]
  26. Ursella, L.; Poulain, P.M.; Signell, R.P. Surface drifter derived circulation in the northern and middle Adriatic Sea: Response to wind regime and season. J. Geophys. Res. Oceans 2006, 112, C03S04. [Google Scholar] [CrossRef]
  27. Bartoli, M.; Nizzoli, D.; Viaroli, P.; Turolla, E.; Castaldelli, G.; Fano, E.A.; Rossi, R. Impact of Tapes philippinarum farming on nutrient dynamics and benthic respiration in the Sacca di Goro. Hydrobiologia 2001, 455, 203–212. [Google Scholar] [CrossRef]
  28. Viaroli, P.; Azzoni, R.; Bartoli, M.; Giordani, G.; Tajé, L. Evolution of the trophic conditions and dystrophic outbreaks in the Sacca di Goro lagoon (Northern Adriatic Sea). In Mediterranean Ecosystems; Springer: Milano, Italy, 2001; pp. 467–475. [Google Scholar]
  29. Viaroli, P.; Bartoli, M.; Azzoni, R.; Giordani, G.; Mucchino, C.; Naldi, M.; Tajé, L. Nutrient and iron limitation to Ulva blooms in a eutrophic coastal lagoon (Sacca di Goro, Italy). Hydrobiologia 2005, 550, 57–71. [Google Scholar] [CrossRef]
  30. Nizzoli, D.; Bartoli, M.; Viaroli, P. Nitrogen and phosphorous budgets during a farming cycle of the Manila clam Ruditapes philippinarum: An in situ experiment. Aquaculture 2006, 261, 98–108. [Google Scholar] [CrossRef]
  31. Zilius, M.; Giordani, G.; Petkuviene, J.; Lubiene, I.; Ruginis, T.; Bartoli, M. Phosphorus mobility under short-term anoxic conditions in two shallow eutrophic coastal systems (Curonian and Sacca di Goro lagoons). Estuar. Coast. Shelf Sci. 2016, 164, 134–146. [Google Scholar] [CrossRef]
  32. Naldi, M.; Viaroli, P. Nitrate uptake and storage in the seaweed Ulva rigida C. Agardh in relation to nitrate availability and thallus nitrate content in a eutrophic coastal lagoon (Sacca di Goro, Po River Delta, Italy). J. Exp. Mar. Biol. Ecol. 2002, 269, 65–83. [Google Scholar] [CrossRef]
  33. Fiordelmondo, C.; Manini, E.; Gambi, C.; Pusceddu, A. Short-term impact of clam harvesting on sediment chemistry, benthic microbes and meiofauna in the Goro lagoon (Italy). Chem. Ecol. 2003, 19, 173–187. [Google Scholar] [CrossRef]
  34. Mistri, M.; Rossi, R.; Fano, E.A. Structure and secondary production of a soft bottom macrobenthic community in a brackish lagoon (Sacca di Goro, north-eastern Italy). Estuar. Coast. Shelf Sci. 2001, 52, 605–616. [Google Scholar] [CrossRef]
  35. Ludovisi, A.; Castaldelli, G.; Fano, E.A. Multi-scale spatio-temporal patchiness of macrozoobenthos in the Sacca di Goro lagoon (Po river delta, Italy). Transit. Waters Bull. 2013, 7, 233–244. [Google Scholar] [CrossRef]
  36. Marinov, D.; Zaldívar, J.M.; Norro, A.; Giordani, G.; Viaroli, P. Integrated modelling in coastal lagoons: Sacca di Goro case study. Hydrobiologia 2008, 611, 147–165. [Google Scholar] [CrossRef] [Green Version]
  37. Bartoli, M.; Castaldelli, G.; Nizzoli, D.; Viaroli, P. Benthic primary production and bacterial denitrification in a Mediterranean eutrophic coastal lagoon. J. Exp. Mar. Biol. Ecol. 2012, 438, 41–51. [Google Scholar] [CrossRef]
  38. Dell’Anno, A.; Incera, M.; Mei, M.L.; Pusceddu, A. Mesoscale variability of organic matter composition in NW Adriatic sediments. Chem. Ecol. 2003, 19, 33–45. [Google Scholar] [CrossRef]
  39. Tesi, T.; Miserocchi, S.; Langone, L.; Boni, L.; Guerrini, F. Sources, fate and distribution of organic matter on the Western Adriatic Continental Shelf, Italy. Water Air Soil Pollut. Focus 2006, 6, 593–603. [Google Scholar] [CrossRef]
  40. Tesi, T.; Langone, L.; Goni, M.A.; Miserocchi, S.; Bertasi, F. Changes in the composition of organic matter from prodeltaic sediments after a large flood event (Po River, Italy). Geochim. Cosmochim. Acta 2008, 72, 2100–2114. [Google Scholar] [CrossRef]
  41. Bianchelli, S.; Pusceddu, A.; Buschi, E.; Danovaro, R. Trophic status and meiofauna biodiversity in the Northern Adriatic Sea: Insights for the assessment of good environmental status. Mar. Environ. Res. 2016, 113, 18–30. [Google Scholar] [CrossRef]
  42. Bianchelli, S.; Pusceddu, A.; Buschi, E.; Danovaro, R. Nematode biodiversity and benthic trophic state are simple tools for the assessment of the environmental quality in coastal marine ecosystems. Ecol. Indic. 2018, 95, 270–287. [Google Scholar] [CrossRef]
  43. Tahey, T.M.; Duineveld, G.C.A.; de Wilde, P.A.W.J.; Berghuis, E.M.; Kok, A. Sediment O2 demand, density and biomass of the benthos and phytopigments along the northwestern Adriatic coast: The extent of Po enrichment. Oceanol. Acta 1996, 19, 117–130. [Google Scholar]
  44. Moodley, L.; Heip, C.H.R.; Middelburg, J.J. Benthic activity in sediments of the northwestern Adriatic Sea: Sediment oxygen consumption, macro- and meiofauna dynamics. J. Sea Res. 1998, 40, 263–280. [Google Scholar] [CrossRef]
  45. Alvisi, F.; Giani, M.; Ravaioli, M.; Giordano, P. Role of sedimentary environment in the development of hypoxia and anoxia in the NW Adriatic shelf (Italy). Estuar. Coast. Shelf Sci. 2013, 128, 9–21. [Google Scholar] [CrossRef]
  46. Danovaro, R. Organic inputs and ecosystem efficiency in the deep Mediterranean Sea. Chem. Ecol. 2003, 19, 391–398. [Google Scholar] [CrossRef]
  47. Danovaro, R.; Fonda Umani, S.; Pusceddu, A. Climate change and the potential spreading of marine mucilage and microbial pathogens in the Mediterranean Sea. PLoS ONE 2009, 4, e7006. [Google Scholar] [CrossRef] [PubMed] [Green Version]
  48. Lorenzen, C.J.; Jeffrey, S.W. Determination of chlorophyll and phaeopigments spectrophotometric equations. Limnol. Oceanogr. 1980, 12, 343–346. [Google Scholar] [CrossRef]
  49. Danovaro, R. Methods for the Study of Deep-Sea Sediments, Their Functioning and Biodiversity; CRC Press, Taylor & Francis Group: Boca Raton, FL, USA, 2010; pp. 1–428. [Google Scholar]
  50. Pusceddu, A.; Dell’Anno, A.; Fabiano, M. Organic matter composition in coastal sediments at Terra Nova Bay (Ross Sea) during summer 1995. Polar Biol. 2000, 23, 288–293. [Google Scholar] [CrossRef]
  51. Pusceddu, A.; Bianchelli, S.; Canals, M.; Sanchez-Vidal, A.; De Madron, X.D.; Heussner, S.; Lykousis, V.; de Stigter, H.; Trincardi, F.; Danovaro, R. Organic matter in sediments of canyons and open slopes of the Portuguese, Catalan, Southern Adriatic and Cretan Sea margins. Deep Sea Res. I Oceanogr. Res. Pap. 2010, 57, 441–457. [Google Scholar] [CrossRef]
  52. Luna, G.M.; Corinaldesi, C.; Rastelli, E.; Danovaro, R. Patterns and drivers of bacterial α-and β-diversity across vertical profiles from surface to subsurface sediments. Environ. Microbiol. Rep. 2013, 201, 731–739. [Google Scholar] [CrossRef]
  53. Fuhrman, J.A.; Cram, J.A.; Needham, D.M. Marine microbial community dynamics and their ecological interpretation. Nat. Rev. Microbiol. 2015, 13, 133–146. [Google Scholar] [CrossRef] [PubMed]
  54. Rastelli, E.; Corinaldesi, C.; Dell’Anno, A.; Tangherlini, M.; Lo Martire, M.; Nishizawa, M.; Nomaki, H.; Nunoura, T.; Danovaro, R. Drivers of bacterial α-and β-diversity and functioning in subsurface hadal sediments. Front. Microbiol. 2019, 10, 2609. [Google Scholar] [CrossRef] [PubMed]
  55. Niederberger, T.; Bottos, E.M.; Sohm, J.A.; Gunderson, T.E.; Parker, A.E.; Coyne, K.J.; Capone, D.G.; Carpenter, E.J.; Cary, S.C. Rapid microbial dynamics in response to an induced wetting event in antarctic dry valley soils. Front. Microbiol. 2019, 10, 621. [Google Scholar] [CrossRef] [PubMed] [Green Version]
  56. Andrassy, I. The determination of volume and weight of nematodes. Acta Zool. 1956, 2, 1–15. [Google Scholar]
  57. Feller, R.J.; Warwick, R.M. Energetics. In Introduction to the Study of Meiofauna; Higgins, R.P., Thiel, H., Eds.; Smithsonian Institute Press: London, UK, 1988; pp. 181–196. [Google Scholar]
  58. Wieser, W. Benthic studies in Buzzards Bay. II The meiofauna. Limnol. Oceanogr. 1960, 5, 121–137. [Google Scholar] [CrossRef]
  59. Anderson, M.J. Permutation tests for univariate or multivariate analysis of variance and regression. Can. J. Fish. Aquat. Sci. 2001, 58, 626–639. [Google Scholar] [CrossRef]
  60. McArdle, B.H.; Anderson, M.J. Fitting multivariate models to community data: A comment on distance-based redundancy analysis. Ecology 2001, 82, 290–297. [Google Scholar] [CrossRef]
  61. Anderson, M.J.; Willis, T.J. Canonical analysis of principal coordinates: A useful method of constrained ordination for ecology. Ecology 2003, 84, 511–525. [Google Scholar] [CrossRef]
  62. Clarke, K.R.; Gorley, R.N. PRIMER v6: User Manual/Tutorial. PRIMER-E, Plymouth, 2006, p. 190. Available online: https://www.primer-e.com/(accessed on 8 May 2020).
  63. Viaroli, P.; Nizzoli, D.; Pinardi, M.; Soana, E.; Bartoli, M. Eutrophication of the Mediterranean Sea: A watershed—Cascading aquatic filter approach. Rend. Fis. Acc. Lincei 2015, 26, 13–23. [Google Scholar] [CrossRef]
  64. Zamparas, M.; Zacharias, I. Restoration of eutrophic freshwater by managing internal nutrient loads. A review. Sci. Total Environ. 2014, 496, 551–562. [Google Scholar] [CrossRef]
  65. Volf, G.; Atanasova, N.; Kompare, B.; Ožanić, N. Modeling nutrient loads to the northern Adriatic. J. Hydrol. 2013, 504, 182–193. [Google Scholar] [CrossRef]
  66. Degobbis, D.; Precali, R.; Ivančić, I.; Smodlaka, N.; Fuks, D.; Kveder, S. Long-term changes in the northern Adriatic ecosystem related to anthropogenic eutrophication. Int. J. Environ. Pollut. 2000, 13, 495–533. [Google Scholar] [CrossRef]
  67. Alcamo, J.; Moreno, J.M.; Nováky, B.; Bindi, M.; Corobov, R.; Devoy, R.J.N.; Giannakopoulos, C.; Martin, E.; Olesen, J.E.; Shvidenko, A. Impacts, Adaptation and Vulnerability. Contribution of Working Group II to the Fourth Assessment Report of the Intergovernmental Panel on Climate Change. In Climate Change 2007; Parry, M.L., Canziani, O.F., Palutikof, J.P., van der Linden, P.J., Hanson, C.E., Eds.; Cambridge University Press: Cambridge, UK, 2007; pp. 541–580. [Google Scholar]
  68. Mozetič, P.; Solidoro, C.; Cossarini, G.; Socal, G.; Precali, R.; Francé, J.; Bianchi, F.; De Vittor, C.; Smodlaka, N.; Fonda Umani, S. Recent trends towards oligotrophication of the Northern Adriatic: Evidence from chlorophyll a time series. Estuar. Coasts 2010, 33, 362–375. [Google Scholar] [CrossRef] [Green Version]
  69. Cozzi, S.; Giani, M. River water and nutrient discharges in the Northern Adriatic Sea: Current importance and long-term changes. Cont. Shelf Res. 2011, 31, 1881–1893. [Google Scholar] [CrossRef]
  70. Dell’Anno, A.; Mei, M.L.; Pusceddu, A.; Danovaro, R. Assessing the trophic state and eutrophication of coastal marine systems: A new approach based on the biochemical composition of sediment organic matter. Mar. Pollut. Bull. 2002, 44, 611–622. [Google Scholar] [CrossRef]
  71. Sabbatini, A.; Bonatto, S.; Bianchelli, S.; Pusceddu, A.; Danovaro, R.; Negri, A. Foraminiferal assemblages and trophic state in coastal sediments of the Adriatic Sea. J. Mar. Syst. 2012, 105, 163–174. [Google Scholar] [CrossRef]
  72. Conversi, A.; Fonda Umani, S.; Peluso, T.; Molinero, J.C.; Santojanni, A.; Edwards, M. The mediterranean sea regime shift at the end of the 1980s, and intriguing parallelisms with other european basins. PLoS ONE 2010, 5, e10633. [Google Scholar] [CrossRef] [Green Version]
  73. Gašparović, B. Decreased production of surface-active organic substances as a consequence of the oligotrophication in the northern Adriatic Sea. Estuar. Coast. Shelf Sci. 2012, 115, 33–39. [Google Scholar] [CrossRef]
  74. Giani, M.; Djakovac, T.; Degobbis, D.; Cozzi, S.; Solidoro, C.; Fonda Umani, S. Recent changes in the marine ecosystems of the northern Adriatic Sea. Estuar. Coast. Shelf Sci. 2012, 115, 1–13. [Google Scholar] [CrossRef]
  75. Kumar, K.S.S.; Nair, S.M.; Salas, P.M.; Cheriyan, E. Distribution and sources of sedimentary organic matter in Chitrapuzha, a tropical tidal river, southwest coast of India. Environ. Forensics 2017, 18, 135–146. [Google Scholar] [CrossRef]
  76. Delconte, C.A.; Sacchi, E.; Racchetti, E.; Bartoli, M.; Mas-Pla, J.; Re, V. Nitrogen inputs to a river course in a heavily impacted watershed: A combined hydrochemical and isotopic evaluation (Oglio River Basin, N Italy). Sci. Total Environ. 2014, 466–467, 924–938. [Google Scholar] [CrossRef] [Green Version]
  77. McLusky, D.S.; Elliott, M. Transitional waters: A new approach, semantics or just muddying the waters? Estuar. Coast. Shelf Sci. 2007, 71, 359–363. [Google Scholar] [CrossRef]
  78. Pusceddu, A.; Dell’Anno, A.; Danovaro, R.; Manini, E.; Sarà, G.; Fabiano, M. Enzymatically hydrolyzable protein and carbohydrate sedimentary pools as indicators of the trophic state of detritus sink systems: A case study in a Mediterranean coastal lagoon. Estuaries 2003, 26, 641–650. [Google Scholar] [CrossRef]
  79. Viaroli, P.; Christian, R.R. Description of trophic status, hyperautotrophy and dystrophy of a coastal lagoon through a potential oxygen production and consumption index—TOSI: Trophic Oxygen Status Index. Ecol. Indic. 2004, 3, 237–250. [Google Scholar] [CrossRef]
  80. Duarte, C.M.; Cebrian, J. The fate of marine autotrophic production. Limnol. Oceanogr. 1996, 41, 1758–1766. [Google Scholar] [CrossRef]
  81. Fazi, S.; Baldassarre, L.; Cassin, D.; Quero, G.M.; Pizzetti, I.; Cibic, T.; Luna, G.M.; Zonta, R.; Del Negro, P. Prokaryotic community composition and distribution in coastal sediments following a Po river flood event (northern Adriatic Sea, Italy). Estuar. Coast. Shelf Sci. 2020, 233, 106547. [Google Scholar] [CrossRef]
  82. Gambi, C.; Bianchelli, S.; Pérez, M.; Invers, O.; Ruiz, J.M.; Danovaro, R. Biodiversity response to experimental induced hypoxic-anoxic conditions in seagrass sediments. Biodivers. Conserv. 2009, 18, 33–54. [Google Scholar] [CrossRef]
  83. Mirto, S.; Bianchelli, S.; Gambi, C.; Krzelj, M.; Pusceddu, A.; Scopa, M.; Holmer, M.; Danovaro, R. Fish-farm impact on metazoan meiofauna in the Mediterranean Sea: Analysis of regional vs. habitat effects. Mar. Environ. Res. 2010, 69, 38–47. [Google Scholar] [CrossRef] [Green Version]
  84. Bianchelli, S.; Buschi, E.; Danovaro, R.; Pusceddu, A. Biodiversity loss and turnover in alternative states in the Mediterranean Sea: A case study on meiofauna. Sci. Rep. 2016, 6, 34544. [Google Scholar] [CrossRef] [Green Version]
Figure 1. Sampling area: (A) the Po River basin, flowing into the North Adriatic sea, Central Mediterranean and (B) location of the sampling stations along the Po River basin, the Goro Lagoon, and at sea.
Diversity 12 00189 g001
Figure 2. Output of the canonical analysis of principal coordinates (CAP) on the sedimentary organic matter biochemical composition (A) and nutritional quality (B).
Diversity 12 00189 g002
Figure 3. Prokaryotic abundance (A), biomass (B), richness of Operational Taxonomic Unit (OTU) (C), and OTU composition (D) in the investigated stations in summer and winter.
Diversity 12 00189 g003
Figure 4. Meiofaunal abundance (A), biomass (B), richness of higher taxa (C), and taxonomic composition (D) in the investigated stations in summer and winter.
Diversity 12 00189 g004
Figure 5. Relationships between biopolymeric C contents and prokaryotic abundance (A) and biomass (B), as well as between chlorophyll-a and meiofauna abundance (C) and biomass (D) in the sediments.
Diversity 12 00189 g005
Table 1. Temperature, salinity, organic matter contents (A), descriptors of organic matter nutritional quality, and degradation rates (B) in the sediments of the investigated stations across the river-to-sea transect in summer and winter.
(A) TemperatureSalinityChlorophyll-aPhaeopigmentTotal PigmentProteinCarbohydrateLipidBiopolymeric C
Sampling season Sampling station°CPSUμg g−1μg g−1μg g−1mg g−1mg g−1mg g−1mg g−1
avgsdavgsdavgsdavgsdavgsdavgsdavgsd
SummerRiverOglio2500.080.000.300.020.350.050.300.020.170.000.030.010.240.02
RiverPo2301.120.094.000.535.120.680.710.080.380.100.140.050.600.12
LagoonGorino23283.070.5968.5919.0171.6619.9914.191.603.320.201.510.099.410.93
LagoonGiralda2356.291.0391.379.9398.6610.508.180.924.050.090.640.066.100.53
LagoonDelta23281.400.0814.030.7415.430.881.480.140.440.020.190.021.050.09
SeaCesenatico17352.671.0036.4510.3139.1211.3110.500.472.550.330.880.046.830.39
WinterRiverOglio801.380.0019.356.2420.723.612.450.233.710.990.740.193.240.65
RiverPo1001.310.158.730.1710.040.025.800.117.440.271.370.316.850.39
LagoonGorino8288.741.58125.333.10134.074.574.600.277.430.602.660.317.220.61
LagoonGiralda8917.280.5593.746.60111.037.1510.340.256.030.681.650.138.720.49
LagoonDelta13289.022.3638.9510.2147.9712.574.820.823.260.370.910.234.350.72
SeaCesenatico10351.460.1516.031.4617.000.775.020.620.490.020.320.062.890.35
(B) Phytopigment: Biopolymeric CProtein: Biopolymeric CProtein: CarbohydrateAminopeptidaseβ-GlucosidaseAlkaline-Phosphatase
Sampling season Sampling station%% μg C g−1 h−1μg C g−1 h−1μg P g−1 h−1
avgsdavgsdavgsdavgsdavgsdavgsd
SummerRiverOglio1.320.0361.300.781.250.0214.204.380.490.240.670.25
RiverPo7.560.9158.124.691.190.1020.484.811.760.124.820.91
LagoonGorino1.300.1273.791.041.510.0213.215.060.900.193.230.09
LagoonGiralda4.100.3365.561.721.340.0429.825.113.391.276.533.70
LagoonDelta5.370.1569.350.601.420.018.592.390.680.190.920.31
SeaCesenatico1.550.5075.410.951.540.0214.403.472.010.135.301.29
WinterRiverOglio1.750.3537.674.190.770.0916.6010.943.561.141.700.62
RiverPo0.760.0441.551.570.850.033.510.833.850.771.460.46
LagoonGorino4.820.4731.250.780.640.0223.3116.391.550.523.310.39
LagoonGiralda7.940.2058.201.871.190.0424.912.443.040.165.231.37
LagoonDelta8.200.8354.300.201.110.00420.759.634.071.252.010.31
SeaCesenatico2.020.0484.910.111.730.0028.471.491.020.241.980.26
Table 2. Output of SIMPER analysis (cut off 90%), testing for % dissimilarity among systems in each season and between seasons in each system.
% DissimilarityResponsible TaxaPresence/Absence % DissimilarityResponsible Taxa
In summerriver vs. lagoon75.3Nematoda41.3Amphipoda, Rotifera, Ostracoda, Oligochaeta, Tardigrada, Acarina, Polychaeta, Nemertini, Bivalvia, Platelminta
lagoon vs. sea76.1Nematoda36.2Kinorhyncha, Ostracoda, Rotifera, Priapulida larvae, Polychaeta, Acarina, Cumacea, Oligochaeta, Amphipoda, Nemertea
river vs. sea50.0Nematoda, Copepoda49.4Kinorhyncha, Amphipoda, Rotifera, Ostracoda, Polychaeta, Oligochaeta, Tardigrada, Priapulida larvae, Cumacea, Bivalvia
In winterriver vs. lagoon80.0Nematoda41.8Amphipoda, Rotifera, Ostracoda, Tardigrada, Polychaeta, Oligochaeta, Acarina, Copepoda
lagoon vs. sea63.7Nematoda22.0Oligochaeta, Ostracoda, Tardigrada, Acarina, Rotifera, Polychaeta, Amphipoda
river vs. sea65.3Nematoda, Copepoda40.7Amphipoda, Rotifera, Oligochaeta, Tardigrada, Polychaeta, Acarina, Copepoda,
In river systemsummer vs. winter63.4Nematoda, Copepoda, Acarina37.9Tardigrada, Polychaeta, Oligochaeta, Rotifera, Ostracoda, Acarina, Copepoda, Amphipoda, Bivalvia, Platelminta
In lagoon systemsummer vs. winter39.3Nematoda28.3Ostracoda, Oligochaeta, Acarina, Amphipoda, Tardigrada, Rotifera, Nemertea, Polychaeta, Bivalvia, Isopoda, Kinorhyncha
In sea systemsummer vs. winter37.0Nematoda, Copepoda31.3Kinorhyncha, Oligochaeta, Polychaeta, Rotifera, Priapulida larvae, Ostracoda
Table 3. Results of the multivariate multiple regression analysis carried out to ascertain the effect of the quantity and nutritional quality of sedimentary organic matter on the prokaryotic OTU composition (A) and meiofaunal taxonomic composition irrespective of the season (B), in summer, (C) and in winter (D). % Variance = percentage of explained variance (SS = sum of squares; F = F statistic; P = probability level; *** = P < 0.001; ** = P < 0.01; * = P < 0.05; ns = not significant).
VariableSSFP% Variance% Cumulative
(A)Temperature5505.62.8388***13.613.6
prokaryotic OTU compositionPhaeopigment4690.33.1907**11.625.2
Salinity4165.52.3033*10.335.5
Chlorophyll-a4003.72.3956**9.945.4
Chlorophyll-a/Biopolymeric C3940.85.3008**9.855.2
Lipid34103.3767*8.463.6
Protein3293.72.4585*8.171.8
Carbohydrate3227.52.702*8.079.8
Protein/Biopolymeric C2512.24.4342*6.286.0
Protein/Carbohydrate801.551.4831ns2.088.0
(B)Phaeopigment27,98714.951***30.530.5
meiofaunal taxonomic compositionSalinity15,29110.435**16.747.2
Chlorophyll-a/Biopolymeric C8447.16.7732***9.256.4
Protein4192.53.639**4.661.0
Carbohydrate3872.84.4542**4.265.2
Protein/Carbohydrate3817.23.59**4.269.4
Chlorophyll-a3680.33.7822*4.073.4
Temperature2270.22.7766*2.575.9
Protein/Biopolymeric C1294.41.6557ns1.477.3
Lipid1235.11.5408ns1.378.7
(C)Chlorophyll-a9912.34.7556**22.922.9
meiofaunal taxonomic composition in summerTemperature8016.64.7468**18.541.4
Lipid7348.919.458**17.058.4
Salinity7045.15.3933**16.374.7
Chlorophyll-a/Biopolymeric C6406.77.0101**14.889.5
Protein824.862.8042*1.991.4
Phaeopigment765.742.2364ns1.893.2
Protein/Carbohydrate351.131.22ns0.894.0
Protein/Biopolymeric C342.361.2184ns0.894.8
Carbohydrate110.930.36334ns0.395.1
(D)Phaeopigment20,44212.098***43.143.1
meiofaunal taxonomic composition in winterSalinity13,04513.987***27.570.5
Protein4212.26.0307***8.979.4
Chlorophyll-a2762.15.1176***5.885.2
Carbohydrate2283.75.7903**4.890.0
Protein/Biopolymeric C785.552.0692ns1.791.7
Protein/Carbohydrate466.831.266ns1.092.7
Lipid364.150.91691ns0.893.4
Temperature323.360.86176ns0.794.1
Chlorophyll-a/Biopolymeric C166.230.39556ns0.494.5

