Article

The Effect of a Dam Construction on Subtidal Nematode Communities in the Ba Lai Estuary, Vietnam

1
Department of Environmental Management and Technology, Institute of Tropical Biology, Vietnam Academy of Science and Technology, 85, Tran Quoc Toan, Dist.3, Ho Chi Minh City 72415, Vietnam
2
Marine Biology Research Group, Biology Department, Ghent University, Krijgslaan 281, S8, B-9000 Ghent, Belgium
3
Vietnam Academy of Science and Technology, Graduate University of Science and Technology, 18, Hoang Quoc Viet, Cau Giay, Hanoi 122300, Vietnam
*
Author to whom correspondence should be addressed.
Diversity 2020, 12(4), 137; https://doi.org/10.3390/d12040137
Submission received: 28 February 2020 / Revised: 29 March 2020 / Accepted: 31 March 2020 / Published: 2 April 2020
(This article belongs to the Special Issue Meiofauna Biodiversity and Ecology)

Abstract

:
Nematode communities and relevant environmental variables were investigated to assess how the presence of a dam affects the Ba Lai estuary benthic ecosystem, in comparison to the adjacent dam-free estuary Ham Luong. Both estuaries are part of the Mekong delta system in Vietnam. This study has shown that the dam’s construction had an effect on the biochemical components of the Ba Lai estuary, as observed by the local increase in total suspended solids and heavy metal concentrations (Hg and Pb) and by a significant oxygen depletion compared to the natural river of Ham Luong. The nematode communities were also different between the two estuaries in terms of density, genus richness, Shannon–Wiener diversity, and dominant genera. The Ba Lai estuary exhibited lower nematode densities but a higher diversity, while the genus composition only slightly differed between estuaries. The results indicate that the present nematode communities may be well adapted to the natural organic load, to the heavy metal accumulation and to the oxygen stress in both estuaries, but the dam presence may potentially continue to drive the Ba Lai’s ecosystem to its tipping point.

1. Introduction

The Mekong estuarine system in Vietnam is an ecologically important habitat, supporting, at the same time, many different socio-economical activities in agriculture, fisheries and aquaculture. The rivers within this system carry a lot of alluvium to form the lower Mekong River Delta, resulting in a high diversity of bio-resources along the southern coastal area of the East Sea [1]. As in every estuary, the Mekong supports a high diversity of both freshwater and marine species, including fish and crustaceans, which use the present habitats for feeding, as refuge, as a migration route, and as a nursery during the different stages of their life cycle [2].
In 2002, the first Mekong dam was built across the Ba Lai estuary, in the Ben Tre province [3]. The barrage aimed to improve the province’s agricultural production and its economic development, by transforming rice fields into polyculture. This action was supposed to help residents in minimizing the damage caused by drought and inland salinization on farm production in the dry season, in preventing flooding during the rainy season, and in irrigating crop fields with fresh water [3]. However, results from previous studies at other locations worldwide have shown that dams actually change the physicochemical characteristics of the environment, disturbing the aquatic and riverine ecosystems, as well as the socio-economical structure of local communities [4,5]. Dams create water reservoirs upstream from the dam, transform lotic systems into lentic environments, slow down the water flow and cause reduced dissolved oxygen concentrations and a higher deposition of fine sediments in the reservoirs [6,7,8,9]. Consequently, these changes influence the aquatic biodiversity and the local productivity, as well as food web interactions [10,11]. Numerous studies recorded a reduction in abundance and diversity of aquatic communities (e.g., fish, algal, and benthic invertebrates), due to changes in the environment following the construction of a dam. [4,10,12,13,14].
As observed in other dams worldwide, the construction of the Ba Lai dam has in many aspects caused negative effects on the estuarine ecosystem and even on its surrounding environment, affecting the local residents’ livelihood. The presence of the Ba Lai dam has changed the salinity gradient of the natural estuary, and converted brackish habitats into a freshwater ecosystem and the sea-estuary dynamics. The greatest impact of the dam is the transformation of forest land into farming areas in the Ba Tri district, as the natural flow has been artificially controlled [2]. Not only has the production of fish populations declined compared to the original estuary [7], but the reduction of water circulation also resulted in the accumulation of organic pollutants and waste discharge [2,15]. Since the dam’s operation, local communities were facing gradual depletion of natural aquatic resources, while landslides have been threatening their land and houses [7,15]. Also, the Ba Lai estuary itself has started to decrease its water volume, since the reduction in flow can no longer carry away all the alluvium [16]. This process especially changes the benthic environment and its associated biota [5,10], of which free-living nematodes represent one of the most abundant invertebrate groups.
Nematodes provide many advantages in biomonitoring studies, including their high density and species richness, their ubiquity, and their different feeding strategies and life mode [17,18,19,20,21]. They lack a pelagic larval stage and respond promptly to environmental changes on the seafloor, since their entire life cycle is associated with benthic compartment. Different attributes of nematode communities, especially those related to their biodiversity, such as density and diversity indices, are used to assess the ecological status and disturbance impacts in estuaries [22,23,24,25,26,27,28,29]. However, there have been only a few studies that analyzed the response of nematode communities to the effects of dam construction [27,30,31,32,33]. Depending on the area, different responses were found, among which were significant reductions in diversity in the river Elbe, Germany [31] or reduced abundances of nematodes in the river Murray, Australia [32].
Ngo et al. (2016) studied the intertidal nematodes assemblages of the eight Mekong estuaries in Vietnam and authors observed that the community structure near the Ba Lai dam strongly deviated from what was expected based on the sediment characteristics [25]. The mesohaline downstream station (PSU of 22.9), which was located close to the barrier dam, was characterized by the dominance of the rapid colonizer genus Diplolaimella, and by the absence of the typical dominant genera in silty sediments, such as Parodontophora, Halalaimus, Thalassomonhystera, and Terschellingia, which resulted in a very low maturity index, an index generally used to assess levels of disturbance. At this location, unusually high ammonium concentrations where also observed, pointing to a source of disturbance.
Building upon the observations by Ngo et al. (2016) [25] for the Ba Lai estuary, the present study evaluates the ecological impacts of the dam by characterizing free-living nematode assemblages and their link to the environmental characteristics. As there are no historical data available from the time before the dam construction, we also investigated an adjacent dam-free estuary, Ham Luong, as a reference for our comparisons. We tested the following hypotheses: 1) The presence of a dam affects the environmental conditions from both the downstream and upstream part of an estuary compared to a natural estuary (i.e., dam-free). 2) The environmental differences between estuaries and estuarine sections (upstream versus downstream) resulted in different nematode communities in terms of diversity and composition.

2. Materials and Methods

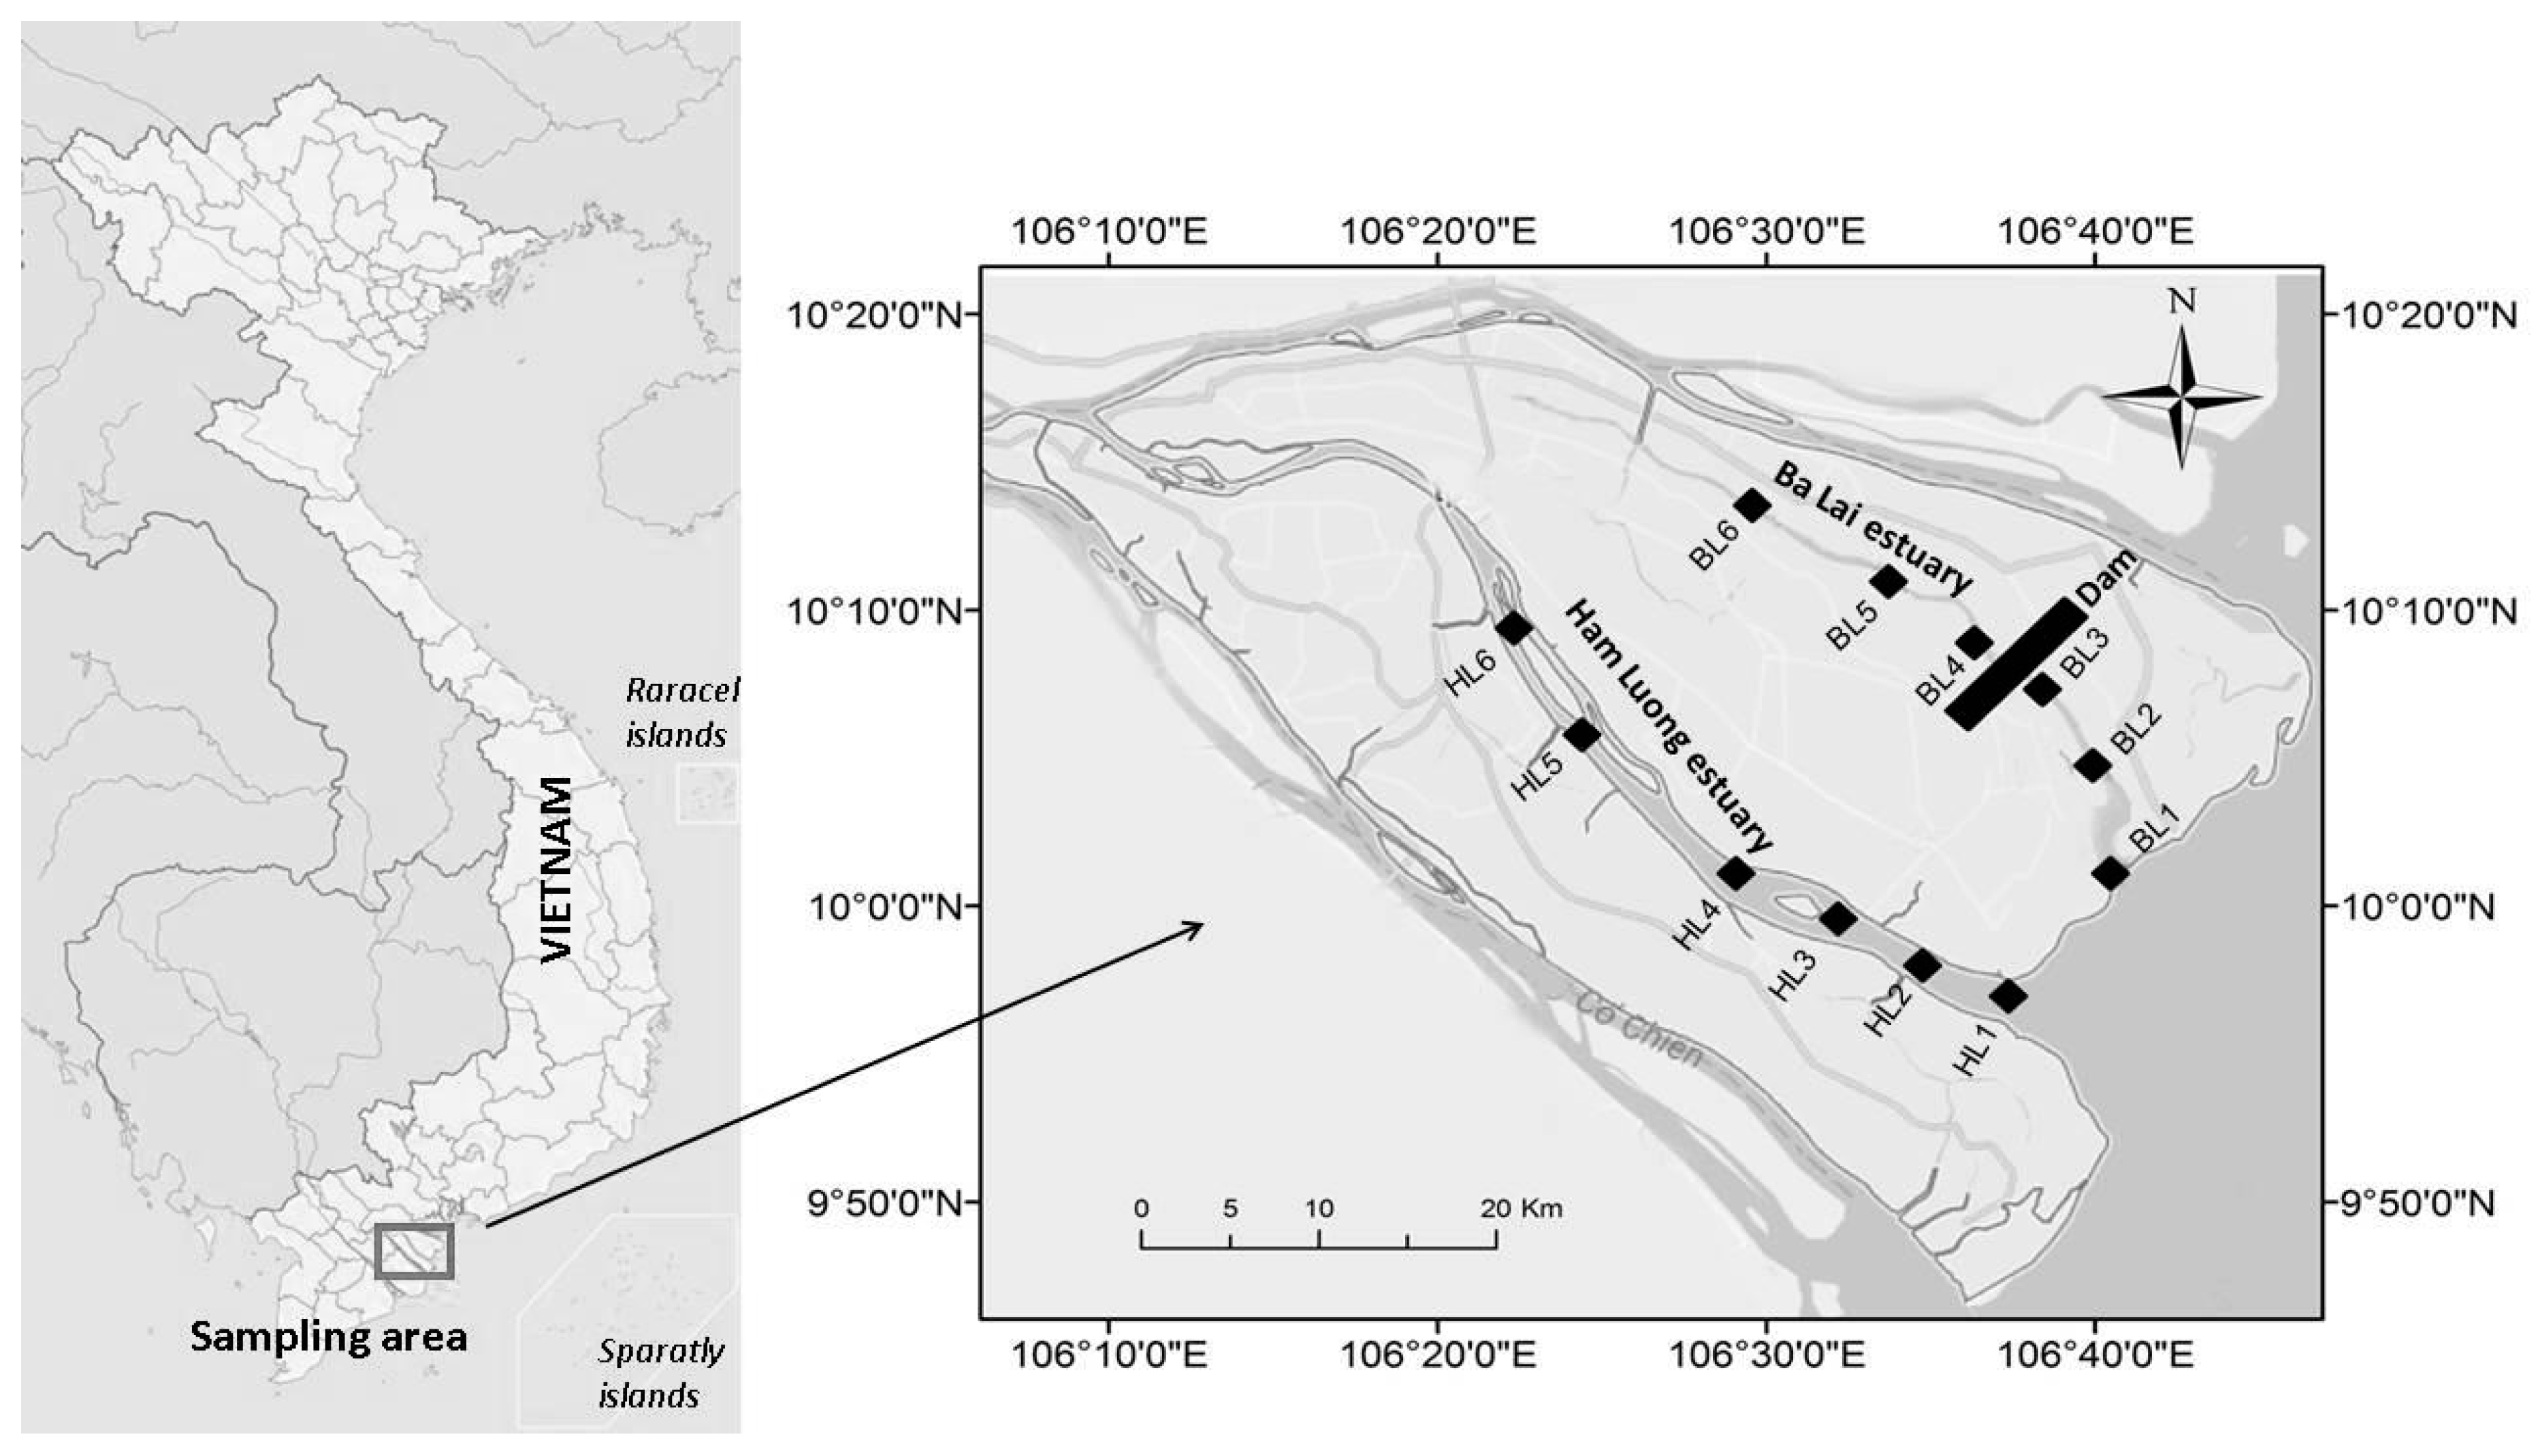
2.1. Study Area and Sampling Location

The Ba Lai estuary is on average 59 km long and 3–4 m deep, with a water flow volume of 50–60 m3/s in the dry season, while it is five times higher in the rainy season [2]. The Ham Luong estuary is 72 km long and with a water flow around 800–850 m3/s during the dry season, and approximately 3300–3400 m3/s in the rainy season [2]. Both estuaries flow from the My Tho River to the East Sea and they are located in the Ben Tre province.
Sampling was carried out in the Ba Lai (BL) and Ham Luong (HL) estuaries, during the dry season in March 2017. In each estuary, 6 subtidal stations were identified from the mouth to the upstream. Within the Ba Lai estuary, BL1, BL2, and BL3 (BL1-BL3) are the downstream stations, while BL4, BL5 and BL6 are located upstream of the dam. In the Ham Luong estuary, HL1, HL2, HL3, HL4, HL5, and HL6 are reference stations situated at similar positions along the original estuarine gradient as in the Ba Lai. The sampling area is shown in Figure 1.

2.2. Sampling and Environmental Variable Analysis

One sample per station was collected for all environmental variables measured in the water column and in the sediment.
In the overlying water, different physicochemical parameters, including salinity, pH, dissolved oxygen (DO), total dissolved solids (TDS) and total suspended solids (TSS) were measured. Salinity was measured in situ using a Multiparameter Water Quality Meter Model WQC22A. Based on the measured salinity, stations were classified into different estuarine zones from polyhaline (18–30 PSU), mesohaline (5–18 PSU), oligohaline (0.5–5 PSU), to freshwater (< 0.5 PSU), following Montagna et al. (2013) [34]. The pH was measured with a pH-62K APEL equipment, DO was determined by DO-802 APEL instruments, TSS was measured using SMEWW 2540, and TDS was measured using a Water Quality Checker WQC-22A. The methods followed the international guidance sampling technique with ISO 5667-1: 2006 and ISO 5667-3: 2018 [35].
Sediment samples were collected using a Ponar type grab deployed from a small boat. The undisturbed sediment was subsampled using different techniques for different purposes (Application of ISO 5667-1: 2006, ISO 5667-12: 2017 and ISO 5667-15: 2009) [36].
Sediment samples for grain size analysis were collected by means of a cut off syringe of 3 cm diameter and 10 cm deep. The granulometry was analyzed by a Coulter type Mastersizer APA2000, equipped with Hydro 2000G model AWA2000-Malvern. The sediment fractions were classified as sand (> 63 µm), silt (4–63 µm), and clay (< 4 µm) [37].
Samples for the analysis of nutrients (including total organic carbon (TOC), total phosphorus (TP), total nitrogen (TN), ammonium (NH4+), and nitrate (NO3)) were collected with a core of 6 cm inner diameter pushed in the sediment up to 10 cm and preserved at 4 °C until arrival at the laboratory, where they were frozen at −20 °C until further analysis. TOC, TN, TP content in the sediment were analyzed with an Element Analyzer Flash 2000 after lyophilization, homogenization and acidification with 1% HCl. The sediment was thawed and processed for measurements of nitrate (NO3) and ammonia (NH4+) concentration, using an automatic chain (SANplus Segmented Flow Analyser, SKALAR).
Heavy metal sediment samples were collected, kept in glass bottles and transported to the laboratory (3050B method). After centrifugation followed by decantation, the sediment fraction was collected and kept frozen [38]. Amounts of 0.5 g of the wet samples (exact to 0.1 mg) were weighted into Teflon-closed vessels, followed by the addition of 6 mL sub-boiling HNO3 (d = 1.42 g/mL) and 2 mL distilled, sub-boiling HCl (d = 1.19 g/mL). The vessels were then sonicated for 10–15 min, then simmered for at least 12 h at 110 °C. During the simmering, the vessels were sonicated for 5 min after every 4-hour simmering. After sonication, they were ramped to 160 °C and kept there for 4 h. After cooling down to room temperature, the samples were quantitatively transferred into 25 mL volumetric flasks and filled to the mark with deionized water. The bulk solutions were then transferred to 50 mL PE tubes and centrifuged at 3000 rpm for 15 min. The supernatant was divided into two separated 15 mL test tubes: one tube for archive and one tube for CV-AAS/F-AAS/ICP-MS analysis. The solutions were directly measured using the ICP-MS method for Cr, Cu, As, Se, Cd, Pb targets; as 1 g (to the nearest milligram) for Hg target; and diluted 200 times prior to F-AAS measurement for Fe target. Cr, Cu, As, Se, Cd, Pb were analyzed by inductively coupled plasma mass spectrometry (ICPMS). Fe was analyzed by flame atomic absorption spectrometry (F-AAS). Hg was analyzed by cold vapor atomic absorption spectrometry (CV-AAS).
For the Sulfide (H2S) analysis, the top 2 cm of undisturbed sediment samples were immediately isolated after the grab returned to the boat and stored in 50 mL capped vials (polypropylene screw cap, conical bottom tubes, ISOLAB) on dry ice (Ion-selective electrode method). Once returned to the laboratory on shore, samples were transferred to a −18 °C freezer until further analysis. Total free H2S concentrations were determined following the method of Brown et al. (2011) [39]. Briefly, the sediment sample in the 50 mL plastic vial was mildly defrosted at 4 °C, then centrifuged at 3000 rpm for 5 min. After the water layer was discarded, the sediment was homogenized with a stainless steel spatula. A 10 mL portion of the sample was transferred into another graduated plastic vial containing 10 mL of SAOB and further vortexed. The mixture was measured as quick as possible to avoid sulfide conversion.
In order to analyze the Methane (CH4) concentration, about 10 mL of the top 2 cm of undisturbed sediment was immediately stored after sampling into a tared 40 mL serum vial containing 5 mL of 0.1 N NaOH to terminate further bacterial activity (GC-FID method). The vial was quickly sealed with a silicone stopper to minimize potential loss of methane and placed on dry ice. Once returned to the laboratory, samples were transferred to a −18 °C freezer until further analysis.

2.3. Sampling and Analysis of Nematodes

Triplicate samples per station were collected for nematode analysis. Sediment samples were taken from the boat with a Ponar grab. The grab was subsampled with a PVC core (30 cm long, 3.5 diameter) up to 10 cm depth in the sediment (10 cm2 surface area) and placed in a sample bottle (about 300 mL). Samples were fixed and preserved in the field with 7% hot neutralized formalin (60–70 °C) and gently stirred.
In the laboratory, samples were washed over a 1 mm sieve to remove any big fractions of stone, debris and sands. Nematodes were then separated and collected by flotation technique using Ludox-TM50 at a specific gravity of 1.18 g/cm3, using a 38 µm sieve [40]. The procedure was repeated three times to make sure all organisms were extracted from the sample. In order to facilitate the nematode counting, samples were stained with a 1% solution of Rose Bengal. A quantitative analysis of nematodes was done using a Stereo microscope. From each sample, 200 individuals were randomly picked out and gradually transferred to pure glycerin and then mounted on permanent slides for taxonomic analysis, following the method of De Grisse (1969) [41]. For those samples with less than 200 individuals, all nematodes were picked out.
Nematode specimens on permanent slides were identified to the genus level using a Leica light microscope. For nematode identification, we used the specialized literatures [42,43,44,45,46,47], including free-living nematodes reported for Vietnam [48] and the Nemys database [49].

2.4. Data Processing and Statistical Analysis

Genus richness and Shannon–Wiener [50] diversity indices were used for biodiversity analysis.
Univariate data analyses were applied on the environmental variables, nematode densities (individuals per 10 cm²) and diversity indices. Based on the dam presence and the measured salinity zones (mesohaline zone and oligohaline-freshwater zone), we identified two factors for further statistical analysis. The “estuary” factor, which includes 2 levels: the two estuaries Ba Lai and Ham Luong (dammed versus reference estuary); The second factor was indicated as “estuarine-section” and consists of 2 levels, upstream and downstream. The combination of the two factors resulted in 4 groups referred as: “dammed downstream”, “dammed upstream”, “reference downstream”, “reference upstream”. We chose to pool the stations per three according to their up-or downstream position (based on the dam presence and the measured salinity zones), to reduce the effect of local patchiness and to address the main question related to the dam effect.
The Shapiro–Wilk test was used to check for normal distributions and Levene’s test to evaluate the homogeneity of variances (p > 0.05). The data were transformed by either square-root or log transformation if assumptions were not met.
If assumptions were fulfilled, a two-factor ANOVA (analysis of variance) was performed in RStudio [51]. When the assumptions were not fulfilled, the analyses were replaced by a non-parametric permutational PERMANOVA on software PRIMER 6, in order to identify significant differences between estuarine-sections and estuaries [52]. When significant differences were found (p < 0.05), a post hoc test (Tukey HSD) was applied for pairwise comparisons between estuarine-sections.
The obtained p-values were corrected with the Benjamini and Hochberg (1995) [53] correction method.
Multivariate analyses were performed using the software PRIMER 6 with the PERMANOVA add-on package, and the same the design was used as the one described in the univariate analyses section [52].
Significant differences between groups in nematode community composition datasets were tested with PERMANOVA. The test was based on square-root transformed data for community composition. Significant values were considered when p < 0.05. After the PERMANOVA tests, PERMDISP routines were performed to test for the homogeneity of multivariate dispersions. Subsequently, pairwise comparison tests were performed, to identify which pairs of estuarine sections were significantly different from each other. Then, a SIMPER analysis (SIMilarity PERcentages) was performed to identify the taxa responsible for dissimilarities between groups.
DistLM (distance-based linear model) analyses were conducted for environmental variables with correlations lower than 0.9, in order to identify which environmental factors were significantly associated with the variability observed in the nematode multivariate community structure. The DistLM model was performed using a step-wise selection procedure and adjusted R2 as selection criteria. Results from the DistLM were visualized using dbRDA (distance-based redundancy analysis) plots.
Correlation analyses between environmental and nematode variables were computed in R-Studio, either using the Pearson or Spearman rank method (when the data were not normally distributed).

3. Results

3.1. Environmental Characteristics of Ba Lai and Ham Luong Estuaries

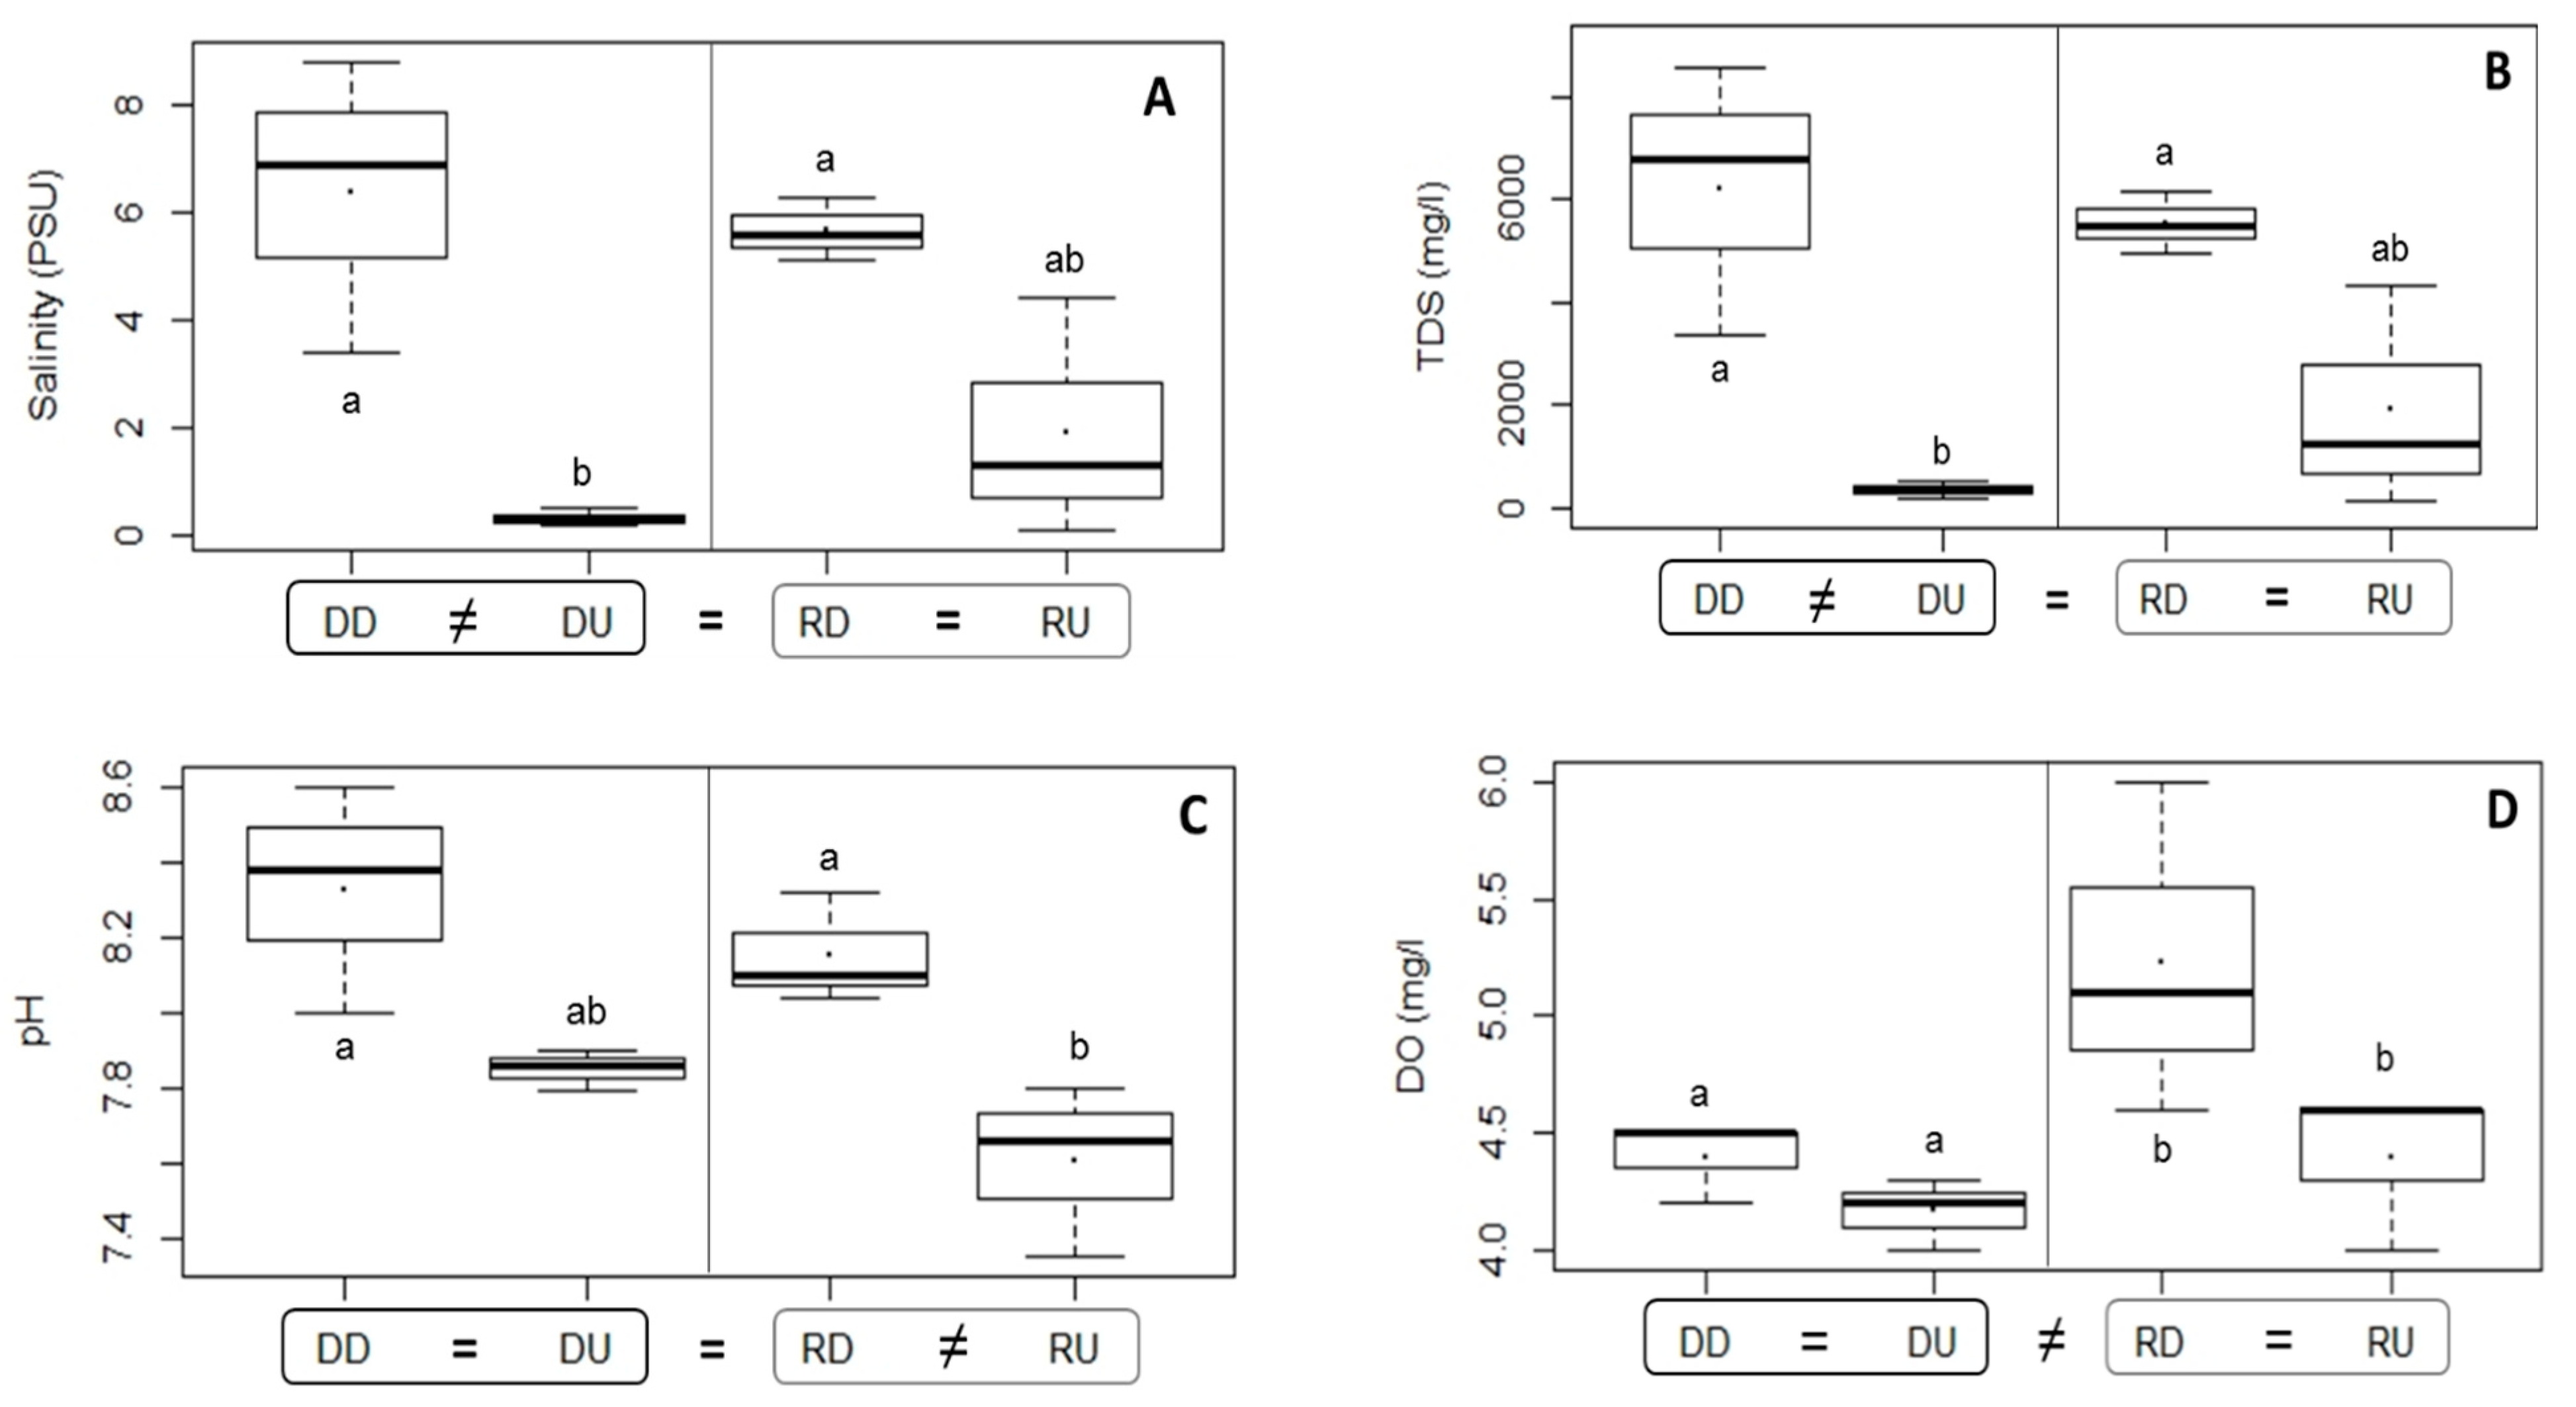
3.1.1. Water Environmental Characteristics

In both Ba Lai and Ham Luong estuaries, the values for salinity, TDS, pH and DO decreased in general from the downstream to the upstream sections, whereas the opposite trend was found for TSS (Figure 2). Salinity and TDS showed higher variability between the two sections of the Ba Lai, in comparison to the variation found between the two sections within Ham Luong.
Based on the average salinity, we classified the DD part as mesohaline (6.37 ± 2.74 PSU) and the DU section as freshwater (0.33 ± 0.15 PSU), whereas the two sections of the Ham Luong estuary were characterized as mesohaline and oligohaline (5.67 ± 0.60 and 1.93 ± 2.22 PSU, respectively) (Figure 2A). The TDS showed a concentration of 6220 ± 2628.52 mg/L in DD and 5536.67 ± 611.34 mg/L in RD. These values were higher than that at both upstream sections, with 355.33 ± 147.02 mg/L in DU and 1916 ± 2181.28 mg/L in RU (Figure 2B). The pH in all sections was higher than 7, pointing to an alkaline environment. The level of pH only slightly fluctuated with higher values in the downstream parts, compared to the upstream sides in both estuaries (Figure 2C). The Ba Lai estuary had, in general, lower DO levels than Ham Luong. Both downstream sides of the two estuaries had greater DO concentrations than the upstream parts, 4.40 ± 0.17 mg/L in DD and 5.23 ± 0.71 mg/L in RD, compared to values of 4.17 ± 0.15 in DU and 4.40 ± 0.35 in RU (Figure 2D). From Figure 2 (A, B, D), it can be seen that the dammed upstream (DU) section of Ba Lai was characterized by the lowest concentrations of salinity, TDS and DO, compared to all other sections.
The TSS concentration was higher in Ba Lai than in Ham Luong and it increased from downstream to upstream in both estuaries, with 62.63 ± 18.38 mg/L in DD and 22.93 ± 8.78 mg/L in RD, compared to 101.30 ± 24.49 mg/L in DU and 43.73 ± 17 mg/L in RU (Figure 2E).
The two-way ANOVA and permutational PERMANOVA analyses showed significant differences between the two estuaries, in terms of DO and TSS. The estuarine sections were also different in terms of salinity, TDS; pH, and DO. The significant p values were presented in Table 1. No significant interaction effect was found for any of these variables.

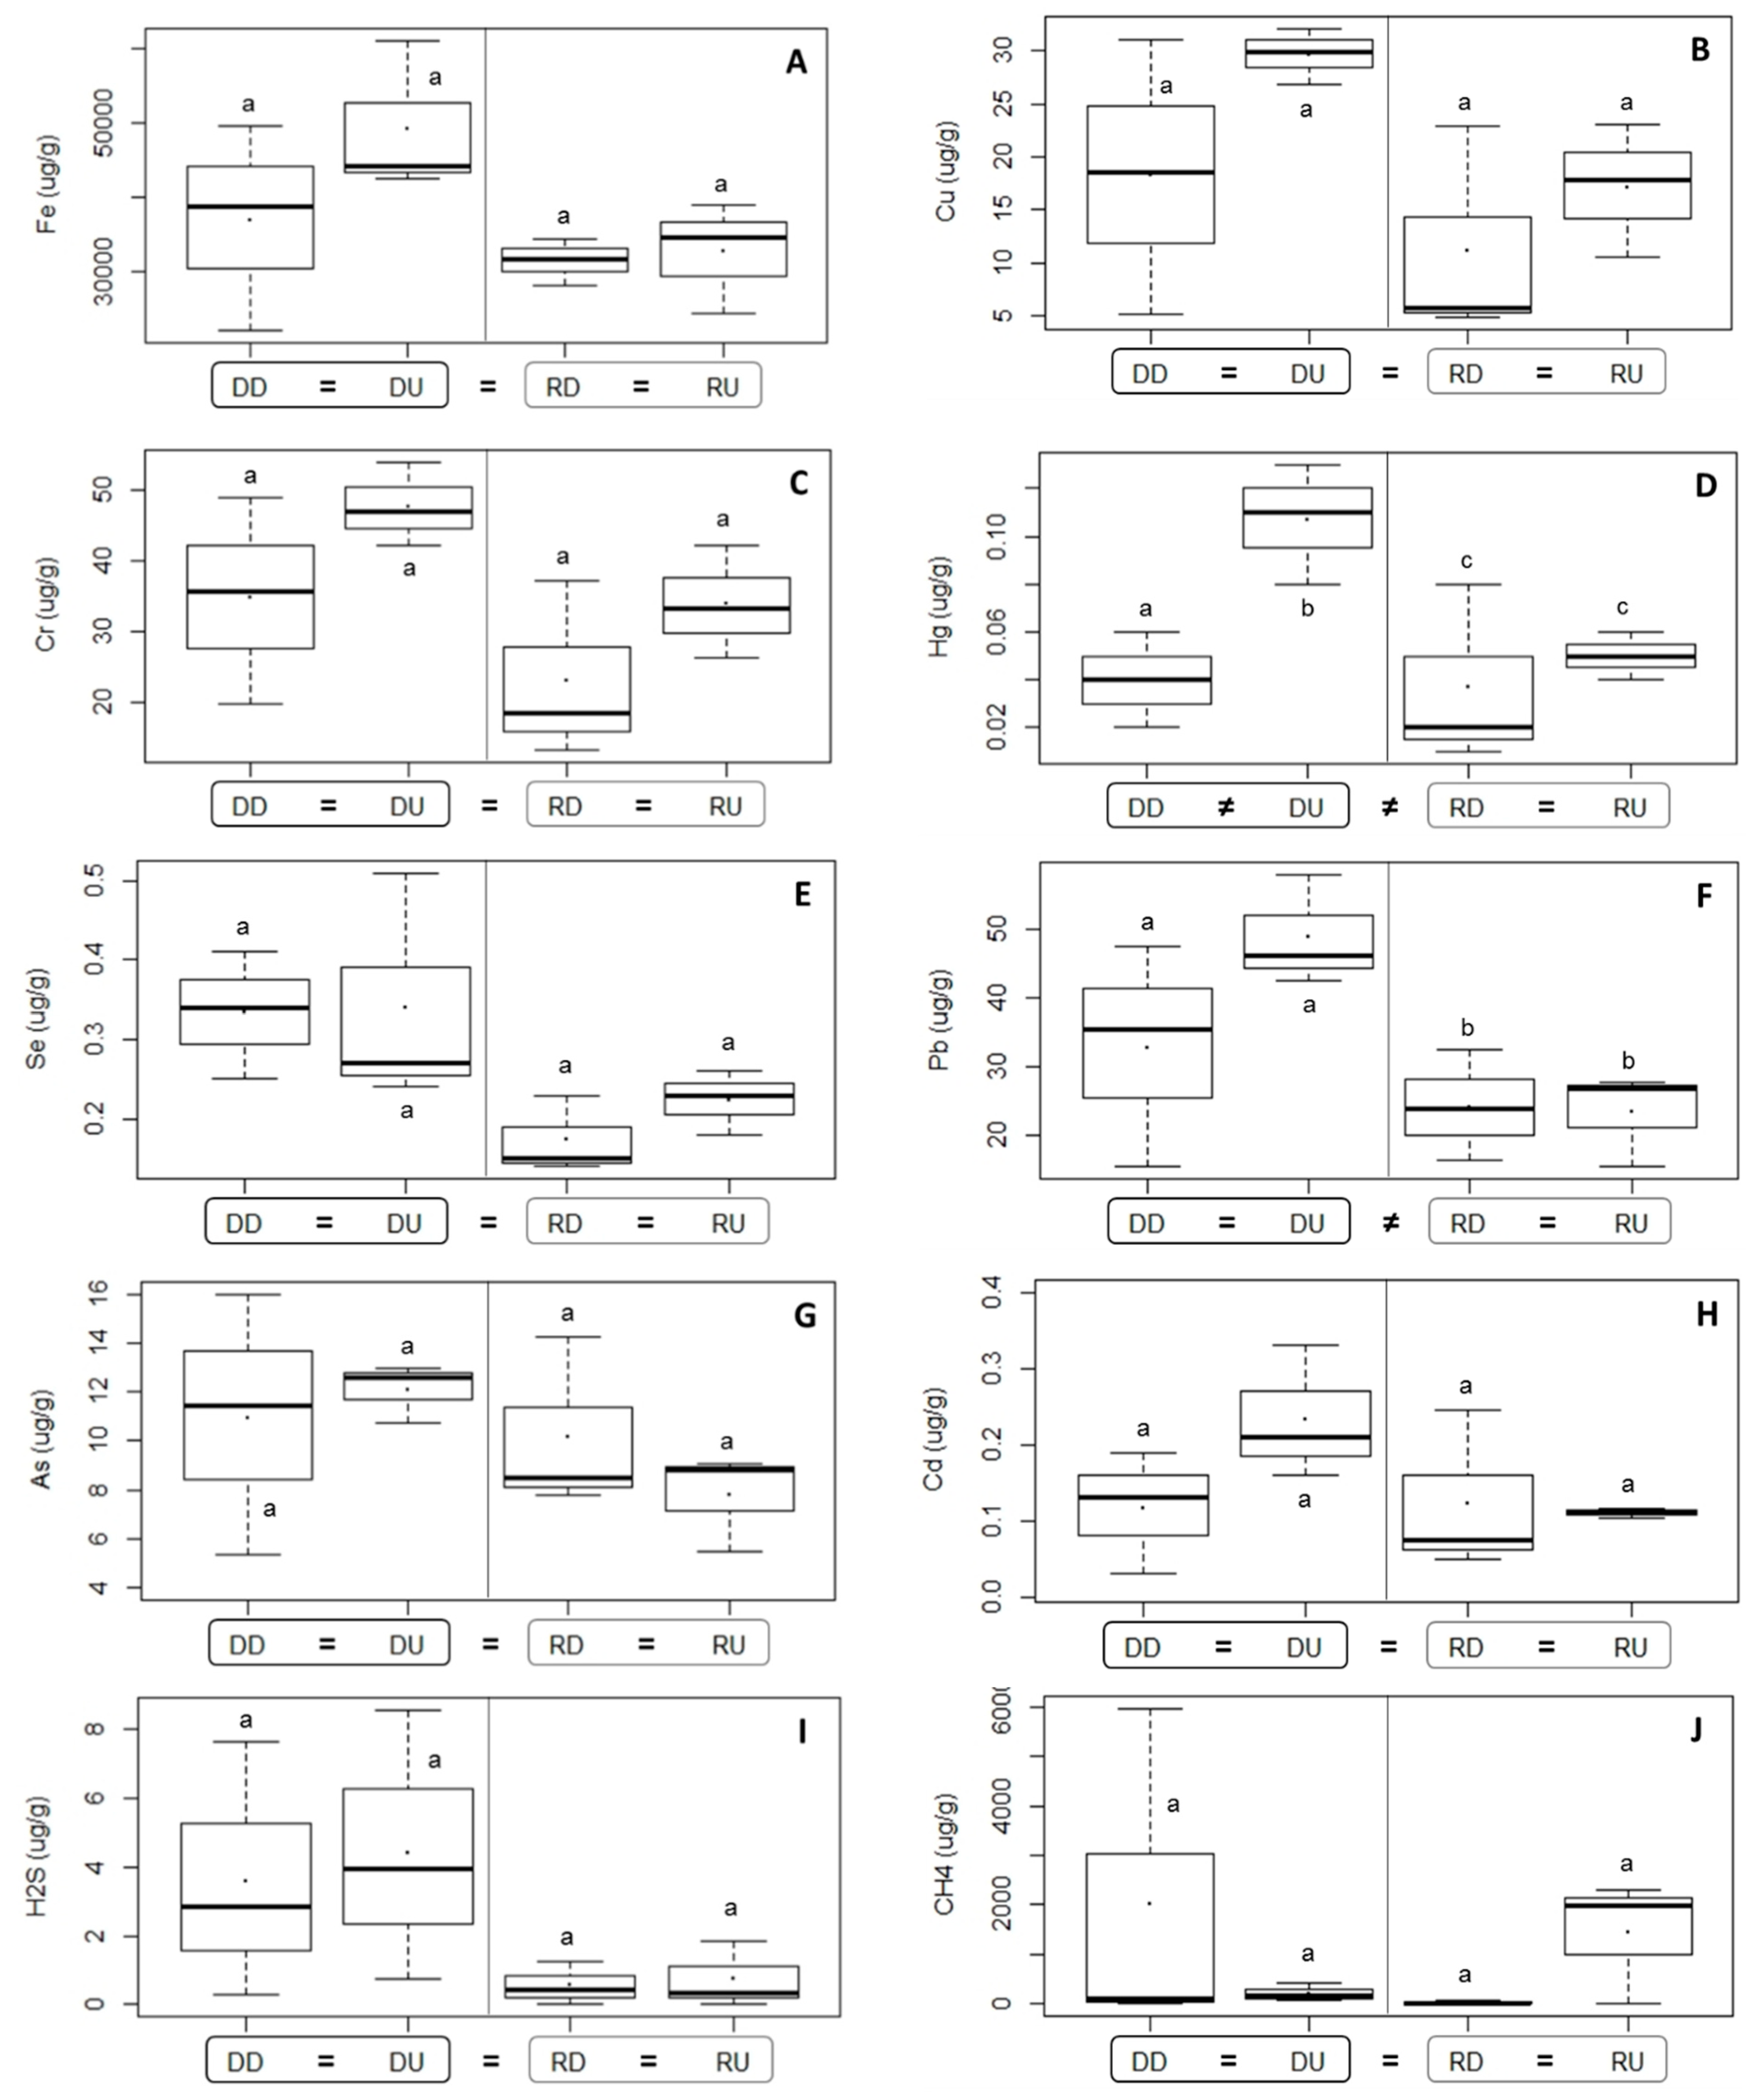
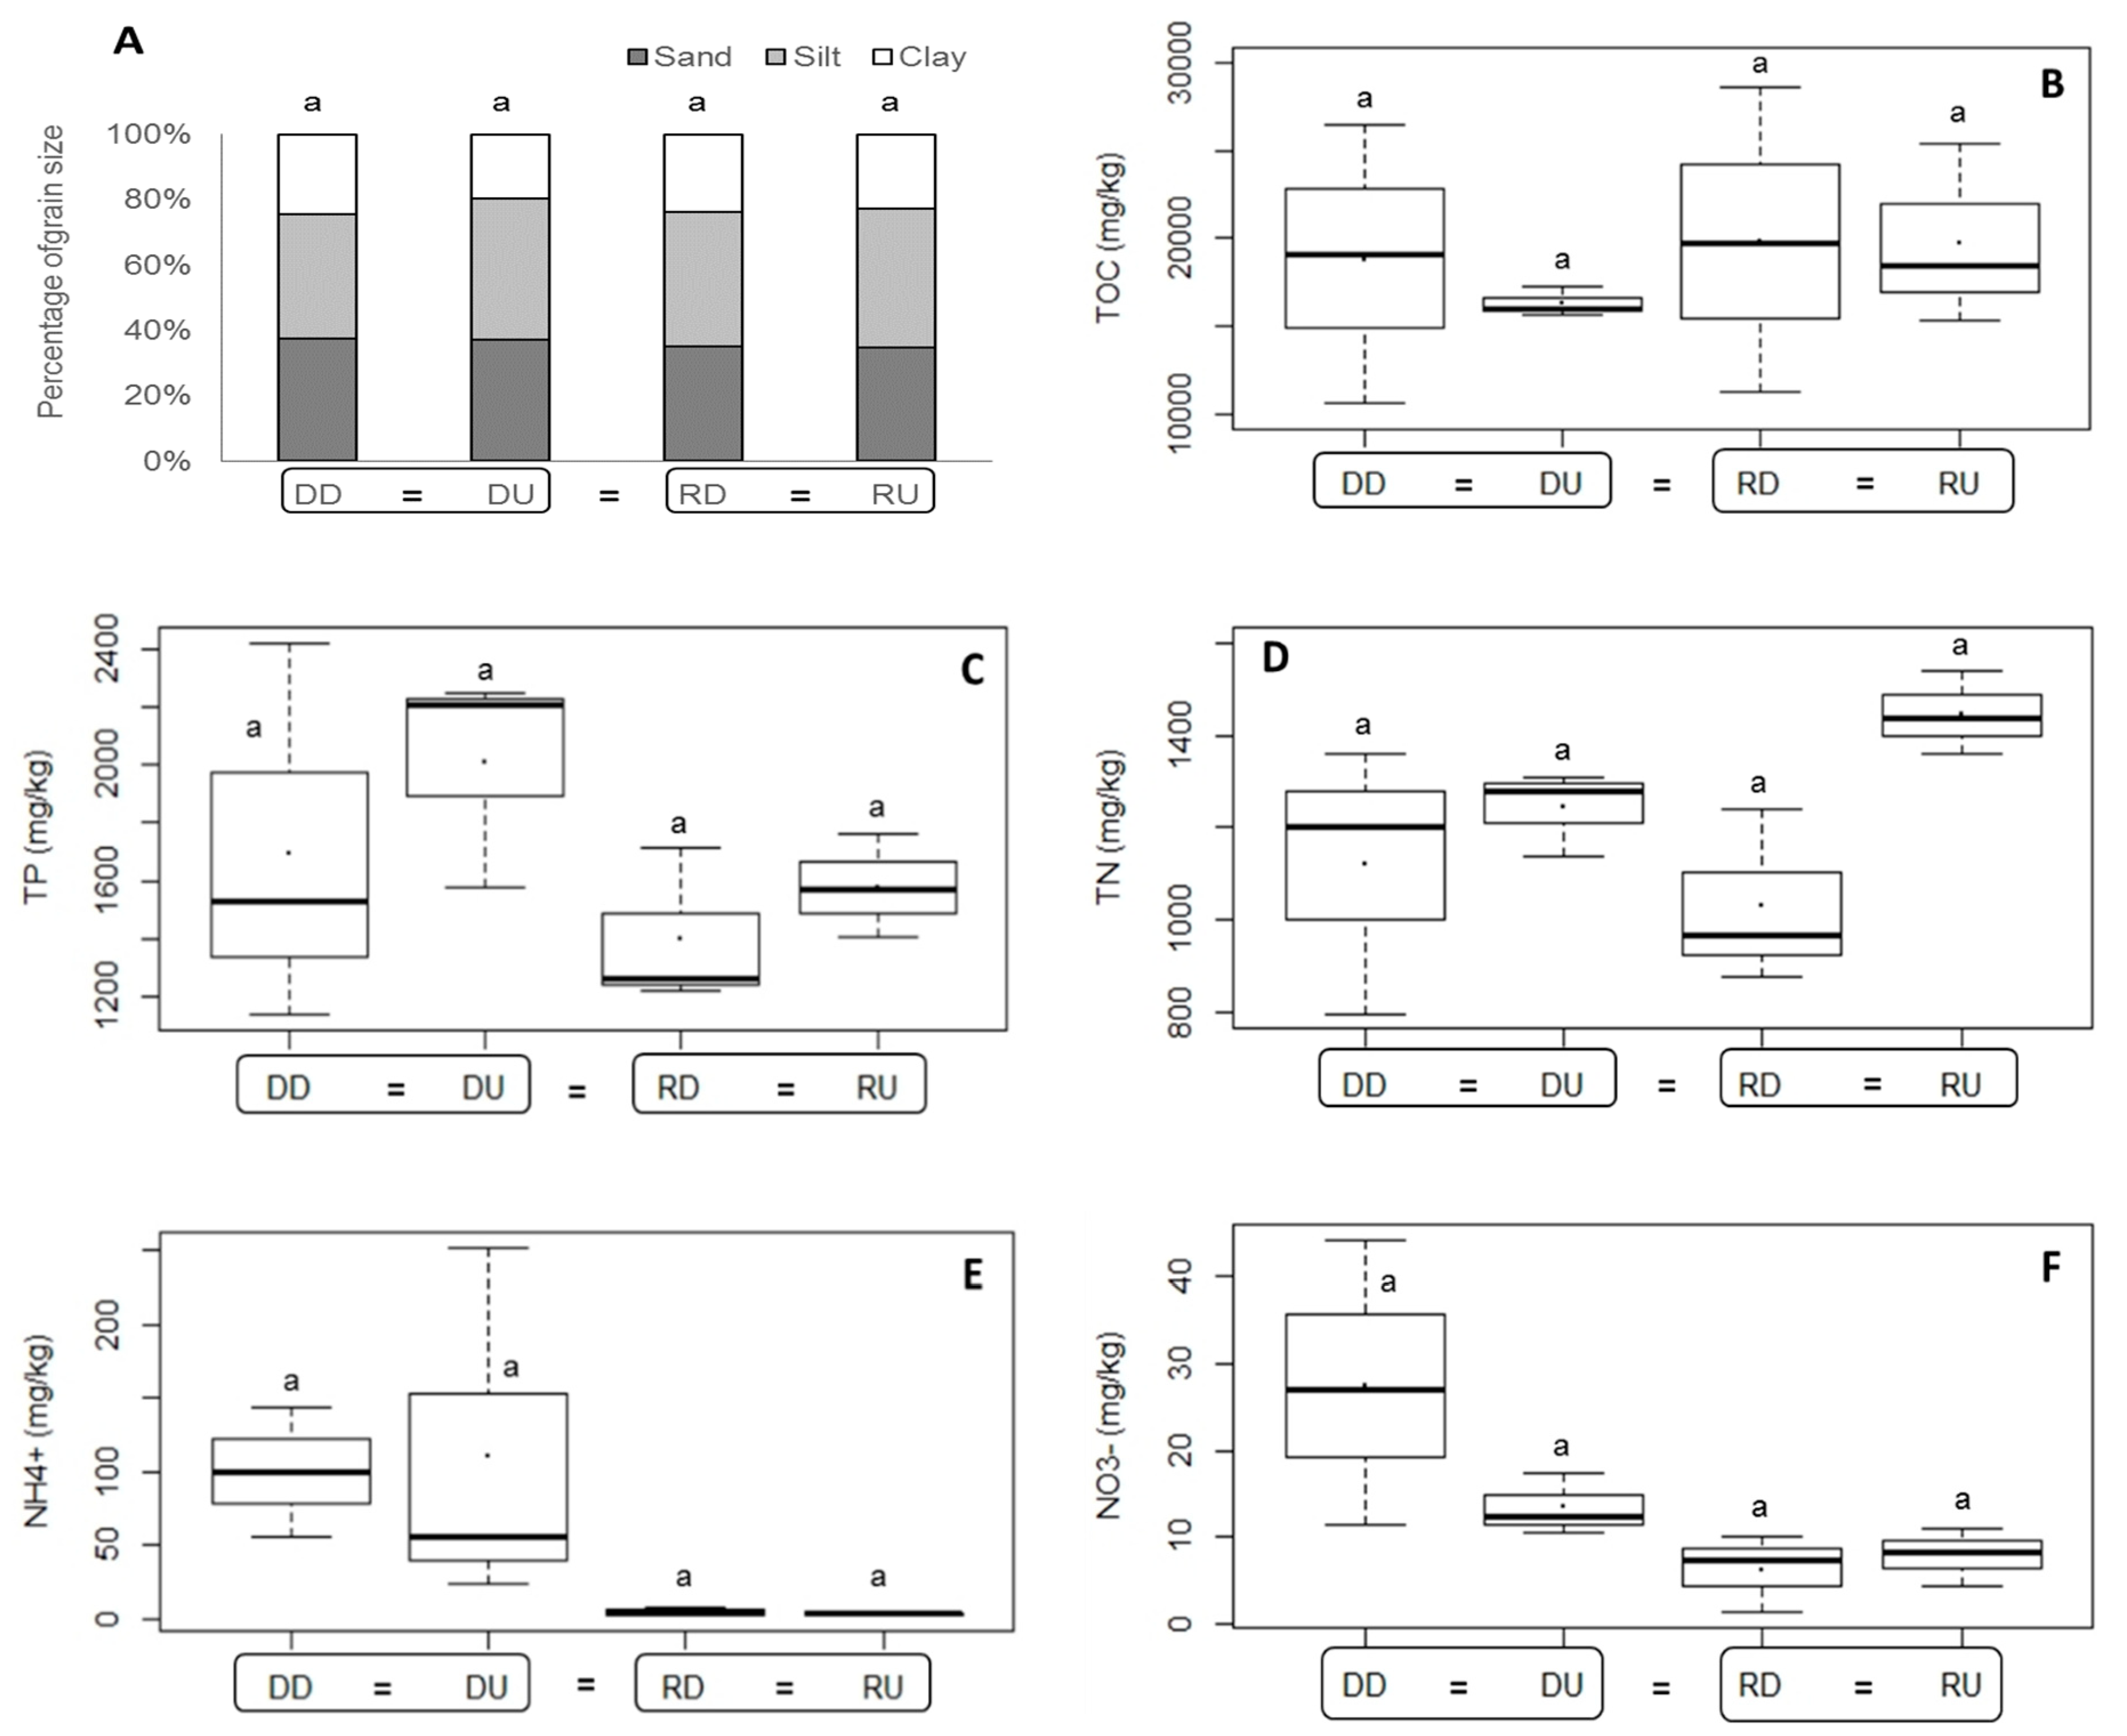
3.1.2. Sediment Environmental Characteristics

The sedimentary variables such as grain size (sand, silt, clay) and nutrient concentrations (TOC, TP, TN, NH4+ and NO3) are presented in Figure A1. They did not show any statistically significant difference between estuaries and estuarine-sections, for either the two-way ANOVA or the permutational PERMANOVA.
The concentrations of heavy metals (Figure 3) in the Ba Lai estuary were higher than those found in Ham Luong. In addition, the values were all highest in DU compared to other estuarine section. The same trend was found in the Ham Luong estuary, although with smaller variations, except for Pb, As and Cd, which showed slightly lower average values than in the RU section. A two-way ANOVA analysis showed significant differences between the two estuaries only for Pb and Hg. The “estuarine-section” factor had a significant effect on the concentration of Hg and the Tukey HSD pairwise comparison showed differences between DD and DU, and between DU and RD. The significant p values are presented in Table 1.
The H2S concentration was higher in Ba Lai than in Ham Luong, and showing a higher variation within the two estuarine sections of the dammed estuary (Figure 3I). The DU showed higher values than the DD part, with values of 3.60 ± 3.75 and 4.43 ± 3.94 ug/g, respectively, while the concentrations for both sections in Ham Luong varied less, with 0.55 ± 0.62 ug/g and 0.74 ± 0.98 ug/g in RD and RU, respectively (Figure 3I). At station level, the highest concentration of H2S was observed in BL4 (8.58 ug/g) and BL3 (7.67 ug/g), which are the two nearest upstream and downstream stations to the Ba Lai dam.
The CH4 concentration was also higher in the Ba Lai than in Ham Luong. In particular, at DD, the CH4 concentration was 2028.78 ug/g, which is almost 10 times higher than in DU (212.76 ug/g), while Ham Luong RU (1428.28 ug/g) contained much higher values of CH4 than RD (23.98 ug/g) (Figure 3J). Nevertheless, within the Ba Lai estuary, again a high variation was observed between stations within each estuarine section, with the highest concentration of CH4 found in station BL3 near the dam (5975.56 ug/g). Additionally, BL4 showed elevated levels of CH4 (418.33 ug/g), however an order of magnitude smaller than in BL3. In the Ham Luong estuary, the highest average values were present in the stations HL6 and HL5 of the upstream part.
Due to the high variation within some estuarine sections, no statistically significant difference was found for both H2S and CH4 concentrations, either for the 2-way ANOVA or for the permutational PERMANOVA analysis.

3.2. Nematode Assemblages in Ba Lai and Ham Luong Estuaries

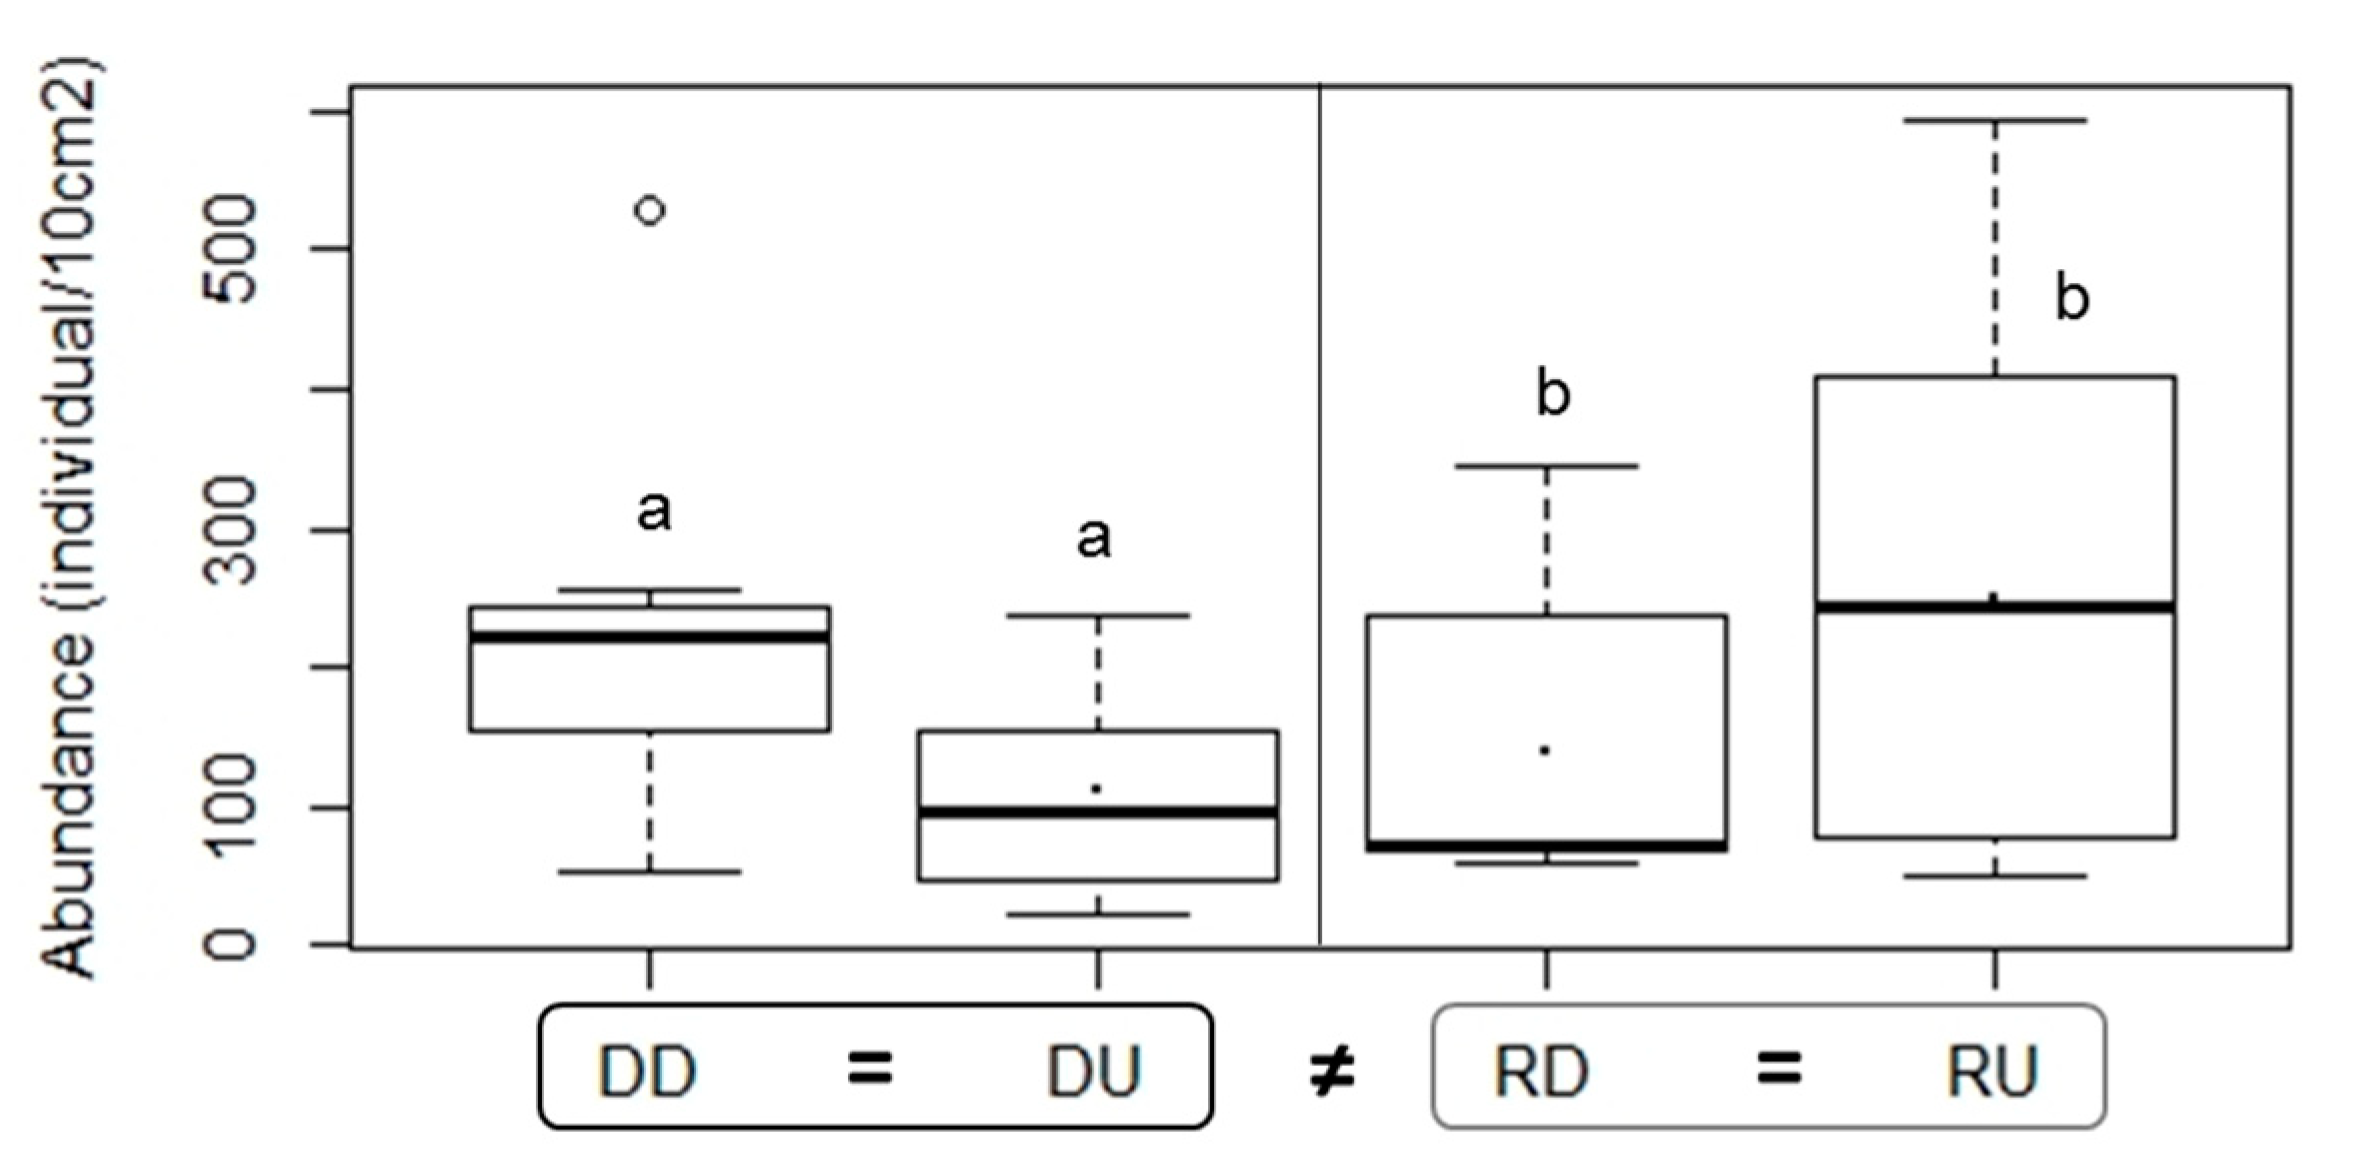
3.2.1. Density of Nematode Communities in Ba Lai and Ham Luong Estuaries

Nematode densities in DU were 111 ± 76 ind./10 cm2, being twice as low as in DD, with 218 ± 138 ind./10 cm2. The opposite pattern was found for Ham Luong, with RU showing 248 ± 195 ind./10 cm2, almost twice as high as the densities at RD (139 ± 109 ind./10 cm2) (Figure 4). A PERMANOVA analysis showed a significant interaction effect on the nematode densities for the estuary and estuarine section (Table 2).

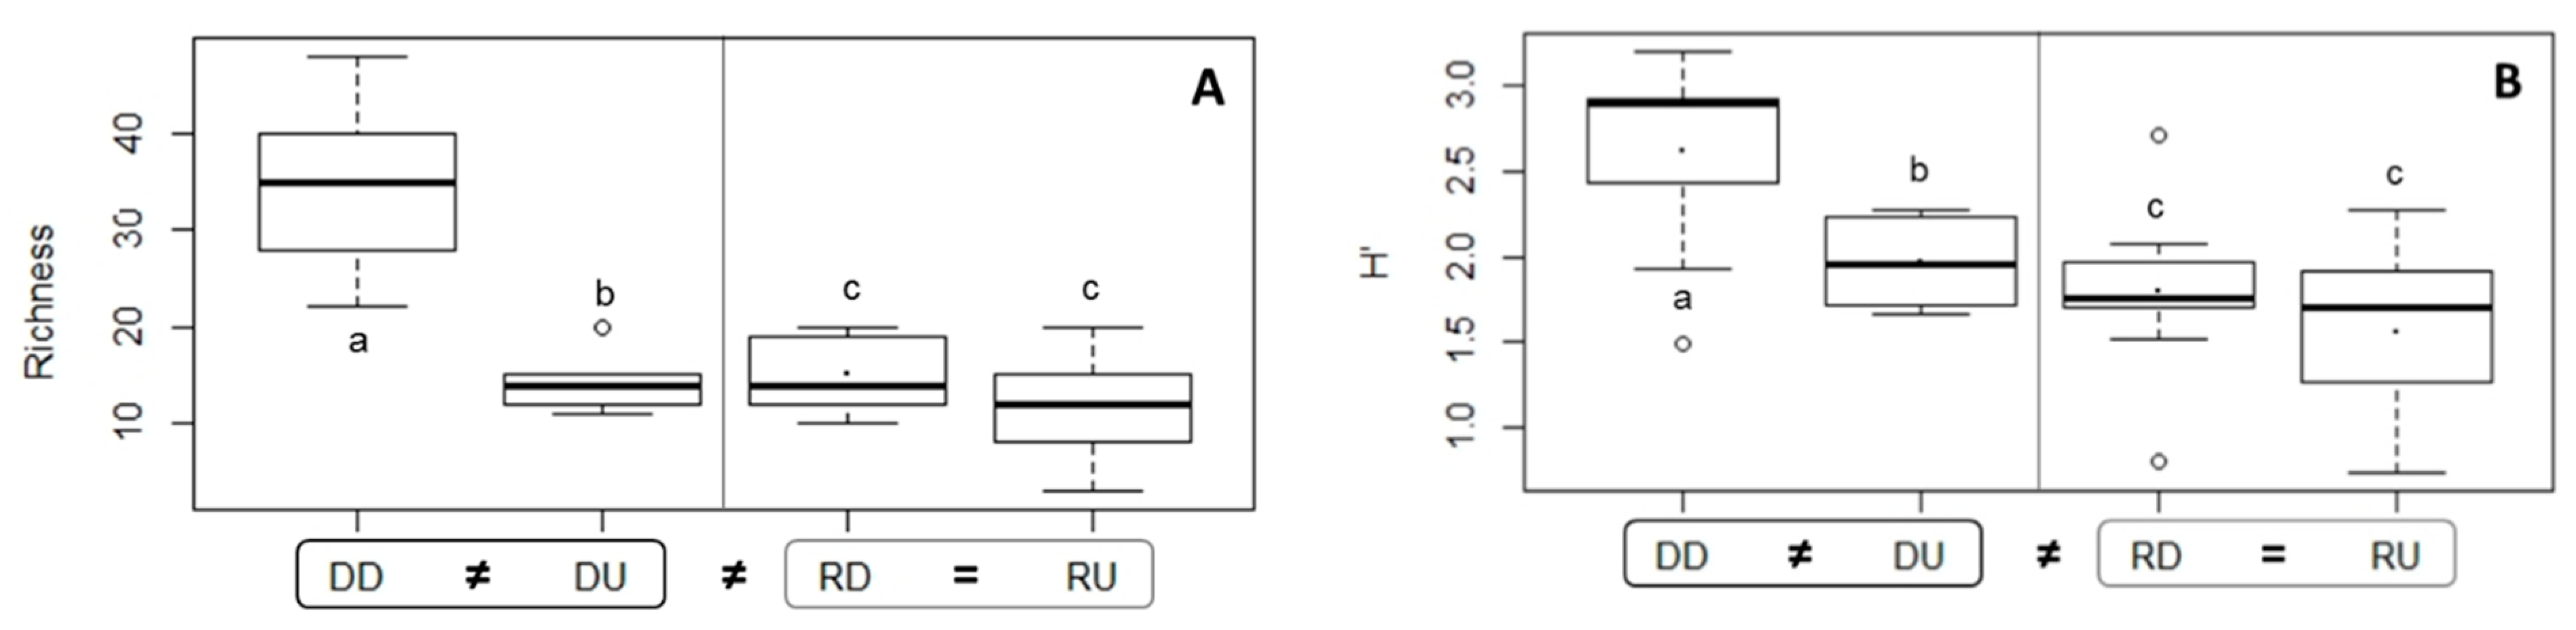
3.2.2. Diversity of Nematode Communities in Ba Lai and Ham Luong Estuaries

The genus richness was highly variable in Ba Lai, with DD containing twice as many genera per sample (35) as DU (14). In Ham Luong, richness was less fluctuating between the two sections, with 15 and 12 genera encountered in RD and RU samples, respectively (Figure 5A). The two-way ANOVA based on richness, followed by a pairwise comparison analysis, showed a significant interaction effect, with significant differences between the pairs DD&DU, DD&RD and DD&RU.
The Shannon–Wiener diversity index (H’) was higher in Ba Lai compared to Ham Luong, while H’ values were lower in upstream sections of both estuaries. The H’ value at DD was 2.62, being significantly higher than in DU (H’ = 1.97) (Figure 5B), while the two sections in Ham Luong showed H’s values of 1.79 and 1.56 in RD and RU respectively. Permutational 2-factor PERMANOVA analysis showed a significant difference between the two estuaries and estuarine section (Table 2, Figure 5B). The pairwise comparison showed differences between DD and DU, between DD and RD, and between DD and RU (Table 2, Figure 5B). No significant interaction effect was found.

3.2.3. Nematode Community Composition in Ba Lai and Ham Luong Estuaries

The nematode communities consisted of taxa belonging to both classes Enoplea and Chromadorea. In total, 144 genera belonging to 51 families and representing 11 orders were identified. Orders included Enoplida, Triplonchida, Dorylaimida, Mononchida, Chromadorida, Desmodora, Desmoscolecida, Araeolaimida, Monhysterida, Plectida, and Rhabditida. The orders Desmoscolecida and Rhabditida were absent in Ham Luong, while all occurred in Ba Lai. The total number of nematode genera observed in the Ba Lai estuary was two times higher than those found in the Ham Luong estuary, representing 129 (47 families, 11 orders) and 57 genera (29 families, 9 orders), respectively. The total number of genera encountered in DD, DU, RD, RU were 125, 33, 45 and 77 genera, respectively.
A PERMANOVA analysis, based on the relative abundance of nematode genus nematode composition, showed a significant effect for both factors “estuary” (68.29%) and “estuarine-section”. Pairwise comparisons showed that all estuarine sections were significantly different. A SIMPER analysis resulted in a percentage of dissimilarity between groups, ranging from 61.45% to 71.76%. The most important genera are responsible for more than 50% of the differences between groups (i.e., between the two estuaries and between each pair of all estuarine sections), and their percentage contribute to the dissimilarities are shown in Table A1. Parodontophora and Theristus were the two major genera responsible for the differences in community composition in terms of abundances between the two estuaries and among estuarine sections.
In general, Parodontophora, Theristus, Daptonema, Terschellingia, Sphaerotheristus, and Viscosia comprised the most abundant genera (represented each by more than 4% of the total relative abundance), and together they contributed 67.48% of the total relative abundance of both estuaries. Parodontophora, Theristus and Daptonema were the most common genera, representing 32.70%, 12.67%, and 8.36% of the total community, respectively.
The eight most abundant genera in each estuarine section are shown in Figure 6. Parodontophora was the dominant genus and contributed more than 26% to the total community in DD, RD and RU, whereas in DU, Theristus was the most abundant genus (26.78%), with a relative abundance which was twice as high that of Parodontophora (13.96%). Theristus and Terschellingia were present in higher percentages in the upstream parts, especially in the DU section of Ba Lai. Parodontophora, nevertheless, was found to be more abundant in the downstream sections. Especially within Ba Lai, in DD Parodontophora was twice as abundant as in DU.

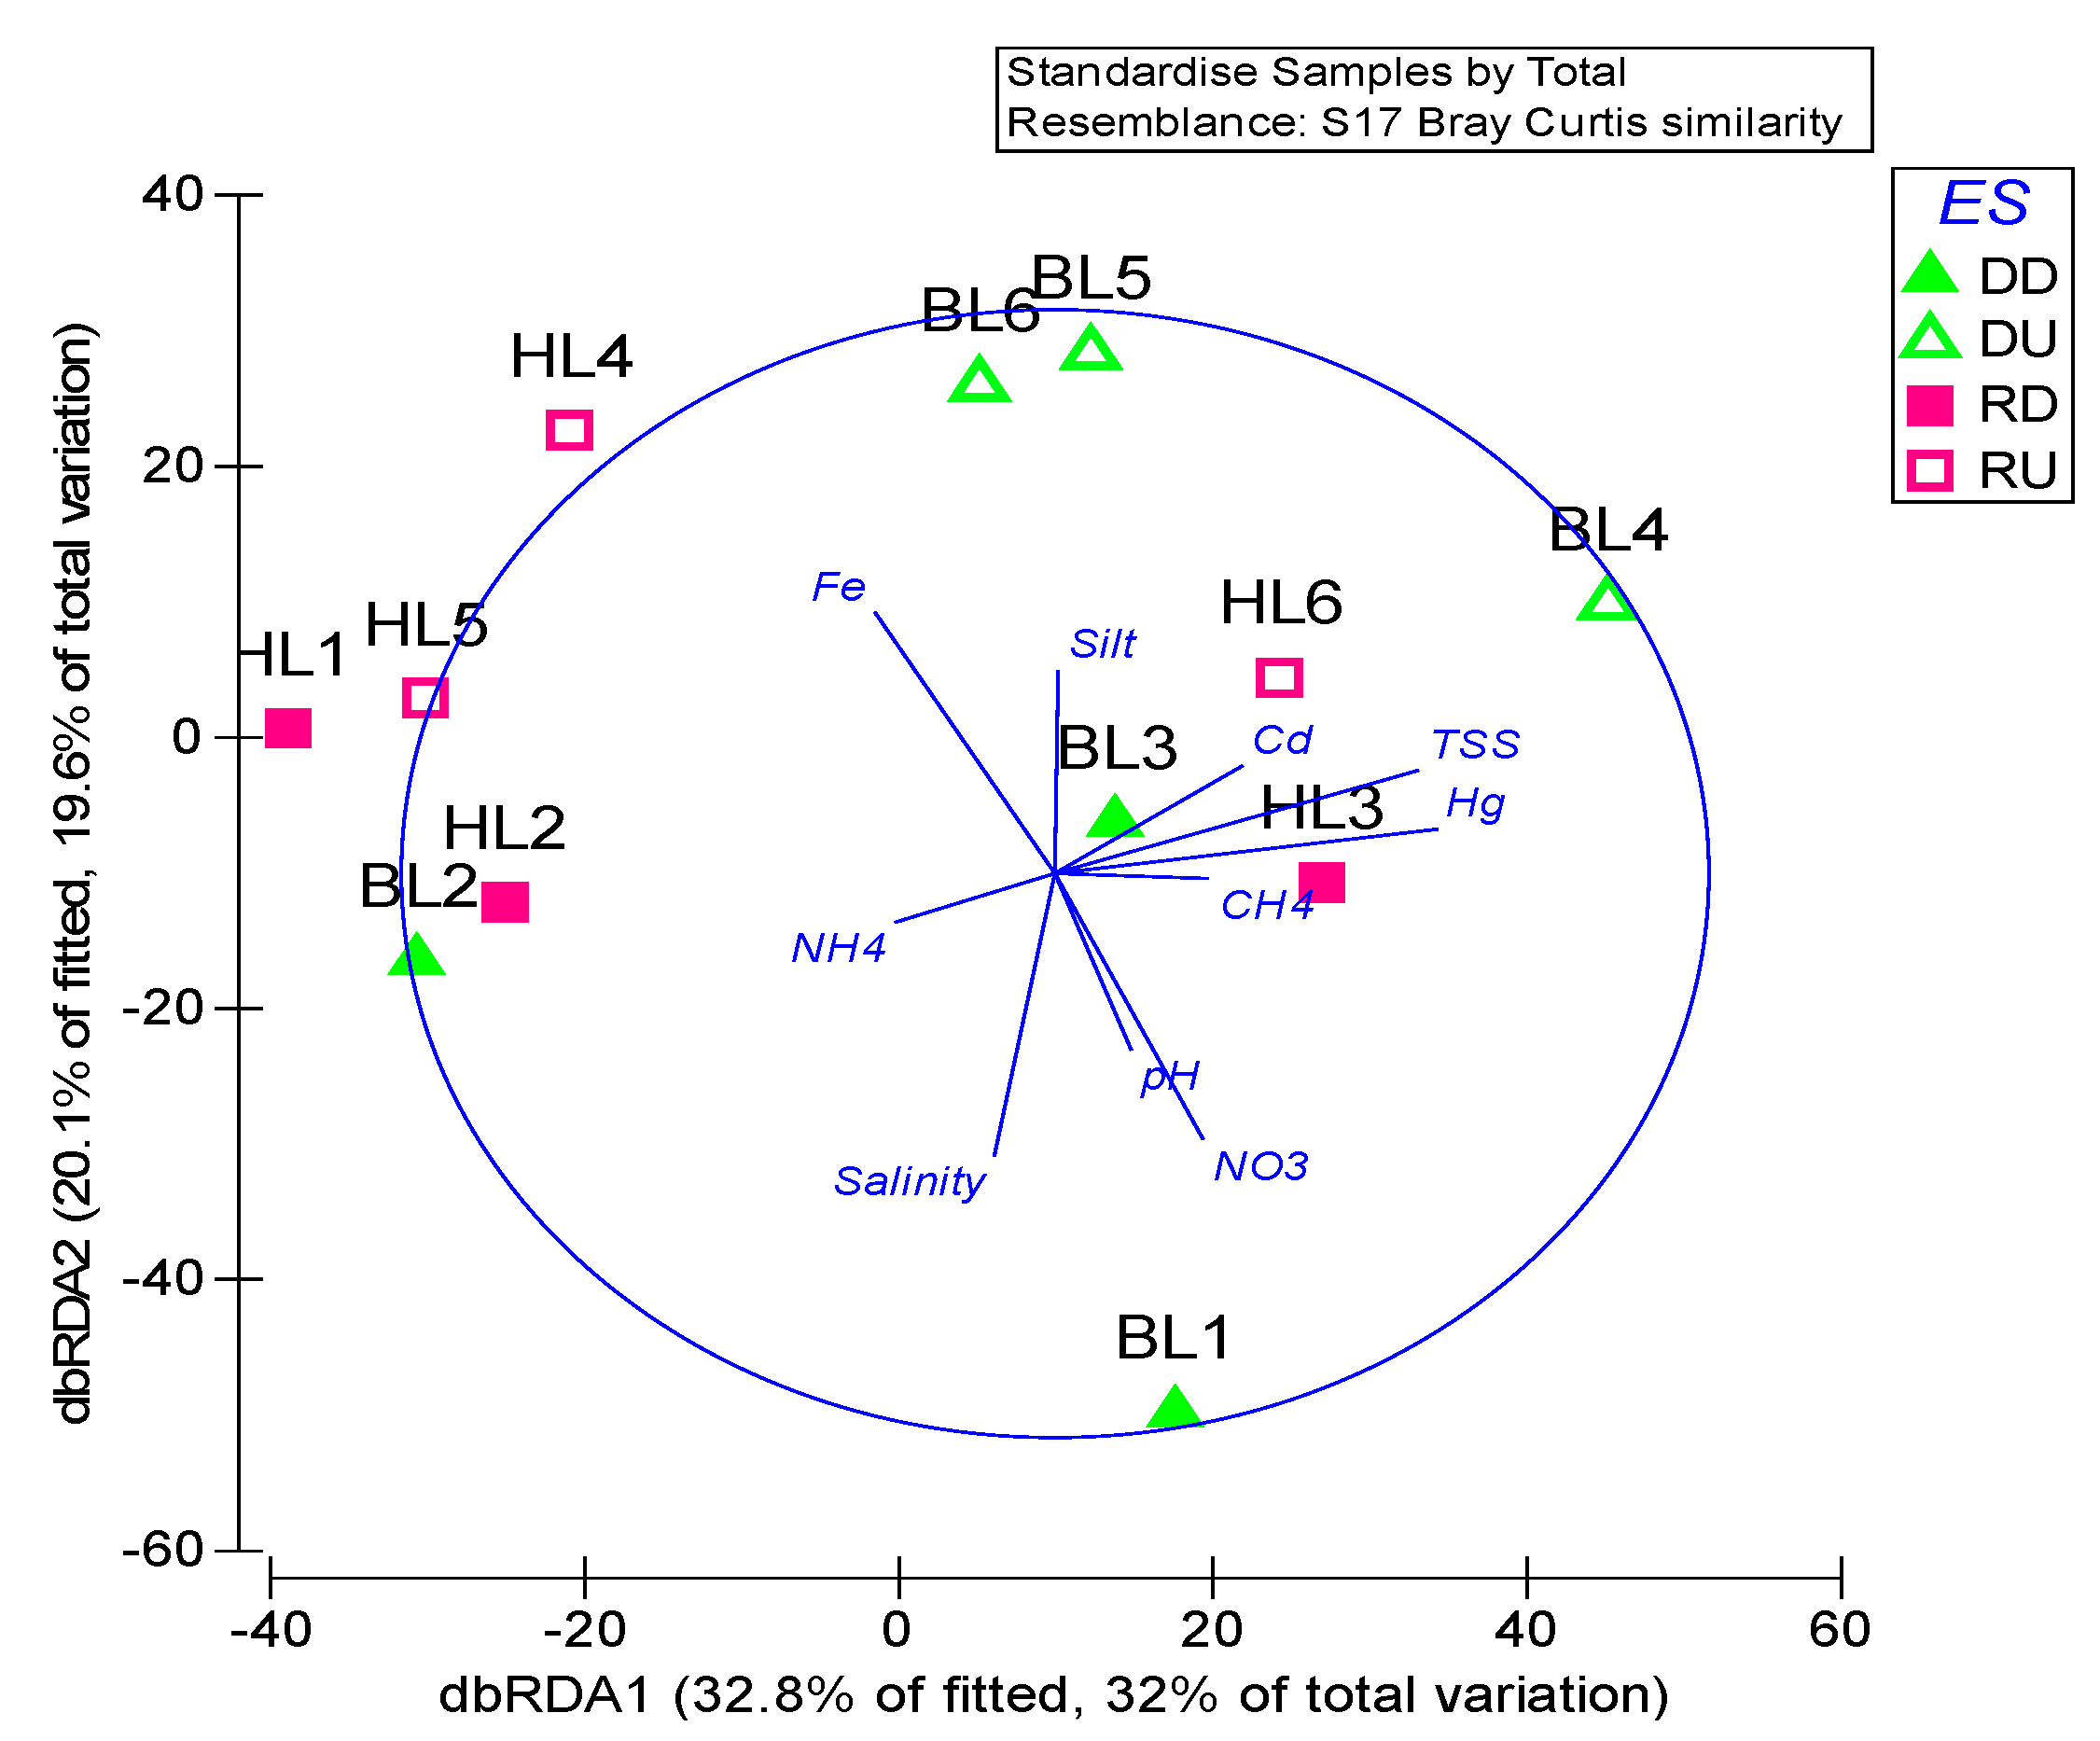
3.3. Correlation Between Nematode Communities and Environmental Variables

Nematode generic richness was positively correlated with pH (p = 0.005, r = 0.753), and negatively correlated with silt proportion in the sediment (p = 0.006, r = −0736). The H’ index showed positive correlations with both pH (p = 0.01, r = 707) and NO3 (p = 0.012, r = 695).
Furthermore, the DISTLM analysis showed that Hg (p = 0.0204), NO3 (p = 0.019) and Fe (p = 0.0348) best explained the observed nematode distribution patterns of genus composition, explaining 49% of the variation. The dbRDA analysis (with axis 1 explaining 32% of the variation and axis 2 explaining 19.6%) illustrated the lack of clear differences between the four estuarine sections (Figure 7).

4. Discussion

4.1. Differences in Environmental Variables Related to Dam Effects

Several environmental variables measured in the overlying water of the Ba Lai estuary showed a different trend than the ones observed for the reference estuary Ham Luong, such as the significantly lower DO values and higher TSS concentrations. The level of DO in the dammed estuary was also lower than in other dam-free branches of the Mekong estuarine system [25], whereas the level of TSS in Ba Lai, especially in the upstream part, was 1.5 times higher than that of the Mekong River system in the dry season of 2017 (61.4 mg/L), and more than twice as high as in the Bassac River (47 mg/L)—one of the two main tributaries of the Mekong River delta [1]. TSS includes all particles which are suspended in water, primarily composed of micro-algae, and organic and mineral particles linked to river input by land erosion, as well as the re-suspension of sediment by the vertical mixing of the water column. In the Mekong River delta, TSS is influenced by both natural and anthropogenic activities, including the release of municipal and domestic waste water, synthetic and organic chemicals from industrial waste, agriculture, aquaculture, construction, and soil erosion [1]. Therefore, the increase in suspended solid loads tends to coincide with a decrease in dissolved oxygen, which could lead to hypoxic stress, which in turn can result in lower abundances, diversity, and survival rates (less viable embryos and larvae) during the development in fish species, as observed for the Notropis girardi in the Arkansas River [13]. Additionally, TSS can also capture heavy metals and nutrients in the water column and might contain high concentrations of contaminants. Once deposited on the bottom, it may disturb the benthic environment and its biota [13]. Deposited sediment coming from upstream has been reported to be associated with contaminants, including heavy metals and other toxic compounds, such as pesticides, which can bioaccumulate in the river bed [54].
The heavy metal contamination also reached higher levels in the Ba Lai estuary, especially at the upstream side in terms of Pb and Hg concentration. The level of Pb in the dammed upstream section (48.84 µg/g) was higher than the lowest effect level (concentrations of Pb from about 31 µg/g can already cause negative effects on the benthic life) as reported by Burton (2002) [55]. The concentration of Hg in the dammed upstream area was also higher than in the natural biosphere reserve part of the protected Can Gio mangrove forests in the southern part of Vietnam. Here, the amount of Hg varied between 0.040 and 0.048 µg/g [56]. It has been previously reported that heavy metals are adsorbed by suspended particulates and in this way they can settle down in the sediment and be remobilized into the food chain [9]. Therefore, it seems plausible that the barrier created by the dam enhanced the accumulation of contaminants especially in the upstream area.
In summary, despite the fact that dam effects are less prominent in terms of siltation and changes in biochemical processes, the presence of the dam is clearly associated with lower DO and higher TSS, Hg and Pb concentrations in the Ba Lai estuary.

4.2. Differences in Nematode Communities Explained by Differences in Environmental Conditions related to Dam Effects

The subtidal nematode assemblages in Ba Lai and Ham Luong estuaries were significantly different between both estuaries and estuarine sections. There were interaction effects on the nematode density and genus richness. The dammed estuary showed lower densities and lower relative abundances of dominant genera, such as Parodontophora, Theristus and Daptonema, but a higher generic richness and H’ index, especially downstream, compared to the reference estuary.
The nematode densities of both the Ba Lai and Ham Luong estuaries were lower than the counts from intertidal areas of the natural Mekong estuaries, which had densities ranging between 88 and 4580 ind./10 cm2 [57,58,59]. They were also lower than those in subtidal areas from other estuaries worldwide (21–17,200 ind./10 cm2) [22,26,27]. The composition of subtidal nematode communities in the Ba Lai estuary was more diverse than Ham Luong, but in the range of the diversity generally found in the intertidal sediments of the Mekong estuarine system (71–230 genera, 20–59 families) [57,58,59] and in other dam-free estuaries worldwide (106–120 genera belonged to 35–40 families) [22,26]. The generic richness was higher than that of Mondego estuary (Portugal), with only 8–19 genera [22].
According to Ngo et al. (2013), the diversity of the intertidal nematodes communities did not show any particularly common trend along the course of the Mekong estuaries in the dry season of 2009 [58]. Tran et al. (2018) reported that the Ba Lai’s upstream part was characterized by significant lower density, generic richness and H’ index than downstream [59]. Our results showed no trend in diversity for the natural Ham Luong estuary. In contrast, the downstream part of Ba Lai estuary was characterized by a significant higher diversity (richness and Shannon–Wiener indices) in comparison to upstream, and even to the Ham Luong estuary. The higher diversity in the downstream part of the Ba Lai is to some extent unexpected, given the presumed impact of the dam. However, the environmental analysis mainly showed that the upstream region of Ba Lai is contaminated with higher TSS and Hg, while the environment of the downstream section does not differ much from the reference estuary. It is possible that the increase in habitat heterogeneity has led to an increase in diversity [60]. The dammed downstream section is also an intermediately disturbed area compared to the reference estuary on one hand, and the more severely impacted upstream part of Ba Lai on the other [61]. Therefore, the increase in diversity in this area could be explained as conforming to the intermediate disturbance hypothesis [61]. An increased diversity, due to intermediate levels of disturbance, can be a plausible explanation here, given that the organic loading of the area initially favors the diversity and densities, but after a certain threshold impoverishes the communities.
Previous studies have documented that salinity, sediment composition and nutrient contents play major roles in driving the distribution pattern and structure of nematode communities in estuaries worldwide [27,62,63,64]. In some cases, the effect of salinity prevails over the role of the sediment composition, being the main limiting factor for species distribution in transitional water systems [23,26,62,65]. Nicholas et al. (1992) studied the effect of the periodic operation (opening and closing) of barrages in the mouth of the Murray River estuary, South Australia, on the survival of the nematode communities. The authors observed a higher mortality of organisms, due to the drastic decrease in salinity by a prolonged discharge of river water when the barrages were opened [32]. In the present work, salinity differed between estuarine sections in the Ba Lai estuary, but no significant correlation was found with the nematode communities. This indicates that other environmental factors played a major role in the differences observed. Our results also showed that pH positively correlated to the genera richness and the H’ index, and the H’ index also increased with the elevation of NO3. The silt content negatively correlated with richness, despite the fact that the sediment composition was not significantly different, but the dammed upstream contained, on average, a higher silt fraction. The accumulation of fine sediment can slow down the mineralization process of organic matter and can be associated with toxic compounds, causing negative effects on organisms and their diversity [66]. The nematode density in the present research did not correlate with any environmental variables, which contrasts with the observation by Adão et al. (2009) and Nguyen et al. (2012), who found higher nematode abundances with increasing organic matter [57,62]. Similar to our findings, nematode density in the Can Gio mangrove forest, a Biosphere Reserve in southern part of Vietnam, were not significantly correlated to any measured environmental variables, such as nutrients, grain size, heavy metal, etc. [67].
The generic composition of the nematode communities was significantly affected by the interaction between nutrients (NO3) and heavy metals (Hg, Fe). Other studies also reported that nutrient content is one of the environmental factors associated with the distribution pattern and structure of nematode communities in estuaries [27,62,63,64]. Until present, the correlation of Hg and Fe in estuarine sediment related to the nematode composition is still not well documented. Similar to our results, Alves et al. (2013) reported that Daptonema was the most dominant genus in subtidal soft sediments of the Mondego estuary (Portugal) [22]. Ngo et al. (2016) also found that Parodontophora was the main genus found in the more silty intertidal upstream parts of the Mekong estuaries. It has been noted that, in estuarine environments, nematode communities are usually comprised of a high number of genera, with only a few dominant ones [26]. In our study, even though differences in relative abundances were reported, Parodontophora and Theristus were the most dominant groups in all parts of both estuaries, reflecting their wide range in salinity tolerance. This is relatively surprising, as they were not in the list of abundant groups in many other studies from European estuaries, such as the Brouage mudflat in France [68], the Thames estuary in the United Kingdom [23] or the Mondego estuary in Portugal [22]. This may indicate that these two genera are possibly specific for tropical brackish environments. Furthermore, while Parodontophora was the prevailing genus in most estuarine sections, Theristus was the most dominant genus in the dammed upstream part, suggesting that this genus is highly tolerant to elevated heavy metal concentrations (especially Hg), low DO and high TSS. Interestingly, the genus Theristus is normally considered as a typical ‘colonizer’, identified as an indicator of organic pollution in the Swartkops estuary of South Africa [69]. Moreover, Terschellingia, as the third most important genus in the dammed upstream part, is reported to be tolerant to pollution and anoxia [22,26].
In conclusion, the presence of the dam seems to have caused differences in the environment, as suggested by the local accumulation of contaminants and oxygen depletion in the Ba Lai estuary. The response of nematode communities to the dam effect was more subtle, with shifts in the density, diversity, presence of dominant genera and community composition. The present communities may be well adapted to the natural organic and oxygen stress in both estuaries, but potentially the dam may continue to drive the Ba Lai’s ecosystem to its tipping point. Therefore, further research is needed and monitoring of the system is a major recommendation from this study.

Author Contributions

All authors have equally contributed to the conceptualization of the idea and the methods used; data acquisition (sampling and samples processing and specimens analyses), N.T.M.Y., T.T.T., N.X.Q, and T.N.B.; statistical analysis and data interpretation, N.T.M.Y., A.V., L.L. and N.X.Q.; project administration, A.V. and N.X.Q.; writing—original draft, N.T.M.Y and A.V; all authors have substantially contributed for writing—review and editing; all authors have read and agreed to the published version of the manuscript.

Funding

This research is funded by the VLIR-TEAM project: "Environmental and socio-economic impact after dam construction for local communities in the Mekong estuarine system: the case of the Ba Lai estuary”.

Acknowledgments

We also would like to express our thankfulness to VLIR-UOS for supporting the funding for this research. We appreciate the support from the Marine Biology Research Group (Ghent University, Belgium) and the Department of Environmental Management and Technology (Institute of Tropical Biology, Vietnam).

Conflicts of Interest

The authors declare no conflict of interest. The funders had no role in the design of the study; in the collection, analyses, or interpretation of data; in the writing of the manuscript, or in the decision to publish the results.

Appendix A

Figure A1. The grain size (sand, silt, clay in graph (A)) and nutrient concentrations (TOC (graph (B)), TP (C), TN (graph (D)), NH4+ (graph (E)) and NO3 (graph (F)) in sediment of Ba Lai and Ham Luong estuary. ▢ point to estuary level. Abbreviations: “DD” = dammed downstream, “DU” = dammed upstream, “RD” = reference downstream, “RU” = reference upstream. Letter a pointed to non-significant differences. “=” sign meant that no significant difference was found.
Diversity 12 00137 g0a1
Table A1. The percentage of contribution of most important genera responsible for dissimilarity in relative abundance between groups based. Percentage dissimilarity (bold) between group (between the two estuaries and between each pair estuarine sections) and contributing percentage of each contributor for the dissimilarity between groups are shown together. Abbreviations: “DD” = dammed downstream, “DU” = dammed upstream, “RD” = reference downstream, “RU”= reference upstream.
Dammed Estuary and Reference Estuary (68.29%)
Parodontophora7.2Metalinhomoeus3.56Monhystrella2.13
Theristus6.33Viscosia3.47Mononchulus2.12
Terschellingia3.92Sphaerotheristus3.21Comesoma1.89
Daptonema3.74Monhystera2.68Desmodora1.89
Rhabdolaimus3.63Mesodorylaimus2.58Halalaimus1.86
DD and DU (71.45%)DD and RD (70.17%)DD and RU (71.76%)
Theristus6.67Parodontophora6.07Parodontophora6.59
Parodontophora5.39Pseudochromadora3.28Theristus5.86
Rhabdolaimus3.48Metalinhomoeus3.15Daptonema3.86
Metalinhomoeus3.25Viscosia3.06Pseudochromadora3.38
Pseudochromadora3.18Theristus2.7Terschellingia3.34
Terschellingia3.02Comesoma2.5Sphaerotheristus3.27
Monhystera2.54Trissonchulus2.48Viscosia2.42
Mesodorylaimus2.16Daptonema2.42Rhabdolaimus2.22
Daptonema2.14Marylynnia2.15Linhystera2.11
Halalaimus2.11Terschellingia2.03Halalaimus2.07
Linhystera2.05Amphimonhystrella2Amphimonhystrella2
Monhystrella2.02Halalaimus1.99Cobbia1.77
Viscosia1.97Rhabdolaimus1.95Oncholaimus1.75
Udonchus1.97Desmodora1.92Mesodorylaimus1.72
Amphimonhystrella1.9Sabatieria1.88Sabatieria1.59
Afrodorylaimus1.76Mesodorylaimus1.86Microlaimus1.52
Sphaerotheristus1.69Linhystera1.81Oxystomina1.49
Cobbia1.67Rhynchonema1.75Desmodora1.49
Mononchulus1.6Sphaerotheristus1.74Spilophorella1.44
Cobbia1.72Achromadora1.44
RD and RU (64.91%)DU and RU (61.45%)DU and RD (69.79%)
Parodontophora9.18Parodontophora9.05Theristus8.41
Theristus8.3Theristus8.65Parodontophora7.34
Daptonema5.77Terschellingia6.2Rhabdolaimus5.35
Viscosia5.57Daptonema5.73Metalinhomoeus5.04
Sphaerotheristus5.04Rhabdolaimus5.24Viscosia4.79
Metalinhomoeus4.69Sphaerotheristus5.21Terschellingia4.4
Comesoma4.34Metalinhomoeus5.08Comesoma3.67
Terschellingia4.31Monhystera4.63Monhystera3.43
Trissonchulus3.9Mesodorylaimus3.68Mesodorylaimus3.24
Daptonema3.2
Trissonchulus3.1

References

  1. MRCS. 2017 Lower Mekong Regional Water Quality Monitoring Report; Mekong River Commission: Vientiane, Lao PDR, 2019; p. 52. [Google Scholar]
  2. Le, A.T.; Le, V.; Du, L.; Tristan, S. Rapid integrated & ecosystem-based assessment of climate change vulnerability & adaptation for Ben Tre Province, Vietnam. J. Sci. Technol. 2014, 52, 287–293. [Google Scholar]
  3. VNCOLD Vietnam National Committee on Large Dam and Water Resources Development (VNCOLD). Available online: http://www.vncold.vn/en/web/default.aspx (accessed on 9 December 2018).
  4. Amanda, A.B.; Bristo, D. Impact of dams on global biodiversity: A scientometric analysis. Neotrop. Biol. Conserv. 2016, 11, 101–109. [Google Scholar]
  5. Diomande, D.; Kpai, N.N.; Kouadio, K.N.; Sébastino, K.; Costa, D.A.; Gourene, G. Spatial distribution and structure of benthic macroinvertebrates in an artificial reservoir: Taabo Lake (Côte d’ Ivoire). Int. J. Biol. Chem. Sci. 2013, 7, 1503–1514. [Google Scholar] [CrossRef] [Green Version]
  6. Oo, A.T.; Van Huylenbroecka, G.; Speelman, S. Differential impacts of an irrigation project: Case study of the Swar Dam Project in Yedashe, Bago region of Myanmar. J. Dev. Agric. Econ. 2017, 9, 178–189. [Google Scholar]
  7. Phan, P.D. Literature Review for the Development of Guideline for Prioritisation of Barriers to Fish Passage in Irrigation Schemes in Vietnam; Research Institute for Aquaculture No. 3: Nha Trang, Vietnam, 2015; p. 38. [Google Scholar]
  8. Wei, G.; Yang, Z.; Cui, B.; Li, B.; Chen, H.; Bai, J.; Dong, S. Impact of Dam Construction on Water Quality and Water Self-Purification Capacity of the Lancang River, China. Water Resour. Manag. 2009, 23, 1763–1780. [Google Scholar] [CrossRef]
  9. Wildi, W. Environmental hazards of dams and reservoirs. Terre Environ. 2010, 88, 187–197. [Google Scholar]
  10. Mattos, L.D.; Kruger, M.L.D.; Affonso, S.L.A.; Perbiche-Neves, G.; Junior, S.P. Small dams also change the benthic macroinvertebrates community in rocky rivers. Acta Limnol. Bras. 2017, 29. [Google Scholar] [CrossRef] [Green Version]
  11. Power, M.E.; Dietrich, W.E.; Finlay, J.C. Dams and Downstream Aquatic Biodiversity: Potential Food Web Consequences of Hydrologic and Geomorphic Change. Environ. Manag. Vol. 1996, 20, 887–895. [Google Scholar] [CrossRef]
  12. Lin, Q. Influence of Dams on River Ecosystem and Its Countermeasures. J. Water Resour. Prot. 2011, 3, 60–66. [Google Scholar] [CrossRef]
  13. Mueller, J.S.; Grabowski, T.B.; Brewer, S.K.; Worthington, T.A.; Mueller, J.S.; Hall, A. Effects of Temperature, Total Dissolved Solids, and Total Suspended Solids on Survival and Development Rate of Larval Arkansas River Shiner. J. Fish Wildl. Manag. 2017, 8, 79–88. [Google Scholar] [CrossRef]
  14. Quevedo, L.; Ibáñez, C.; Caiola, N.; Cid, N.; Hampel, H. Impact of a reservoir system on benthic macroinvertebrate and diatom communities of a large Mediterranean river (lower Ebro river, Catalonia, Spain). Limnetica 2018, 37, 209–228. [Google Scholar]
  15. Ngo, X.Q.; Ngo, T.T.; Nguyen, X.D.; Vanreusel, A. Initial study on impact of Ba Lai dam construction to humanity ecosystem in Binh Dai district, Ben tre province. In Proceedings of the Human Ecology and Sustainable Development from Theory to Practice, Ha Noi, Vietnam, 13 January 2017; pp. 254–274. [Google Scholar]
  16. Nguyen, S.T.; Nguyen, M.H. Study on deposition of Ba Lai estuary, Ben Tre province. J. Sci. Vietnam Natl. Univ. Nat. Sci. Technol. 2011, 1S, 211–217. [Google Scholar]
  17. Bongers, T. The Maturity Index: An Ecological Measure of Environmental Disturbance Based on Nematode Species Composition. Oecologia 1990, 83, 14–19. [Google Scholar] [CrossRef] [PubMed]
  18. Vanreusel, A. Ecology of the free-living marine nematodes from the Voordelta (Southern Bight of the North Sea). I; Species composition and structure of the namatode communities. Cah. Biol. Mar. 1990, 31, 439–462. [Google Scholar]
  19. Moens, T.; Braeckman, U.; Derycke, S.; Fonseca, G.; Gallucci, F.; Gingold, R.; Guilini, K.; Ingels, J.; Leduc, D.; Vanaverbeke, J.; et al. Ecology of free-living marine nematodes. In Handbook of Zoology; De Gruyter: Berlin, Germany, 2013; pp. 109–152. ISBN 9783110274257. [Google Scholar]
  20. Yeates, G.W.; Bongers, T.; De Goede, R.G.; Freckman, D.W.; Georgieva, S.S. Feeding habits in soil nematode families and genera-an outline for soil ecologists. J. Nematol. 1993, 25, 315–331. [Google Scholar]
  21. Yeates, G.W.; Ferris, H.; Moens, T.; Putten, W.H. Van Der The Role of Nematodes in Ecosystem. In Nematodes as Environmental Indicators; CAB International: Wallingford, UK, 2009; 341p, ISBN 9781845933852. [Google Scholar]
  22. Alves, A.S.; Adão, H.; Ferrero, T.J.; Marques, J.C.; Costa, M.J.; Patrício, J. Benthic meiofauna as indicator of ecological changes in estuarine ecosystems: The use of nematodes in ecological quality assessment. Ecol. Indic. 2013, 24, 462–475. [Google Scholar] [CrossRef]
  23. Ferrero, T.J.; Debenham, N.J.; Lambshead, P.J.D. The nematodes of the Thames estuary: Assemblage structure and biodiversity, with a test of Attrill’s linear model. Estuar. Coast. Shelf Sci. 2008, 79, 409–418. [Google Scholar] [CrossRef]
  24. Ngo, X.Q.; Nguyen, N.C.; Vanreusel, A. Nematode morphometry and biomass patterns in relation to community characteristics and environmental variables in the Mekong Delta, Vietnam. Raffles Bull. Zool. 2014, 62, 501–512. [Google Scholar]
  25. Ngo, X.Q.; Nguyen, N.C.; Smol, N.; Prozorova, L.; Vanreusel, A. Intertidal nematode communities in the Mekong estuaries of Vietnam and their potential for biomonitoring. Environ. Monit. Assess. 2016, 188, 91. [Google Scholar]
  26. Soetaert, K.; Vincx, M.; Wittoeck, J.; Tulkens, M. Meiobenthic distribution and nematode community structure in five European estuaries. Hydrobiologia 1995, 311, 185–206. [Google Scholar] [CrossRef]
  27. Smol, N.; Willems, K.A.; Govaere, J.C.R.; Sandee, A.J.J. Composition, distribution and biomass of meiobenthos in the Oosterschelde estuary (SW Netherlands). Hydrobiologia 1994, 282/283, 197–217. [Google Scholar] [CrossRef] [Green Version]
  28. Tita, G.; Vincxy, M.; Desrosiers, G. Size spectra, body width and morphotypes of intertidal nematode: An ecological interpretation. J. Mar. Biol. Assoc. UK 1999, 79, 1007–1015. [Google Scholar] [CrossRef]
  29. Tita, G.; Desrosiers, G.; Vincx, M.; Clément, M. Intertidal meiofauna of the St Lawrence estuary (Quebec, Canada): Diversity, biomass and feeding structure of nematode assemblages. J. Mar. Biol. Assoc. UK 2002, 82, 779–791. [Google Scholar] [CrossRef]
  30. Wojtasik, B. The influence of water power station in Niedzica on littoral zone meiobenthos of Czorsztyński and Sromowiecki dam reservoirs (Pieniny mountains, Poland). Teka Kom. Ochr. Kszt. Środ. Przyr.—OL PAN 2009, 6, 411–423. [Google Scholar]
  31. Georg, W.; Orendt, C.; Höss, S.; Großschartner, M.; Adamek, Z.; Jurajda, P.; Traunspurger, W.; de Deckere, E.; Liefferinge, C. van The macroinvertebrate and nematode community from soft sediments in impounded sections of the river Elbe near Pardubice, Czech Republic. Lauterbornia 2010, 69, 87–105. [Google Scholar]
  32. Nicholas, W.L.; Bird, A.F.; Beech, T.A.; Stewart, A.C. The nematode fauna of the Murray River estuary, South Australia; the effects of the barrages across its mouth. Hydrobiologia 1992, 234, 87–101. [Google Scholar] [CrossRef]
  33. Tiemann, J.S.; Gillette, D.P. Effects of Lowhead Dams on Riffle-Dwelling Fishes and Macroinvertebrates in a Midwestern River. Trans. Am. Fish. Soc. 2004, 133, 705–717. [Google Scholar] [CrossRef]
  34. Montagna, P.A.; Palmer, T.A.; Beseres Pollack, J. Hydrological Changes and Estuarine Dynamics; SpringerBriefs in Environmental Science; Springer: New York, NY, USA, 2013; Volume 8, ISBN 978-1-4614-5832-6. [Google Scholar]
  35. ISO-5667 ISO 5667-3:2018—Water Quality—Sampling—Part 3: Preservation and Handling of Water Samples. Available online: https://www.iso.org/standard/72370.html (accessed on 4 August 2019).
  36. ISO-5667 ISO 5667-12:2017—Water Quality—Sampling—Part 12: Guidance on Sampling of Bottom Sediments from Rivers, Lakes and Estuarine Areas. Available online: https://www.iso.org/standard/59903.html (accessed on 4 August 2019).
  37. Krumbein, W.C. Size Frequency Distributions of Sediments. SEPM J. Sediment. Res. 1934, 4, 65–77. [Google Scholar] [CrossRef]
  38. U.S. EPA Method 3050B: Acid Digestion of Sediments, Sludges, and Soils. J. Jpn. Soc. Bronchol. 1996, 12.
  39. Brown, K.A.; McGreer, E.R.; Taekema, B.; Cullen, J.T. Determination of Total Free Sulphides in Sediment Porewater and Artefacts Related to the Mobility of Mineral Sulphides. Aquat. Geochem. 2011, 17, 821–839. [Google Scholar] [CrossRef]
  40. Vincx, M. Meiofauna in marine and freshwater sediments. In Hall, G.S. Methods for the Examination of Organismal Diversity in Soils and Sediments; CAB International in association with United Nations Educational, Scientific, and Cultural Organization and the International Union of Biological Sciences: Wallingford, UK, 1996; pp. 187–195. ISBN 0851991491. [Google Scholar]
  41. De Grisse, A.T. Redescription ou modification de quelques techniques utilissée dans l’étude des nematodes phytoparasitaires. Meded. Rijksfac. der Landbouveten Gent 1969, 34, 351–369. [Google Scholar]
  42. Schmidt-Rhaesa, A. Gastrotricha, Cycloneuralia and Gnathifera. Volume 2, Nematoda; De Gruyter: Berlin, Germany, 2013; ISBN 9783110274257. [Google Scholar]
  43. Zulini, A. Identification Manual for Freshwater Nematode Genera. In Lecture Book for MSc; Nematology Ghent University: Ghent, Belgium, 2010; p. 112. [Google Scholar]
  44. Abebe, E.; Andrássy, I. The Handbook on Freshwater Nematodes: Ecology and Taxonomy; The CABI Publisher: Wallingford, UK, 2006. [Google Scholar]
  45. Warwick, R.M.; Platt, H.M.; Somerfield, P.J. Free-living Marine Nematodes Part III: Monhysterids; Kermack, D.M., Barnes, R.S.K., Eds.; The Linnean Society of London and the Estuarine & Coastal Sciences Association: London, UK, 1998; ISBN 1 85 153 260 9. [Google Scholar]
  46. Platt, H.M.; Warwick, R.M. Free-living Marine Nematodes. Part I: British Enoplids; Kermack, D.M., Barnes, R.S.K., Eds.; The Linnean Society of London and the Estuarine & Coastal Sciences Association: London, UK, 1983; ISBN 0 521 25422 1. [Google Scholar]
  47. Platt, H.M.; Warwick, R.M. Free-Living Marine Nematodes, Part II: British Chromadorids; Kermack, D.M., Barnes, R.S.K., Eds.; The Linnean Society & The Estuarine & Brackish-Water Sciences Association: London, UK, 1988; ISBN 90 04 085955. [Google Scholar]
  48. Nguyen, V.T. Fauna of Vietnam. Free-living Nematodes Orders Monhysterida, Araeolaimida, Chromadorida, Rhabditida, Enoplida, Mononchida and Dorylaimida; Science Technology: Ha Noi, Vietnam, 2007. [Google Scholar]
  49. Bezerra, T.N.; Decraemer, W.; Eisendle-Flöckner, U.; Hodda, M.; Holovachov, O.; Leduc, D.; Miljutin, D.; Mokievsky, V.; Peña Santiago, R.; Sharma, J.; et al. Nemys: World Database of Nematodes. Available online: http://nemys.ugent.be/ (accessed on 4 August 2019).
  50. Shannon, C.E. A mathematical theory of communication. Bell Syst. Tech. J. 1948, 27, 379–423. [Google Scholar] [CrossRef] [Green Version]
  51. R Core Team. R: A language and Environment for Statistical Computing. Vienna, Austria. 2018. Available online: https//:www.R project/ (accessed on 1 July 2019).
  52. Clarke, K.R.; Warwick, R.M. Change in Marine Communities: An Approach to Statistical Analysis and Interpretation. PRlMER-E Ltd, 2nd ed.; Plymouth. Marine Laboratory: Plymouth, UK, 2001. [Google Scholar]
  53. Benjamini, Y.; Hochberg, Y. Controlling the false discovery rate: A practical and powerful approach to multiple testing. J. R. Stat. Soc. Ser. B 1995, 57, 289–300. [Google Scholar] [CrossRef]
  54. Ongley, E.D. Pollution by sediments. In Control of Water Pollution from Agriculture; Food and Agriculture Organization of the United Nations: Rome, Italy, 1996; pp. 19–37. [Google Scholar]
  55. Burton, G.A. Sediment quality criteria in use around the world. Limnology 2002, 3, 65–75. [Google Scholar] [CrossRef]
  56. Phuong, P.K.; Tu, N.D.; Thanh, N.V. Heavy metals status in sediment at Can Gio mangrove, Ho Chi Minh city, Vietnam. J. Biol. 2011, 33, 81–86. [Google Scholar] [CrossRef] [Green Version]
  57. Nguyen, V.S.; Ngo, X.Q.; Vanreusel, A.; Smol, N. The nematode community distribution in two estuaries of the Mekong delta: Cung Hau and Ham Luong, South Vietnam. J. Biol. 2012, 34, 1–12. [Google Scholar]
  58. Ngo, X.Q.; Smol, N.; Vanreusel, A. The meiofauna distribution in correlation with environmental characteristics in 5 Mekong estuaries, Vietnam. Cah. Biol. Mar. 2013, 54, 71–83. [Google Scholar]
  59. Tran, T.T.; Nguyen, L.Q.L.; Nguyen, T.M.Y.; Vanreusel, A.; Ngo, X.Q. Free-living nematode communities in Ba Lai river, Ben Tre province. Vietnam J. Sci. Technol. 2018, 56, 224–235. [Google Scholar]
  60. Vanreusel, A.; De Groote, A.; Gollner, S.; Bright, M. Ecology and Biogeography of Free-Living Nematodes Associated with Chemosynthetic Environments in the Deep Sea: A Review. PLoS ONE 2010, 5, 16. [Google Scholar] [CrossRef]
  61. Fonseca, G.; Gallucci, F. The need of hypothesis-driven designs and conceptual models in impact assessment studies: An example from the free-living marine nematodes. Ecol. Indic. 2016, 71, 79–86. [Google Scholar] [CrossRef]
  62. Adão, H.; Alves, A.S.; Patrício, J.; Neto, J.M.; Costa, M.J.; Marques, J.C. Spatial distribution of subtidal Nematoda communities along the salinity gradient in southern European estuaries. Acta Oecologica 2009, 35, 287–300. [Google Scholar] [CrossRef]
  63. Heip, C.; Vincx, M.; Vranken, G. The Ecology of Marine Nematodes. Oceanogr. Mar. Biol. 1985, 23, 399–489. [Google Scholar]
  64. Schratzberger, M.; Warr, K.; Rogers, S.I. Functional diversity of nematode communities in the southwestern North Sea. Mar. Environ. Res. Elsevier 2007, 63, 368–389. [Google Scholar] [CrossRef] [Green Version]
  65. Attrill, M.J. A testable in estuaries linear model for diversity trends. J. Anim. Ecol. 2002, 71, 262–269. [Google Scholar] [CrossRef]
  66. Vanaverbeke, J.; Merckx, B.; Degraer, S.; Vincx, M. Sediment-related distribution patterns of nematodes and macrofauna: Two sides of the benthic coin? Mar. Environ. Res. 2010, 71, 31–40. [Google Scholar] [CrossRef] [PubMed]
  67. Nguyen, D.T. Seasonal and Spatial Patterns in Meiofauna Community Structure of the Can Gio Mangrove Forest (Vietnam) with a Focus on Nematoda and Their Role as Bioindicator; Ghent University: Ghent, Belgium, 2009; 242p. [Google Scholar]
  68. Rzeznik-Orignac, J.; Fichet, D.; Boucher, G. Spatio-temporal structure of the nematode assemblages of the Brouage mudflat (Marennes Oléron, France). Estuar. Coast. Shelf Sci. 2003, 58, 77–88. [Google Scholar] [CrossRef]
  69. Gyedu-Ababio, T.K.; Furstenberg, J.P.; Baird, D.; Vanreusel, A. Nematodes as indicators of pollution: A case study from the Swartkops River system, South Africa. Hydrobiologia 1999, 397, 155–169. [Google Scholar] [CrossRef]
Figure 1. Sampling locations in the Ba Lai and Ham Luong estuary, Ben Tre province, Vietnam.
Diversity 12 00137 g001
Figure 2. Box and whisker plots and mean values (.) for salinity (A) and TDS (B), pH (C), DO (D) and TSS (E) in the water column of the estuarine sections. ▢ point to estuary level. Abbreviations: “DD” = dammed downstream, “DU” = dammed upstream, “RD” = reference downstream, “RU” = reference upstream. Letters a and b pointed to significant differences. “≠” sign indicated the significant differences between 2 estuaries or/and estuarine sections within an estuary, while “=” sign meant that no significant difference was found.
Diversity 12 00137 g002aDiversity 12 00137 g002b
Figure 3. Box and whisker plots and mean values (.) for heavy metals including Fe (A), Cu (B), Cr (C), Hg (D), Se (E), Pb (F), As (G), Cd (H), H2S (I) and CH4 (J) concentration in sediment of the estuarine sections. ▢ point to estuary level. Abbreviations: “DD” = dammed downstream, “DU” = dammed upstream, “RD” = reference downstream, “RU” = reference upstream. Letters a, b and c refer to significant differences. “≠” sign indicated for the significant differences between 2 estuaries or/and estuarine sections within an estuary, while “=” sign meant that no significant difference was found.
Diversity 12 00137 g003
Figure 4. Box and whisker plots and mean values (.) for nematode densities of the estuarine sections. ▢ point to estuary level. Abbreviations: “DD” = dammed downstream, “DU” = dammed upstream, “RD” = reference downstream, “RU” = reference upstream. Letters a and b pointed to significant differences. “≠” sign indicated for the significant differences between 2 estuaries, while “=” sign meant that no significant difference was found.
Diversity 12 00137 g004
Figure 5. Box and whisker plots and mean values (.) for the richness (A) and Shannon–Wiener index (B) of nematode community of estuarine sections. ▢ point to estuary level. Abbreviations: “DD” = dammed downstream, “DU” = dammed upstream, “RD” = reference downstream, “RU” = reference upstream. Letters a, b and c pointed to significant differences. “≠” sign indicated for the significant differences between 2 estuaries or/and estuarine sections within an estuary, while “=” sign meant that no significant difference was found.
Diversity 12 00137 g005
Figure 6. The percentage of the eight most abundant genera in each “estuarine section” (DD, DU, RD and RU), as identified by the SIMPER analysis. Abbreviations: “DD” = dammed downstream, “DU” = dammed upstream, “RD” = reference downstream, “RU” = reference upstream.
Diversity 12 00137 g006
Figure 7. The dbRDA plot on the correlation between nematode generic composition on abundance with environment variables for all stations of estuarine sections. Abbreviations: (Es: estuarine-section), “DD” = dammed downstream, “DU” = dammed upstream, “RD” = reference downstream, “RU” = reference upstream.
Diversity 12 00137 g007
Table 1. The significant p values generated from ANVOVA / permutational PERMANOVA and post hoc comparison analyses for environmental variables (pe: the significant estuary effects, ps: estuarine-section effect. “≠” sign indicated for the significant differences).
P Value
VariablepepsPost Hoc Test
Salinity 0.028DD ≠ DU: 0.034, DU ≠ RD: 0.035
pH 0.035DD ≠ RU: 0.034, RD ≠ RU: 0.048
DO0.0370.026
TSS0.034
TDS 0.028DD ≠ DU: 0.034, DU ≠ RD: 0.035
Pb0.035
Hg0.0350.034DD ≠ DU: 0.049, DU ≠ RD: 0.044
Table 2. The significant p values generated from ANVOVA / permutational PERMANOVA and pairwise comparison analyses for characteristics of nematode communities. (pe&s: the significant interaction effect of both factors estuary and estuarine-section, pe: the significant estuary effects, ps: estuarine-section effect. “≠” sign indicated for the significant differences).
Variablep Value
pe&spepsPost hoc Test
Density0.0466 0.028DD ≠ DU: 0.034,
DU ≠ RD: 0.035
Genus richness0.0466 0.035DD ≠ DU: 0.0001,
DD ≠ RD: 0.00026,
DD ≠ RU: 0.000003
H’ 0.00150.026DD ≠ DU: 0.014,
DD ≠ RD: 0.0065,
DD ≠ RU: 0.0025
Genus composition
(square-root transformation)
0.00030.0001DD ≠ DU: 0.0001,
DD ≠ RD: 0.0002,
DD ≠ RU: 0.0001,
DU ≠ RD: 0.0003,
DU ≠ RU: 0.0039,
RD ≠ RU: 0.0001

