USA Wind Energy-Caused Bat Fatalities Increase with Shorter Fatality Search Intervals


3108 Finch Street, Davis, CA 95616, USA
Diversity 2020, 12(3), 98; https://doi.org/10.3390/d12030098
Submission received: 19 February 2020
/
Revised: 9 March 2020
/
Accepted: 10 March 2020
/
Published: 12 March 2020
(This article belongs to the Special Issue Impacts of Pressure on Bat Populations)
Abstract
:Wind turbine collision fatalities of bats have likely increased with the rapid expansion of installed wind energy capacity in the USA since the last national-level fatality estimates were generated in 2012. An assumed linear increase of fatalities with installed capacity would expand my estimate of bat fatalities across the USA from 0.89 million in 2012 to 1.11 million in 2014 and to 1.72 million in 2019. However, this assumed linear relationship could have been invalidated by shifts in turbine size, tower height, fatality search interval during monitoring, and regional variation in bat fatalities. I tested for effects of these factors in fatality monitoring reports through 2014. I found no significant relationship between bat fatality rates and wind turbine size. Bat fatality rates increased with increasing tower height, but this increase mirrored the increase in fatality rates with shortened fatality search intervals that accompanied the increase in tower heights. Regional weighting of mean project-level bat fatalities increased the national-level estimate 17% to 1.3 (95% CI: 0.15–3.0) million. After I restricted the estimate’s basis to project-level fatality rates that were estimated from fatality search intervals <10 days, my estimate increased by another 71% to 2.22 (95% CI: 1.77–2.72) million bat fatalities in the USA’s lower 48 states in 2014. Project-level fatality estimates based on search intervals <10 days were, on average, eight times higher than estimates based on longer search intervals. Shorter search intervals detected more small-bodied species, which contributed to a larger all-bat fatality estimate.
1. Introduction
As wind energy expands worldwide, bats are increasingly at risk of deadly encounters with wind turbines. The most recent effort to assess large-scale wind energy impacts on bats was in 2013, when several papers synthesized reports of fatality monitoring across North America. One predicted 196,190 to 395,886 bat fatalities at US and Canadian wind projects in 2012 [1]. Two later studies, both based on a larger accumulation of fatality monitoring reports, estimated the numbers of bats killed by US wind turbines in 2012 to have been 683,910 [2] and 888,036 (90% CI: 384,643–1,391,428) [3]. The installed capacity of USA wind energy was 51,630 megawatts (MW) in 2012, but capacity increased every year to 64,485.5 MW in 2014 and to 100,125 MW by September 2019 [4]. Annual fatality numbers most likely increased with installed wind energy capacity. However, an increasing proportion of fatality monitoring reports have not been made publicly available since 2010. There has been no follow-up to the 2012 USA-wide and USA-Canada estimates.
The utility of national estimates of wind turbine-caused bat fatalities was recently questioned: “Species-specific levels of fatality at wind energy facilities are more useful for regulatory decisions and conservation planning related to wind energy than the cumulative national estimates that garner more attention” [5]. However, species-specific estimates of fatalities at individual projects are largely interpreted relative to other estimates, including those at regional or national levels. Due to the fact that project-level estimates are used to generate the national estimate, problems with accuracy at the project level can be magnified at the national level. Estimating the regional or national levels of wind energy-caused mortality serves as an opportunity to focus attention on inter-project variation in fatality monitoring methods, estimation methods, and assumptions [3,6]. For example, national-level estimates have been criticized for potential regional bias [5]. In lieu of a national sampling program, national-level estimates are founded on available fatality monitoring reports that might over- or under-represent particular regions over others, relative to the distribution of wind energy. This potential bias was in fact revealed in efforts to make national estimates [3,7]. So long as bat fatality estimation remains of questionable accuracy at the national level, project-specific fatality estimates remain of questionable comparability. Yet, comparability of bat fatality estimates has often been assumed among wind projects [8,9,10,11,12,13]) and between wind energy and other anthropogenic sources of bat mortality [5,8,9].
Prior to synthesizing project-level fatality estimates for making national estimates [3], multiple sources of uncertainty and bias had been overlooked. Wind turbine size and tower height vary among projects. Fatality search interval, maximum search radius, and monitoring duration vary. Searcher detection trials and carcass persistence trials vary in methodology and in their accuracy in estimating the proportion of carcasses not found during fatality monitoring. Even the fatality metric has varied. Research on the effects of these sources of uncertainty continued since 2012, while the installed wind energy capacity continued to increase across the USA.
The goal of this study was to compare fatality rates from available reports of post-construction fatality monitoring of bats in USA and Canada through 2014. By improving the comparability of project-level fatality rates, one objective was to test whether the trend toward installing larger wind turbines on taller towers might increase fatality rates [11]. Another objective was to test whether the shorter fatality search intervals implemented at projects with turbines on taller towers might increase fatality rates. A third objective was to weight fatality estimates regionally to minimize regional bias in national-level fatality estimation. To improve comparability, I independently estimated fatality rates from the reported data, using consistent adjustment factors, and I expanded them to the 65,874 MW of installed capacity of wind energy in the USA’s lower 48 states in 2014.
2. Materials and Methods
I collected and reviewed all publicly available reports of bat fatality monitoring at North American wind-energy projects through 2014, and which met my reporting standards [14,15,16,17,18,19,20,21,22,23,24,25,26,27,28,29,30,31,32,33,34,35,36,37,38,39,40,41,42,43,44,45,46,47,48,49,50,51,52,53,54,55,56,57,58,59,60,61,62,63,64,65,66,67,68,69,70,71,72,73,74,75,76,77,78,79,80,81,82,83,84,85,86,87,88,89,90,91,92,93,94,95,96,97,98,99,100,101,102,103,104,105,106,107,108]. My reporting standards for fatality estimates included the reporting of fatality data, along with descriptions of specific wind project and fatality monitoring attributes I needed for independent estimation of fatalities (Table 1).
I independently estimated fatality rates from data in monitoring reports, using a common estimator for the purpose of removing variation due to differing assumptions among the available estimators. I relied on a simple fatality estimator [3,109]:
where was the fatality estimate from the number of found fatalities, F, divided by the product of terms that represented fatalities not found during monitoring. Values for S and RC were typically calculated from results of independent trials performed, in conjunction with fatality monitoring [3], where S was the average proportion of carcasses that were detected in searcher detection trials, and Rc was mean daily proportion of trial carcasses that persisted for the number of days into the trial corresponding with the number of days in the average fatality search interval. A trial administrator typically would confirm that trial carcasses had been available to be found by searchers in searcher detection trials, i.e., that carcasses had not been removed by scavengers. A trial administrator typically would also periodically visit carcasses to assess their status during the carcass persistence trial. I averaged estimates of carcass persistence and searcher detection rates from trials reported from US and Canadian wind projects [3]. Values for d, the adjustment for maximum search radius bias, were estimated for each combination of turbine tower height and maximum search radius (Table 1). I fit a logistic model to the cumulative increase in fatalities, with increasing distance from the turbine. I then projected each model to 99% of its asymptote, to estimate the number of fatalities that would have been found had searches extended to the asymptotic distance predicted by the model. I used the difference between the predicted number of fatalities and the recorded number of fatalities to calculate the proportion of fatalities found within the maximum search radius, otherwise termed ‘search radius bias’ in fatality rate estimates [3]. I used averages to represent S, Rc, and d to dampen the influence of anomalous values from a few studies. I calculated SE of fatality estimates using the delta method.
After reviewing written characterizations and both reported and aerial imagery of each fatality monitoring site, I broadly classified detection trials by ground visibility. I classified ground visibility as ‘low’ on areas covered by dense forest, wetlands, or tall, dense crops such as corn; ‘moderate’ on areas covered by shrublands, tall grassland, or crops such as wheat, barley and hay; and ‘high’ on areas covered by annual grassland, short-grass prairie, sage brush, short annual grasslands, reclaimed land, snow, or barren. Based on fatality monitoring reports from both the USA and Canada, S averaged 0.113 (SE = 0.013; 271 trial carcass placements in 2 studies) on low ground with low visibility, 0.449 (SE = 0.104; 346 placements in 4 studies) on ground with moderate visibility, and 0.595 (SE = 0.057; 552 placements in 9 studies) on ground with high visibility [3]. I drew values for RC and d (and SE) from look-up tables derived from both USA and Canadian fatality monitoring reports [3], where RC corresponded with average search interval of each fatality monitoring study, and d corresponded with the combination of tower height (hub height) and maximum fatality search radius that best matched each study.
Based on reports of fatality monitoring through 2014, I averaged project-level fatality estimates within regions of installed wind energy projects within the USA. I defined regions with the help of the US Geological Survey’s U.S. Wind Turbine Database (https://eerscmap.usgs.gov/uswtdb/viewer/#3/37.25/-96.25). I defined the regions as Southwest (California, Nevada, Arizona) Pacific Northwest (Oregon and Washington), Rocky Mountains (Idaho, western Montana, Wyoming, Utah, western Colorado), High Plains (eastern Montana, eastern Colorado, Nebraska, Kansas, Iowa, North Dakota, South Dakota, western and southern Minnesota, Illinois, Indiana), Great Lakes (eastern Minnesota, Wisconsin, Michigan, northern Pennsylvania, eastern New York), Appalachia/Northeast (Maine to West Virginia), Texas Gulf, and Texas High Plains. I estimated mean (and 95% CI) bat fatalities/MW/year at the MW of wind turbines that had been monitored at each wind project. I added zero values where no fatalities had been reported for bats or for particular species of bats whose geographic ranges overlapped the project site. I expanded my region-specific average fatality rates to the installed MW of wind turbines in each region. I summed regional estimates for the national-level estimate of USA bat fatalities in 2014. The basis of the national-level estimate was 64,485.5 MW of wind-energy capacity that had been installed across the USA’s lower 48 states by 2014 [4]. I also estimated species-specific fatality estimates adjusted for the proportion of the lower 48 states composed of each species’ geographic range: USA-wide , where P was proportion of the area of the USA’s lower 48 states covered by the approximated geographic range of the ith species (P = 1 in the case of all bats). Finally, I estimated fatalities/MW/year, based on search intervals of I <10 days () and I ≥10 days () among wind turbines ≥0.66 MW in rated capacity (modern wind turbines), that were monitored for at least 6 months. All fitted models used in hypothesis-testing were based on least-squares regression analysis.
3. Results
3.1. Tower Heights and Search Intervals
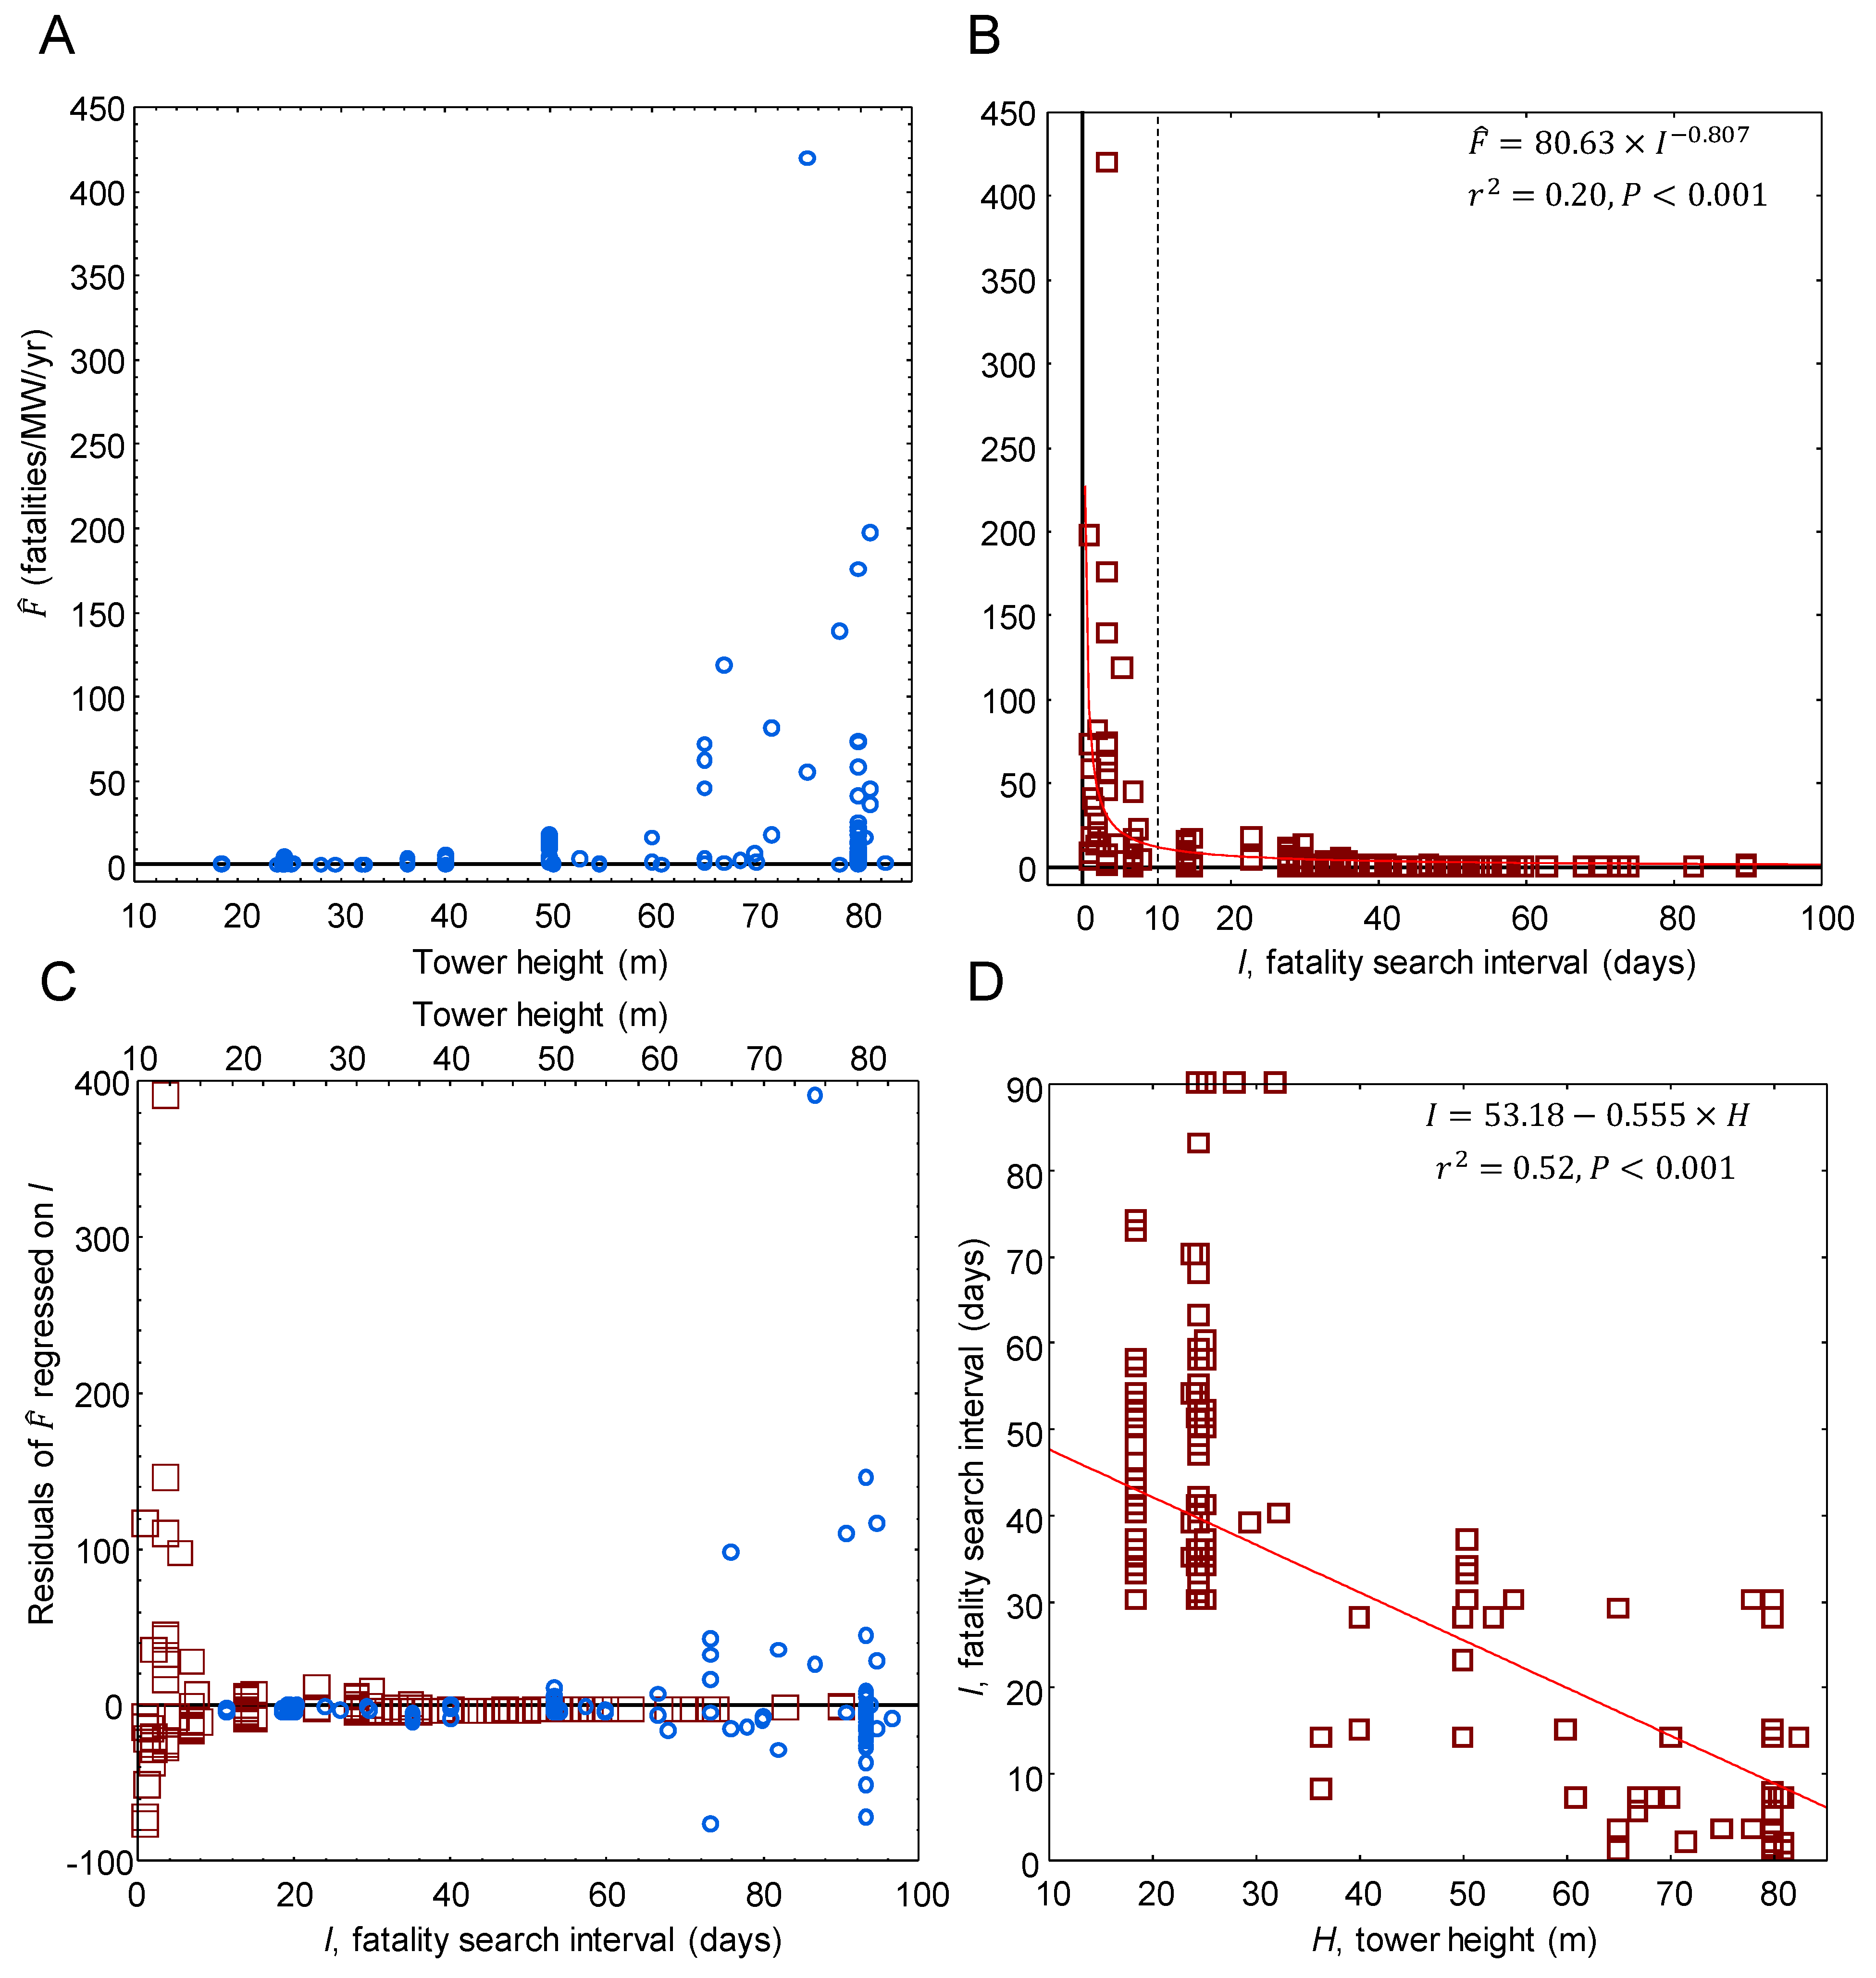
Estimates of fatality rates of all bats did not correlate significantly with wind turbine size (MW), but they did increase with increasing tower height (Figure 1A). However, estimated fatality rates of all bats related to fatality search interval as an inverse power function (Figure 1B). The residuals from the model-fit were symmetric with both search interval and tower height, but they increased in magnitude with increasingly shorter search intervals and taller towers (Figure 1C). Average search interval decreased significantly with increasing tower height (Figure 1D).
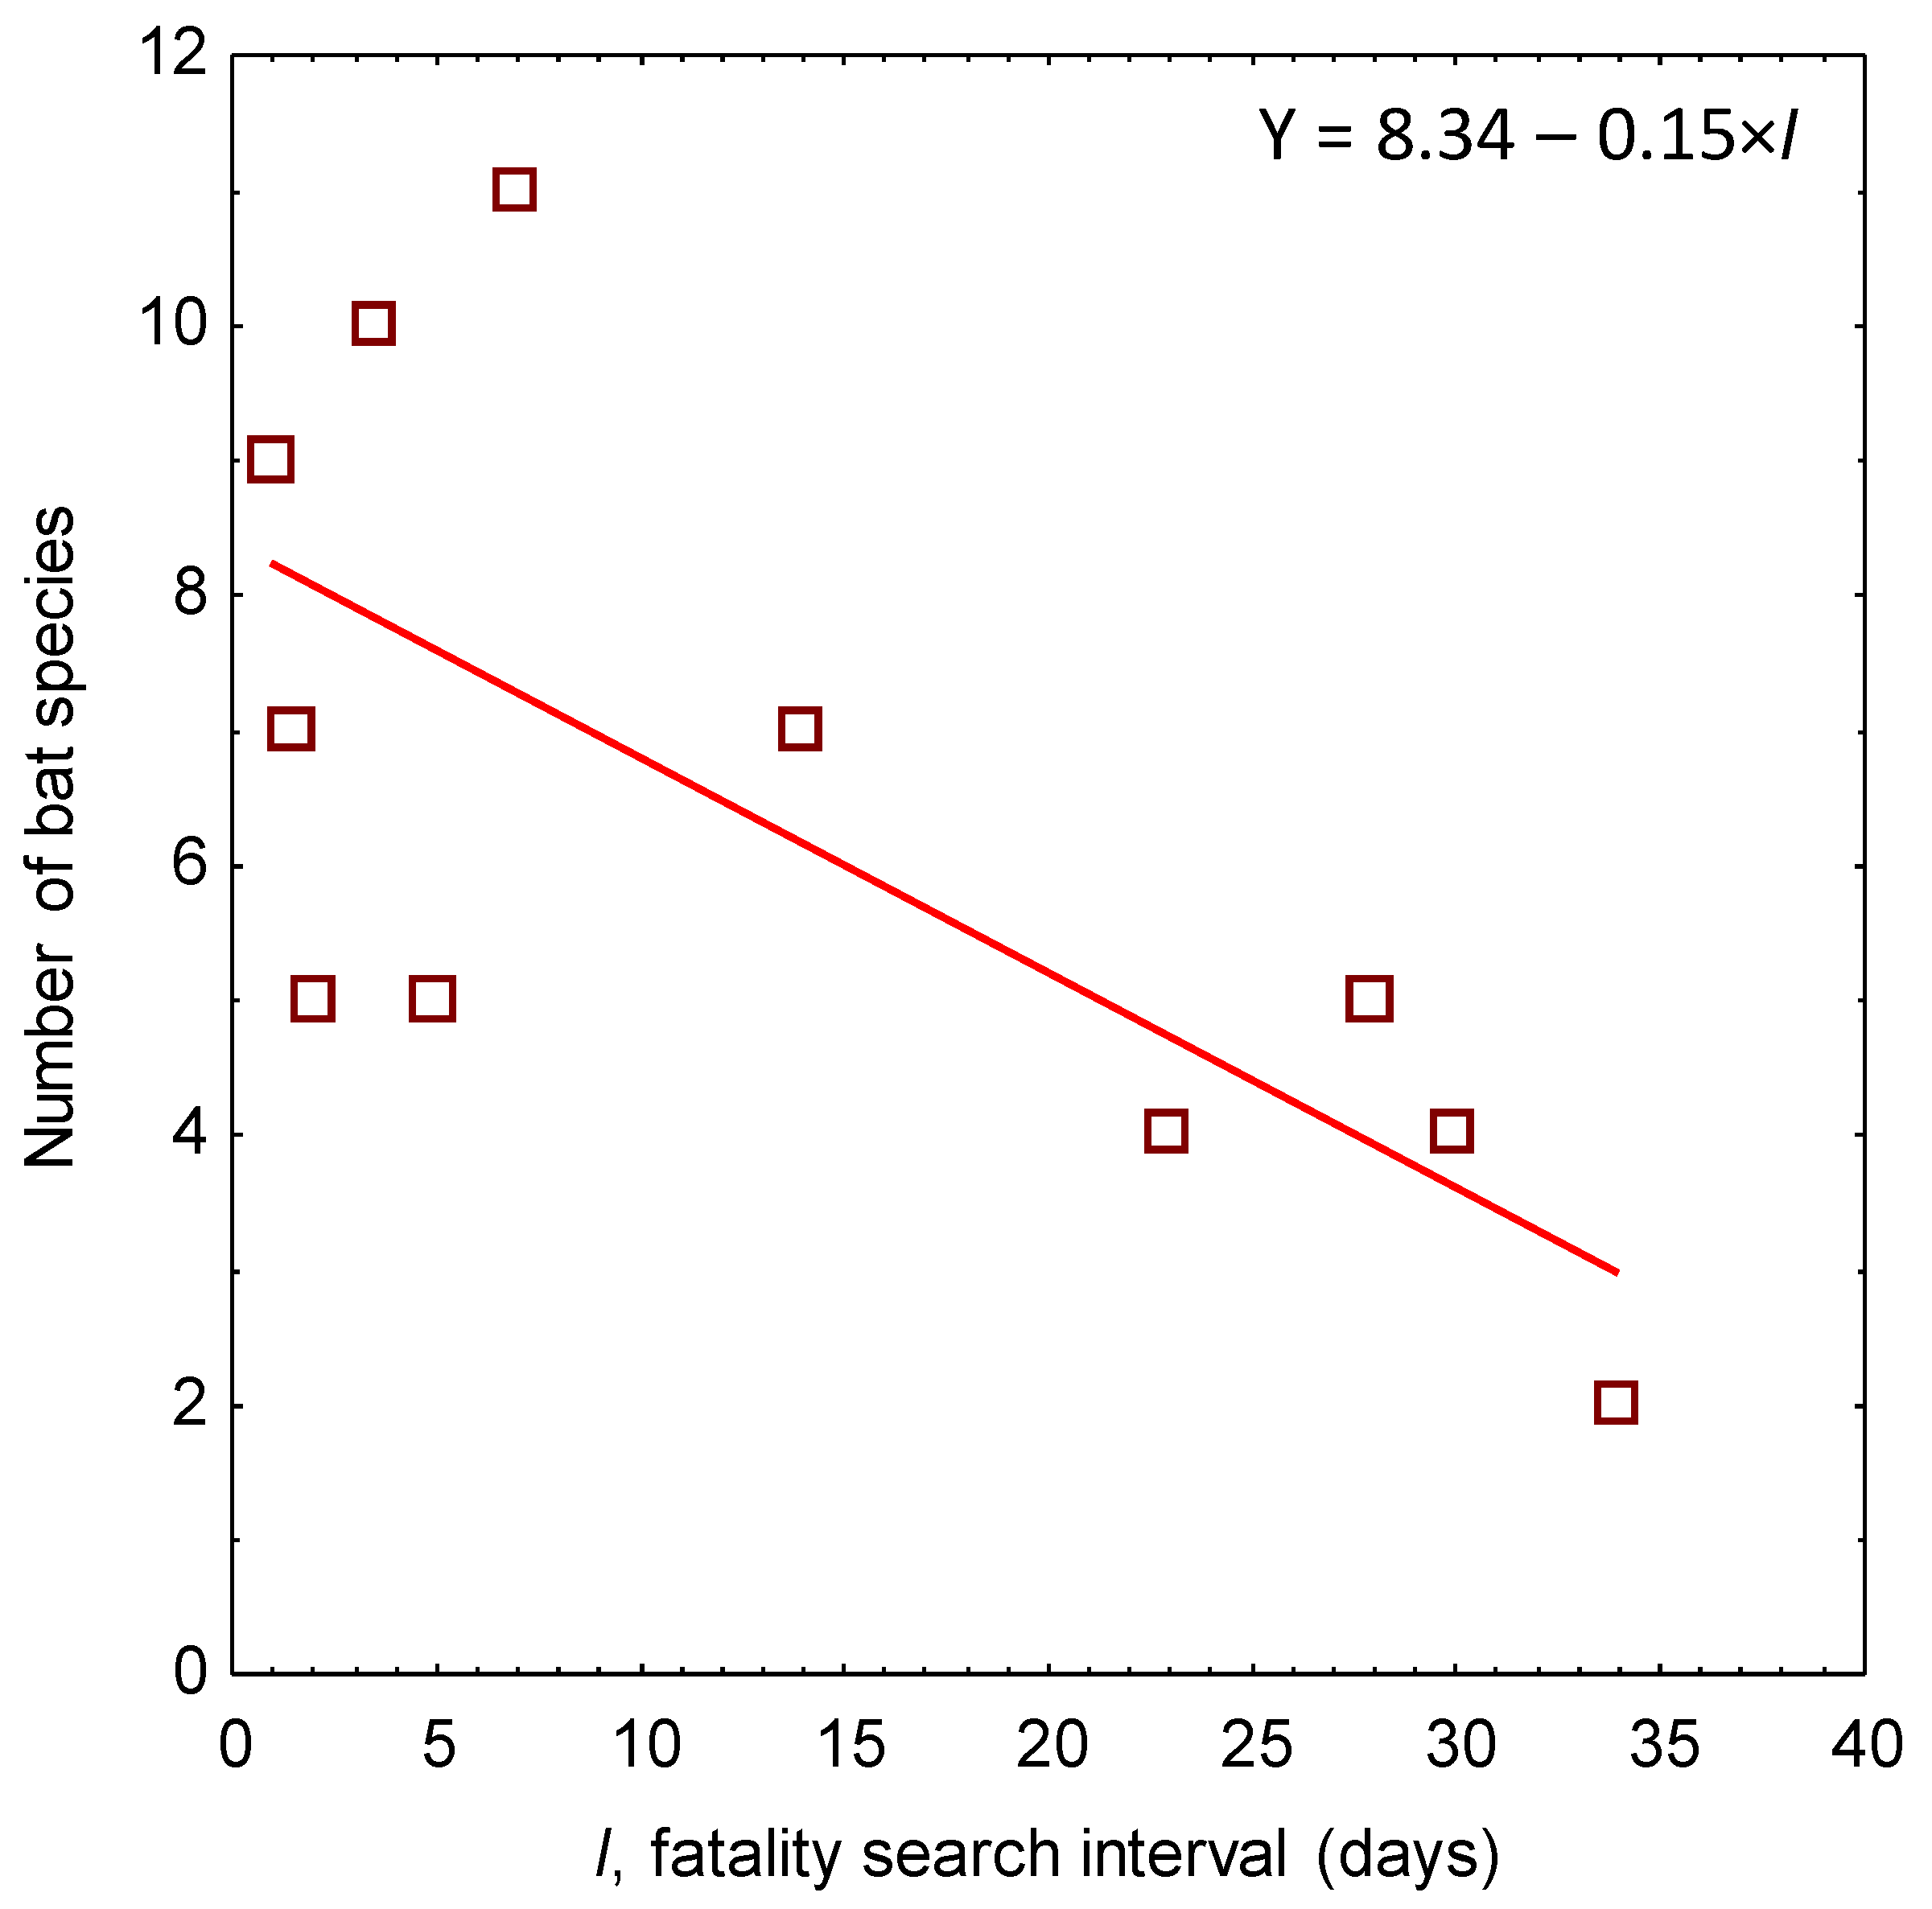
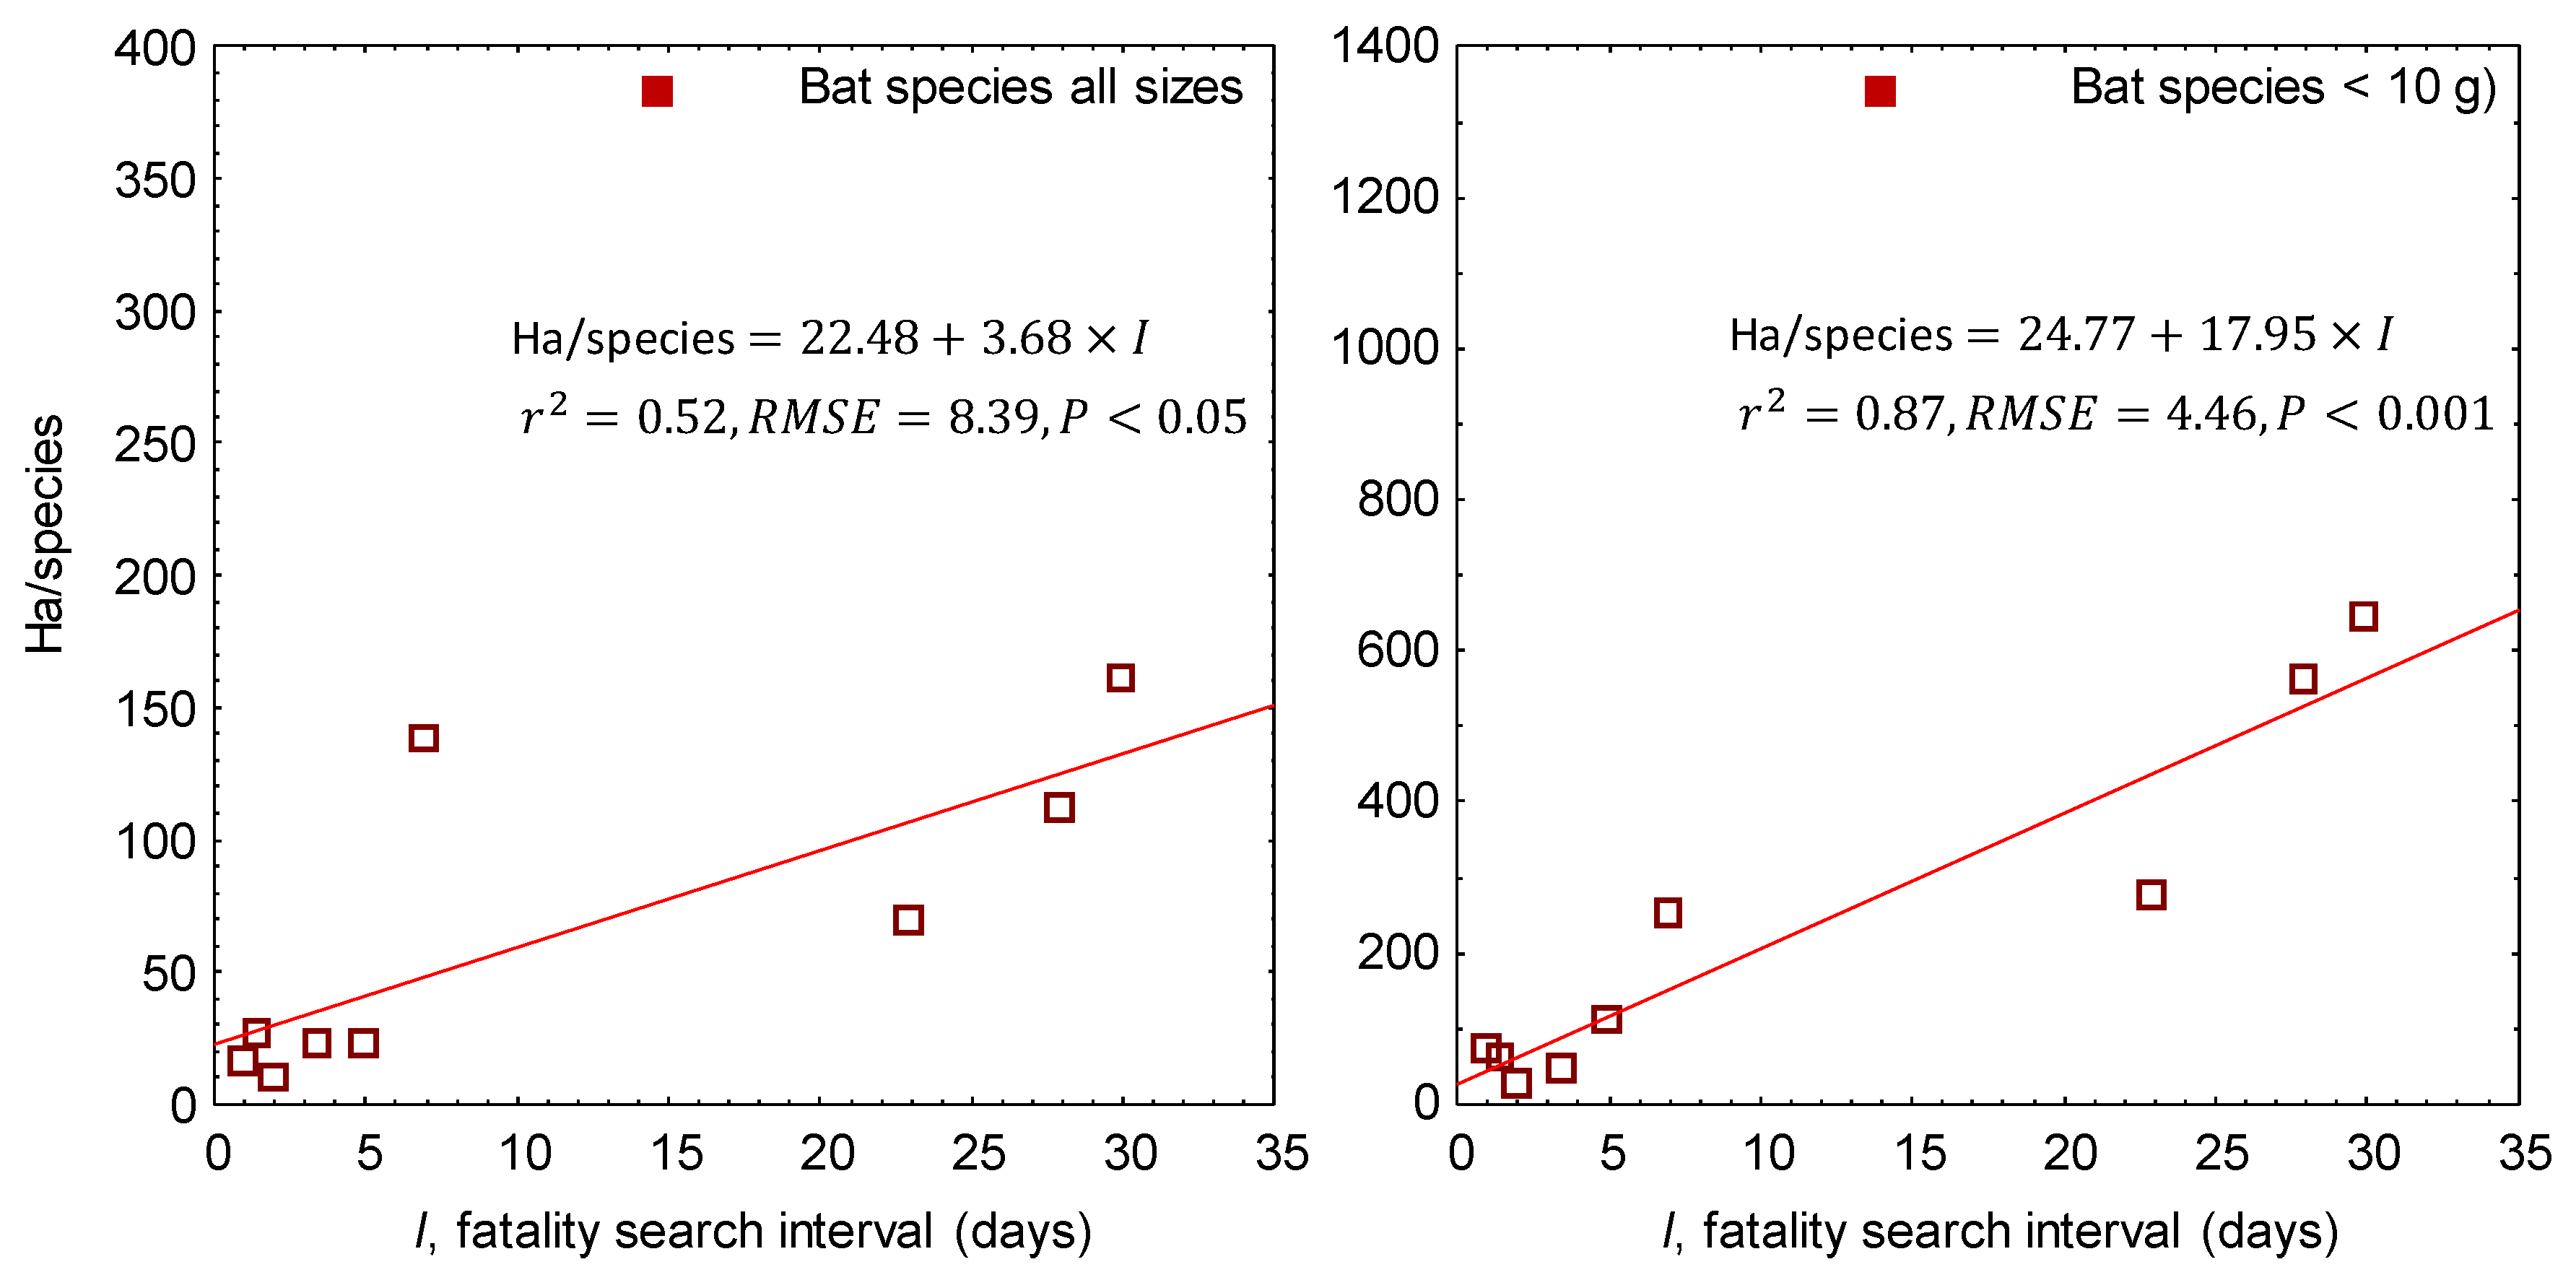
Species-specific did not correlate with . For all bats, averaged nearly five times higher than did (Table 2). was higher than for each and every species, ranging up to 22.3 times higher for little brown bat (Table 2). Eleven bat species were represented in fatality estimates based on I <10 days, whereas only eight species were represented in fatality estimates based on I ≥10 days (Table 2). The number of bat species represented in fatality monitoring increased with the decreasing search interval (Figure 2). The number of ha searched per species of bat detected as wind turbine fatalities increased significantly with increasing search interval (Figure 3A), and even more so for species of bat typically weighing <10 g (Figure 3B). The rate of increase in the number of ha needed to be searched per represented bat species was nearly five times higher for small bat species (slope coefficient = 17.95), as compared to all bats (slope coefficient = 3.68). Bat fatalities unidentified to species (“Bat spp.”) composed 5% of , whereas they composed 24.5% of (Table 2).
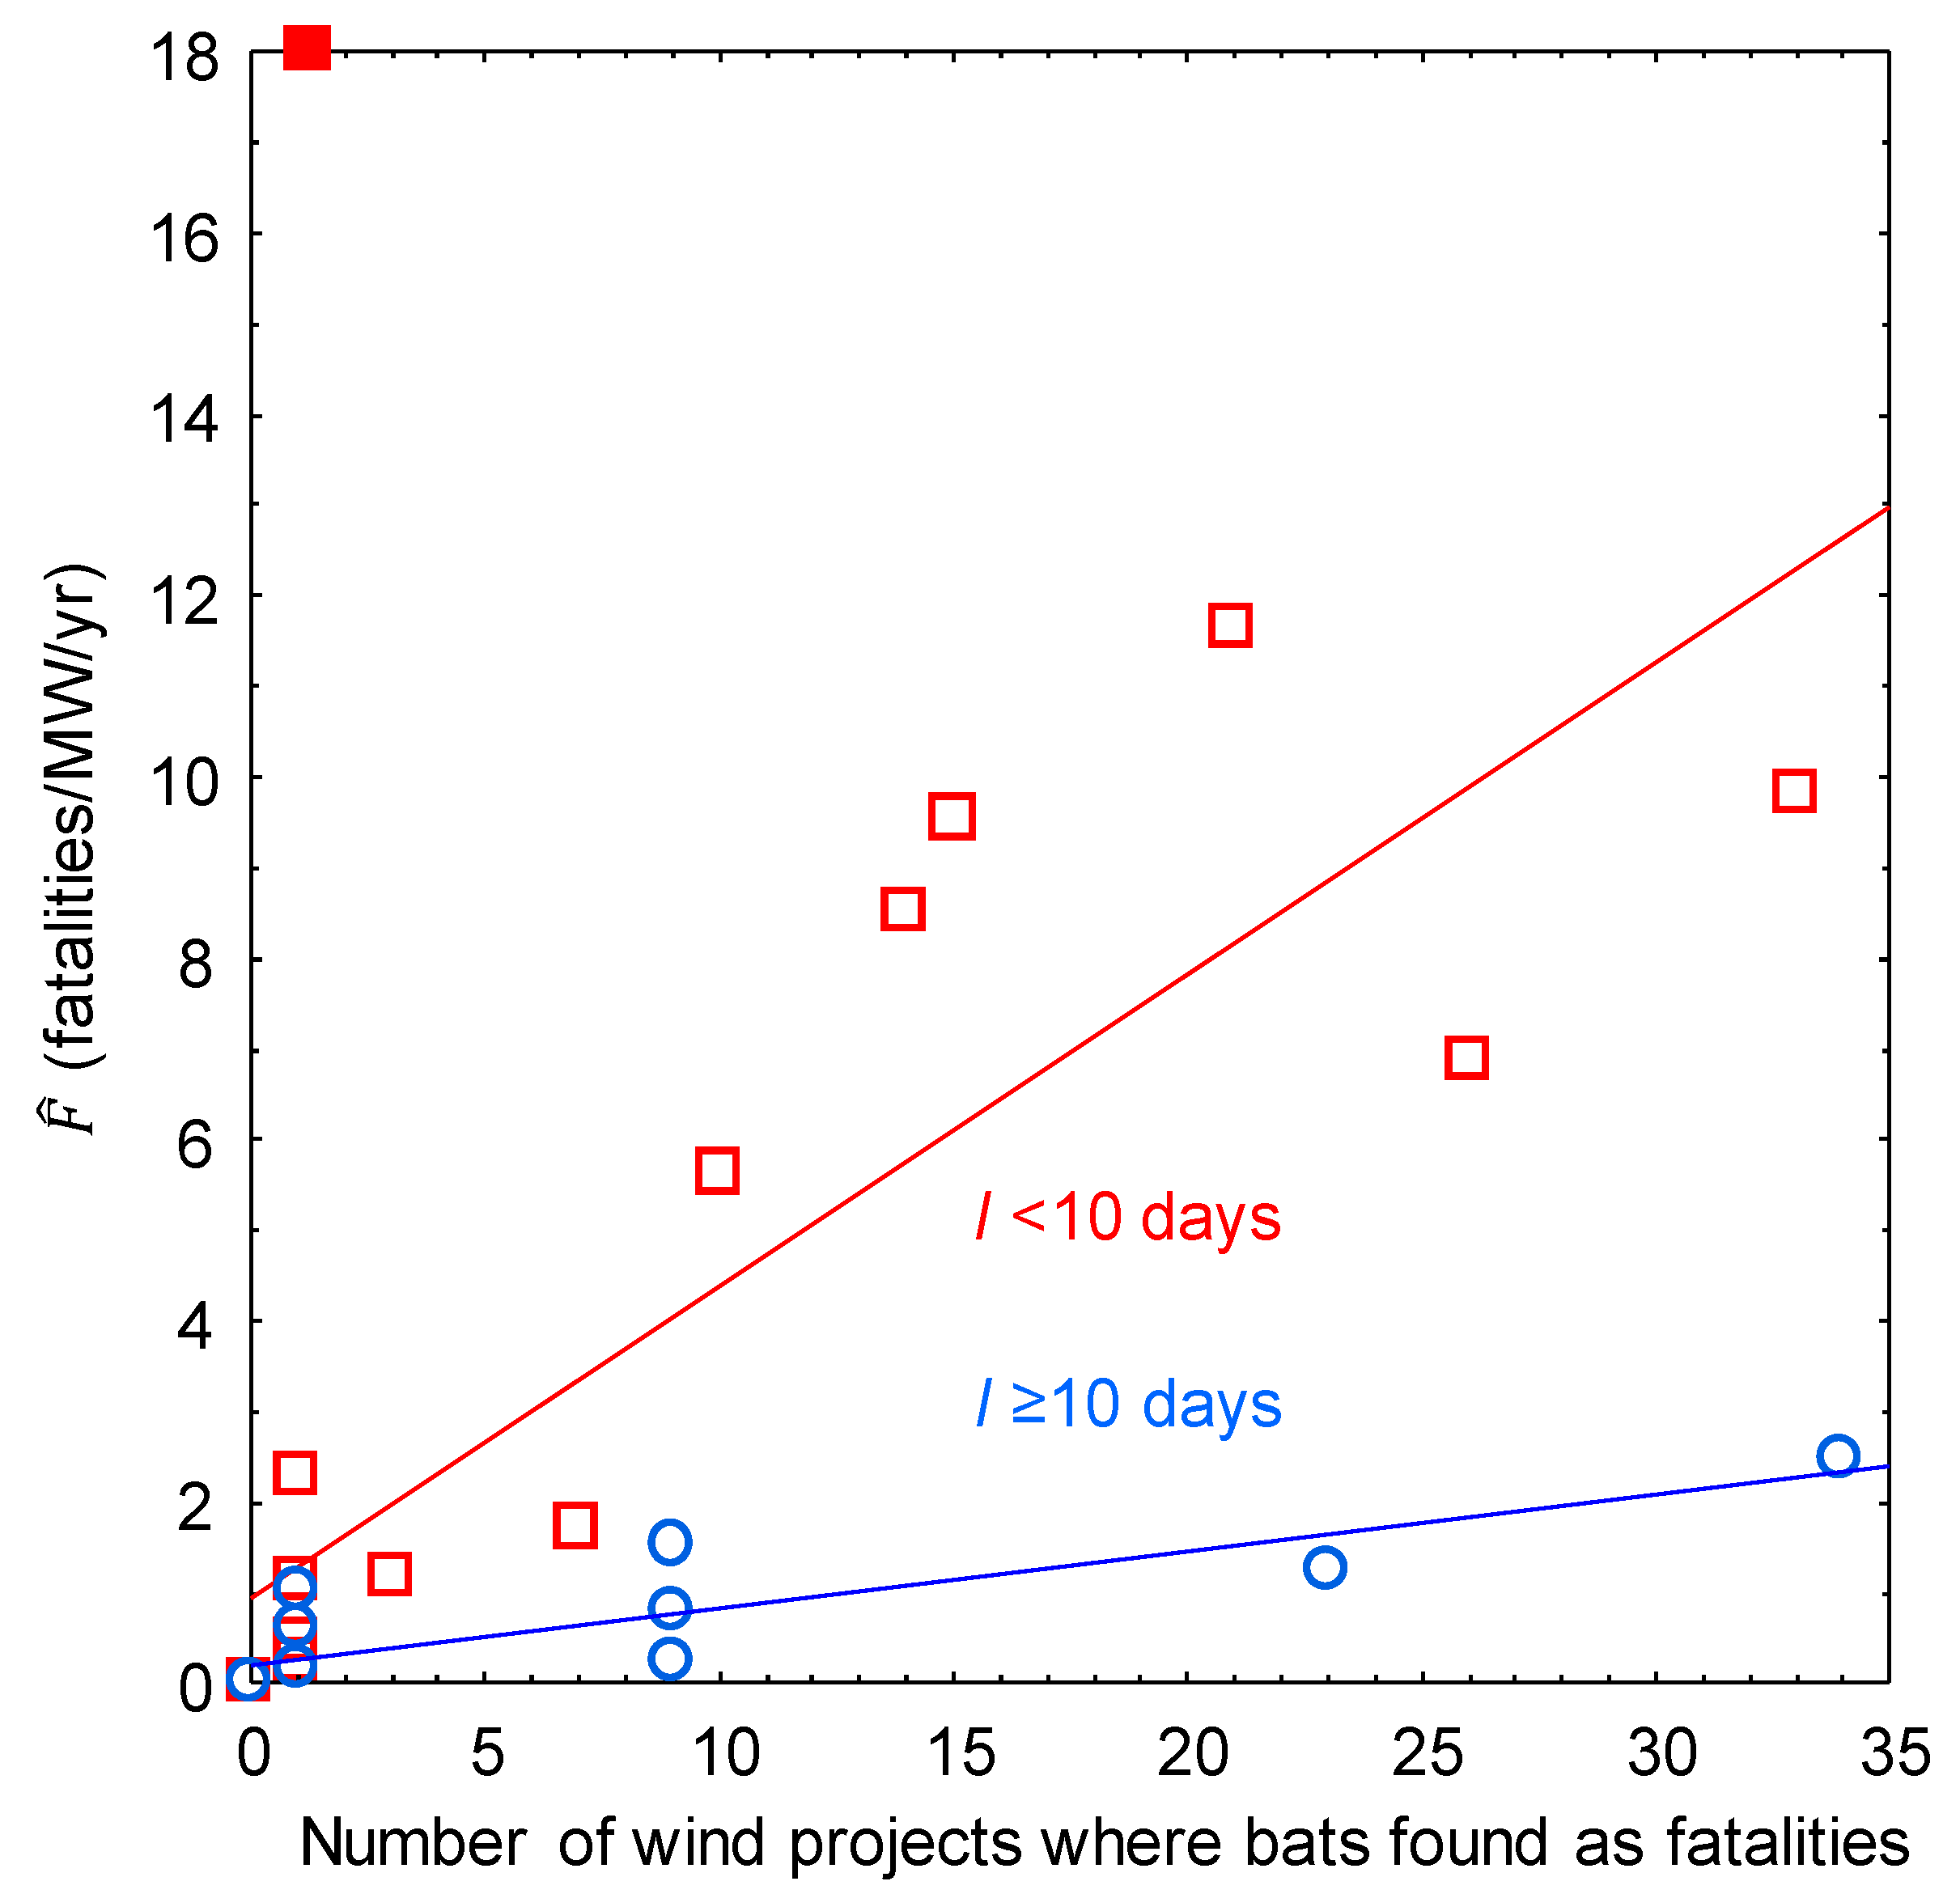
Species-specific and increased with the number of monitored wind projects where bats of each species were found as fatalities, but more rapidly for (Figure 4). After omitting the evening bat (Nycticeius humeralis) fatality estimate as an outlier due to its single project sampled within the species’ small geographic range within the USA, (r2 = 0.75, RMSE = 5.4, p < 0.001), and (r2 = 0.72, RMSE = 5.3, p < 0.001). Without the lone evening bat estimate, species-specific correlated with species’ geographic range (r = 0.90, p < 0.001). Species-specific also increased with geographic range, but the correlation was weaker (r = 0.60, p < 0.05). The number of studies where bats were found as fatalities increased with increasing species’ geographic range (r = 0.91, p < 0.001).
3.2. Estimates of Bat Fatalities in the USA
Projecting estimates of mean fatalities/MW/year to the estimated installed capacity of wind energy in the United States in 2014, I estimated annual fatalities of 2,223,270 (95% CI: 1,766,173–2,722,457) bats based on search intervals <10 days, 274,030 (95% CI: 9360–600,986) bats based on search intervals ≥10 days, and 1,300,569 (95% CI: 154,214–3,032,370) bats based on all search intervals. I estimated an eight-fold difference between fatality monitoring efforts, based on search intervals shorter and longer than 10 days.
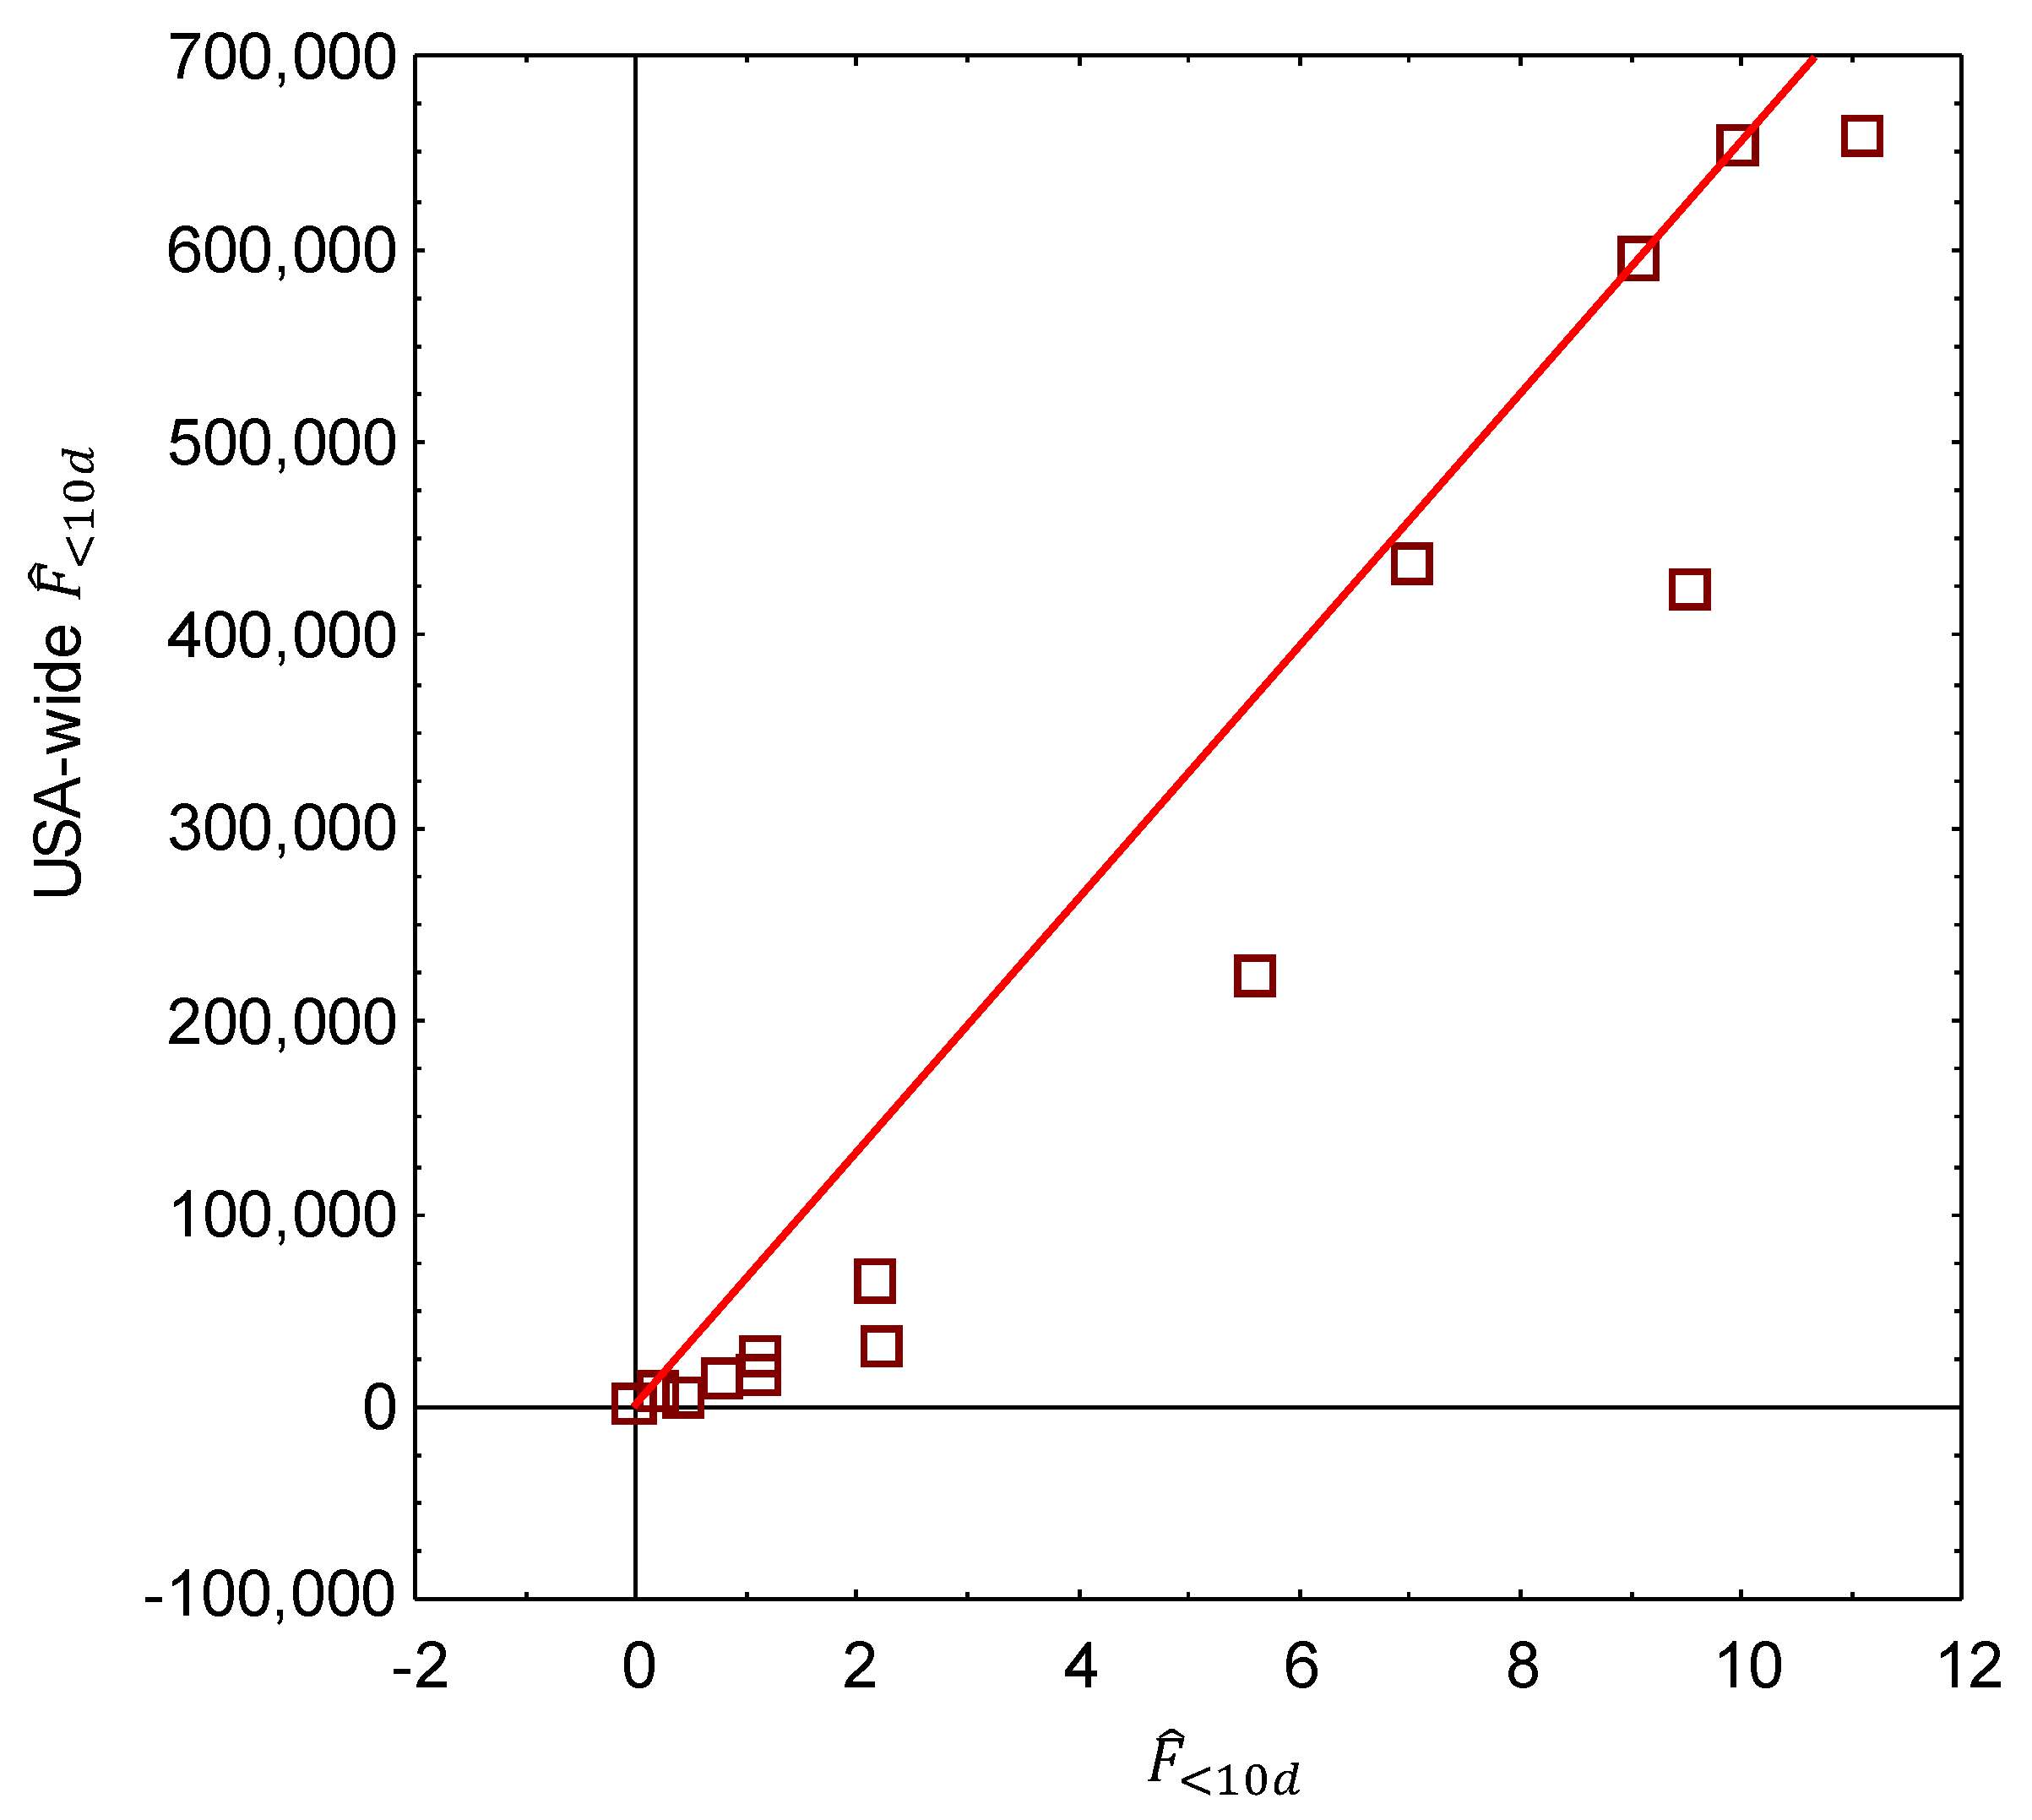
A simple expansion of to the USA’s installed capacity of wind energy in 2014 would have overestimated fatalities of most bat species, because their geographic ranges do not cover the entire USA. Expansions of mean project-level fatality rates to species’ geographic ranges resulted in national under-estimates. Under-estimates were indicated by USA-wide , located under the line connecting the all-bats estimate to the axes’ origin (Figure 5). For only those species with geographic ranges spanning ≥90% of the area of the USA, and for which installed wind energy capacity would have increased collision vulnerability almost wherever the capacity was installed in the USA, and for which size and conspicuousness would have seldom resulted in carcasses going unidentified, I estimated USA-wide as 840,843 (95% CI: 780,496–904,738) silver-haired bats, 827,929 (95% CI: 749,479–918,921) hoary bats, and 40,042 (95% CI: 37,076–44,556) big brown bats.
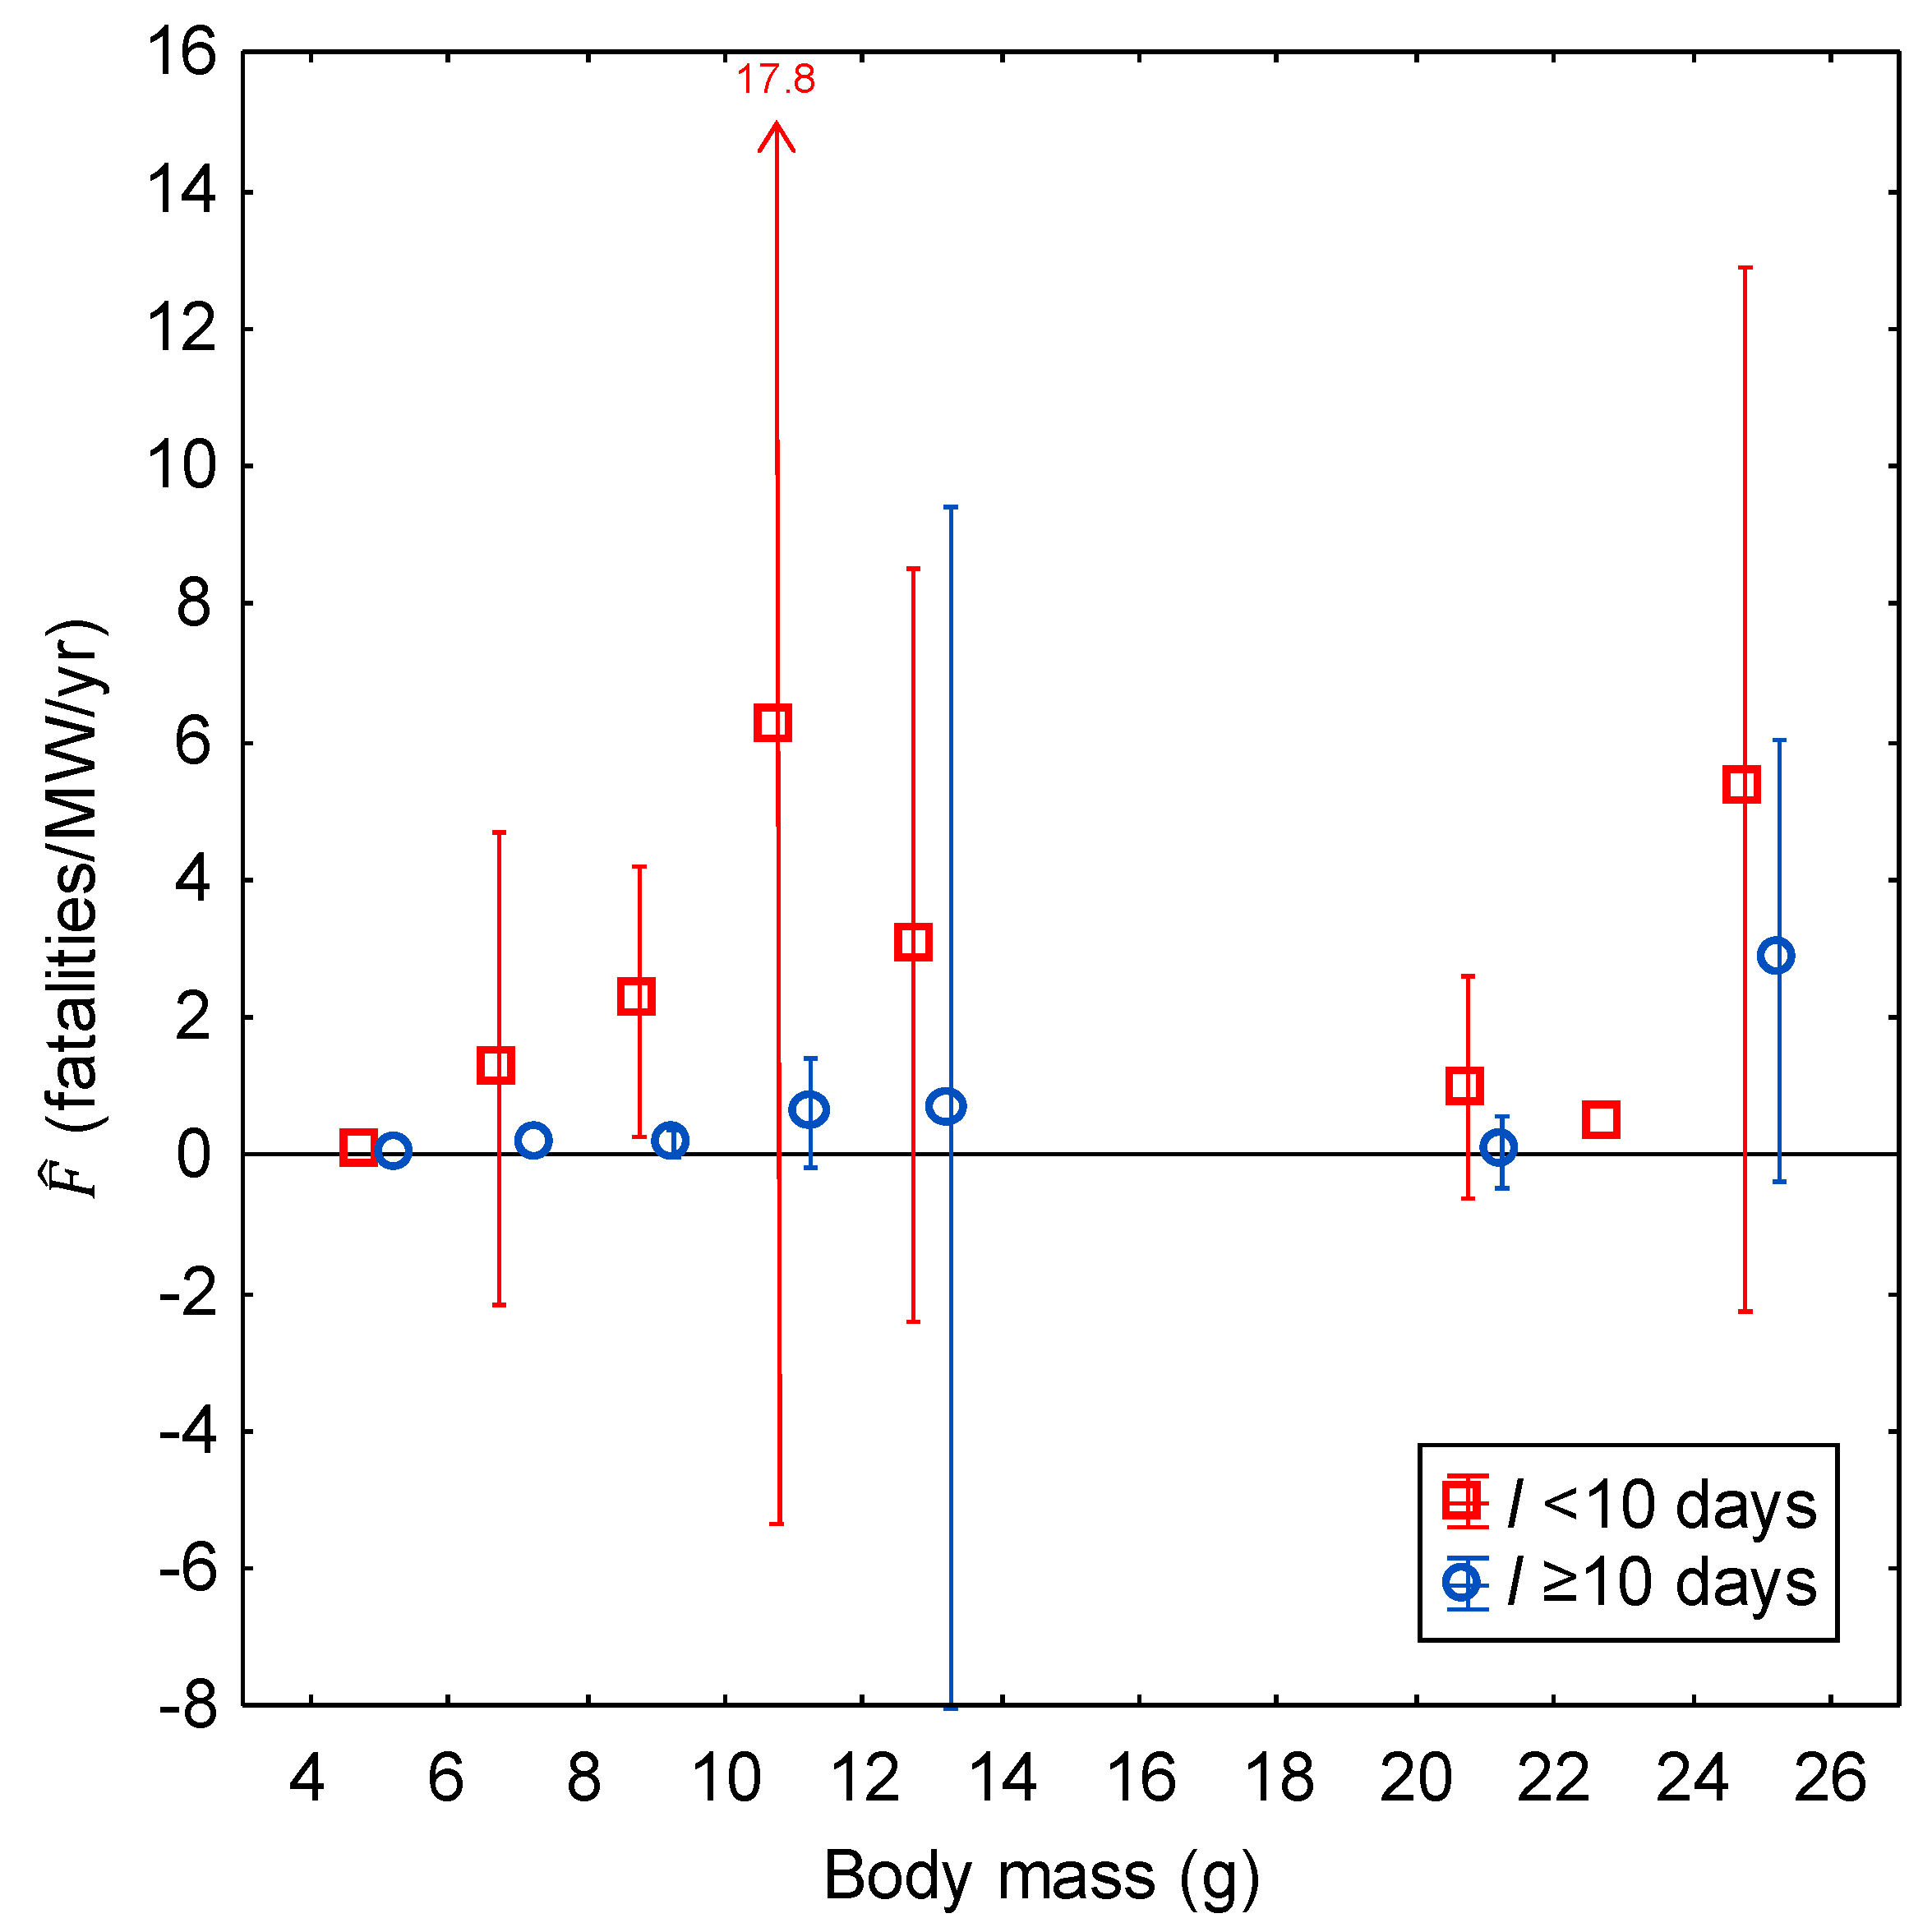
for all bats averaged lower than in the Pacific Northwest and Rocky Mountains regions, but it was higher in other regions where both short and long search intervals had been used (Table 3). Averaged among regions, was higher than for most bat species, and the difference appeared larger for medium to small-sized bats (Figure 6).
4. Discussion
Even though tower height appeared to be confounded with fatality search interval in its prediction of bat fatality rates, tower height remains a potential collision risk factor. Relative to concurrently monitored old-generation turbines mounted on towers of mostly 18.5 m to 24 m height that were searched at 41-day intervals in the Altamont Pass Wind Resource Area (WRA), bat fatalities/MW/year were nine times higher at 0.66-MW turbines mounted on 50-m and 55-m towers that were searched at 33-day intervals over two years [87], and 13 times higher at 2.3-MW turbines mounted on 80-m towers that were searched at 28-day intervals over three years [20] in the same WRA. Such large differences in fatality rates could not have resulted from variation in what were already long search intervals. In another comparison between largely concurrent monitoring over three years at neighboring wind projects, searchers found two bats among 11.67 MW of turbines mounted on 18.5-m and 24-m towers that were searched at five-day intervals [110], whereas they found 31 bats among 39.1 MW of turbines on 80-m towers searched at seven-day intervals [20]. In this comparison, bat fatalities found per MW numbered 4.6 times more at turbines on the taller towers. A mere two-day difference in search interval was unlikely to be the reason for this difference. Although shorter search intervals increase the detection rates of bat fatalities, increased tower height likely increases collision risk and deposits more bats to be found in monitoring.
I estimated 2.22 million bat fatalities at 64,485 MW of installed wind-energy capacity in the United States in 2014. This estimate could be inaccurate if reported fatality rates remain biased by region or if they changed between the earliest to the latest reports due to changes in wind turbine design and operations (e.g., lower cut-in speeds) or in mitigation (e.g., implementation of operational curtailment) [3,7]. More important than whether my estimate was accurate, however, was its change in magnitude when relying on project-level fatality estimates based on shorter search intervals.
My latest estimate was 2.5 times higher than my estimate for 2012 [3]. Part of this increase can be explained by the 25% increase in installed wind energy capacity in the two years between 2012 and 2014. Part of it can be explained by my expansions of mean project-level fatality rates to regions. However, most of the increase was due to my restriction of the source data to fatality monitoring efforts with search intervals <10 days. I found an eight-fold difference in estimates of mean project-level fatality rates between search intervals shorter or longer than 10 days. More frequent searches for fatalities greatly improves the likelihood of detecting bat fatalities, by more competently competing against vertebrate scavengers at being the first to find carcasses. More frequent searches also allows searchers more opportunities to find bat carcasses before they deteriorate to obscurity. In integrated carcass detection trials involving small birds, which are also difficult for human searchers to find, searchers averaged 4.3 searches per first detection with an average search interval of five days (Smallwood et al., 2018). Through 2014, variation in the fatality search interval among monitoring efforts was one of the largest sources of variation in bat fatality estimates at wind projects.
The fatality search interval can also contribute to bias in bat fatality estimation, depending on how adjustments are made for the proportion of undetected fatalities. At one project monitored at seven-day intervals, separate trials for carcass persistence and searcher detection rates resulted in a bat fatality estimate that was three times higher than the estimate, based on integrated carcass detection trials [20]. This difference was largely due to the integrated trials’ presentation of multiple opportunities for searchers to find trial carcasses, each of which the trial administrator left indefinitely to simulate fatalities remaining where deposited by wind turbines until removed either by scavengers or the elements [110]. Results of integrated detection trials [20,110] confirmed an inflation bias predicted for the results of conventional carcass detection trials applied to fatalities found at short search intervals [111]. Additionally, consistent with predictions [111], bat fatalities estimated from a 28-day search interval did not differ between conventional and integrated detection trials [20]. If the implementation of integrated trials at additional wind projects bears out the inflation bias of conventional detection trials applied to shorter search intervals [20], then my USA-wide fatality estimates would need to be adjusted down accordingly (however, see my later discussion on potential biases that underestimate USA-wide fatalities). Our understanding of the magnitude of wind turbine collision fatalities hinges on whether future fatality monitoring adopts more rigorous fatality search protocols.
That more rigorous fatality monitoring influences bat fatality estimates was also evident in the number of species represented in fatality estimates. More species of bats were found in monitoring with shorter search intervals (Figure 2, Table 2). Of seven bat species typically weighing <7 g and found as fatalities at wind turbines ≥0.66 MW, all seven were represented where I ≤ 7 days, whereas only two were found where I > 7 days. At one project monitored for three years with seven-day search intervals at half the turbines and 28-day search intervals at the other half, fatalities of four bat species were detected at I = 7, but fatalities of only two of these bat species were detected at I = 28, having missed a species that typically weighs 4.3 g and another that weighs 11 g [20]. Conversely, the area needed to be searched per additional bat species increased with longer search intervals, and the rate of this increase in search area was five times greater for small-bodied bat species than for all bat species (Figure 3). Whereas the results of conventional detection trials applied to short search intervals can inflate bat fatality estimates, increasingly, longer search intervals in fatality monitoring under-represents bat species in fatality estimates. My USA-wide fatality estimates were most likely biased against small-bodied bat species, which affected my all bat fatality estimate to an unknown degree.
Shorter search intervals also generated fatality estimates that were composed of fewer bat fatalities unidentified to species. The proportion of estimated mean project-specific fatalities/MW/year that was composed of unidentified bat species was five times higher, when based on search intervals longer than 10 days. Fatality monitoring based on shorter search intervals increases the frequency of finding recently-killed bats, and therefore facilitates species identifications. As more of the bat fatalities are identified to species, the accuracy of the species-specific fatality estimation will increase.
Despite my averaging of project-specific fatality estimates within regions as a first step toward estimating USA-wide fatalities, my national-level estimate could still be biased high or low, depending on the degree to which wind projects that were selected for monitoring and reporting also represented vulnerability of bats to wind turbine collisions across the USA [3,7]. Disproportionate absence of reporting from regions within the USA, such as from Texas, could have biased my estimates. Any such bias could be lessened by publicly reporting all fatality monitoring efforts. It could also be lessened by designing a sampling program among existing wind projects, regardless of the time since project operations initiated, rather than by performing a year of monitoring each time a new project is constructed and becomes operational.
A potential source of error in my approach was assuming zero values for bat species that were unreported as fatalities at specific wind projects, but for which it remains uncertain whether these species occurred at those projects. Species undetected as fatalities go unreported. I assigned these species zero fatalities if they had been reported as fatalities at other wind projects within the same region. My assumption would have introduced error wherever I added zero values for bats that truly did not occur at those projects. Local species of bat that were not found as fatalities could have been missed by searchers due to insufficient search effort, or they could have been found and unidentified to species, or even misidentified [110]. Future monitoring efforts could be more informative by implementing surveys for live bats, to characterize the suite of bat species using wind projects.
I likely under-estimated bat fatalities due to deficiencies in the maximum search radius among wind projects. I developed an adjustment for this deficiency [3]. However, I have more recently discovered that my adjustment was insufficient, because it changes with increasing maximum search radius [112]. Future fatality monitoring would contribute to more accurate fatality estimation by searching farther from a subset of turbines than is typically practiced.
In 2013, I introduced a more efficient estimator, where D is the overall detection rate of carcasses integrated into routine fatality monitoring [3]. The advantages of the new estimator include (1) the elimination of biases from previously neglected interaction effects among S and RC and d, (2) a predictive relationship between body mass and D, and (3) the opportunity to treat trial carcasses as training data, which are useful for assessing estimation accuracy. However, many of the older fatality monitoring efforts did not perform detection trials suited for estimating D, so I estimated S, RC, and d from those reports that provided suitable data for those adjustment terms, and I applied them to fatality data from all of the reports.
Fatality estimation can also be more accurate by using scent-detection dogs in place of human searchers. Where dogs were used at the same turbines concurrently searched by humans, and monitoring methods were otherwise the same, 71 bat fatalities were found [112], where humans found one [113]. At another project previously monitored for three years by humans, fatality finds using dogs resulted in a bat fatality estimate that was 11 times higher than the estimate based on human searchers, despite the search interval and maximum search radius being equal [114]. Dogs can find trace evidence of bats that human searchers would unlikely find, and likewise they can find bats hidden in tall vegetation. The recent use of scent-detection dogs suggests that searcher detection rates likely biased fatality estimates to be low through 2014.
Whereas fatality estimators are often compared for their accuracy [111,115,116], accuracy in fatality estimation is most substantially affected by the field methods used to inform the terms of the estimators. Accuracy in fatality estimation depends on detecting as many of the fatalities as possible and accurately adjusting the fatality count for the proportion undetected. Finding more of the fatalities diminishes the necessary adjustments along with the adjustments’ error and biases. Accuracy in ‘all bat’ fatality estimation depends on detecting all of the species represented by fatalities. Unless the monitor is aware of which species could have been found but were not found, there is no suitable adjustment for increasing the accuracy of negative findings of a species. At a wind project where fatality searches overlapped the same wind turbines, with one team of human searchers averaging 39 days per search and the other team averaging five days, the searchers averaging 39 days found only 10% of the bats and small birds in the 10–40 g size range that were found by the other team, and they found fatalities representing only 37.5% of all of the bird and bat species that the searchers averaging five days detected [117]. No adjustments for carcass persistence can alone remove such large effects of search interval.
Finding more of the available carcasses and representing more of the species truly affected is most facilitated by using scent-detection dogs instead of human searchers [112,118,119,120,121,122], shorter search intervals [110,117,123], and appropriate search areas [3,110,124]. More accurately adjusting for the proportion of undetected fatalities is most facilitated by integrating detection trial carcasses of appropriate species, carcass condition, and range of body masses into routine fatality monitoring to obtain a single adjustment factor instead of several factors, and a training data set against which fatality counts can be compared [3,110,117,125]. The integrated approach further avoids the biases of carcass persistence rates caused by scavenger swamping in windfall trial carcass placements [125], persistence trial duration [110], and unrealistic application of trial carcass size classes to fatalities that vary continuously in body size [110] and single-search searcher detection rates from trial carcasses placed just prior to the search [20].
In summary, I estimated 2.22 million bat fatalities across the USA in 2014, but with a 95% CI of 1.77 million to 2.72 million bat fatalities. My estimate was made in the face of very substantial biases, potentially shifting the mean lower by a factor of three and higher by up to a factor of 11. The proportion of mortally injured bats leaving the search areas under their own volition, otherwise known as crippling bias [109], could also shift my USA-wide estimate higher [114]. Furthermore, since 2014, the installed capacity of wind energy has increased 52% to 100,025 MW, and bat fatalities likely increased proportionally with this increase in capacity, so long as the pool of vulnerable bats has not diminished. The decline of hoary bats in the Pacific Northwest [126] suggests that the pool of vulnerable bats might be diminishing. It is imperative, therefore, that methods of fatality monitoring improve to more accurately estimate bat fatalities. Future fatality monitoring could vastly improve the accuracy of fatality estimation, by replacing human searchers with scent-detection dogs. It is also imperative that the benefits of wind energy be weighed against the ecological costs [127,128]. Improved methods are also imperative for measuring the efficacy of mitigation measures [129], such as operational curtailment strategies [130,131,132,133] and deterrents [134].
Funding
This research was funded by the California Energy Commission’s Public Interest Energy Research program under contract number PIR-08-025.
Acknowledgments
Most of this study was funded by the California Energy Commission’s Public Interest Energy Research Program. I thank all those who committed the tedious, difficult hours searching for wind turbine fatalities. I am grateful to four anonymous peers for their helpful reviews of earlier drafts of this paper.
Conflicts of Interest
The author declares no conflict of interest.
References
- Arnett, E.B.; Baerwald, E.F. Impacts of wind energy development on bats; implications for conservation. In Bat Evolution, Ecology, and Conservation; Adams, R.A., Pedersen, S.C., Eds.; Springer: New York, NY, USA, 2013; pp. 435–456. [Google Scholar] [CrossRef]
- Hayes, M.A. Bats killed in large numbers at United States wind energy facilities. BioScience 2013, 63, 975–979. [Google Scholar]
- Smallwood, K.S. Comparing bird and bat fatality-rate estimates among North American wind-energy projects. Wildl. Soc. Bull. 2013, 37, 19–33. [Google Scholar] [CrossRef]
- American Wind Energy Association. Available online: https://www.awea.org/wind-101/basics-of-wind-energy/wind-facts-at-a-glance (accessed on 8 December 2019).
- Allison, T.D.; Diffendorfer, J.E.; Baerwald, E.F.; Beston, J.A.; Drake, D.; Hale, A.M.; Hein, C.D.; Huso, M.M.; Loss, S.R.; Lovich, J.E.; et al. Impacts to Wildlife of Wind Energy Siting and Operation in the United States. Issues Ecol. 2019, 21, 1–24. [Google Scholar]
- Johnson, D.H.; Loss, S.R.; Smallwood, K.S.; Erickson, W.P. Avian fatalities at wind energy facilities in North America: A comparison of recent approaches. Hum. Wildl. Interact. 2016, 10, 7–18. [Google Scholar]
- Huso, M.M.P.; Dalthorp, D. A Comment on “Bats Killed in Large Numbers at United States Wind Energy Facilities”. BioScience 2014, 64, 546–547. [Google Scholar] [CrossRef] [Green Version]
- Erickson, W.P.; Johnson, G.D.; Strickland, M.D.; Young, D.P., Jr.; Sernka, K.J.; Good, R.E. Avian Collisions with Wind Turbines: A Summary of Existing Studies and Comparisons to Other Sources of Avian Collision Mortality in the United States; National Wind Coordinating Committee: Washington, DC, USA, 2001. [Google Scholar]
- Erickson, W.P.; Johnson, G.D.; Young, D.P., Jr. A summary and comparison of bird mortality form anthropogenic causes with an emphasis on collisions. In Bird Conservation Implementation and Integration in the Americas: Proceedings of the Third International Partners in Flight Conference. 2002 March 20–24; Asilomar, California, Volume 1 and 2; Ralph, C.J., Rich, T.D., Eds.; U.S. Department of Agriculture, Forest Service, Pacific Southwest Research Station; USDA Forest Service General Technical Report; Albany, CA, USA, 2005; pp. 1029–1042. [Google Scholar]
- GAO. Wind power impacts on wildlife and government responsibilities for regulating development and protecting wildlife. In Report GAO-05-906; United States Government Accountability Office: Washington, DC, USA, 2005. [Google Scholar]
- Barclay, R.M.R.; Baerwald, E.F.; Gruver, J.C. Variation in bat and bird fatalities at wind energy facilities: Assessing the effects of rotor size and tower height. Can. J. Zool. 2007, 85, 381–387. [Google Scholar] [CrossRef]
- Zimmerling, J.R.; Francis, C.M. Bat mortality due to wind turbines in Canada. J. Wildl. Manag. 2016, 80, 1360–1369. [Google Scholar] [CrossRef]
- Thaxter, C.B.; Buchanan, G.M.; Carr, J.; Butchart, S.H.M.; Newbold, T.; Green, R.E.; Tobias, J.A.; Foden, W.B.; O’Brien, S.; Pearce-Higgins, J.W. Bird and bat species’ global vulnerability to collision mortality at wind farms revealed through a trait-based assessment. Proc. R. Soc. B 2019, 284, 20170829. [Google Scholar] [CrossRef]
- Anderson, R.; Neumann, N.; Tom, J.; Erickson, W.P.; Strickland, M.D.; Bourassa, M.; Bay, K.J.; Sernka, K.J. Avian Monitoring and Risk Assessment at the Tehachapi Pass Wind Resource Area: Period of Performance: October 2, 1996–May 27, 1998; National Renewable Energy Laboratory: Golden, CO, USA, 2004. [Google Scholar]
- Anderson, R.; Tom, J.; Neumann, N.; Erickson, W.; Strickland, D.; Bourassa, M.; Bay, K.J.; Sernka, K.J. Avian Monitoring and Risk Assessment at the San Gorgonio Wind Resource Area; National Renewable Energy Laboratory: Golden, CO, USA, 2005. [Google Scholar]
- ARCADIS, Inc. Fall 2008 to Spring 2010 Avian and Bat Post-Construction Monitoring Report. In Happy Jack Windpower Project; Duke Energy: Cheyenne, WY, USA, 2010. [Google Scholar]
- ARCADIS, Inc. Bird and Bat Post-Construction Mortality Monitoring Study. In Silver Sage Windpower Project; Duke Energy: Cheyenne, WY, USA, 2011. [Google Scholar]
- Arnett, E.B.; Schirmacher, M.R.; Huso, M.M.P.; Hayes, J.P. Patterns of Bat Fatality at the Casselman Wind Project in South-Central Pennsylvania: 2008 Annual Report; Bats and wind energy cooperative and the Pennsylvania Game Commission; Bat Conservation International: Austin, TX, USA, 2009. [Google Scholar]
- BioResource Consultants, Inc. 2009/2010 Annual Report: Bird and Bat Mortality Monitoring; Los Angeles Department of Water and Power: Kern County, CA, USA, 2010. [Google Scholar]
- Brown, K.; Smallwood, K.S.; Szewczak, J.; Karas, B. Final 2012–2015 Report Avian and Bat Monitoring Project Vasco Winds, LLC.; NextEra Energy Resources: Livermore, CA, USA, 2016. [Google Scholar]
- Brown, W.K.; Hamilton, B.L. Monitoring of Bird and Bat Collisions with Wind Turbines at the Summerview Wind Power Project, Alberta 2005–2006; Vision Quest Windelectric: Calgary, AB, Canada, 2006. [Google Scholar]
- Byrne, S. Bird movements and collision mortality at a large horizontal axis wind turbine. Cal-Neva Wildl. Trans. 1983, 1983, 76–83. [Google Scholar]
- Chatfield, A.; Sonnenberg, M.; Bay, K.; WEST, Inc. Avian and Bat Mortality Monitoring at the Alta-Oak Creek Mojave Project Kern County, California, Final Report for the First Year of Operation; Alta Windpower Development, LLC.: Mojave, CA, USA, 2012. [Google Scholar]
- Derby, C.; Dahl, A.; Erickson, W.; Bay, K.; Hoban, J. Post-Construction Monitoring Report for Avian and Bat Mortality at the NPPD Ainsworth Wind Farm; Nebraska Public Power District: Columbus, OH, USA, 2007. [Google Scholar]
- DeWitt, S. Bat Fatality Monitoring Report for the Pigeon Creek Wind Turbine, Adams County, Near Payson, Illinois. In Final Report for the Habitat Conservation Plan; Adams Electric Cooperative; John Wood Community College: Quincy, IL, USA, 2011. [Google Scholar]
- Downes, S.; Gritzki, R. Harvest Wind Project Wildlife Monitoring Report; Harvest Wind Project: Roosevelt, DC, USA, 2012. [Google Scholar]
- Enk, T.; Bay, K.; Sonnenberg, M.; Boehrs, J.R. Year 1 Avian and Bat Monitoring Report, Biglow Canyon Wind Farm—Phase III, Sherman County, Oregon, September 13, 2010–September 9, 2011; Portland General Electric Company: Portland, OR, USA, 2011. [Google Scholar]
- Enk, T.; Bay, K.; Sonnenberg, M.; Flaig, J.; Boehrs, J.R.; Palochak, A. Amended Year 1 Post-Construction Avian and Bat Monitoring Report; Portland General Electric Company: Portland, OR, USA, 2012. [Google Scholar]
- Enk, T.; Bay, K.; Sonnenberg, M.; Baker, J.; Kesterke, M.; Boehrs, J.R.; Palochak, A. Biglow Canyon Wind Farm Phase I Post-Construction Avian and Bat Monitoring Second Annual Report, Sherman County, Oregon; Portland General Electric Company: Portland, OR, USA, 2010. [Google Scholar]
- Enz, T.; Bay, K.; Nomani, S.; Kesterke, M. Bird and Bat Fatality Monitoring Study Windy Flats and Windy Point II Wind Energy Projects, Klickitat County, Washington, Final Report; Windy Flats Partners, LLC.: Goldendale, DC, USA, 2011. [Google Scholar]
- Enz, T.; Bay, K. Post-Construction Fatality Surveys for the Juniper Canyon Wind Project, Iberdrola Renewables; Iberdrola Renewables, LLC.: Portland, OR, USA, 2010. [Google Scholar]
- Enz, T.; Bay, K. Post-Construction Avian and Bat Fatality Monitoring Study, Tuolumne Wind Project, Klickitat County, Washington; Turlock Irrigation District: Turlock, CA, USA, 2010. [Google Scholar]
- Erickson, W. Preliminary Fatality Results: Meyersdale Wind Energy Facility. In Proceedings of the Proceedings: Onshore Wildlife Interactions with Wind Developments: Research Meeting V. The National Wind Coordinating Committee, Resolve, Washington, DC, USA, 2005. [Google Scholar]
- Erickson, W.; Chatfield, A.; Bay, K. Review of Avian Studies in the Tehachapi Pass Wind Resource Area, Kern County, California; Western Ecosystems Technology: Cheyenne, WY, USA, 2009. [Google Scholar]
- Erickson, W.P.; Kronner, K.; Gritski, B. Nine Canyon Wind Power Project Avian and Bat Monitoring Report; Nine Canyon Technical Advisory Committee; Energy Northwest: Richland, WA, USA, 2003. [Google Scholar]
- Erickson, W.P.; Jeffrey, J.; Kronner, K.; Bay, K. Stateline Wind Project Wildlife Monitoring Annual Report; FPL Energy; The Oregon Office of Energy and Stateline Technical Advisory Committee: Miami, FL, USA, 2003. [Google Scholar]
- Erickson, W.P.; Jeffrey, J.; Kronner, K.; Bay, K. Stateline Wind Project Wildlife Monitoring Final Report; FPL Energy; The Oregon Energy Facility Siting Council and Stateline Technical Advisory Committee: Miami, FL, USA, 2004. [Google Scholar]
- Erickson, W.P.; Johnson, G.D.; Strickland, M.D.; Kronner, K. Final Report: Avian and Bat Mortality Associated with the Vansycle Wind Project, Umatilla County, Oregon: 1999 Study Year; Umatilla County Department of Resource Services and Development: Pendleton, OR, USA, 2000. [Google Scholar]
- Erickson, W.P.; Jeffrey, J.D.; Poulton, V.K.; WEST, Inc. Puget Sound Energy Wild Horse Wind Facility Post-Construction Avian and bBat Monitoring First Annual Report; Puget Sound Energy: Ellensburg, DC, USA, 2008. [Google Scholar]
- Fiedler, J.K. Assessment of Bat Mortality and Activity at Buffalo Mountain Wind Farm, Eastern Tennessee. Master’s Thesis, University of Tennessee, Knoxville, TN, USA, 2004. [Google Scholar]
- Fiedler, J.K.; Henry, T.H.; Tankersley, R.D.; Nicholson, C.P. Results of Bat and Bird Mortality Monitoring at the Expanded Buffalo Mountain Windfarm, 2005; Tennessee Valley Authority: Knoxville, TN, USA, 2007. [Google Scholar]
- Gritzki, R.; Kronner, K.; Downes, S. White Creek I Wildlife Monitoring Annual Summary: Winter 2007–2008 through Fall 2008; White Creek Wind I LLC.: Roosevelt, DC, USA, 2008. [Google Scholar]
- Gritzki, R.; Downes, S.; Kronner, K. White Creek I Wildlife Monitoring Annual Summary: Winter 2008–2009 through Fall 2009; White Creek Wind I LLC.: Roosevelt, DC, USA, 2009. [Google Scholar]
- Gritzki, R.; Downes, S.; Kronner, K. Klondike III (Phase 1) Wind Power Project Wildlife Monitoring Year One Summary; Iberdrola Renewables; Klondike Wind Power III LLC.: Portland, OR, USA, 2009. [Google Scholar]
- Gruver, J.; Sonnenburg, M.; Bay, K.; Erickson, W. Post-Construction Bat and Bird Fatality Study at the Blue Sky Green Field Wind Energy Center, Fond du Lac County, Wisconsin; We Energies: Milwaukee, WI, USA, 2009. [Google Scholar]
- Higgins, K.F.; Dieter, C.D.; Usgaard, R.E. Monitoring of Seasonal Bird Activity and Mortality on Unit 2 at the Buffalo Ridge Windplant, Minnesota; South Dakota Cooperative Fish and Wildlife Research Unit; South Dakota State University: Brookings, SD, USA, 1995. [Google Scholar]
- Howe, R.; Atwater, R. The Potential Effects of Wind Power Facilities on Resident and Migratory Birds in Eastern Wisconsin; Wisconsin Department of Natural Resources: Monona, WI, USA, 1999. [Google Scholar]
- Howe, R.W.; Evans, W.; Wolf, A.T. Effects of Wind Turbines on Birds and Bats in Northeastern Wisconsin; Wisconsin Public Service Corporation and Madison Gas and Electric Company: Green Bay, WI, USA, 2002. [Google Scholar]
- Howell, J.A.; Didonato, J.E. Assessment of Avian Use and Mortality Related to Wind Turbine Operations, Altamont Pass, Alameda and Contra Costa Counties, California; US Windpower Inc.: Livermore, CA, USA, 1991. [Google Scholar]
- Howell, J.A.; Noone, J. Examination of Avian Use and Mortality at a U.S. Windpower Wind Energy Development Site, Montezuma Hills, Solano County, California; Solano County Department of Environmental Management: Fairfield, CA, USA, 1992. [Google Scholar]
- Harvey & Associates. Montezuma II Wind Energy Center Post-Construction Monitoring Report, Year-1; NextEra Energy Montezuma II Wind, LLC.: Juno Beach, FL, USA, 2013. [Google Scholar]
- ICF International. Montezuma Wind LLC (Montezuma I) 2011 Avian and Bat Fatality Monitoring Report; NextEra Energy Resources: Livermore, CA, USA, 2012. [Google Scholar]
- ICF International. Final Report Altamont Pass Wind Resource Area Bird Fatality Study, Monitoring Years 2005–2013; Alameda County Community Development Agency: Hayward, CA, USA, 2016. [Google Scholar]
- Insignia Environmental. Draft Final Report for the Buena Vista Avian and Bat Monitoring Project; County of Contra Costa: Martinez, CA, USA, 2011. [Google Scholar]
- Jain, A.P. Bird and Bat Behavior and Mortality at a Northern Iowa Windfarm. Master’s Thesis, Iowa State University, Ames, IA, USA, 2005. [Google Scholar]
- Jain, A.; Kerlinger, P.; Curry, R.; Slobodnik, L. Annual Report for the Maple Ridge Wind Power Project Postconstruction Bird and Bat Fatality Study-2006; PPM Energy and Horizon Energy, 2007. [Google Scholar]
- Jain, A.; Kerlinger, P.; Curry, R.; Slobodnik, L.; Quant, J.; Pursell, D. Annual Report for the Noble Bliss Windpark, LLC Post-Construction Bird and Bat Fatality Study-2008; Noble Environmental Power, LLC.: Bliss, NY, USA, 2009. [Google Scholar]
- Jain, A.; Kerlinger, P.; Curry, R.; Slobodnik, L.; Histed, J.; Meacham, J. Annual Report for the Noble Clinton Windpark, LLC Post-Construction Bird and Bat Fatality Study-2008; Noble Environmental Power, LLC.: Bliss, NY, USA, 2009. [Google Scholar]
- Jain, A.; Kerlinger, P.; Curry, R.; Slobodnik, L.; Fuerst, A.; Hansen, C. Annual Report for the Noble Ellenburg Windpark, LLC Post-Construction Bird and Bat Fatality Study-2008; Noble Environmental Power, LLC.: Bliss, NY, USA, 2009. [Google Scholar]
- Jeffrey, J.; Bay, K.; Erickson, W.; Sonnenberg, M.; Baker, J.; Kesterke, M.; Boehrs, J.R.; Palochak, A. Portland General Electric Biglow Canyon Wind Farm Phase I Post-Construction Avian and Bat Monitoring First Annual Report, Sherman County, Oregon: January, 2008–December, 2008; Portland General Electric Company: Portland, OR, USA, 2010. [Google Scholar]
- Johnson, G.J.; Erickson, W.P.; White, J.; McKinney, R. Avian and Bat Mortality during the First Year of Operation at the Klondike Phase I Wind Project, Sherman County, Oregon; Northwestern Wind Power: Goldendale, DC, USA, 2003. [Google Scholar]
- Johnson, G.J.; Erickson, W.P.; Strickland, M.D.; Shepherd, M.F.; Shepherd, D.A.; Sarappo, S.A. Collision mortality of local and migrant birds at a large-scale wind-power development on Buffalo Ridge, Minnesota. Wildl. Soc. Bull. 2002, 30, 879–887. [Google Scholar]
- Johnson, G.D.; Martinson, L.; Sonnenberg, M.; Bay, K.; WEST, Inc. Post-Construction Monitoring Studies-First Annual Report, Glenrock & Rolling Hills Wind-Energy Facility, Carbon County, Wyoming: May 20, 2009–May 19, 2010; PacifiCorp Energy: Salt Lake City, UT, USA, 2010. [Google Scholar]
- Johnson, G.D.; Martinson, L.; Sonnenberg, M.; Bay, K.; WEST, Inc. Post-Construction Monitoring Studies-Second Annual Report: Glenrock & Rolling Hills Wind Energy Facility, Converse County, Wyoming. Draft Report: May 24, 2010–May 26, 2011; PacifiCorp Energy: Salt Lake City, UT, USA, 2011. [Google Scholar]
- Johnson, G.; Rintz, T.; Sonnenberg, M.; Bay, K.; WEST, Inc. Post-Construction Monitoring Studies-First Annual Report, Seven Mile Hill Wind-Energy Facility, Carbon County, Wyoming: May 18, 2009–May 13, 2010; PacifiCorp Energy: Salt Lake City, UT, USA, 2010. [Google Scholar]
- Johnson, G.; Rintz, T.; Sonnenberg, M.; Bay, K.; WEST, Inc. Post-Construction Monitoring Studies-Second Annual Report, Seven Mile Hill Wind Energy Facility, Carbon County, Wyoming, Draft Report: May 19, 2010–May 18, 2011; PacifiCorp Energy: Salt Lake City, UT, USA, 2011. [Google Scholar]
- Kerlinger, P. An Assessment of the Impacts of Green Mountain Power Corporation’s Wind Power Facility on Breeding and Migrating Birds in Searsburg, Vermont, July 1996–July 1998; National Renewable Energy Laboratory: Golden, CO, USA, 2002. [Google Scholar]
- Kerlinger, P.; Curry, R.; Ryder, R. Ponnequin Wind Energy Project: Reference Site Avian Study, January 1, 1998–December 31, 1998; National Renewable Energy Laboratory: Golden, CO, USA, 2000. [Google Scholar]
- Kerlinger, P.; Culp, L.; Curry, R. Year One Report: Post-Construction Avian Monitoring Study for the High Winds Wind Power Project Solano County, California; High Winds, LLC.; FPL Energy: Birds Landing, CA, USA, 2005. [Google Scholar]
- Kerlinger, P.; Curry, R.; Culp, L.; Jain, A.; Wilkerson, C.; Fischer, B.; Hasch, A. Post-Construction Avian and Bat Fatality Monitoring Study for the High Winds Wind Power Project, Solano County, California: Two Year Report; High Winds, LLC.; FPL Energy: Birds Landing, CA, USA, 2006. [Google Scholar]
- Kerlinger, P.; Curry, R.; Culp, L.; Fischer, B.; Hasch, A.; Jain, A.; Wilkerson, C. Post-Construction Avian Monitoring Study for the Shiloh I Wind Power Project, Solano County, California: Two Year Report; PPM Energy: Portland, OR, USA, 2008. [Google Scholar]
- Kerlinger, P.; Curry, R.; Hasch, A.; Guarnaccia, J. Migratory Bird & Bat Monitoring Study at the Crescent Ridge Wind Power Project, Bureau County, Illinois: September 2005–August 2006; Orrick Herrington & Sutcliffe, LLP.: Washington, DC, USA, 2007. [Google Scholar]
- Kerns, J. Preliminary fatality results—Mountaineer Wind Energy Center, WV. In Proceedings of the Onshore wildlife interactions with wind developments: Research meeting V: The National Wind Coordinating Committee, Resolve, Washington, DC, USA, 3–4 November 2004. [Google Scholar]
- Koford, R.; Jain, A.; Zenner, G.; Hancock, A. Avian Mortality Associated with the Top of Iowa Wind Farm, 2005.
- Kronner, K.; Gritski, B.; Downes, S. Big Horn Wind Power Project Wildlife Fatality Monitoring Study 2006–2007; PPM Energy: Portland, OR, USA, 2008. [Google Scholar]
- Kronner, K.; Gritski, B.; Ruhlen, Z.; Ruhlen, T. Leaning Juniper Phase 1 Wind Power Project 2006–2007 Wildlife Monitoring Annual Report; PacifiCorp Energy: Portland, OR, USA, 2007. [Google Scholar]
- McCreight, J.; Lehnen, S. Annual Report: High Plains and McFadden Ridge I Wind Energy Facility Avian and Bat Fatality Survey and Pronghorn Antelope and Greater Sage Grouse Displacement Assessment; PacifiCorp Energy: Salt Lake City, UT, USA, 2010. [Google Scholar]
- Miller, A. Patterns of Avian and Bat Mortality at a Utility-Scaled Wind Farm on the Southern High Plains. Master’s Thesis, Texas Tech University, Lubbock, TX, USA, 2008. [Google Scholar]
- New Jersey Audubon Society. Post-Construction Wildlife Monitoring at the Atlantic City Utilities Authority-Jersey Atlantic Wind Power Facility: Periodic Report Covering Work Conducted between 20 July and 31 December 2007; New Jersey Board of Public Utilities: Newark, NJ, USA, 2008. [Google Scholar]
- New Jersey Audubon Society. Post-Construction Wildlife Monitoring at the Atlantic City Utilities Authority-Jersey Atlantic Wind Power Facility: Periodic Report Covering Work Conducted between 1 August and 30 September 2008; New Jersey Board of Public Utilities: Newark, NJ, USA, 2008. [Google Scholar]
- New Jersey Audubon Society. Post-Construction Wildlife Monitoring at the Atlantic City Utilities Authority-Jersey Atlantic Wind Power Facility: Project Status Report IV; New Jersey Board of Public Utilities: Newark, NJ, USA, 2009. [Google Scholar]
- Nicholson, C.P. Buffalo Mountain Windfarm Bird and Bat Mortality Monitoring Report: October, 2001–September, 2002; Tennessee Valley Authority: Knoxville, TN, USA, 2003. [Google Scholar]
- Northwest Wildlife Consultants, Inc.; WEST, Inc. Avian and Bat Monitoring Report for the Klondike II Wind Power Project, Sherman County, Oregon; PPM Energy: Portland, OR, USA, 2007. [Google Scholar]
- Orloff, S.; Flannery, A. Wind Turbine Effects on Avian Activity, Habitat Use, and Mortality in Altamont Pass and Solano County Wind Resource Areas: 1989–1991; California Energy Commission: Sacramento, CA, USA, 1992. [Google Scholar]
- Osborn, R.G.; Higgins, K.F.; Usgaard, R.E.; Dieter, C.D.; Neiger, R.D. Bird mortality associated with wind turbines at the Buffalo Ridge Wind Resource Area, Minnesota. Am. Midl. Nat. 2000, 143, 41–52. [Google Scholar] [CrossRef]
- Schmidt, E.; Piaggio, A.J.; Bock, C.E.; Armstrong, D.M. National Wind Technology Center Site Environmental Assessment: Bird and Bat Use and Fatalities-Final Report; National Renewable Energy Laboratory: Golden, CO, USA, 2003. [Google Scholar]
- Smallwood, K.S.; Karas, B. Avian and Bat Fatality Rates at Old-Generation and Repowered Wind Turbines in California. J. Wildl. Manag. 2009, 73, 1062–1071. [Google Scholar] [CrossRef]
- Smallwood, K.S.; Thelander, C.G. Bird mortality in the Altamont Pass Wind Resource Area, California. J. Wildl. Manag. 2008, 72, 215–223. [Google Scholar] [CrossRef]
- Smallwood, K.S.; Bell, D.A.; Snyder, S.A.; DiDonato, J.E. Novel scavenger removal trials increase estimates of wind turbine-caused avian fatality rates. J. Wildl. Manag. 2010, 74, 1089–1097. [Google Scholar] [CrossRef]
- Smallwood, K.S. Inter-annual Fatality Rates of Target Raptor Species from 1999 through 2012 in the Altamont Pass Wind Resources Area; County of Alameda: Hayward, CA, USA, 2013. [Google Scholar]
- Smallwood, K.S.; Thelander, C. Developing methods to reduce bird mortality in the Altamont Pass Wind Resource Area; California Energy Commission: Sacramento, CA, USA, 2004. [Google Scholar]
- Smallwood, K.S.; Thelander, C. Bird mortality at the Altamont Pass Wind Resource Area, March 1998–September 2001 Final Report; National Renewable Energy Laboratory: Golden, CO, USA, 2005. [Google Scholar]
- Stantec Consulting. 2007 Spring, Summer, and Fall Post-Construction Bird and Bat Mortality Study at the Mars Hill Wind Farm, ME; UPC Wind Management, LLC.: Cumberland, ME, USA, 2008. [Google Scholar]
- Stantec Consulting. Wolfe Island EcoPower Center Post-Construction Follow-Up Plan Bird and Bat Resources: Monitoring Report no. 2, July–December 2009; TransAlta Corporation’s Wholly Own Subsidiary, Canadian Renewable Energy Corporation, 2010. [Google Scholar]
- Strickland, M.D.; Young, D.P., Jr.; Johnson, G.D.; Derby, C.E.; Erickson, W.P.; Kern, J.W. Wildlife Monitoring Studies for the SeaWest Wind Power Development, Carbon County, Wyoming; Avian Subcommittee of the National Wind Coordinating Committee by LGL: King City, ON, Canada, 2000. [Google Scholar]
- Tetra Tech. Hatchet Ridge Wind Farm Post-Construction Mortality Monitoring Year Two Annual Report; Hatchet Ridge Wind, LLC., 2013. [Google Scholar]
- Tierney, R. Buffalo Gap I Wind Farm Avian Mortality Study, February 2006–January 2007, Final Survey Report; AES SeaWest, Inc. TRC: Albuquerque, NM, USA, 2007. [Google Scholar]
- TRC Environmental Corporation. Post-Construction Avian and Bat Fatality Monitoring and Grassland Bird Placement Surveys at the Judith Gap Wind Energy Project, Wheatland County, Montana; Judith Gap Energy LLC.: Chicago, IL, USA, 2008. [Google Scholar]
- URS Corporation. Final Goodnoe Hills Wind Project Avian Mortality Monitoring Report; PacifiCorp: Salt Lake City, UT, USA, 2010. [Google Scholar]
- URS Corporation; Erickson, W.; Sharp, L. Phase 1 and Phase 1A Avian Mortality monitoring report for 2004–2005 for the Solano Wind Project; Sacramento Municipal Utility District: Sacramento, CA, USA, 2005. [Google Scholar]
- WEST, Inc. Diablo Winds Wildlife Monitoring Progress Report: March 2005–February 2006; 2006. [Google Scholar]
- WEST; DeTect; TX-ESA; EcoStats. Avian and Bat Fatality Study, Gulf Wind I Windfarm Energy Facility, Kenedy County, Texas: Interim Report: March–May 2010; Pattern Energy: Houston, TX, USA, 2010. [Google Scholar]
- Whitford, J. Ripley Wind Power Project Post-Construction Monitoring Report; Suncor Energy Products: Calgary, AB, Canada, 2009. [Google Scholar]
- Young, D.P., Jr.; Erickson, W.P.; Strickland, M.D.; Good, R.E.; Sernka, K.J. Comparison of Avian Responses to UV-Light-Reflective Paint on Wind Turbines; National Renewable Energy Laboratory: Golden, CO, USA, 2003. [Google Scholar]
- Young, D.P.; Erickson, W.P.; Good, R.E.; Strickland, M.D.; Johnson, G.D. Final Report: Avian and Bat Mortality Associated with the Initial Phase of the Foote Creek Rim Windpower Project, Carbon County, Wyoming; WEST: Cheyenne, WY, USA, 2003. [Google Scholar]
- Young, D.P., Jr.; Erickson, W.P.; Jeffrey, J.D.; Poulton, V.K. Puget Sound Energy Hopkins Ridge Wind Project Phase 1 Post-Construction Avian and Bat Monitoring First Annual Report; Puget Sound Energy: Dayton, WA, USA, 2006. [Google Scholar]
- Young, D.P., Jr.; Jeffrey, J.D.; Erickson, W.P.; Bay, K.; Poulton, V.K.; Kronner, K.; Gritski, B.; Baker, J. Eurus Combine Hills Turbine Ranch phase 1 Post Construction Wildlife Monitoring First Annual Report, February 2004–February 2005; Eurus Energy America Corporation: San Diego, CA, USA; Combine Hills Technical Advisory Committee: Umatilla County, OR, USA, 2006. [Google Scholar]
- Young, D.; Nations, C.; Lout, M.; Bay, K. Post-Construction Monitoring Study, Criterion Wind Project, Garrett County, Maryland: April–November 2012; Criterion Power Partners LLC.: Oakland, MD, USA, 2013. [Google Scholar]
- Smallwood, K.S. Estimating wind turbine-caused bird mortality. J. Wildl. Manag. 2007, 71, 2781–2791. [Google Scholar] [CrossRef]
- Smallwood, K.S.; Bell, D.A.; Walther, E.L.; Leyvas, E.; Standish, S.; Mount, J.; Karas, B. Estimating wind turbine fatalities using integrated detection trials. J. Wildl. Manag. 2018, 82, 1169–1184. [Google Scholar] [CrossRef]
- Korner-Nievergelt, F.; Korner-Nievergelt, P.; Behr, O.; Niermann, I.; Brinkmann, R.; Hellriegel, B. A new method to determine bird and bat fatality at wind energy turbines from carcass searches. Wildl. Biol. 2011, 17, 350–363. [Google Scholar] [CrossRef] [Green Version]
- Smallwood, K.S.; Bell, D.A.; Standish, S. Dogs detect larger wind energy effects on bats and birds. J. Wildl. Manag. 2020, in press. [Google Scholar]
- Harvey & Associates. Golden Hills Wind Energy Center Post-Construction Fatality Monitoring Report: Year 2; Golden Hills Wind LLC.: Livermore, CA, USA, 2018. [Google Scholar]
- Smallwood, K.S.; Bell, D.A. Relating bat passage rates to wind turbine fatalities. Diversity 2020, 12, 84. [Google Scholar] [CrossRef] [Green Version]
- Huso, M.M.P. An estimator of wildlife fatality from observed carcasses. Environmetrics 2010, 22, 318–329. [Google Scholar] [CrossRef]
- Warren-Hicks, W.; Newman, J.; Wolpert, R.; Karas, B.; Tran, L. Improving Methods for Estimating Fatality of Birds and Bats at Wind Energy Facilities; California Energy Commission: Sacramento, CA, USA, 2013. [Google Scholar]
- Smallwood, K.S. Long search intervals under-estimate bird and bat fatalities caused by wind turbines. Wildl. Soc. Bull. 2017, 41, 224–230. [Google Scholar] [CrossRef]
- Homan, H.J.; Linz, G.M.; Peer, B.D. Dogs increase recovery of passerine carcasses in dense vegetation. Wildl. Soc. Bull. 2001, 29, 292–296. [Google Scholar]
- Arnett, E. A Preliminary Evaluation on the use of dogs to recover bat fatalities at wind energy facilities. Wildl. Soc. Bull. 2006, 34, 1440–1445. [Google Scholar] [CrossRef]
- Paula, J.; Leal, M.C.; Silva, M.J.; Mascarenhas, R.; Costa, H.; Mascarenhas, M. Dogs as a tool to improve bird-strike mortality estimates at wind farms. J. Nat. Conserv. 2011, 19, 202–208. [Google Scholar] [CrossRef]
- Mathews, F.; Swindells, M.; Goodhead, R.; August, T.A.; Hardman, P.; Linton, D.M.; Hosken, D.L. Effectiveness of search dogs compared with human observers in locating bat carcasses at wind-turbine sites: A blinded randomized trial. Wildl. Soc. Bull. 2013, 37, 34–40. [Google Scholar] [CrossRef]
- Reyes, G.A.; Rodriguez, M.J.; Lindke, K.T.; Ayres, K.L.; Halterman, M.D.; Boroski, B.R.; Johnston, D.S. Searcher efficiency and survey coverage affect precision of fatality estimates. J. Wildl. Manag. 2016, 80, 1488–1496. [Google Scholar] [CrossRef]
- Arnett, E.B.; Brown, W.K.; Erickson, W.P.; Fiedler, J.K.; Hamilton, B.L.; Henry, T.H.; Jain, A.; Johnson, G.D.; Kerns, J.; Koford, R.R.; et al. Patterns of bat fatalities at wind energy facilities in North America. J. Wildl. Manag. 2007, 72, 61–75. [Google Scholar] [CrossRef]
- Hull, C.L.; Muir, S. Search areas for monitoring bird and bat carcasses at wind farms using a Monte-Carlo model. Aust. J. Environ. Manag. 2010, 17, 77–87. [Google Scholar] [CrossRef]
- Smallwood, K.S.; Bell, D.A.; Karas, B.; Snyder, S.A. Response to Huso and Erickson comments on novel scavenger removal trials. J. Wildl. Manag. 2013, 77, 216–225. [Google Scholar] [CrossRef]
- Rodhouse, T.J.; Rodriguez, R.M.; Banner, K.M.; Ormsbee, P.C.; Barnett, J.; Irvine, K.M. Evidence of regionwide bat population decline from long-term monitoring and Bayesian occupancy models with empirically informed priors. Ecol. Evol. 2019, 1–11. [Google Scholar] [CrossRef] [Green Version]
- Kunz, T.H.; Arnett, E.B.; Erickson, W.P.; Hoar, A.R.; Johnson, G.D.; Larkin, R.P.; Strickland, M.D.; Thresher, R.W.; Tuttle, M.D. Ecological impacts of wind energy development on bats: Questions, research needs, and hypotheses. Front. Ecol. Environ. 2007, 5, 315–324. [Google Scholar] [CrossRef] [Green Version]
- Frick, W.F.; Baerwald, E.F.; Pollock, J.F.; Barclay, R.M.R.; Szymanski, J.A.; Weller, T.J.; Russell, A.L.; Loeb, S.C.; Medellin, R.A.; McGuire, L.P. Fatalities at wind turbines may threaten population viability of a migratory bat. Biol. Conserv. 2017, 209, 172–177. [Google Scholar] [CrossRef]
- Sinclair, K.; DeGeorge, E. Framework for Testing the Effectiveness of Bat and Eagle Impact-Reduction Strategies at Wind Energy Projects. In Echnical Report, NREL/TP-5000-65624; Smallwood, S., Schirmacher, M., Morrison, M., Eds.; National Renewable Energy Laboratory: Golden, CO, USA, 2016. [Google Scholar]
- Baerwald, E.F.; Edworthy, J.; Holder, M.; Barclay, R.M.R. A large-scale mitigation experiment to reduce bat fatalities at wind energy facilities. J. Wildl. Manag. 2009, 73, 1077–1081. [Google Scholar] [CrossRef]
- Arnett, E.B.; Huso, M.M.P.; Schirmacher, M.R.; Hayes, J.P. Altering turbine speed reduces bat mortality at wind-energy facilities. Front. Ecol. Environ. 2011, 9, 209–214. [Google Scholar] [CrossRef] [Green Version]
- Behr, O.; Brinkmann, R.; Hochradel, K.; Mages, J.; Korner-Nievergelt, F.; Niermann, I.; Reich, M.; Simon, R.; Weber, N.; Nagy, M. Mitigating bat mortality with turbine-specific curtailment algorithms: A model-based approach. In Wind Energy and Wildlife Impacts: Proceedings from the CWW 2015 Conference; Köppel, J., Ed.; Springer: Cham, Switzerland, 2017; pp. 135–160. [Google Scholar]
- Hayes, M.A.; Hooton, L.A.; Gilland, K.L.; Grandgent, C.; Smith, R.L.; Lindsay, S.R.; Collins, J.D.; Schumacher, S.M.; Rabie, P.A.; Gruver, J.C.; et al. A smart curtailment approach for reducing bat fatalities and curtailment time at wind energy facilities. Ecol. Appl. 2019, e01881. [Google Scholar] [CrossRef] [PubMed]
- Romano, W.B.; Skalski, J.R.; Townsend, R.L.; Kinzie, K.W.; Koppinger, K.D.; Miller, M.F. Evaluation of an acoustic deterrent to reduce bat mortalities at an Illinois wind farm. Wildl. Soc. Bull. 2019, 1–11. [Google Scholar] [CrossRef] [Green Version]
Figure 1.
Through 2014, project-level bat fatality rates among North American wind projects increased with increasing tower height (A) and decreasing fatality search interval (B), the regression residuals of which were symmetric for both tower height (blue circles) and search interval (maroon squares) (C). Fatality search interval decreased with increasing tower height (D).

Figure 2.
The number of bat species found as wind turbine fatalities declined, with mean fatality search interval used among wind turbines of ≥0.66-MW of rated capacity in North American wind projects through 2014.
Figure 2.
The number of bat species found as wind turbine fatalities declined, with mean fatality search interval used among wind turbines of ≥0.66-MW of rated capacity in North American wind projects through 2014.

Figure 3.
Mean number of ha/species needed to be searched per species of bat represented as wind turbine fatalities increased with increasing fatality search interval (left), and increased 5-fold for bat species typically weighing <10 g (right), among North American wind projects through 2014. The filled square represents an outlier.

Figure 4.
Species-specific bat fatalities/MW/year increased with the number of wind projects, where bats were found as fatalities across North America through 2014, and did so at an increased rate where search intervals averaged <10 days. The filled square represents an outlier of one bat species detected at a single study.

Figure 5.
For most species, species-specific estimates of USA-wide bat fatalities/MW/year increased less than proportionally (red line connecting the axes’ origin to the all-bats estimates), with mean project-specific fatalities/MW/year. USA-wide estimates were adjusted to installed wind energy capacity: USA-wide , where P was proportion of the area of the USA’s lower 48 states covered by the approximated geographic range of the ith species (P = 1 in the case of all bats). Those species whose estimates fell along the line that was proportional to the all-bats estimates either occurred within a small geographic range or across nearly all of the USA.

Figure 6.
Averaged among regions of the USA’s lower 48 states, (95% CI) was higher than (95% CI) for most species of bat through 2014.
Figure 6.
Averaged among regions of the USA’s lower 48 states, (95% CI) was higher than (95% CI) for most species of bat through 2014.


Table 1.
Fatality monitoring study attributes that I recorded from available reports through 2014, where attributes in italics were not required for fatality estimation, but useful for hypothesis-testing.
Table 1.
Fatality monitoring study attributes that I recorded from available reports through 2014, where attributes in italics were not required for fatality estimation, but useful for hypothesis-testing.
| Attribute | Explanation |
|---|---|
| Project size | MW of rated capacity or number of turbines identified to model |
| Extent of study | Number of MW or turbines monitored for fatalities |
| Tower height | Height (m) from ground to rotor hub |
| Project start date | Date of initial commercial operations |
| Monitoring period | Start and end dates of fatality monitoring per search interval (below) |
| Search interval | Average or scheduled number of days between searches |
| Searchers | Humans or dogs |
| Max search radius | Maximum distance (m) searchers searched from turbine, often measurable from search plot dimensions |
| Transect width | Distance (m) separating fatality search transects within plot |
| Omissions | Whether fatalities were omitted as incidental or clearing-search finds |
| Fatalities | Species, dates and wind turbine attributes of detected fatalities |
| Distance from turbine | Distance (m) between fatality and the nearest wind turbine |
Table 2.
Weighted mean (95% CI) annual bat fatalities/MW among US wind turbines of ≥0.66 MW in rated capacity, monitored ≥0.5 years, and searched at intervals <10 days or ≥10 days, where N was the number of combinations of monitored wind projects, wind turbine size, and search interval.
Table 2.
Weighted mean (95% CI) annual bat fatalities/MW among US wind turbines of ≥0.66 MW in rated capacity, monitored ≥0.5 years, and searched at intervals <10 days or ≥10 days, where N was the number of combinations of monitored wind projects, wind turbine size, and search interval.
| Species/Group | Mass (g) | Fatalities/MW/Year among Turbines ≥0.66 MW | ||||||
|---|---|---|---|---|---|---|---|---|
| I < 10 days | I ≥ 10 days | |||||||
| 95% CI | N | 95% CI | N | |||||
| Mexican free-tailed bat, Tadarida brasiliensis | 10.0 | 2.709 | 0.332–5.120 | 5 | 0.288 | 0.063–0.606 | 14 | 9.4 |
| Big brown bat, Eptesicus fuscus | 20.5 | 0.981 | 0.774–1.274 | 23 | 0.052 | 0.000–0.163 | 24 | 18.9 |
| Silver-haired bat, Lasionycteris noctivagans | 11.0 | 6.217 | 5.148–7.413 | 33 | 0.617 | 0.107–1.210 | 41 | 10.1 |
| Hoary bat, Lasiurus cinereus | 26.0 | 5.307 | 4.034–6.795 | 30 | 2.824 | 0.274–5.669 | 41 | 1.9 |
| Western red bat, Lasiurus blossevillii | 13 | 0.073 | 0.000–0.199 | 5 | 0.000 | 14 | ||
| Eastern red bat, Lasiurus borealis | 12.5 | 3.635 | 1.759–5.968 | 18 | 1.374 | 0.000–3.264 | 4 | 2.6 |
| Northern yellow bat, Lasiurus intermedius | 23.0 | 0.456 | 1 | 0 | ||||
| Tricolored bat, Perimyotis subflavus | 6.3 | 1.588 | 0.924–2.317 | 17 | 0.168 | 0.000–0.451 | 4 | 9.5 |
| Northern long-eared bat, Myotis septentrionalis | 7.4 | 0.241 | 0.171–0.310 | 9 | 0 | |||
| Little brown bat, Myotis lucifugus | 9.0 | 1.937 | 1.397–2.498 | 28 | 0.087 | 0.000–0.250 | 38 | 22.3 |
| California myotis, Myotis californicus | 4.3 | 5 | 0.004 | 0.000–0.012 | 14 | |||
| Western small-footed bat, Myotis ciliolabrum | 4.9 | 0.060 | 5 | 0.000 | 3 | |||
| Bat spp. | 0.993 | 0.849–1.186 | 35 | 1.002 | 0.158–1.941 | 42 | 1.0 | |
| All bats | 19.690 | 11.486–28.989 | 35 | 4.083 | 0.407–8.342 | 42 | 4.8 | |
Table 3.
Mean estimates of bat fatalities/MW/year at wind turbines ≥0.66 MW in rated capacity, monitored for ≥0.5 years, and whether based on fatality search intervals <10 days, , or ≥10 days , through 2014, within regions of the USA.
Table 3.
Mean estimates of bat fatalities/MW/year at wind turbines ≥0.66 MW in rated capacity, monitored for ≥0.5 years, and whether based on fatality search intervals <10 days, , or ≥10 days , through 2014, within regions of the USA.
| Region | |||||
|---|---|---|---|---|---|
| 95% CI | 95% CI | ||||
| Southwest | 1.89 | 0.12–3.95 | 1.21 | 0.51–1.97 | 1.6 |
| Pacific Northwest | 1.02 | 0.00–2.28 | 3.23 | 0.49–6.33 | 0.3 |
| Rocky Mountains | 2.44 | 1.51–3.46 | 8.16 | 1.02–15.64 | 0.3 |
| High Plains | 62.83 | 58.22–67.53 | 7.64 | 0.00–17.26 | 8.2 |
| Great Lakes | 16.74 | 10.20–24.04 | |||
| Appalachia/Northeast | 57.84 | 14.12–108.85 | |||
| Texas Gulf | 7.71 | ||||
| Texas High Plains | 7.05 | 0.16 | 44.1 | ||
| Southwest, Pacific Northwest, Rocky Mountains, High Plains, Texas High Plains | 15.04 | 11.97–18.26 | 4.08 | 0.41–8.34 | 3.7 |
| Total | 19.69 | 12.39–36.79 | 3.69 | 2.12–5.26 | 5.3 |
© 2020 by the author. Licensee MDPI, Basel, Switzerland. This article is an open access article distributed under the terms and conditions of the Creative Commons Attribution (CC BY) license (http://creativecommons.org/licenses/by/4.0/).
Share and Cite
MDPI and ACS Style
Smallwood, K.S. USA Wind Energy-Caused Bat Fatalities Increase with Shorter Fatality Search Intervals. Diversity 2020, 12, 98. https://doi.org/10.3390/d12030098
AMA Style
Smallwood KS. USA Wind Energy-Caused Bat Fatalities Increase with Shorter Fatality Search Intervals. Diversity. 2020; 12(3):98. https://doi.org/10.3390/d12030098
Chicago/Turabian StyleSmallwood, K. Shawn. 2020. "USA Wind Energy-Caused Bat Fatalities Increase with Shorter Fatality Search Intervals" Diversity 12, no. 3: 98. https://doi.org/10.3390/d12030098
Note that from the first issue of 2016, this journal uses article numbers instead of page numbers. See further details here.