Article

Evidence for Plio-Pleistocene Duck Mussel Refugia in the Azov Sea River Basins

by
Alena A. Tomilova
1,
Artem A. Lyubas
1,*,
Alexander V. Kondakov
1,
Ilya V. Vikhrev
1,
Mikhail Y. Gofarov
1,
Yulia S. Kolosova
1,
Maxim V. Vinarski
2,
Dmitry M. Palatov
3 and
Ivan N. Bolotov
1
1
Federal Center for Integrated Arctic Research, the Ural Branch of Russian Academy of Sciences, 163000 Arkhangelsk, Russia
2
Laboratory of Macroecology & Biogeography of Invertebrates, Saint Petersburg State University, 199034 Saint Petersburg, Russia
3
A.N. Severtzov Institute of Ecology and Evolution, Russian Academy of Sciences, 119071 Moscow, Russia
*
Author to whom correspondence should be addressed.
Diversity 2020, 12(3), 118; https://doi.org/10.3390/d12030118
Submission received: 25 February 2020 / Revised: 18 March 2020 / Accepted: 19 March 2020 / Published: 23 March 2020
(This article belongs to the Section Biodiversity Conservation)

Abstract

:
Freshwater mussels (Bivalvia: Unionoida) play an important role in freshwater habitats as ecosystem engineers of the water environment. Duck mussel Anodonta anatina is widely distributed throughout Europe, Siberia, and Western and Central Asia, which makes it a convenient object for biogeographic studies. In this study, we analyzed the divergence of A. anatina populations and discovered a separate genetic lineage distributed in rivers of the Azov Sea basin. This was confirmed by the high genetic distances between this group and previously defined populations, and by the position of this clade in the Bayesian phylogeny calibrated by an external substitution rate. Based on our approximate Bayesian computation (ABC) analysis, biogeographic scenarios of A. anatina dispersal in Europe and Northern, Western, and Central Asia over the Neogene–Quaternary were simulated. The haplogroup’s isolation in the rivers of the Azov Sea basin most likely occurred in the Late Pliocene that was probably facilitated by rearrangement of freshwater basins boundaries in the Ponto-Caspian Region. Population genetic indices show the stability of this group, which allowed it to exist in the river basins of the region for a long time. The discovery of a long-term refugium in the rivers of the Azov Sea led to a better understanding of freshwater fauna evolution in the Neogene–Quaternary and highlighted the importance of conservation of these freshwater animals in the region as a source of unique genetic diversity.

Graphical Abstract

1. Introduction

Under the influence of climate changes at various stages of the Late Cenozoic in Europe, there existed refugia in which the fauna survived and evolved in isolation without interaction with neighboring regions. The identification of such regions allows reconstructing biogeographic history of particular taxa in detail. Such studies also help to improve the knowledge on geological and climatic events of the Neogene–Quaternary (23.03 Ma–11.70 Ka).
Isolated lineages of freshwater animals were identified in several European regions on the basis of molecular genetic data. The Italian, Iberian, and Balkan Peninsulas became refugia for continental fauna during cold climate events in various geological periods [1,2,3,4].
In this respect, the eastern part of Europe has been poorly studied. The Ponto-Caspian Region was subject to significant climatic fluctuations and the sea level changes during the Neogene–Quaternary. Approximately 4.15 million years ago, according to a comprehensive reconstruction of paleoecological conditions [5], there was a transition from hyper-saline marine to fluviolacustrine freshwater environments associated with the progressive filling of the basin [6,7]. This environmental change approximately coincided in time with the Pliocene thermal optimum [8].
As a result of climatic changes and the transition to a freshwater environment in water bodies, various species of aquatic animals became distributed in this territory. This process was accompanied by emergence of isolated populations. For example, genetic studies of Barbus fish (Teleostei: Cyprinidae: Barbus) in Europe made it possible to identify the Ponto-Caspian subclade within this genus and corresponding refugium for freshwater fauna [9]. Connections between parts of the Ponto-Caspian basin were also studied on the basis of the phylogeny of marine invertebrates, i.e., amphipods [10]. The time split between the Caspian and Black Sea lineages of Pontogammarus maeoticus (Sovinskij, 1894) (3.83–4.31 Ma) was estimated using genetic data.
In our study, we add new evidence for the hypothesis that postulated the existence of the Ponto-Caspian Pliocene-Pleistocene refugium based on a study of the freshwater mussel species Anodonta anatina (Linnaeus, 1758) (Bivalvia: Unionidae). This freshwater mussel seems to represent one of the most appropriate models for identifying freshwater refugia and reconstructing connections between ancient freshwater basins. This species is widespread in fresh water bodies of the temperate zone of Eurasia, and also inhabits its subarctic part [11]. The mitochondrial genome of A. anatina is characterized by a low nucleotide substitution rate, and therefore can be used for reconstruction on the scale of several million years [12]. The results presented by Froufe et al. [13] indicated the existence of three genetic lineages of this species determined on the basis of mitochondrial DNA cytochrome c oxidase subunit I (COI) gene sequences.
In this work, we present the results of a broad-scale phylogeographic study of Anodonta anatina throughout Europe, and Northern, Western, and Central Asia to reconstruct the demographic history of its populations in the Pliocene and Pleistocene epochs under the influence of climatic and paleoecological changes.

2. Materials and Methods

2.1. Sample Collection, DNA Extraction, PCR and Sequencing

Samples of freshwater mussels were collected by hand from different water bodies in the following regions: Northeastern Europe (rivers of the Barents, White and Baltic Sea basins); Southeastern and Eastern Europe (rivers of the Black, Azov and Caspian Sea basins); and Northwestern, Southwestern, and Central Asia (rivers of the Mediterranean, Kara, and Laptev Sea basins) (Table S1). Sample locations from three divergent haplogroups of Anodonta anatina (IBER, ITAL, and AZOV) and samples from the Eurasian haplogroup (excluding samples from Siberia) are shown in Figure 1. Soft tissue snips for DNA analyses were preserved in 96% ethanol immediately after collection. The specimens were deposited in the collection of the Russian Museum of Biodiversity Hotspots (RMBH) of the Federal Center for Integrated Arctic Research, the Ural Branch of the Russian Academy of Sciences (FCIARtic).
Total genomic DNA was extracted from specimens using the NucleoSpin Tissue Kit (Macherey-Nagel GmbH and Co. KG, Germany), following the manufacturer’s protocol. The COI sequences were amplified and sequenced using primers LCO1490 and HCO2198 [14]. The PCR mix contained approximately 200 ng of total cellular DNA, 10 pmol of each primer, 200 μmol of each dNTP, 2.5 μL of PCR buffer (with 10 × 2 mmol MgCl2), 0.8 units of Taq DNA polymerase (SibEnzyme Ltd., Russia), and H2O, which was added up to a final volume of 25 μL. Thermocycling included one cycle at 95 °C (4 min), followed by 32–37 cycles of 95 °C (50 s), 46–50 °C (50 s), and 72 °C (50 s), and a final extension at 72 °C (5 min). Forward and reverse sequencing was performed using an automatic sequencer (ABI PRISM3730, Applied Biosystems) with ABI PRISM BigDye Terminator v.3.1 reagent kit [15]. The resulting COI gene sequences were checked manually using BioEdit v. 7.2.5 [16]. In addition, 255 COI sequences of Anodonta and Pseudanodonta specimens were supplied by NCBI GenBank (partially from our works [11,17] and from works of other researchers [2,12,13,18,19,20,21,22,23]). Four COI sequences of Sinanodonta lauta (Martens, 1877) [15], S. woodiana (Lea, 1834) [24], Unio pictorum (Linnaeus, 1758) [11], and U. tumidus Retzius, 1788 [11] were used as outgroup for phylogenetic analyses (Table S1).

2.2. Phylogenetic Analyses and Divergence Time Estimates

The alignment of the COI sequences was performed directly using the ClustalW algorithm [25]. For phylogenetic analyses, each of the 324 aligned sequences of Anodonta anatina was trimmed, leaving a 590 bp fragment. Then, identical COI sequences were removed from the dataset using online FASTA sequence toolbox FaBox v.1.5 (http://users-birc.au.dk/palle/php/fabox) [26], leaving a total of 85 unique haplotype sequences (including the four outgroup taxa). For phylogenetic analyses, we used the COI dataset with unique haplotypes. The best models of sequence evolution for each partition were as suggested on the basis of the corrected Akaike Information Criterion (AICc) of MEGA7 [27]. We used an external COI mutation rate of 2.65 × 10⁻⁹ substitutions/site/year, which was based on two vicariate Unio taxa separated by the Messinian salinity crisis as a paleogeographic event [28]. This estimation corresponded well with our own records. Hypothetical divergence times were estimated in BEAST v. 2.1.3 [29,30] on the basis of this evolutionary rate using a lognormal relaxed-clock algorithm with the Yule speciation process as the tree prior [31,32]. Calculations were performed at the San Diego Supercomputer Center through the CIPRES Science Gateway [33]. The HKY model was applied to each partition instead of the GTR model because prior and posterior ESS values under the GTR model were always recorded <100. This indicated that the GTR model was likely overly complex for our data.
Two replicate searches were conducted, each with 10 million generations. The trees were sampled every 1000th generation. The log files were checked visually with Tracer v. 1.6 for an assessment of the convergence of the MCMC chains and the effective sample size of parameters [34]. All ESS values were recorded as >200; posterior distributions were similar to prior distributions. The resulting tree files from two independent analyses were joined with LogCombiner v. 2.1.3. The first 10% of the trees were discarded as an appropriate burn-in. The maximum-clade-credibility tree was reconstructed using TreeAnnotator v. 2.1.2 [15].

2.3. Demographic History and Molecular Dating Analysis

Biogeographic scenarios were compiled on the basis of phylogenetic studies of the freshwater mussel genus Anodonta. Froufe et al. [13] identified the following haplogroups of Anodonta anatina on the basis of COI gene sequences: (1) Iberian Peninsula without the Ebro river basin; (2) continental Europe; and (3) Italian Peninsula with the Ebro river basin. Subsequently, this scheme was supplemented by data on the divergence of Anodonta sp. in the rivers of Southwestern Europe [2]. Our COI sequence data for A. anatina from the rivers of the Azov–Prikubanskaya Lowland (Kuban, Don, Kagalnik, Kirpili, Yeya, Chelbas, Beisug riverine basins) indicated the presence of a separate subclade within this species. Thus, biogeographic scenarios used for demographic history modeling included these four lineages.
Scenario Sc1 suggests simultaneous separation of southern populations due to a paleogeographic event at time t3 from the continental Eurasian population. According to this scenario, the four groups of Anodonta anatina were separated. According to Froufe et al. [2,13] and our COI gene sequences (based on uncorrected p-distances), we proposed two more scenarios suggesting divergence of populations in the southern regions of Europe from the rest of the European populations, i.e., Scenarios Sc2 and Sc3. The Sc2 scenario suggests initial separation of the Azov–Prikubanskaya Lowland population, and then that of the Italian Peninsula and the existence of A. anatina refugium in the Iberian Peninsula at time t3. In its turn, scenario Sc3 assumes initial separation of the Italian + Ebro subclade from the continental population, and the existence of ancient genetic group of A. anatina there. Further, according to this scenario, there was a separation of populations of the Azov-Prikubanskaya Lowland, and then those of the Iberian Peninsula and Northern Eurasia (Figure 2).
These demographic scenarios were simulated for comparison using an ABC approach with DIYABC v. 2.1.0 software [35]. The primary sequence dataset included four samples: (1) Iberian lineage (IBER; N = 56 sequences), (2) Eurasian (European–Siberian recent) lineage (EUR; N = 168 sequences), (3) Italian lineage (ITAL; N = 42 sequences), and (4) Azov lineage (AZOV; N = 58 sequences). Prior settings of the ABC analyses are presented in Table 1. The HKY was the best evolutionary model for our sequence dataset [36].
A total of 3 × 10⁶ simulated datasets were calculated. Pre-evaluations of model prior combinations in ABC inference revealed that the prior settings were correctly assigned (Figure S1). Posterior probabilities of the three biogeographical scenarios were calculated using direct and logistic approaches. On this basis, the scenario with the highest value of posterior probability was determined. Times of divergence between lineages in a supported scenario were calculated using estimation of posterior distributions of parameters with DIYABC v. 2.1.0 [35].
Population genetic diversity indices (haplotype and nucleotide diversity), Tajima’s D test, and Fu’s F-test statistics, and mismatch distribution analysis under a spatial expansion model were calculated using Arlequin v. 3.5.1.2 software to estimate the demographic histories of the sampled populations [37]. For this analysis, the same groups as for the ABC procedure were used.

3. Results

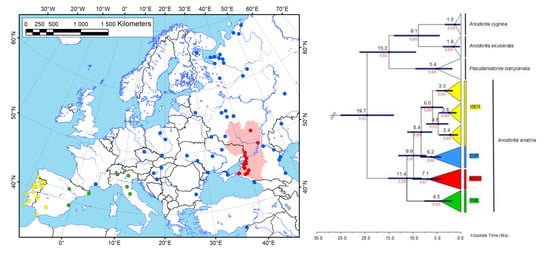
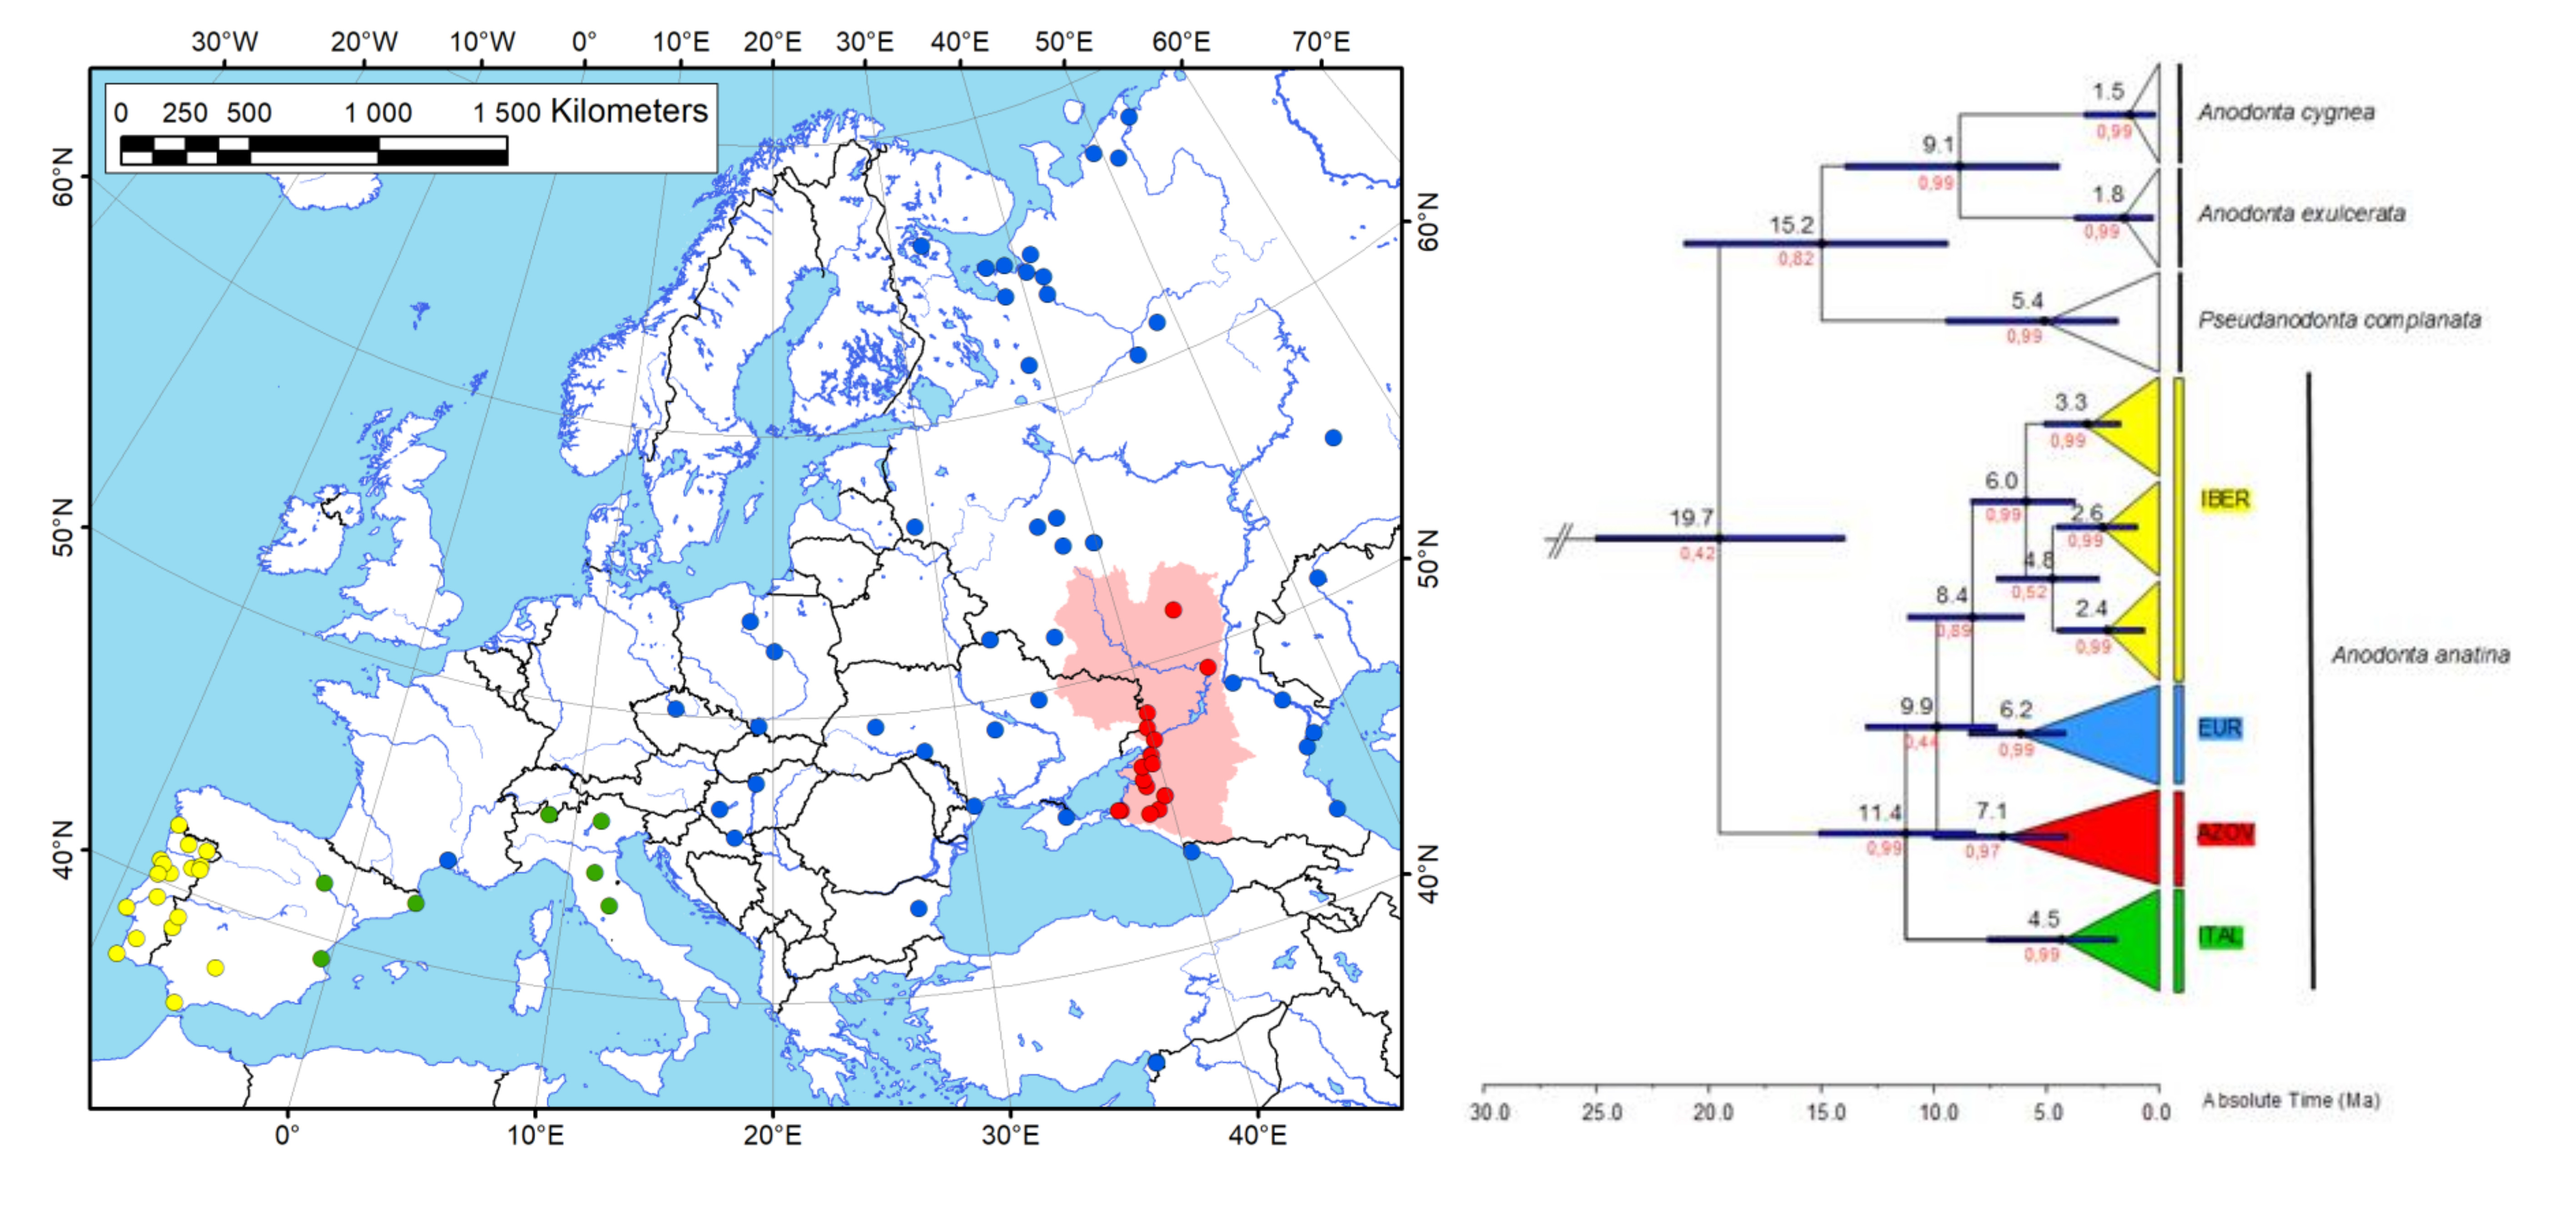
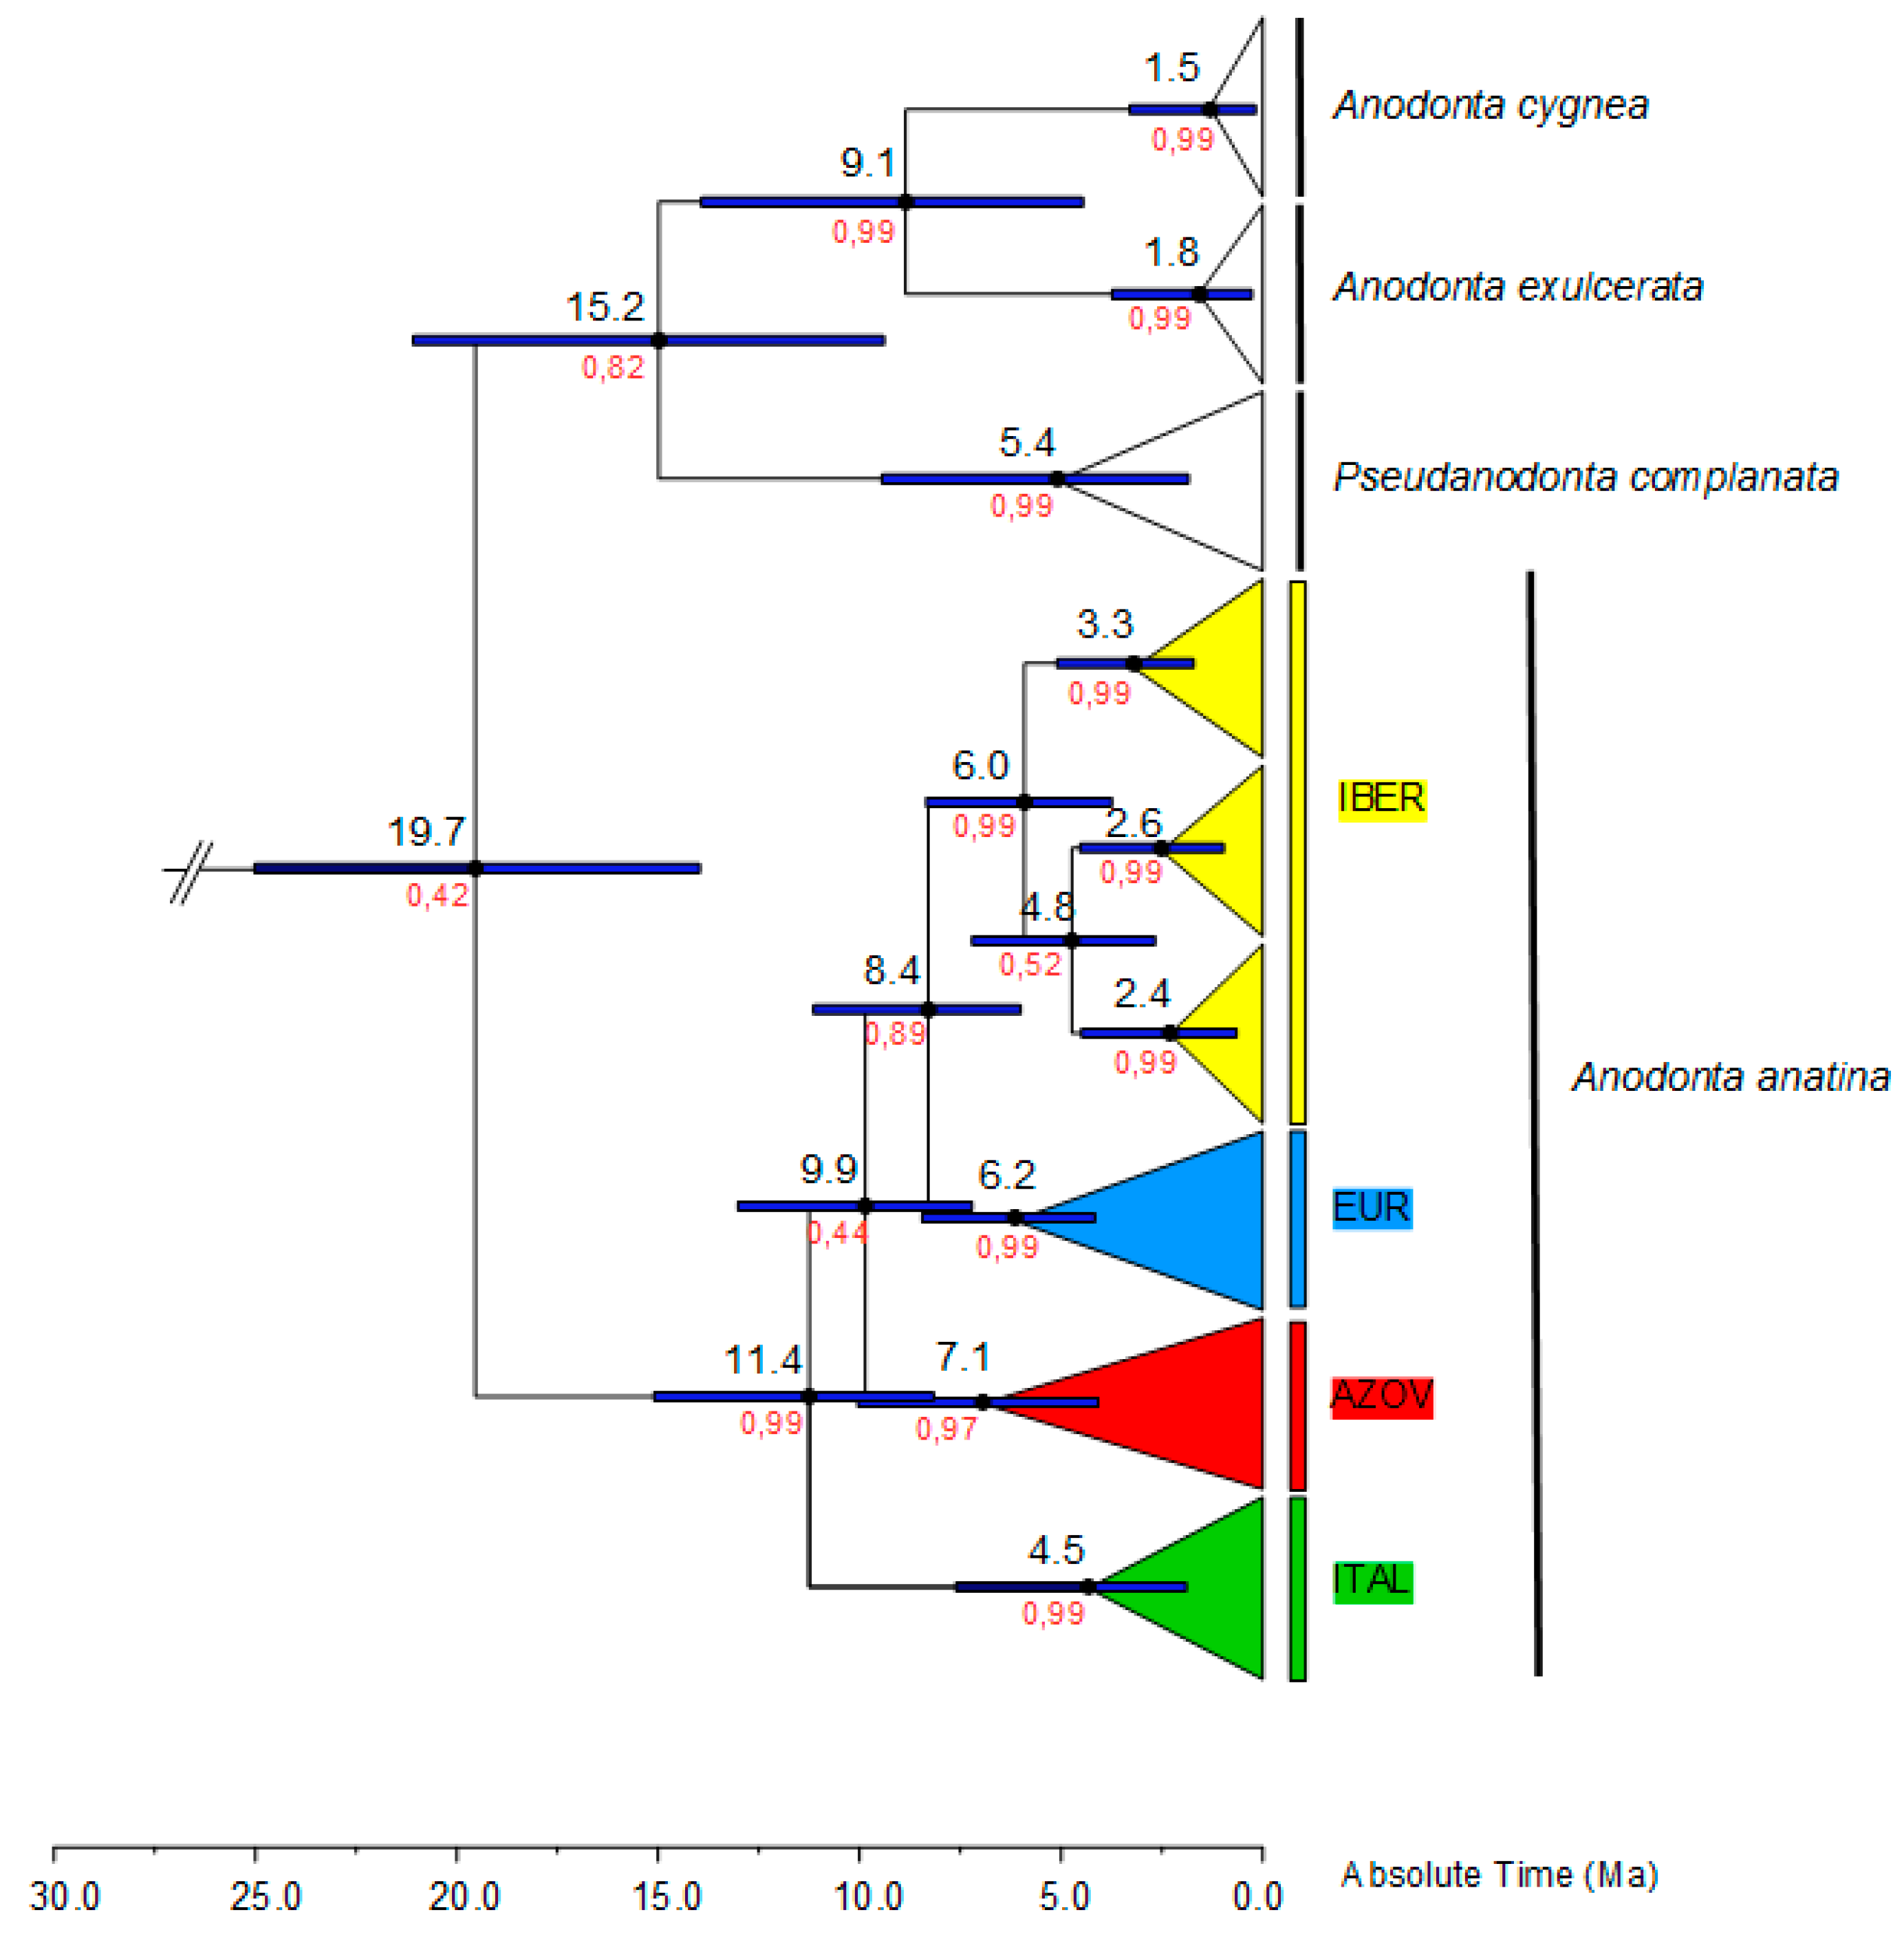
3.1. Phylogenetic Reconstruction and Phylogeography

The Bayesian phylogeny of Anodonta anatina based on 85 COI haplotypes revealed four intraspecific lineages (subclades) (Figure 3): (1) Iberian Peninsula (without the Ebro River basin); (2) continental Europe (without rivers of the Azov Sea basin), Northern, Western, and Central Asia; (3) Italian Peninsula and the Ebro River basin; and (4) rivers of the Azov Sea basin (Kuban, Don, Kagalnik, Kirpili, Yeya, Chelbas, and Beisug river basins).
The lineage ITAL included 42 sequences (eight haplotypes). The AZOV lineage in our phylogeny was presented by 58 sequences (20 haplotypes). The EUR lineage contained 168 sequences (34 haplotypes), while the IBER subclade included 56 sequences (23 haplotypes).
The mean genetic divergence between those subclades (uncorrected p-distances) varied from 2.35% to 3.41%. The mean genetic distances between ITAL and IBER, EUR, and AZOV were more than 3.0%, while the mean p-distances between EUR and AZOV, IBER and AZOV, IBER and EUR were 2.35–2.56% (Table 2).
The time-calibrated phylogeny showed that the ITAL lineage was likely separated from the other subclades 11.4 Ma ago, while the AZOV lineage diverged 9.9 Ma ago. The split between IBER and EUR subclades was placed 8.4 Ma ago.

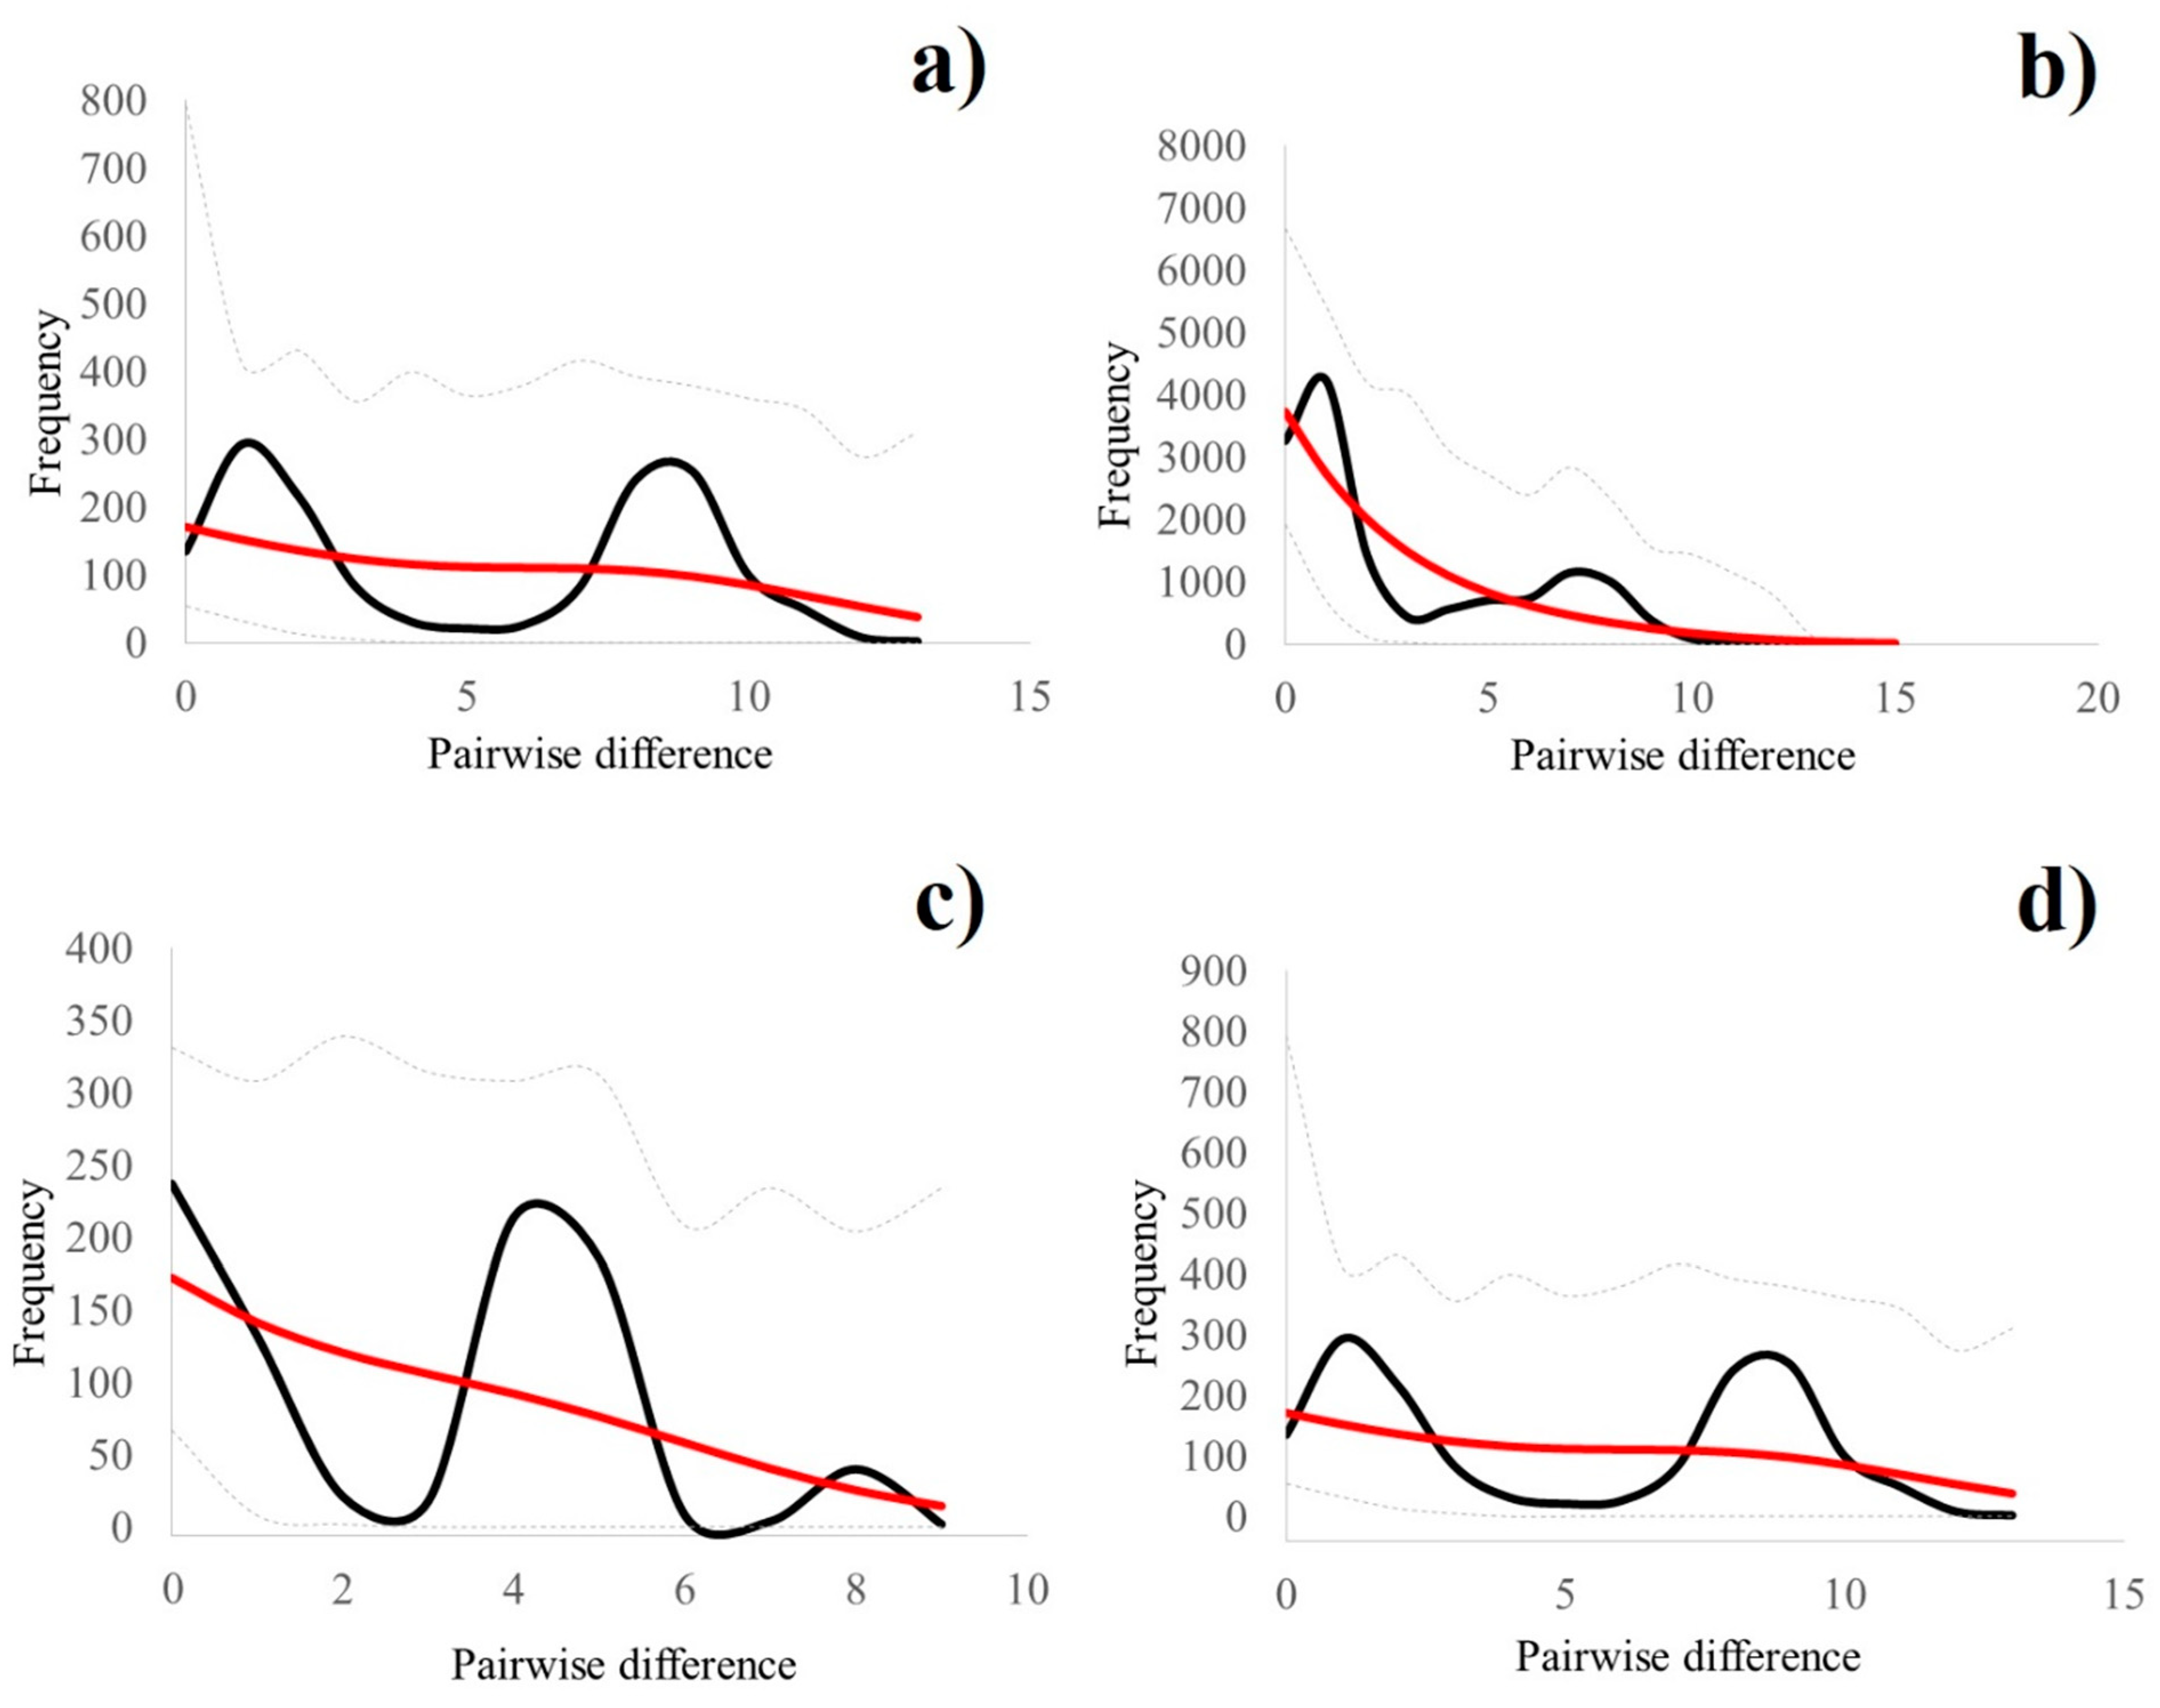
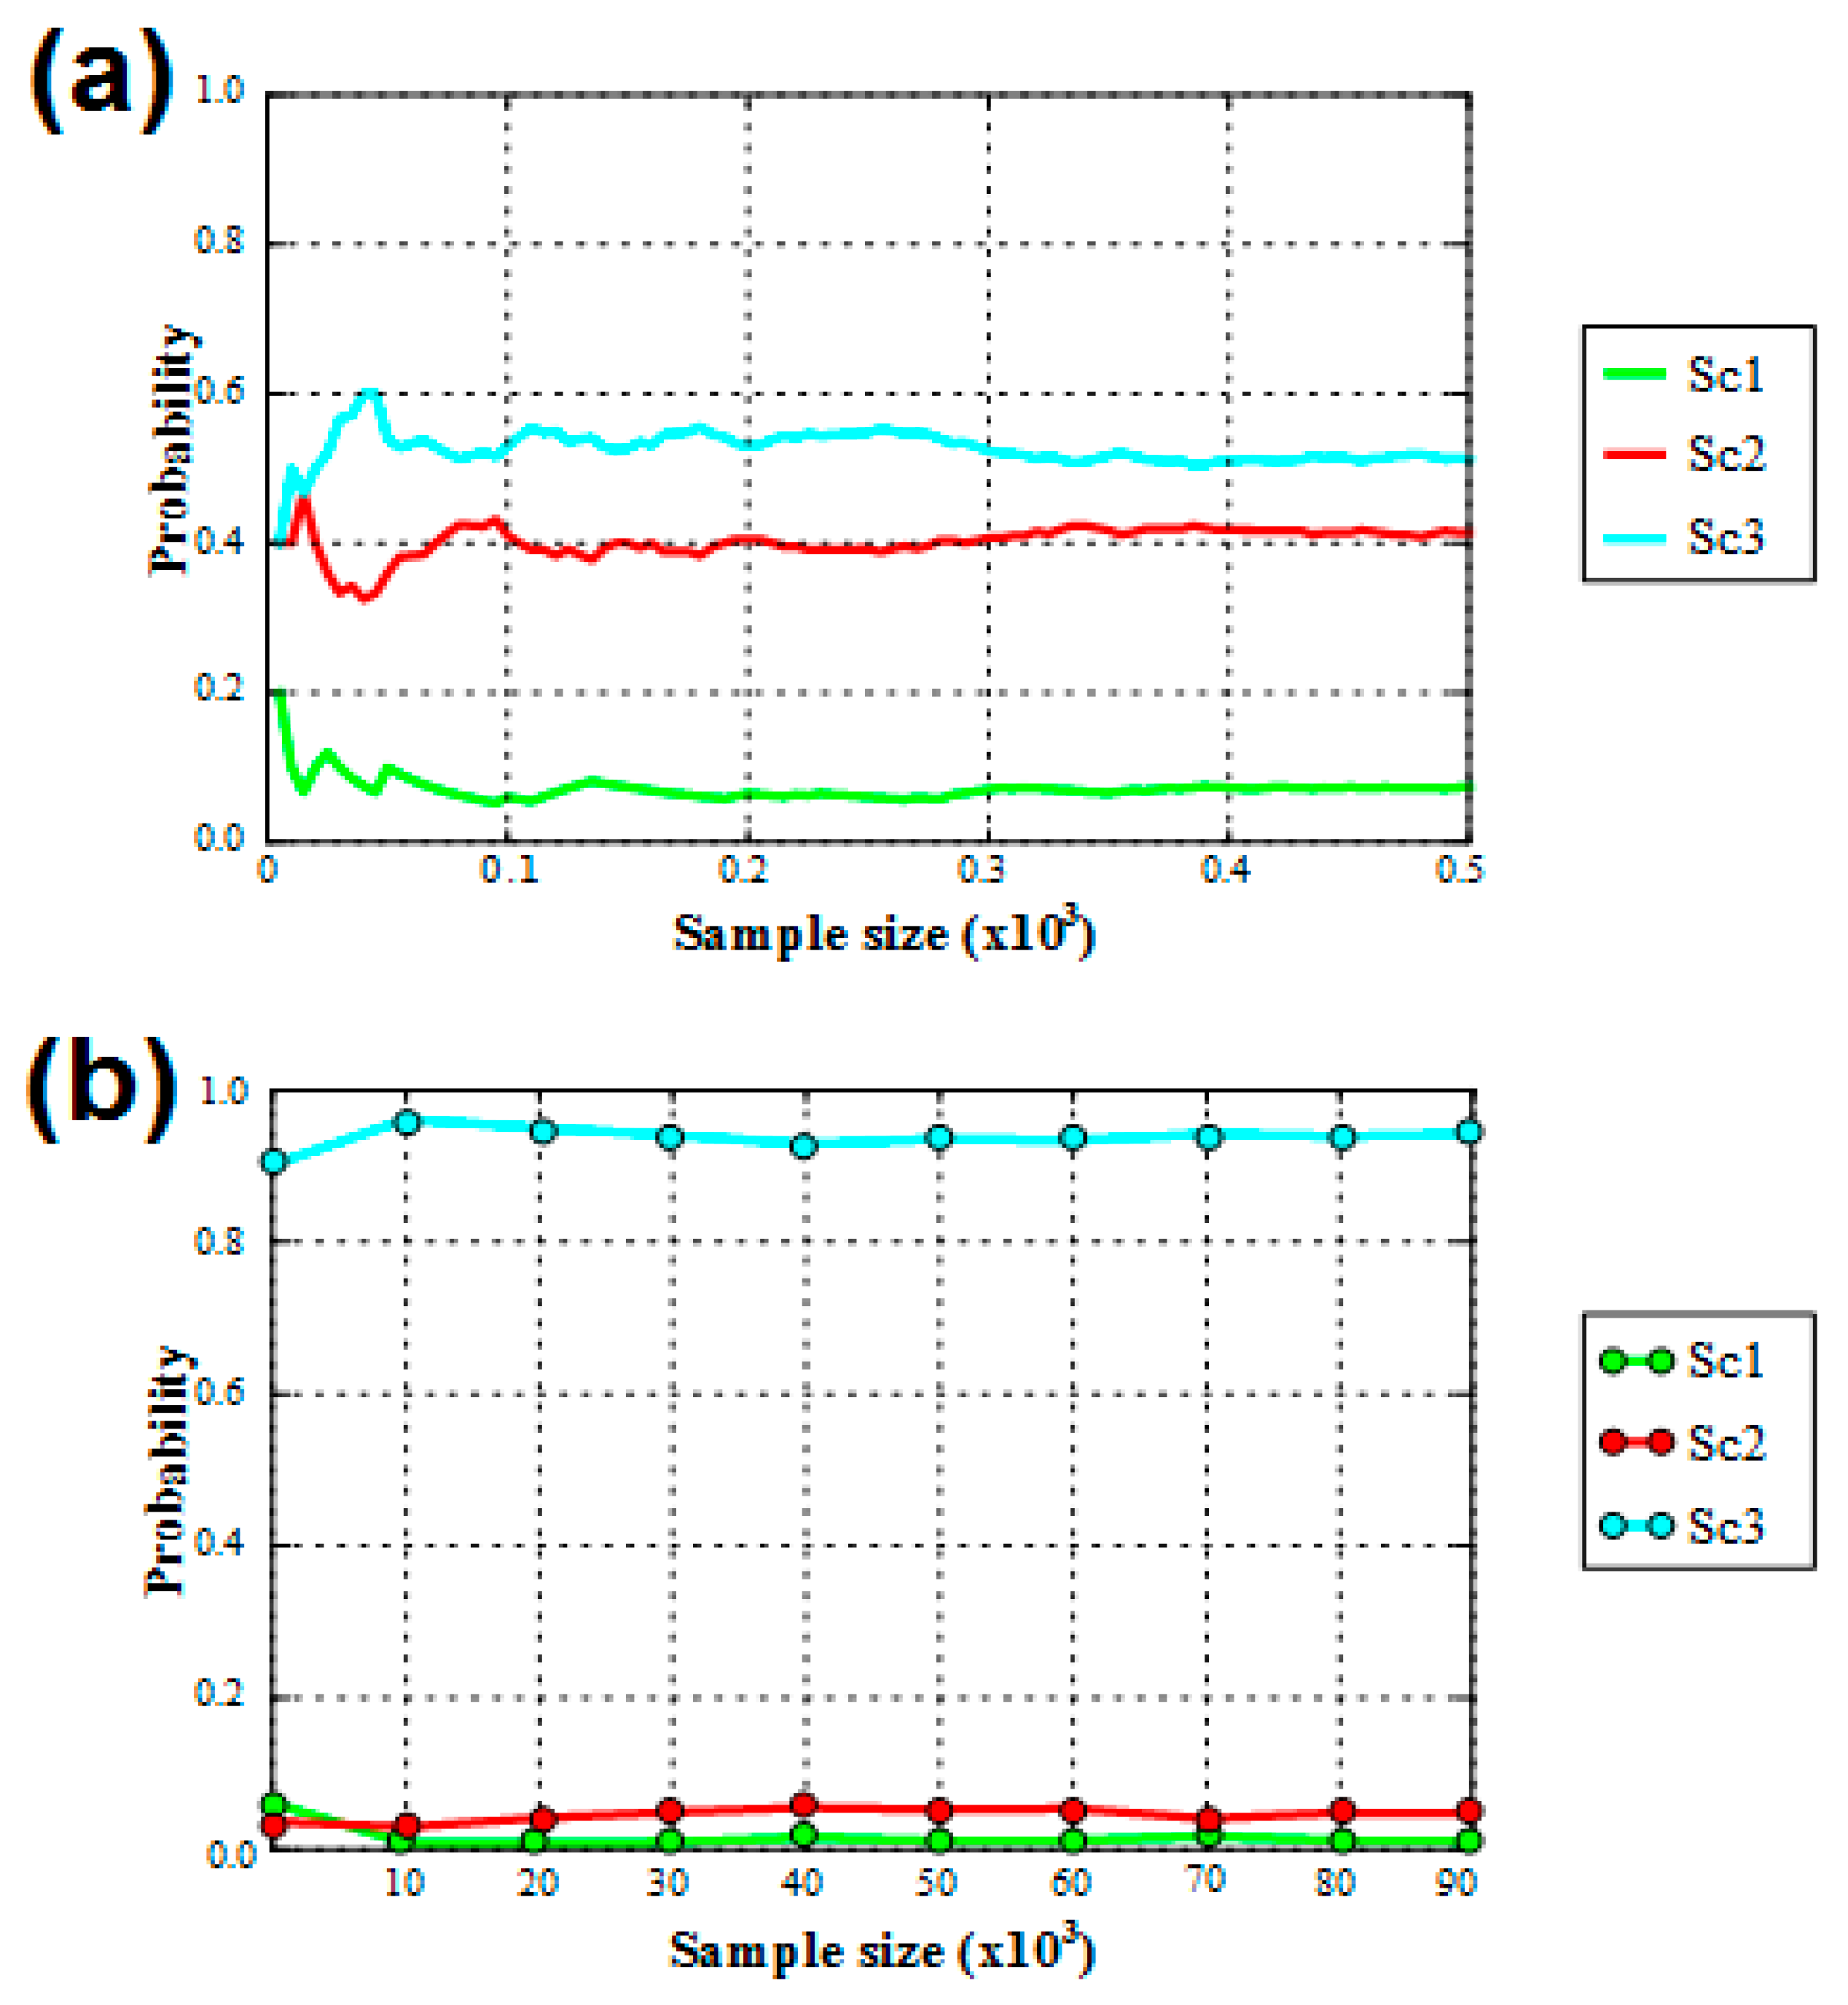
3.2. Historical Demography and Divergence Time Estimates

The IBER and AZOV lineages differed from the other subclades by a high haplotype diversity (mean Hd values from 0.873 to 0.912) and a high nucleotide diversity (π > 0.8%). The EUR and ITAL lineages had lower values of these population parameters (mean Hd ranges from 0.725 to 0.767, π < 0.5%). The Fu’s FS and Tajima’s D tests indicated no significant deviation from mutation-drift equilibrium for ITAL and AZOV lineages, whereas the IBER lineage had a statistically significant value for Fu’s FS test. Additionally, EUR lineage had significant negative values of both statistics, revealing possible historic demographic expansion. Mismatch distribution analysis of the ITAL lineage resulted in multimodal distribution with three peaks at 0, 5, and 8 bp. Samples from the three other lineages showed bimodal distribution with peaks at 1 and 9 bp (IBER and AZOV), and at 1 and 7 bp (EUR) (Figure 4). The EUR lineage revealed the lowest values of parameter τ, which reflects a time since population expansion, while all the other subclades returned much larger moment-estimator values (Table 3).
Results of the ABC simulation showed that Scenario Sc3 was identified as the most likely scenario with the highest posterior probability specified by logistic approach as 0.94 (Figure 5 and Table 4).
The posterior predictive error rate, which was calculated over 1000 datasets using the direct approach, was 0.170. Type I error for the choice of Scenario Sc3, in accordance with the direct approach, was 0.102. Type II errors for the choice of Scenario Sc3, according to the direct approach for 1000 datasets in favor of Scenarios Sc1 and Sc2, were calculated as 0.045 and 0.198, respectively.
Modeling results obtained under Scenario Sc3 revealed an order of isolation of Anodonta anatina southern refugia in Europe (Table 5). In particular, this scenario placed the split between ITAL and the continental population in the Messinian stage of the Miocene (mean age = 6.11 Ma; 95% CI: 3.52–9.01 Ma). The divergence of the AZOV lineage most likely was in the Late Pliocene (mean age = 3.61 Ma; 95% CI: 1.85–5.73 Ma), and the split between EUR and IBER lineages was placed in the Middle Pleistocene (mean age = 1.50 Ma; 95% CI: 0.769–2.49 Ma). Our model predicted a relatively slow substitution rate in A. anatina lineages as follows: mean rate = 2.66 × 10⁻⁹ s/s/y; 95% CI: 2.61 × 10⁻⁹ − 2.70 × 10⁻⁹ s/s/y).

4. Discussion

Using Bayesian phylogenetic analyses, we confirmed the existence of four Anodonta anatina lineages revealed in previous studies [13,18,38]. The EUR lineage is widespread throughout Europe and Western, Northern, and Central Asia. Earlier, Froufe et al. [13] described the distribution of this subclade in Eastern and Central Europe. Klishko et al. [18] revealed that samples from Lake Baikal and Ukraine also belong to this subclade. In our novel phylogeny, this lineage included samples from the vast territory of Eurasia, in which freshwater fauna diversification occurred relatively recently, mostly during the Pleistocene [39]. We revealed that the EUR lineage inhabits rivers of the White and Barents Sea basins (Northern Dvina, Pechora, Onega, Indiga, Keret, Kuloy), and the Taz, Yenisei, Lena, Urals, Ob, Upper and Lower Volga, and Dnieper river drainages. The IBER and ITAL lineages formed two separate clades in our and earlier phylogenies [2,13].
Based on a large COI dataset for Anodonta anatina from rivers of the Azov Sea basin, we identified another intraspecific lineage of this species, the level of genetic divergence of which is similar to that of the Iberian and Italian subclades [13]. Froufe et al. [13] proposed that these peninsulas were served as glacial refugia for A. anatina because of high genetic distance values between these subclades and EUR lineage. The mean genetic distances between the IBER, ITAL, and EUR lineages and the AZOV lineages varied from 2.35% to 3.08%, which indicated the long-term isolation of freshwater basins in the Azov–Prikubanskaya Lowland and A. anatina populations inhabiting those water bodies. Previously, it has been shown that several other aquatic taxa, e.g., the freshwater fish genus Barbus and the amphipod genus Pontogammarus, had survived in the Ponto-Caspian refugia during the Neogene–Quaternary epoch [9,10].
The low genetic diversity of the ITAL lineage (Hd = 0.725 ± 0.058, π = 0.477 ± 0.285) may be explained by the fact that a significant part of specimens in this sample originated from three river basins, i.e., Reno (N = 12), Po (N = 11), and Ebro (N = 7). In addition, such values of these parameters may indicate an ancient genetic lineage that is not currently dispersing. This assumption was also confirmed by phylogenetic data. The high values of Hd (0.912 ± 0.022) and π (0.858 ± 0.469) for the IBER lineage are probably associated with long-term evolutionary processes occurring in this subclade in isolated river basins located in different parts of the Iberian Peninsula. The Anodonta anatina lineage from rivers of the Azov Sea basin has high haplotype and nucleotide diversity (Hd = 0.873 ± 0.035, π = 0.824 ± 0.452), which can indicate an ecological plasticity of this group and its long-term isolation (existence in a stable refugium). Fu’s Fs and Tajima’s D values for the IBER, ITAL, and AZOV lineages were not statistically significant, indicating that there is currently no expansion of these subclades. A. anatina samples belonging to the EUR lineage have low genetic diversity (Hd = 0.767 ± 0.028, π = 0.477 ± 0.280). The results of Fu’s Fs (Fs = −21.078, p < 0.02) and Tajima’s D (D = −1.840, p < 0.05) neutrality test indicated that this subclade is expanding its range throughout Eurasia during the Pleistocene. This lineage was found in numerous river basins of the continent and occupied substantially larger area compared with IBER, ITAL, and AZOV lineages.
Modeling the demographic history of these four A. anatina lineages from freshwater basins of Europe, and Western, Northern, and Central Asia made it possible to estimate the age of their divergence. On the basis of the ABC modeling results, we can hypothesize that divergence of A. anatina lineages with respect to refugia in Southern Europe was determined by changes in the sea level and rearrangements of regional hydrological networks during climate change periods. Almost complete drying of the western part of the Mediterranean Basin at the end of the Miocene during the Messinian salinity crisis could be a possible cause of direct connections between freshwater basins of the Iberian and Italian peninsulas, and subsequent gene exchange between A. anatina lineages. At this time, according to the simulation results, the ITAL lineage was separated, including isolated populations of Anodonta anatina in the Italian Peninsula and Ebro River basin (mean age = 6.11 Ma; 95% CI: 3.52–9.01 Ma).
Available paleogeographic data on changes in the Ponto-Caspian basin boundaries during the Pliocene indicate a shift from marine to freshwater environment in the Azov–Prikubanskaya Lowland [5,6,7]. At the same time, spreading of freshwater and brackish water animals happened by changing environmental conditions. As a consequence, isolated populations of these animals evolved, in particular among amphipods, freshwater fishes [9,10], and freshwater mussels (this study). Our phylogeographic study revealed the presence of a separate, well-diverged subclade of Anodonta anatina in Southeastern Europe. This subclade contains samples from rivers of the Azov Sea drainage, i.e., the Kuban, Don, Kagalnik, Kirpili, Yeya, Chelbas, and Beisug river basins. We can assume that isolated freshwater basins inhabited by A. anatina have existed in this part of the Ponto-Caspian Region in the Pliocene. According to the ABC modeling, isolation of AZOV lineage occurred in the mid-Pliocene (mean age = 3.61 Ma, 95% CI: 1.85–5.73 Ma). We found high values of the diversity of haplotypes (Hd) and nucleotides (π) within the AZOV subclade (Table 3), and a high level of genetic distance between this group and other populations of A. anatina (Table 2).
The IBER lineage, determined on the basis of COI gene sequences [13], contains samples from rivers of the Atlantic Ocean basin in Iberia (South-Central, North-Western, and South-Western subregions). According to the demographic history modeling, split between the IBER and EUR lineages occurred 1.5 Ma ago in the Early Pleistocene (Calabrian).
During transition from the Early to Middle Pleistocene (~1 Ma), critical paleoclimatic changes occurred in the Ebro River basin when cycles of climate fluctuations were established (100 Ka ago) [40]. Subsequent fluvial evolution was characterized by a major entrenchment of fluvial valleys and staircase-terrace formation associated with stronger stadial/interstadial oscillations. This shift from the Early Pleistocene basins to Middle–Late Pleistocene river valleys is consistent with river evolution models described for other regions of Central and Northwestern Europe. Thus, sea-level fluctuations and geomorphological transformations of the Ebro River basin in the Early–Middle Pleistocene apparently contributed to the isolation of freshwater mussel populations (e.g., A. anatina) inhabiting river basins of the Iberian Peninsula.
Timing of the splits between Anodonta anatina lineages using the BEAST approach yielded results exceeding the time calculated under ABC simulation, and this difference increased with numerical values of age. At the same time, in both analyses, we used the time-scale calibration by an external calibration rate for the Unionidae [28]. This discrepancy between estimates of divergence ages using different approaches was noted by Feher et al. [41], who referred to the need to improve timeline calibration in calculations. This could be because BEAST does not consider the possibility of accelerated evolution and does not evaluate population parameters that are used to reconstruct population demographic history using ABC [36].

5. Conclusions

Here, we report the discovery of a separate mitochondrial DNA (COI) lineage of Anodonta anatina, which is restricted to rivers of the Azov Sea basin. This record highlights that the Azov Sea Region could have served as an ancient refugium for freshwater fauna. We showed that A. anatina lineages in Eurasia were largely diversified since the Late Miocene (Tortonian), with the Azov lineage separated from other subclades in the Late Pliocene ca. 3.6 Ma ago. Our novel phylogenetic and population demographic data improved modern knowledge on dispersal and refugial patterns of freshwater mussels in Eurasia. Finally, our data revealed that the Azov Sea Region can be considered a high priority area for future phylogeographic research and conservation efforts using freshwater animal groups as models.

Supplementary Materials

The following are available online at https://www.mdpi.com/1424-2818/12/3/118/s1, Figure S1: Test results of biogeographical scenarios Sc1, Sc2 and Sc3 concerning origin of the Anodonta anatina populations under an ABC framework using the COI gene sequences. Model checking to measure a mismatch between the parameters of posterior combination and observed data sets in Scenarios Sc1 (a), Sc2 (b) and Sc3 (c). A description of basic assumptions with prior settings for each scenario is presented in Table 1. Table S1: List of sequences used in this study, including the species, the location and NCBI’s GenBank accession numbers.

Author Contributions

A.A.T., A.A.L., A.V.K. and I.N.B. developed the concept of this study. A.A.T., A.A.L., A.V.K., I.N.B., I.V.V., M.Y.G., Y.S.K., M.V.V. and D.M.P. collected samples. A.V.K. and A.A.T. designed and carried out molecular analyses. A.A.T., A.A.L. and A.V.K. performed phylogenetic modeling and population genetic analysis. M.Y.G. created the maps. A.A.L. and A.A.T. wrote the paper, with input from A.V.K., I.N.B. and M.V.V. All authors approved the final version of the manuscript.

Funding

This research was funded by the Russian Science Foundation, grant number 18-77-00058 (including fieldworks in southern and central part of the Russian Plain, molecular analyses, phylogenetic modeling and population genetic analysis, mapping, preparing of the manuscript). The fieldworks of M.Y.G. in northern part of the Russian Plain and in Siberia were funded by project number AAAA-A18-118012390161-9 of Ministry of Science and Higher Education of the Russian Federation.

Acknowledgments

We are grateful to those who assisted us in sample collection for molecular analyses: Olga V. Aksenova, Andrey S. Aksenov, Valentina S. Artamonova, Yulia V. Bespalaya, Alexey V. Borovskoy, Gennady A. Dvoryankin, Stanislav A. Iglovsky, Mikhail B. Kabakov, Vidas V. Kriauciunas, Boris A. Levin, Alexander A. Makhrov, Vitaly M. Spitsyn, Svetlana E. Sokolova, Alisa A. Vlasova (Russia and Kazakhstan), Mikhail L. Levit (Bulgaria), and Tahir Ozcan (Turkey). We would also like to express our sincere gratitude to Ekaterina S. Konopleva for valuable advices that helped us to greatly improve the manuscript.

Conflicts of Interest

The authors declare no conflict of interest.

References

  1. Taberlet, P.; Fumagalli, L.; Wust-Saucy, A.-G.; Cosson, J.-F. Comparative phylogeography and postglacial colonization routes in Europe. Mol. Ecol. 1998, 7, 454–464. [Google Scholar] [CrossRef]
  2. Froufe, E.; Lopes-Lima, M.; Riccardi, N.; Zaccara, S.; Vanetti, I.; Lajtner, J.; Teixeira, A.; Varandas, S.; Prié, V.; Zieritz, A.; et al. Lifting the curtain on the freshwater mussel diversity from the Italian Peninsula and Croatian Adriatic coast. Biodivers. Conserv. 2017, 26, 3255–3274. [Google Scholar] [CrossRef] [Green Version]
  3. Albrecht, C.; Wolff, C.; Glöer, P.; Wilke, T. Concurrent evolution of ancient sister lakes and sister species: The freshwater gastropod genus Radix in lakes Ohrid and Prespa. Hydrobiologia 2008, 615, 157–167. [Google Scholar] [CrossRef]
  4. Grabowski, M.; Mamos, T.; Bącela-Spychalska, K.; Rewicz, T.; Wattier, R.A. Neogene paleogeography provides context for understanding the origin and spatial distribution of cryptic diversity in a widespread Balkan freshwater amphipod. PeerJ 2017, 5, e3016. [Google Scholar] [CrossRef] [PubMed] [Green Version]
  5. Krijgsman, W.; Tesakov, A.; Yanina, T.; Lazarev, S.; Danukalova, G.; Van Baak, C.G.C.; Agustí, J.; Alçiçek, M.C.; Aliyeva, E.; Bista, D.; et al. Quaternary time scales for the Pontocaspian domain: Interbasinal connectivity and faunal evolution. Earth Sci. Rev. 2019, 188, 1–40. [Google Scholar] [CrossRef]
  6. Van Baak, C.G.C.; Mandic, O.; Lazar, I.; Stoica, M.; Krijgsman, W. The Slanicul de Buzau section, a unit stratotype for the Romanian stage of the Dacian Basin (Plio-Pleistocene, Eastern Paratethys). Palaeogeogr. Palaeoclimatol. Palaeoecol. 2015, 440, 594–613. [Google Scholar] [CrossRef]
  7. Jorissen, E.L.; de Leeuw, A.; van Baak, C.G.C.; Mandic, O.; Stoica, M.; Abels, H.A.; Krijgsman, W. Sedimentary architecture and depositional controls of a Pliocene river-dominated delta in the semi-isolated Dacian Basin, Black Sea. Sediment. Geol. 2018, 368, 1–23. [Google Scholar] [CrossRef] [Green Version]
  8. Borzenkova, I.I. Izmenenie Klimata v Kainozoe (Climatic Changes in the Cenozoic); Gidrometeoizdat: St.-Petersburg, Russia, 1992. [Google Scholar]
  9. Levin, B.A.; Gandlin, A.A.; Simonov, E.S.; Levina, M.A.; Barmintseva, A.E.; Japoshvili, B.; Mugue, N.S.; Mumladze, L.; Mustafayev, N.J.; Pashkov, A.N.; et al. Phylogeny, phylogeography and hybridization of Caucasian barbels of the genus Barbus (Actinopterygii, Cyprinidae). Mol. Phylogenet. Evol. 2019, 135, 31–44. [Google Scholar] [CrossRef]
  10. Nahavandi, N.; Ketmaier, V.; Plath, M.; Tiedemann, R. Diversification of Ponto-Caspian aquatic fauna: Morphology and molecules retrieve congruent evolutionary relationships in Pontogammarus maeoticus (Amphipoda: Pontogammaridae). Mol. Phylogenet. Evol. 2013, 69, 1063–1076. [Google Scholar] [CrossRef]
  11. Bolotov, I.N.; Kondakov, A.V.; Konopleva, E.S.; Vikhrev, I.V.; Aksenova, O.V.; Aksenov, A.S.; Bespalaya, Y.V.; Borovskoy, A.V.; Danilov, P.P.; Dvoryankin, G.A.; et al. Integrative taxonomy, biogeography and conservation of freshwater mussels (Unionidae) in Russia. Sci. Rep. 2020, 10, 3072. [Google Scholar] [CrossRef] [Green Version]
  12. Soroka, M. Identification of gender-associated mitochondrial haplotypes in Anodonta anatina (Bivalvia: Unionidae). Folia Malacol. 2008, 16, 21–26. [Google Scholar] [CrossRef] [Green Version]
  13. Froufe, E.; Sobral, C.; Teixeira, A.; Sousa, R.; Varandas, S.; Aldridge, D.; Lopes-Lima, M. Genetic diversity of the pan-European freshwater mussel Anodonta anatina (Bivalvia: Unionoida) based on CO1: New phylogenetic insights and implications for conservation. Aquat. Conserv. Mar. Freshw. Ecosyst. 2014, 24, 561–574. [Google Scholar] [CrossRef] [Green Version]
  14. Folmer, O.; Black, M.; Hoeh, W.; Lutz, R.; Vrijenhoek, R. DNA primers for amplification of mitochondrial cytochrome c oxidase subunit I from diverse metazoan invertebrates. Mol. Mar. Biol. Biotech. 1994, 3, 294–299. [Google Scholar]
  15. Bolotov, I.N.; Kondakov, A.V.; Vikhrev, I.V.; Aksenova, O.V.; Bespalaya, Y.V.; Gofarov, M.Y.; Kolosova, Y.S.; Konopleva, E.S.; Spitsyn, V.M.; Tanmuangpak, K.; et al. Ancient river inference explains exceptional Oriental freshwater mussel radiations. Sci. Rep. 2017, 7, 1–14. [Google Scholar] [CrossRef] [PubMed] [Green Version]
  16. Hall, T.A. BioEdit: A user-friendly biological sequence alignment editor and analysis program for Windows 95/98/NT. Nucleic Acids Symp. Ser. 1999, 41, 95–98. [Google Scholar]
  17. Tomilova, A.A.; Kondakov, A.V.; Kisil, O.Y. Usage of transcribed spacers ITS1 and ITS2 for identification of freshwater mussels of the genera Anodonta and Pseudanodonta (Bivalvia: Unionidae: Anodontinae). Zhurnal Obshchei Biologii 2019, 80, 364–371. [Google Scholar]
  18. Klishko, O.K.; Lopes-Lima, M.; Bogan, A.E.; Matafonov, D.V.; Froufe, E. Morphological and molecular analyses of Anodontinae species (Bivalvia, Unionidae) of Lake Baikal and Transbaikalia. PLoS ONE 2018, 13, e0194944. [Google Scholar] [CrossRef]
  19. Hinzmann, M.; Lopes-Lima, M.; Teixeira, A.; Varandas, S.; Sousa, R.; Lopes, A.; Froufe, E.; Machado, J. Reproductive cycle and strategy of Anodonta anatina (L., 1758): Notes on hermaphroditism. J. Exp. Zool. Part A Ecol. Genet. Physiol. 2013, 319, 378–390. [Google Scholar] [CrossRef]
  20. Reis, J.; Machordom, A.; Araujo, R. Morphological and molecular diversity of Unionidae (Mollusca, Bivalvia) from Portugal. Graellsia 2013, 69, 17–36. [Google Scholar]
  21. Mezhzherin, S.V.; Yanovich, L.M.; Zhalay, E.I.; Vasilieva, L.A.; Pampura, M.M. Genetic and morphological variability and differentiation of freshwater mussels (Bivavia, Unionidae, Anodontinae) in Ukraine. Vestnik Zoologii 2014, 48, 99–110. [Google Scholar] [CrossRef] [Green Version]
  22. Araujo, R.; Buckley, D.; Nagel, K.O.; García-Jiménez, R.; Machordom, A. Species boundaries, geographic distribution and evolutionary history of the Western Palaearctic freshwater mussels Unio (Bivalvia: Unionidae). Zool. J. Linn. Soc. 2018, 182, 275–299. [Google Scholar] [CrossRef]
  23. Araujo, R.; Buckley, D.; Nagel, K.O.; Machordom, A. Potomida littoralis (Bivalvia, Unionidae) evolutionary history: Slow evolution or recent speciation? Zool. J. Linn. Soc. 2017, 179, 277–290. [Google Scholar] [CrossRef] [Green Version]
  24. Bespalaya, Y.V.; Bolotov, I.N.; Aksenova, O.V.; Gofarov, M.Y.; Kondakov, A.V.; Vikhrev, I.V.; Vinarski, M.V. DNA barcoding reveals invasion of two cryptic Sinanodonta mussel species (Bivalvia: Unionidae) into the largest Siberian River. Limnologica 2018, 69, 94–102. [Google Scholar] [CrossRef]
  25. Thompson, J.D.; Higgins, D.G.; Gibson, T.J. CLUSTAL W: Improving the sensitivity of progressive multiple sequence alignment through sequence weighting, position-specific gap penalties and weight matrix choice. Nucleic Acids Res. 1994, 22, 4673–4680. [Google Scholar] [CrossRef] [PubMed] [Green Version]
  26. Villesen, P. FaBox: An online toolbox for FASTA sequences. Mol. Ecol. Notes 2007, 7, 965–968. [Google Scholar] [CrossRef]
  27. Kumar, S.; Stecher, G.; Tamura, K. MEGA7: Molecular evolutionary genetics analysis version 7.0 for bigger datasets. Mol. Biol. Evol. 2016, 33, 1870–1874. [Google Scholar] [CrossRef] [Green Version]
  28. Froufe, E.; Goncalves, D.V.; Teixeira, A.; Sousa, R.; Varandas, S.; Ghamizi, M.; Zieritz, A.; Lopes-Lima, M. Who lives where? Molecular and morphometric analyses clarify which Unio species (Unionida, Mollusca) inhabit the southwestern Palearctic region. Org. Divers. Evol. 2016, 16, 597–611. [Google Scholar] [CrossRef] [Green Version]
  29. Drummond, A.J.; Rambaut, A. BEAST: Bayesian evolutionary analysis by sampling trees. BMC Evol. Biol. 2007, 7, 214. [Google Scholar] [CrossRef] [Green Version]
  30. Bouckaert, R.; Heled, J.; Kühnert, D.; Vaughan, T.; Wu, C.-H.; Xie, D.; Suchard, M.A.; Rambaut, A.; Drummond, A.J. BEAST 2: A software platform for Bayesian evolutionary analysis. PLoS Comput. Biol. 2014, 10, e1003537. [Google Scholar] [CrossRef] [Green Version]
  31. Drummond, A.J.; Ho, S.Y.; Phillips, M.J.; Rambaut, A. Relaxed phylogenetics and dating with confidence. PLoS Biol. 2006, 4, 699. [Google Scholar] [CrossRef]
  32. Drummond, A.J.; Suchard, M.A.; Xie, D.; Rambaut, A. Bayesian phylogenetics with BEAUti and the BEAST 1.7. Mol. Biol. Evol. 2012, 29, 1969–1973. [Google Scholar] [CrossRef] [PubMed] [Green Version]
  33. Miller, M.; Pfeiffer, W.; Schwartz, T. Creating the CIPRES science gateway for inference of large phylogenetic trees. In Gateway Computing Environments Workshop (GCE); IEEE: Piscataway, NJ, USA, 2010; pp. 1–8. [Google Scholar]
  34. Rambaut, A.; Suchard, M.; Drummond, A.J. Tracer v1.6. Institute of Evolutionary Biology, University of Edinburgh: Edinburgh, UK, 2013. Available online: http://beast.bio.ed.ac.uk/software/tracer/ (accessed on 16 December 2019).
  35. Cornuet, J.M.; Pudlo, P.; Veyssier, J.; Dehne-Garcia, A.; Gautier, M.; Leblois, R.; Marin, J.-M.; Estoup, A. DIYABC v2.0: A software to make approximate Bayesian computation inferences about population history using single nucleotide polymorphism, DNA sequence and microsatellite data. Bioinformatics 2014, 30, 1187–1189. [Google Scholar] [CrossRef] [PubMed] [Green Version]
  36. Bolotov, I.N.; Aksenova, O.V.; Bespalaya, Y.V.; Gofarov, M.Y.; Kondakov, A.V.; Paltser, I.S.; Stefansson, A.; Travina, O.V.; Vinarski, M.V. Origin of a divergent mtDNA lineage of a freshwater snail species, Radix balthica, in Iceland: Cryptic glacial refugia or a postglacial founder event? Hydrobiologia 2017, 787, 73–98. [Google Scholar] [CrossRef]
  37. Excoffier, L.; Lischer, H.E.L. Arlequin suite ver. 3.5: A new series of programs to perform population genetics analyses under Linux and Windows. Mol. Ecol. Resour. 2010, 10, 564–567. [Google Scholar] [CrossRef]
  38. Gomes-dos-Santos, A.; Froufe, E.; Gonçalves, D.V.; Sousa, R.; Prié, V.; Ghamizi, M.; Benaissa, H.; Varandas, S.; Teixeira, A.; Lopes-Lima, M. Freshwater conservation assessments in (semi-)arid regions: Testing river intermittence and buffer strategies using freshwater mussels (Bivalvia, Unionida) in Morocco. Biol. Conserv. 2019, 236, 420–434. [Google Scholar] [CrossRef] [Green Version]
  39. Yokoyama, R.; Sideleva, V.G.; Shedko, S.V.; Goto, A. Broad-scale phylogeography of the Palearctic freshwater fish Cottus poecilopus complex (Pisces: Cottidae). Mol. Phylogenet. Evol. 2008, 48, 1244–1251. [Google Scholar] [CrossRef]
  40. Sancho, C.; Calle, M.; Peña-Monné, J.L.; Duval, M.; Oliva-Urcia, B.; Pueyo, E.L.; Benito, G.; Moreno, A. Dating the Earliest Pleistocene alluvial terrace of the Alcanadre River (Ebro Basin, NE Spain): Insights into the landscape evolution and involved processes. Quat. Int. 2016, 407, 86–95. [Google Scholar] [CrossRef] [Green Version]
  41. Feher, Z.; Major, Á.; Krízsik, V. Spatial pattern of intraspecific mitochondrial diversity in the Northern Carpathian endemic spring snail, Bythinella pannonica (Frauenfeld, 1865) (Gastropoda: Hydrobiidae). Org. Divers. Evol. 2013, 13, 569–581. [Google Scholar] [CrossRef]
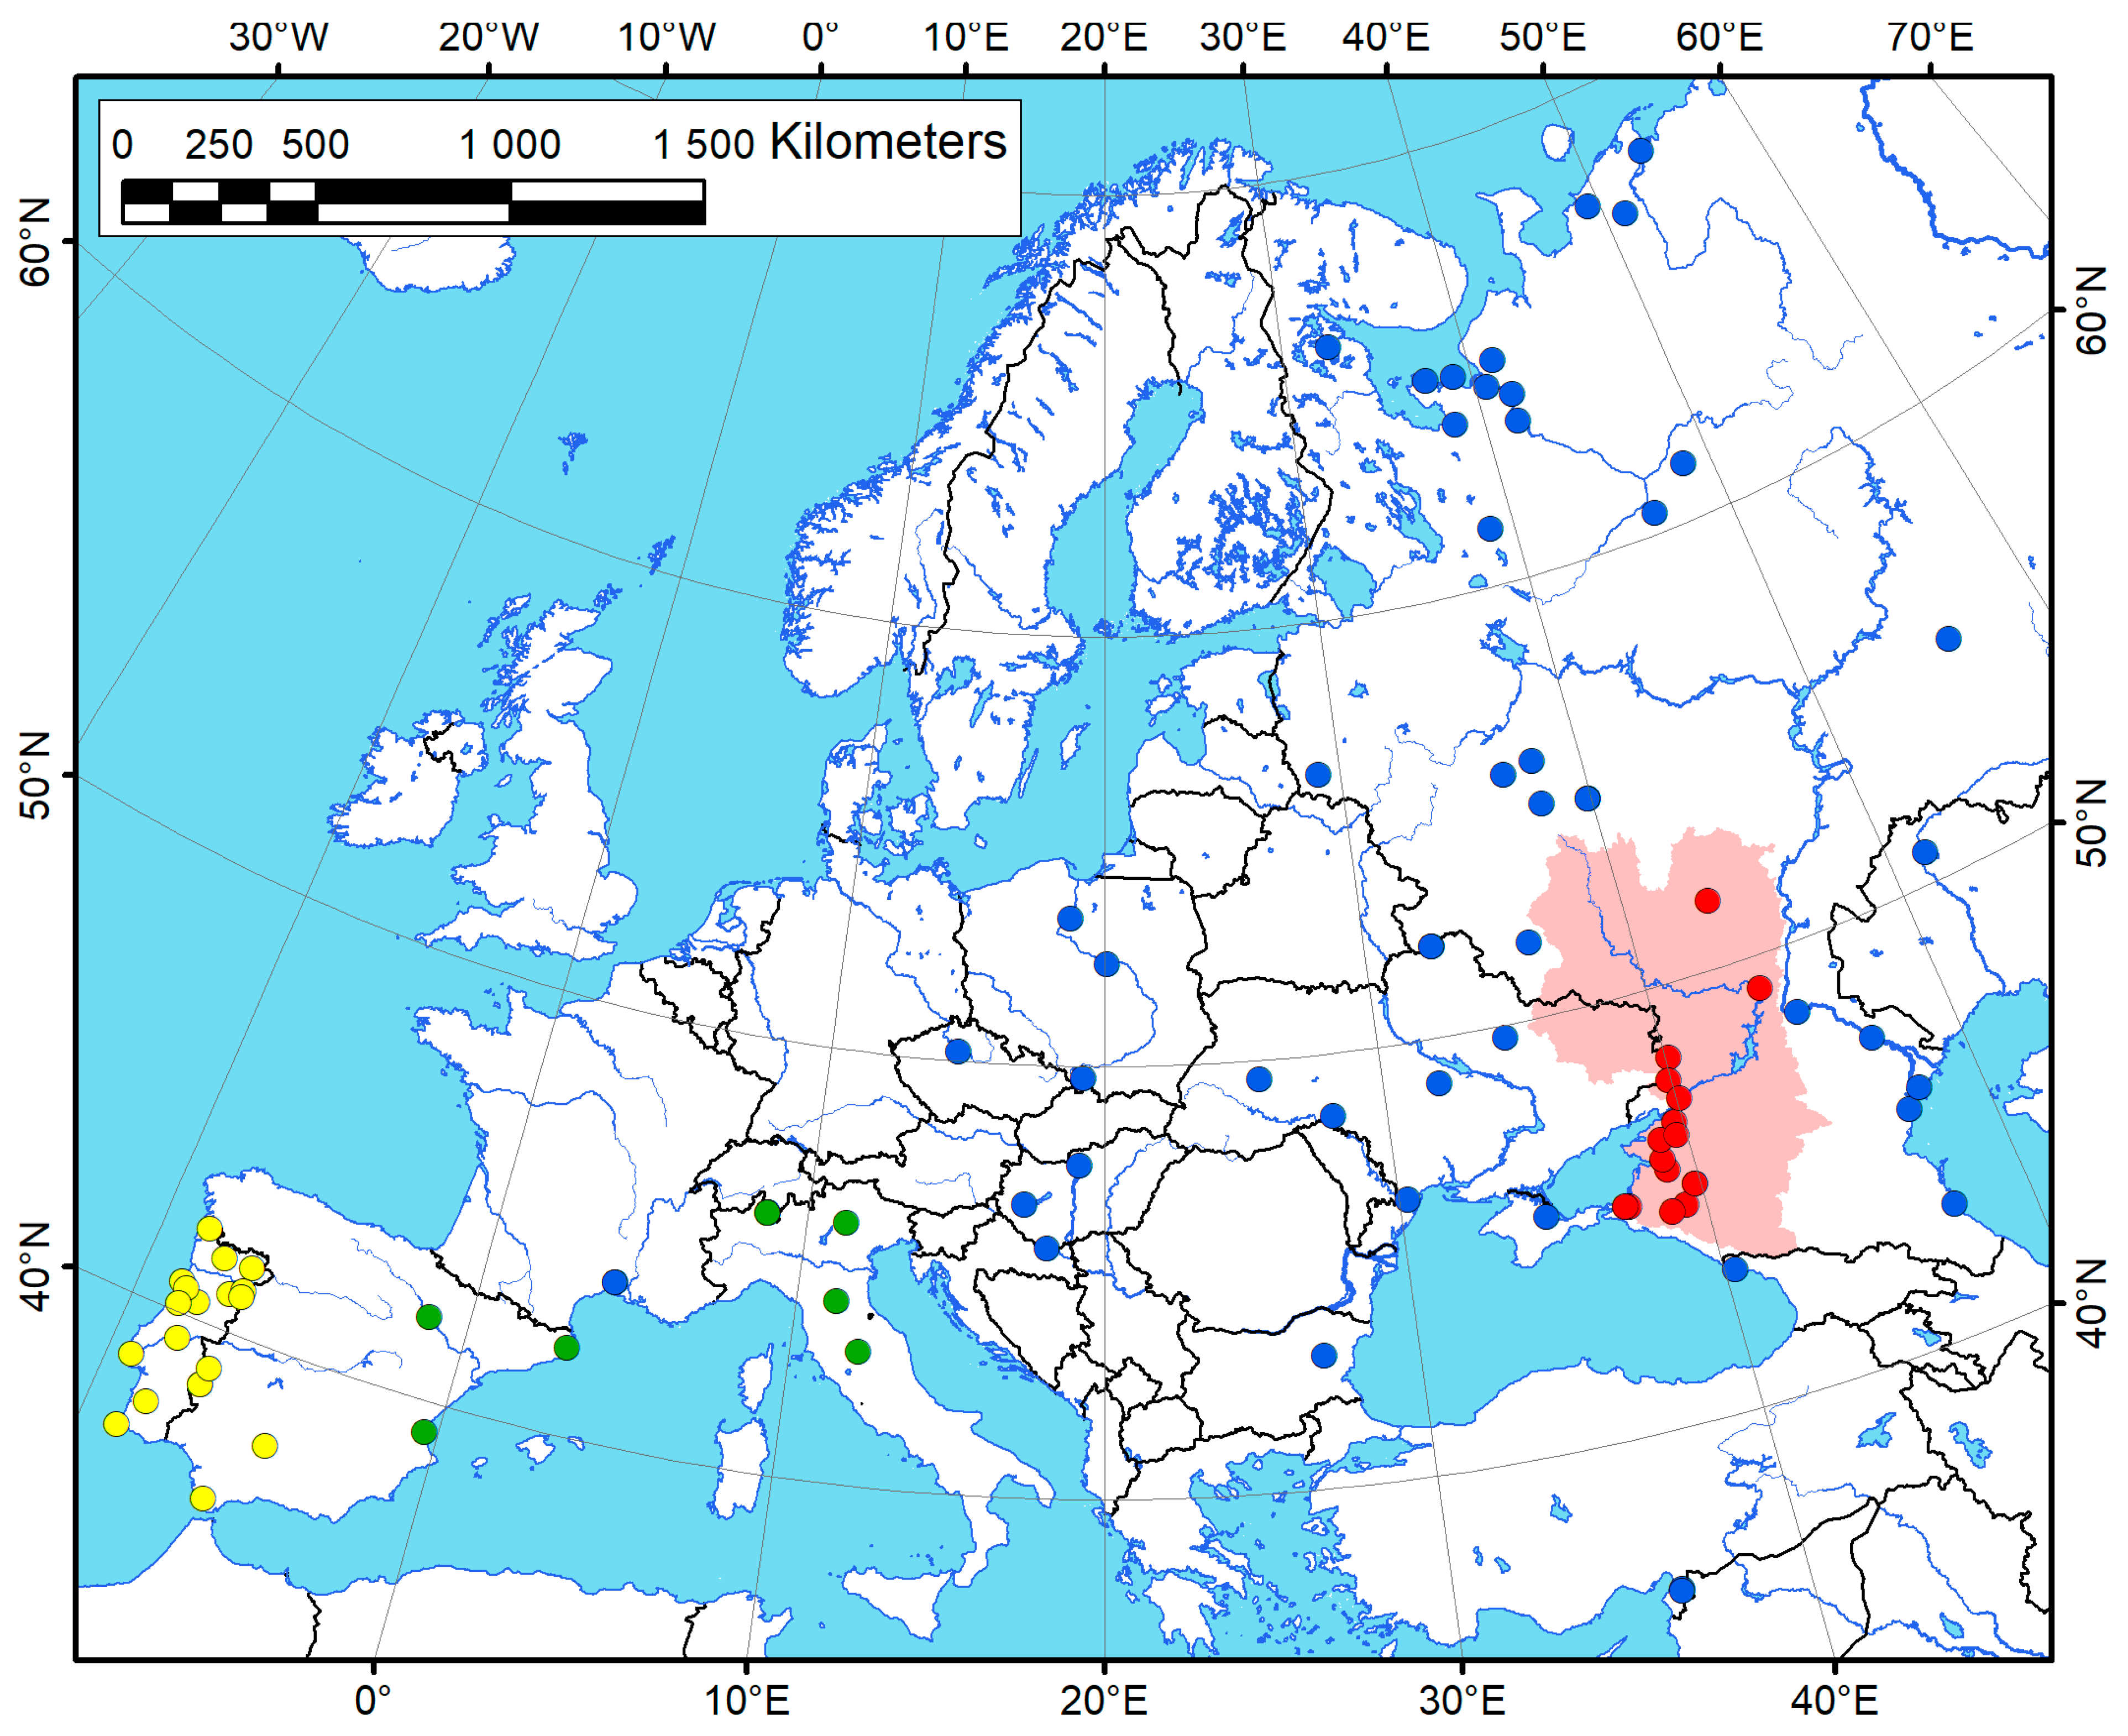
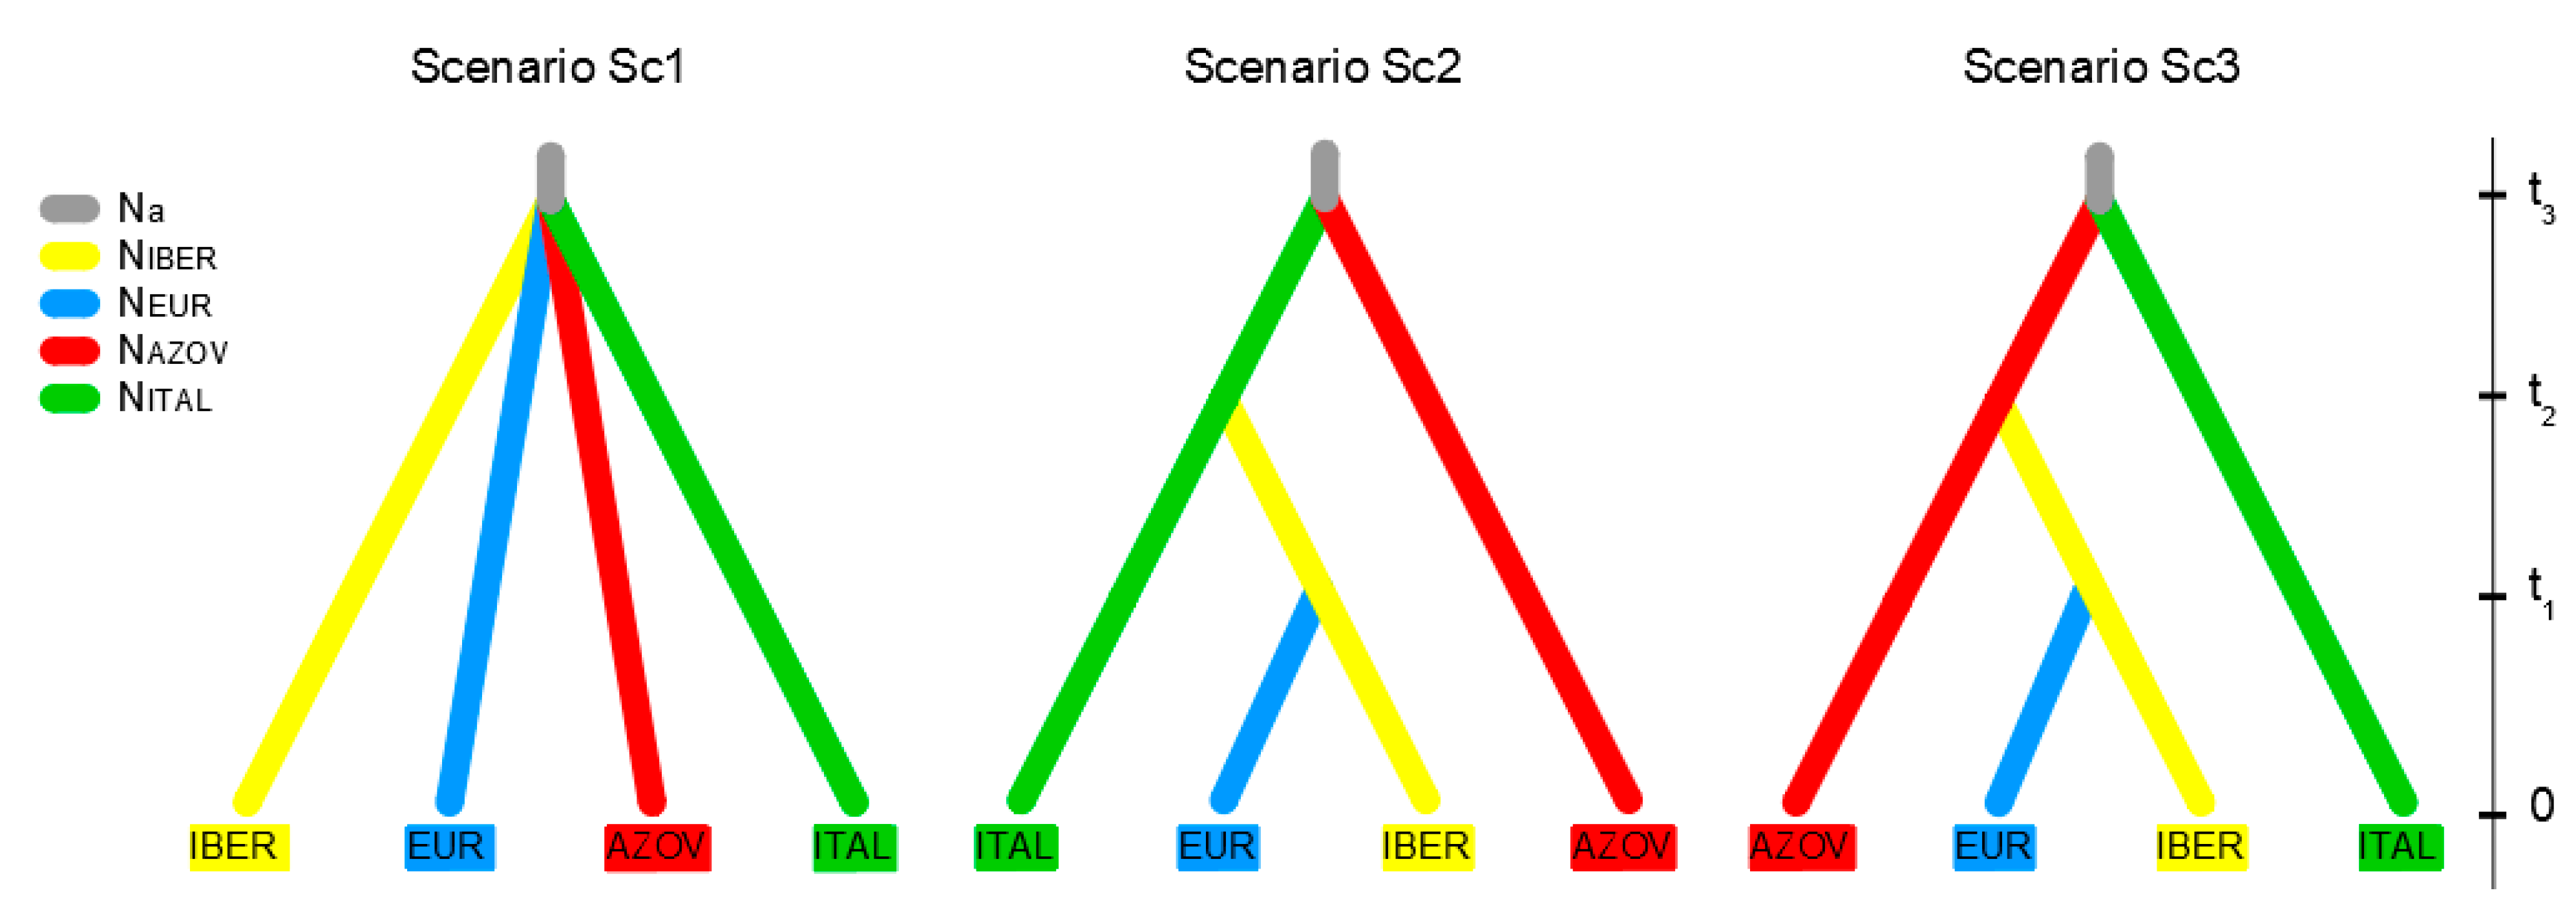
Figure 1. Map showing the location of Anodonta anatina samples from Europe (our data; samples from NCBI GenBank). Point colors represent following lineages: IBER—Iberia lineage, yellow; EUR—Eurasian (recent) lineage, blue; AZOV—Azov lineage, red; ITAL—Italian lineage + Ebro, green (Table S1). Pink color indicates basins of following rivers: Kuban, Don, Kagalnik, Kirpili, Yeya, Chelbas, Beisug. The map was created using ESRI ArcGIS 10 software (https://www.esri.com/arcgis); the topographic base of the map was created with Natural Earth Free Vector and Raster Map Data (https://www.naturalearthdata.com) and HydroSHEDS (https://www.hydrosheds.org) (Map: Mikhail Yu. Gofarov).
Diversity 12 00118 g001
Figure 2. Demographic scenarios of Anodonta anatina lineages tested under ABC framework using COI gene sequences. All three scenarios assume that there were four populations as follows: IBER, Iberian lineage; EUR, Eurasian (recent) lineage; AZOV, Azov lineage; ITAL, Italian + Ebro lineage. In three scenarios, t# represents the time of occurrence of an event (expressed in years), and N# is the effective population size of the corresponding populations during each time period. Time scale shown on the right. Prior settings presented in Table 1.
Diversity 12 00118 g002
Figure 3. Calibrated phylogenetic tree based on a lognormal relaxed clock model and the Yule process speciation implemented in BEAST 2.1.3 using COI gene sequences of Anodonta and Pseudanodonta. Black numbers near nodes are the mean age values, and bars are 95% confidence intervals of the estimated divergence time between lineages (Ma). Red numbers near nodes are BPP values inferred from BEAST. Sinanodonta woodiana, S. lauta, Unio tumidus, and U. pictorum were used as outgroup (not shown on the tree). The list of sequences is presented in Table S1.
Diversity 12 00118 g003
Figure 4. Mismatch distributions of Anodonta anatina lineages based on the mitochondrial COI gene. (a) IBER lineage (N = 56 sequences; Raggedness P = 0.29; Model (SSD) P = 0.11); (b) EUR lineage (N = 168 sequences; Raggedness P = 0.71; Model (SSD) P = 0.72); (c) ITAL lineage (N = 42 sequences; Raggedness P = 0.18; Model (SSD) P = 0.12); (d) AZOV lineage (N = 58 sequences; Raggedness P = 0.07; Model (SSD) P = 0.09).
Diversity 12 00118 g004
Figure 5. Posterior probability of scenarios according to the ABC modeling for Anodonta anatina lineages (evaluating the confidence in scenario choice determined using the direct (a) and linear regression (b) approaches.)
Diversity 12 00118 g005
Table 1. Prior assumptions and settings of three biogeographical scenarios, which were tested under an ABC framework.
ScenariosBasic AssumptionsPrior Setting of Divergence Time Intervals’ RangesPrior Setting of Effective Population Size and Mutation Model
Sc1Time scale t3-split of groups IBER, ITAL, AZOV and EUR.t1 = 105–107 years;
t2 = 105–107 years;
t3 = 105–107 years;
t1 < t2;
t2 < t3.
Effective population size:
NIBER = 2 × 10⁵–2 × 10⁶
NEUR = 7 × 10⁶–7 × 10⁷
NITAL = 1 × 10⁵–1 × 10⁶
NAZOV = 5 × 10⁵–5 × 10⁶
Evolutionary model:
HKY
Mutation rate:
Uniform COI molecular rate
µ= 2.65 × 10⁻⁹ substitutions/site/year
(rate range: 2.6 × 10⁻⁹–2.7 × 10⁻⁹ substitutions/site/year)
[28]
Sc2Time scale t3-split of groups AZOV and ITAL,
Time scale t2-split of groups IBER and ITAL,
Time scale t1-split of groups EUR and IBER.
Sc3Time scale t3-split of groups AZOV and ITAL,
Time scale t2-split of groups IBER and AZOV,
Time scale t1-split of groups EUR and IBER.
Table 2. Mean genetic divergences (uncorrected COI p-distance, %) between Anodonta anatina lineages.
IBEREURITAL
EUR2.56 ± 0.49
ITAL3.22 ± 0.063.41 ± 0.07
AZOV2.43 ± 0.052.35 ± 0.053.08 ± 0.06
Table 3. Summary of indices of genetic diversity estimated from the COI sequences for Anodonta anatina lineages: sample size (N), number of haplotypes (h), haplotype diversity (Hd), nucleotide diversity (π). Values of test of growth within each specie, i.e., the results of Fu’s Fs and Tajima’s D neutrality test. Statistically significant values are followed by an asterisk (p < 0.05 for Tajima’s D and p < 0.02 for Fu’ Fs).
LineageNhHdπFu’s FSTajima’s DMismatch Analysis (Spatial Expansion Model): Estimated τ
IBER56230.912 ± 0.0220.858 ± 0.469−7.109 *−0.7376.720
EUR168340.767 ± 0.0280.477 ± 0.280−21.078 *−1.840 *0.226
ITAL4280.725 ± 0.0580.477 ± 0.2850.5030.0283.895
AZOV58200.873 ± 0.0350.824 ± 0.452−4.375−0.3205.769
Table 4. Posterior probabilities of the three biogeographic scenarios.
Direct ApproachLogistic Approach
ScenarioPosterior Probability,
N * = 500
95% CIPosterior Probability,
N * = 1 × 10⁵
95% CI
Sc10.07400.0000–0.30350.01070.0045–0.0169
Sc20.41400.0000–0.84570.04720.0358–0.0587
Sc30.51200.0739–0.95010.94210.9284–0.9557
*- N is the number of simulated data sets closest to the observed data set that was selected from a total sample of 3 × 10⁶.
Table 5. Model parameters estimated from posterior distribution of Scenario Sc3 for Anodonta anatina lineages within the ABC framework.
ParametersMeanMedianQt 5%Qt 95%
Effective population size
NIBER1.88 × 1061.91 × 1061.67 × 1061.99 × 106
NEUR1.03 × 1079.28 × 1067.68 × 1061.56 × 107
NITAL8.48 × 1058.80 × 1055.92 × 1059.90 × 105
NAZOV3.57 × 1063.64 × 1062.17 × 1064.77 × 106
Divergence time estimation, years
ITAL vs. AZOV6.11 × 1066.06 × 1063.52 × 1069.01 × 106
AZOV vs. EUR + IBER3.61 × 1063.50 × 1061.85 × 1065.73 × 106
EUR vs. IBER1.50 × 1061.42 × 1067.69 × 1052.49 × 106
Mutation rate inferred from the mitochondrial COI gene, substitutions/site/year
µABC2.66 × 10−92.66 × 10−92.61 × 10−92.70 × 10⁻⁹

