Article

Phylogenetic Assessment of Freshwater Mussels Castalia ambigua and C. inflata at an Ecotone in the Paraguay River Basin, Brazil Shows That Inflated and Compressed Shell Morphotypes Are the Same Species

by
Miluska Olivera-Hyde
1,
Eric Hallerman
1,*,
Rogério Santos
2,
Jess Jones
1,3,
Brianne Varnerin
1,†,
Guilherme da Cruz Santos Neto
4,
Maria Cristina Mansur
2,
Priscilla Moraleco
2 and
Claudia Callil
2
1
Department of Fish and Wildlife Conservation, Virginia Polytechnic Institute and State University, Blacksburg, VA 24061, USA
2
ECOBIV—Conservation and Ecology of Freshwater Mussel Group, Bioscience Institute of Federal University of Mato Grosso—UFMT, Av. Fernando Correa da Costa 2367, Cuiabá 78060-900, MT, Brazil
3
U.S. Fish and Wildlife Service, Blacksburg, VA 24061, USA
4
Laboratory of Molecular Biology and Neuroecology, Federal Institute of Para—Braganza Campus, Av. dos Bragancanos S/N, Bairro Vila Sinha, Braganca CEP 68600-000, PA, Brazil
*
Author to whom correspondence should be addressed.
Current address: Department of Biology, Auburn University, Auburn, AL 36849, USA.
Diversity 2020, 12(12), 481; https://doi.org/10.3390/d12120481
Submission received: 25 October 2020 / Revised: 10 December 2020 / Accepted: 11 December 2020 / Published: 16 December 2020
(This article belongs to the Special Issue Freshwater Mollusk Conservation)

Abstract

:
The phylogeny and taxonomy of freshwater mussels of the genus Castalia in South America is complicated by issues of morphological plasticity and limited molecular genetic data. We present field data on the distributions of the nominal Castalia ambigua and C. inflata in the upper Paraguay River basin in Brazil based on original occurrence data at 23 sample sites and on historical records. The upper basin has distinct highland and lowland regions, the latter including the Pantanal wetland, where “C. ambigua” occurs in the highlands and “C. inflata” occurs in both regions. At Baixo Stream in the highlands, we observed individuals with shell morphologies of either C. ambigua or C. inflata, and also individuals with intermediate shell morphology. DNA sequence variation in the upland Baixo Stream and two representative lowland populations were screened. Two mitochondrial and three nuclear genes were sequenced to test hypotheses regarding the number of species-level phylogenetic lineages present. Reported individual DNA sequences from Amazon-basin C. ambigua and other Castalia and outgroup species were included in the analysis as outgroups. Individuals from the Paraguay River basin exhibited 17 haplotypes at the mitochondrial cytochrome oxidase I (COI) gene and nine at mitochondrial 16S rRNA. Analysis of haplotype networks and phylogenetic trees of combined COI + 16S rRNA sequences among individuals with the respective shell morphologies supported the hypothesis that C. ambigua and C. inflata from the Paraguay River basin belong to the same species and one phylogenetic lineage. No variation was observed at the nuclear 18S rRNA internal transcribed spacer, 28S rRNA, or H3NR histone genes among individuals used in this study. Across all markers, less variation was observed among Paraguay basin populations than between Paraguay and Amazon basin populations. Our results collectively suggest that: (1) “C. ambigua”, “C. inflata”, and morphologically intermediate individuals within the upper Paraguay drainage represent one phylogenetic lineage, (2) a phylogeographic divide exists between Castalia populations occurring in the Paraguay and Amazon River basins, and (3) the evolutionary and taxonomic uncertainties that we have identified among Castalia species should be thoroughly assessed across their distribution using both morphological and molecular characters.

1. Introduction

South America has a rich diversity of 168 native freshwater mussel species, with a recent description [1] and wide variation in richness among the continent’s hydrogeographic regions [2,3,4]. Despite the important ecological services provided by freshwater mussels and the need for their conservation in the context of rapid economic development and associated ecological change, South American mussels remain largely under-studied. Conservation planning would benefit from systematic surveys of the hydrogeographic regions, recognition of habitats and environmental variables that drive the distributions of species, and a better understanding of the morphological characters that distinguish species [3].
Among South American mussels, species of the genus Castalia Lamarck, 1819 (Unionoida: Hyriidae) are distributed through many major basins of South America (Figure 1A). In particular, the distribution of Castalia ambigua Lamarck, 1819 is found in four of the eight major Brazilian basins: the Amazon, Paraguay, and Paraná, with a restricted distribution in the Uruguay River basin [5,6]. Castalia inflata d’Orbigny, 1835 is distributed in the Paraguay River basin and the middle-lower Parana basin, with occurrence in Argentina, Paraguay, Uruguay, and Bolivia [5,7]. However, baseline data on species’ distributions are lacking in many regions.
Genus Castalia includes 13 [8] to 17 species [3], with the taxonomy of some members not well resolved. Species in the genus show wide morphological variation, with a particular shell shape for each different basin, hampering species recognition. Hence, genetic and phylogenetic studies are needed to differentiate similar or cryptic species, including C. ambigua and C. inflata [3]. Phenotypic variations of both valves and soft tissues were observed by D’Orbgny [9] and Ortmann [10], suggesting that specimens originating in the Amazon drainage in Bolivia should not belong to the same species reported from the Paraguay River drainage in Argentina. Five subspecies were offered by D’Orbgny [9], attributed as C. ambigua from the Amazon to the La Plata River drainages. The review initiated by Ortmann [10] and adopted by Bonetto [11] reported C. ambigua ambigua Lamarck, 1819 as restricted to the Amazon basin; C. ambigua inflata d’Orbigny, 1835 to the Paraguay-Paraná-La Plata basin; C. ambigua pectinata (Spix, 1827) to the São Francisco basin; and C. ambigua multisulcata Hupe, 1857 to Guyana, Venezuela, and Colombia. Of the two subspecies assigned to Argentina, C. ambigua ambigua and C. ambigua inflata [11], based on the diagnosis of shell and description of morphological characters, only Castalia inflata was regarded as valid taxonomically by Rumi et al. [12]. Castalia ambigua has multiple subspecies in some taxonomies, e.g., [2], while C. inflata is regarded as a species by some authors [3,13,14,15,16,17] and as a subspecies of C. ambigua by others [2,7,11,18,19]. Screenings of mitochondrial DNA of four Castalia species across the Amazon basin [20] showed poor phylogenetic resolution of C. ambigua, suggesting the possibility of cryptic variation within the nominal species. Resolution of the phylogeny of the species not only would inform taxonomic nomenclature but also conservation planning. Castalia ambigua is listed as a species of Least Concern in the IUCN Red List, while the status of C. inflata is unknown. C. inflata is on the Paraguayan list of endangered fauna [21].
This study focused on Castalia species in the upper Paraguay River basin, a region where the distributions of the respective species have not been studied intensively [22,23]. The upper Paraguay River basin has distinct regions, the highlands and lowlands, the latter including the Pantanal, the largest continuous wetland in the world [24]. We present data on the distributions of phenotypically defined “C. ambigua” and “C. inflata” in the upper Paraguay River basin, a key distributional contact zone, based on a field study of occurrence at 70 sample sites and validated historical records. At Baixo Stream in the highlands where both species occur, observation of individuals with shell morphologies intermediate between the two nominal species suggested the possibility of interbreeding. The correlation of shape and location of freshwater mussels within riverscapes has long been recognized [25], with upland forms having thinner shells and flatter cross-sections and lowland forms having heavier shells and more inflated cross-sections. These considerations led us to frame two alternative hypotheses: (1) Castalia ambigua and C. inflata are two distinct phylogenetic lineages, perhaps with interbreeding at a zone of contact in the highlands of the Paraguay basin, and (2) Castalia ambigua and C. inflata represent one phylogenetic lineage, with the morphological variation being the consequence of morphological plasticity common along riverscapes in freshwater mussels. We tested these hypotheses by screening both mitochondrial and nuclear DNA markers within this upland population and two representative populations of C. inflata from the lowlands. We used published mitochondrial DNA sequences of C. ambigua from the Amazon basin to compare populations across a major geographic divide to better understand intraspecific variation and the phylogeographic history of the species. Using mitochondrial data, we also assessed the demographic histories of C. ambigua lineages.

2. Materials and Methods

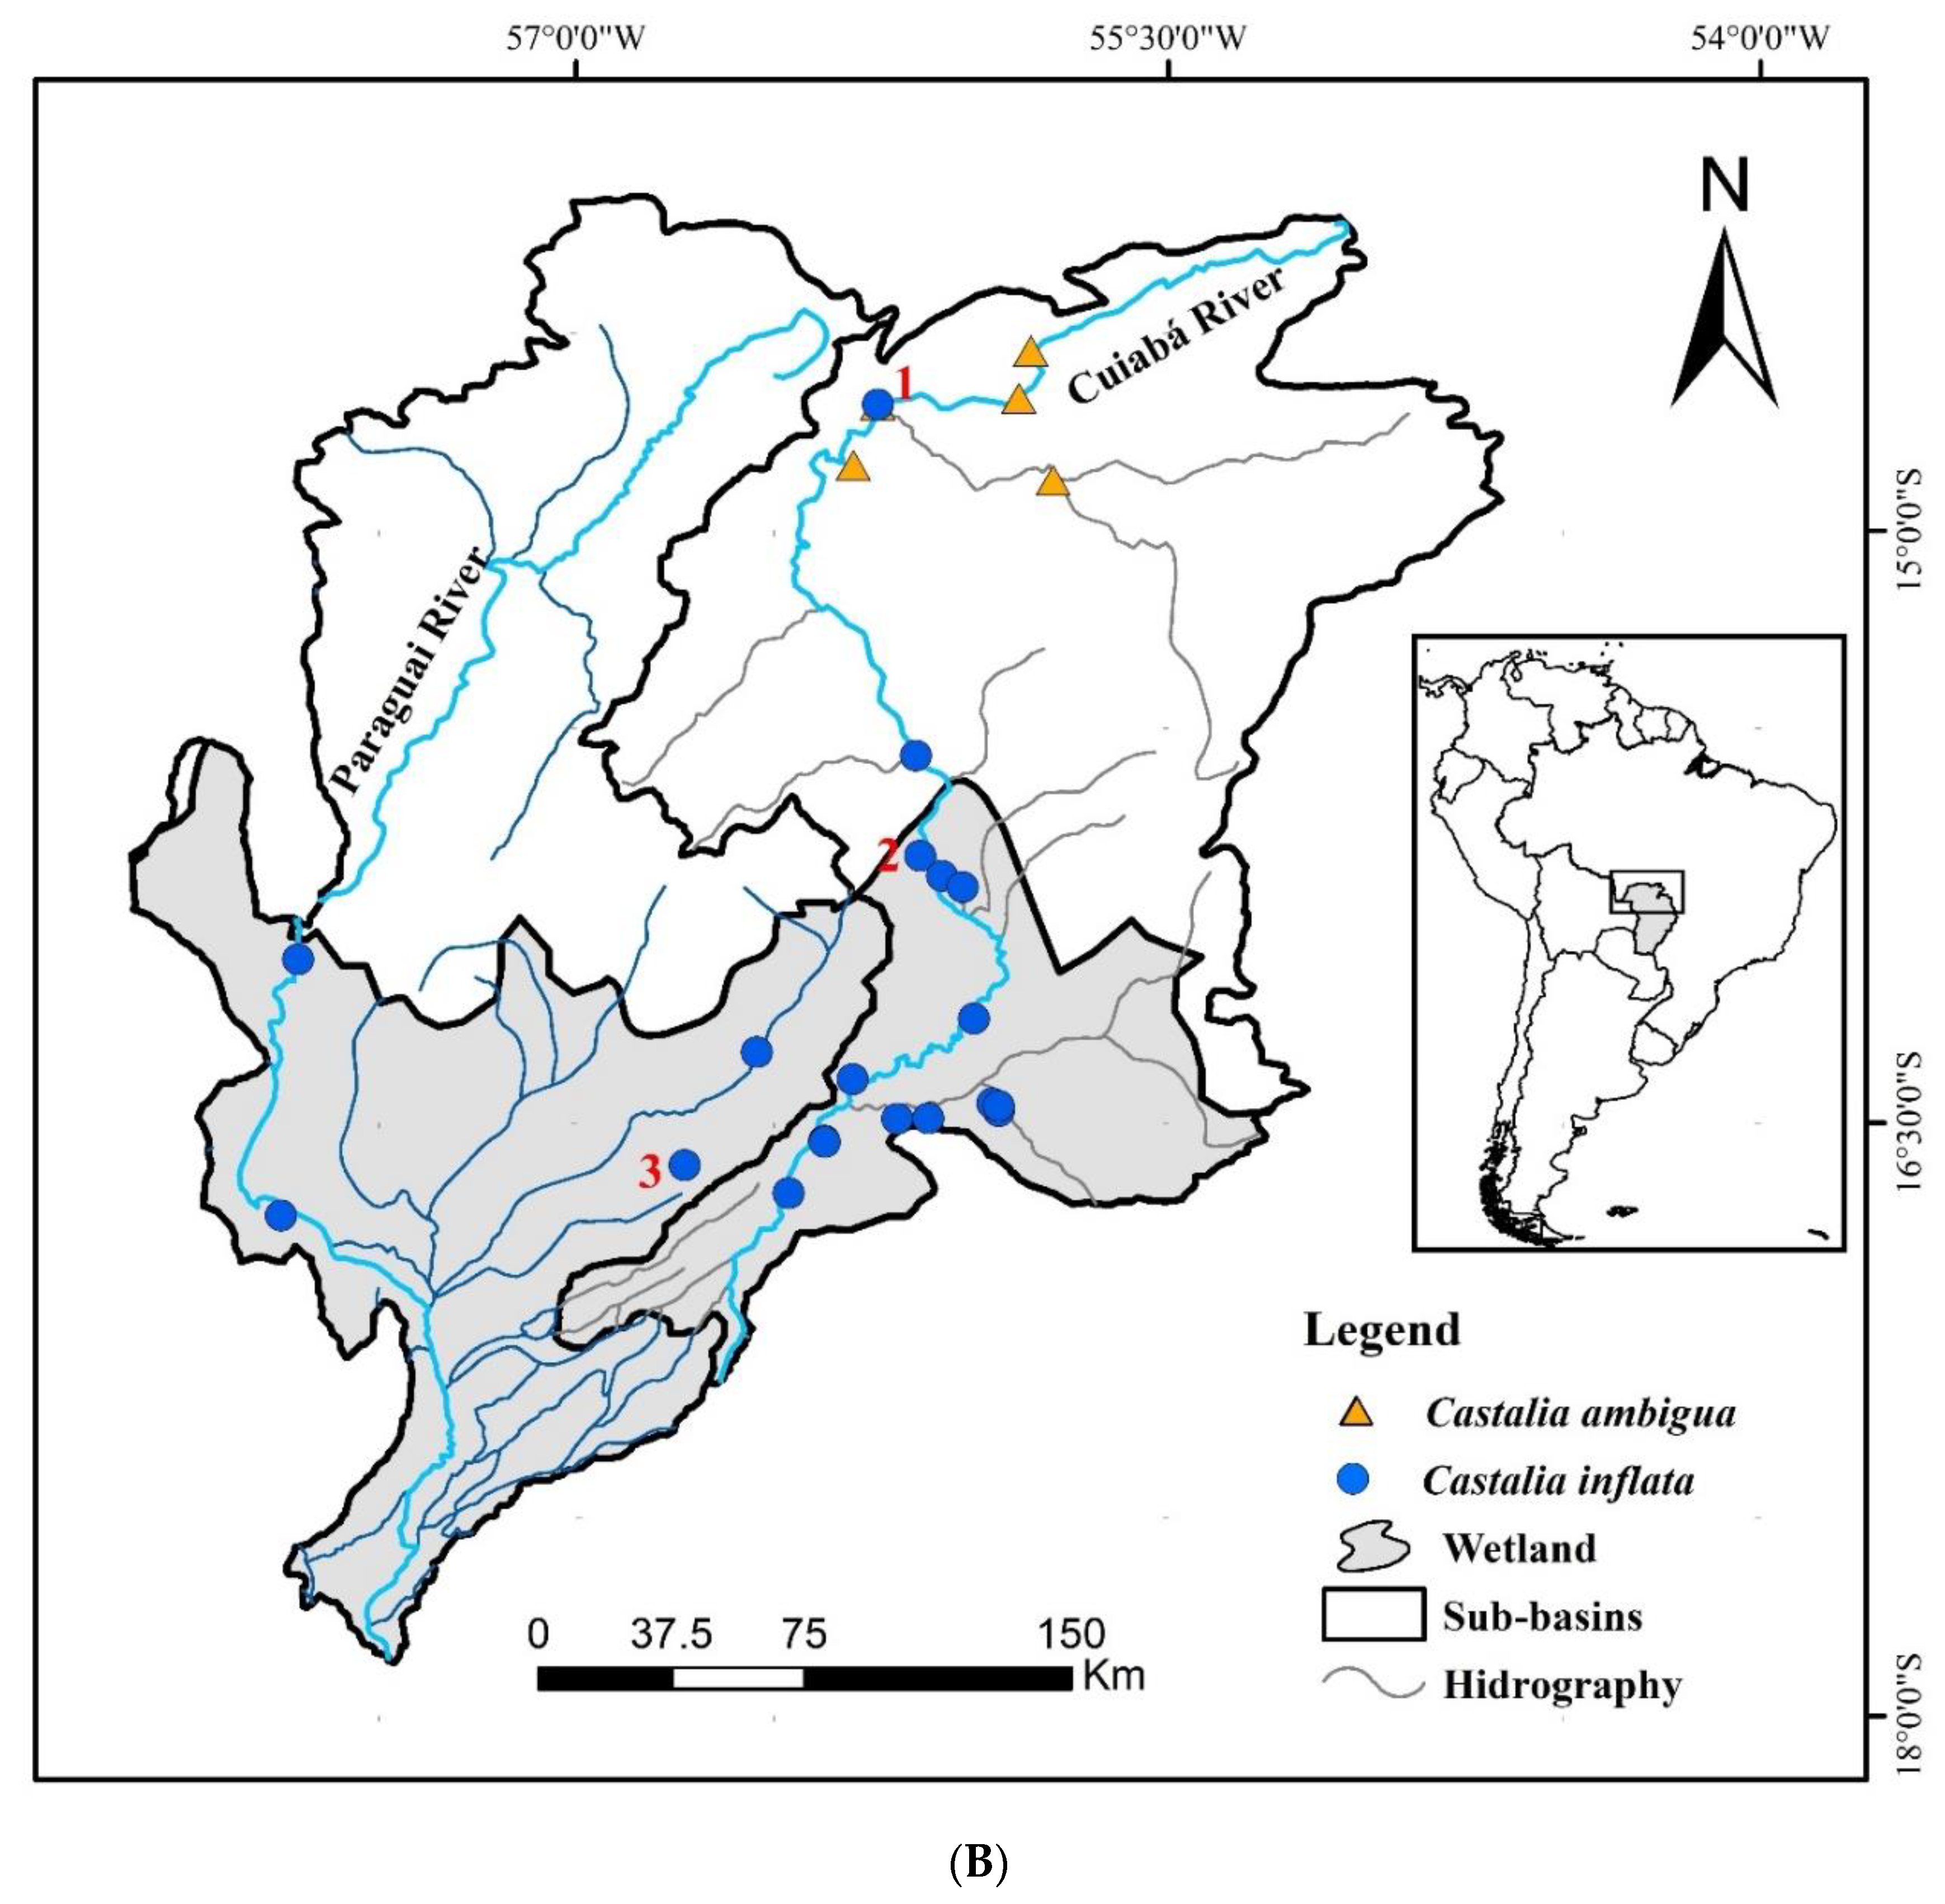
2.1. Study Area and Sample Collection

The upper Paraguay River basin—with an area of 365,592 km2 [26]—extends from the midwest of Brazil to Argentina, draining Bolivia, Paraguay, and Uruguay (Figure 1A). This riverine system connects two distinct landscapes, the highlands with most of the headwaters, and the lowlands that are marked by a seasonal flood pulse that characterizes the Pantanal, one of the world’s largest continuous wetlands [24]. A sampling of freshwater mussels was conducted in the sub-basins of the Cuiabá River and the Paraguay River, in the upper Paraguay Basin inside Mato Grosso state, Brazil. We implemented nested hierarchical sampling along the hydrological gradient from highlands to lowlands, with 70 sites sampled in total (Figure 1B inset map). The capture effort was standardized at 1 person-hour sampling quadrats within transects. Individual mussels were collected, measured, tagged, and returned to the same place in the river or lake.

2.2. Biometrical Measurements

All C. ambigua (n = 200) and C. inflata (n = 557) individuals were measured with a digital caliper at a resolution of 0.01 mm. The characters measured were total length (Lt, mm), height (h, mm), and width (wi, mm). To characterize groups, all data were standardized to have a mean of zero and deviation of 1, transforming the data on the same scale of variation, as suggested by Gotelli and Ellison [27]. Then, the data were ordered through Principal Components Analysis (PCA) using the software R [28]. For a graphical representation of the results of the PCA, we used the autoplot function of the package “ggfortify” [29].

2.3. Molecular and Phylogenetic Analyses

After observing individuals with shell morphologies intermediate between C. ambigua and C. inflata at Baixo Stream in the highlands, we resolved to test alternative phylogenetic hypotheses by screening mitochondrial and nuclear DNA markers in individuals from this stream and from other populations. Samples for molecular genetic and phylogenetic analyses were collected by hand at the three sites (Table 1, red numbers in Figure 1B inset map) in November 2015. Tissue samples from the mantle were obtained from 71 individuals: 34 from Baixo Stream (14°40′45.7″ S, 56°14′10.0″ W, site 1 on Figure 1B inset map), 10 from Valo Verde Lake (15°49′19.0″ S, 56°07′44.48″ W, site 2 on Figure 1 inset map), and 27 from Claro Stream (16°36′21.84″ S 56°43′31.67″ W, site 3 on Figure 1B inset map). Castalia inflata was collected at all three sites. At Baixo Stream, 19 mussels were classified as C. ambigua in the field, 44 as C. inflata, and 8 as “C. ambigua-like”, i.e., morphologically intermediate between C. ambigua and C. inflata. Thus, “C. ambigua-like” individuals were collected only at Baixo Stream. After gently prying each mussel partially open, the tip of a sterilized scissor was used to non-lethally remove a small sample of mantle tissue [30]. The tissue sample was fixed in 70% ethanol at ambient temperature. Samples were transported for subsequent analysis at Virginia Tech, Blacksburg, VA, USA.
The DNA was isolated from preserved tissue using the DNeasy Blood and Tissue Kit (Qiagen, Germantown, MD, USA). DNA quality and quantity were assessed using a μLite PC spectrophotometer (Biodrop, Cambridge, UK). The DNA concentration of samples was diluted to 10–30 ng/μL. We amplified two mitochondrial genes, cytochrome oxidase I (COI) and 16S rRNA, and three nuclear (internal transcribed sequence ITS-1 of 18S rRNA, 28S rRNA, and histone H3NR) DNA sequences. The PCR primers used for amplification of targeted sequences are shown in Table 2. Polymerase chain reactions (PCR) were performed in a final volume of 22 µL, containing 0.1 µL Taq polymerase (5 units/µL) (Promega, Madison, WI, USA), 2 µL of 5× buffer, and 2 µL MgCl2 (25 mM), 0.4 µL bovine serum albumin (BSA, 1 mg/mL), 0.4 µL of all four 5 mM dNTPs, 0.4 µL each of the respective two 5 µM primer solutions, 14.5 µL sterile ultrapure water (EMD Millipore, Darmstadt, Germany), and 1 µL of template DNA. The PCR was conducted in Bio-Rad thermocyclers, either a T100 or MyCycler. In the case of COI and H3, the PCR protocol was 3 min at 94 °C; 35 cycles of: one min at 94 °C, 45 s at 55 °C, 1 min at 72 °C; and a final extension at 72 °C for 5 min. For 16S and 18S ITS, the PCR started with 3 min at 94 °C; followed by 35 cycles of 40 s at 94 °C, 40 s of 53 °C (for 16S) or 60 °C (18S ITS), one min at 72 °C; and a final extension for 5 min at 72 °C. For amplification of the COI gene, we ran two PCR reactions, each of them with different forward primers but the same reverse primer. Finally, the 28S PCR reactions (22-µL) included 2.2 µL DNA extract, 0.1 µL Promega Taq polymerase, 2 µL 10× buffer and 2 MgCl2, 0.4 µL BSA (1 mg/mL), 0.4 µL of all four 5 mM dNTPs, 0.4 µL each of the two 5 µM primer solutions, and 13.3 µL sterile ultrapure water. PCR protocols were carried out in the previously mentioned thermocyclers and included: 3 min at 94 °C; 35 cycles of: one min at 94 °C, one min at 53 °C, and 90 s at 72 °C; and five min at 72 °C.
The presence of amplification product of a size appropriate for the respective gene regions used in our study was confirmed using standard gel electrophoresis through a 2% agarose TBE (tris-borate-EDTA) gel, which was stained with ethidium bromide. PCR reaction products were sequenced using both forward and reverse primers with the BigDye Terminator Cycle Sequencing Kit v.3.1 on an ABI3730 DNA sequencer at the Fralin Life Sciences Institute (Blacksburg, VA, USA). Consensus sequences were obtained by using Geneious 7.0.6 (Biomatters, Auckland, New Zealand). GeneStudio Professional Edition, ver. 2.2.0.0 (Informer Technologies, Inc., Los Angeles, CA, USA) was used to align the sequences. All consensus sequences for C. ambigua and C. inflata were aligned within and between the species and any putative polymorphisms were cross-checked against the original chromatogram to remove any reading errors. Our 18S ITS sequences were aligned using both Clustal W [46] and webPRANK [47] alignment software. The resulting gaps were coded using FastGap v1.2 [48]. Original DNA sequences were submitted to GenBank using the BanKlT sequence submission tool (http://www.ncbi.nlm.nih.gov/WebSub/?tool=genbank). DNA sequences in our original .fasta files were compared against entries in GenBank (http://www.ncbi.nlm.nih.gov/nuccore/) using the Basic Local Alignment Search Tool [49]. All archived sequences returned with homology scores over 90% were recorded.
Variable sites and genetic variability of mitochondrial DNA sequences were assessed using DnaSP 5.10 [50], including number of haplotypes, the average number of nucleotides differences, gene diversity, and nucleotide diversity for each species at each sampling location for the COI and 16S gene regions.
Haplotype networks for each marker were constructed using PopArt (Population Analysis with Reticulate trees) [51] to show the distribution of the haplotypes among the three populations and among the three species. All haplotype networks were constructed using the TCS inference method [52].
We conducted phylogenetic analyses of the DNA sequences from C. ambigua sampled in this study and outgroup species within Tribes Castaliini and Hyriini downloaded from GenBank. The COI sequences included those from our own results for Castalia sp. (GenBank accession numbers KY474356-KY474356-372), C. ambigua (KU888236-KU888243), and Triplodon corrugatus (KU888253) from da Cruz Santos-Neto et al. [20]. The 16S sequences analyzed included Castalia sp. (KU463457-KU463465) from this study, as well as archived sequences from C. ambigua (KU888207-KU888213) and Triplodon corrugatus (KU888224). The 18S ITS sequences included Castalia sp. (KY463466) from our study, plus C. ambigua (KU888178-888182), C. stevensi (KU88184), and Callonaia duprei (KU888175) from da Cruz Santos-Neto et al. [20]. For COI + 16S, the outgroup was Triplodon corrugatus (KU888253 + KU888224). The evolutionary model for each sequence alignment was selected using Kakusan4 [53], where we used Akaike information Criterion (AIC) to find the most appropriate theoretical model of molecular evolution. Using that model, maximum likelihood phylogenetic trees were constructed using MrBayes 3.2.5 [54]. Bayesian analysis included four (16S, COI + 16S) and eight (COI and 18S ITS) Markov chain Monte Carlo chains with a total of 600,000, 500,000, 500,000, and 1.5 million generations for COI, 16S, 18S ITS, and COI + 16S, respectively, with trees sampled every 100 generations. Tree topologies remaining after the first 25% were excluded from the cold chain and were used to calculate posterior node probabilities [55]. We used Tracer v. 1.6.0 [56] to assess MCMC convergence and to ensure that the effective sample size (ESS) was higher than 200. For each dataset, we assessed species delimitation using the Automatic Barcode Gap Discovery (ABGD) [57] method which detects barcode gaps, where we used the Kimura distance model, a minimum intraspecific distance of 0.01, and a maximum intraspecific genetic distance of 0.1. The final phylogenetic tree was created by using the consensus trees in RStudio using “ape” [58], and “phytools” [59] packages.

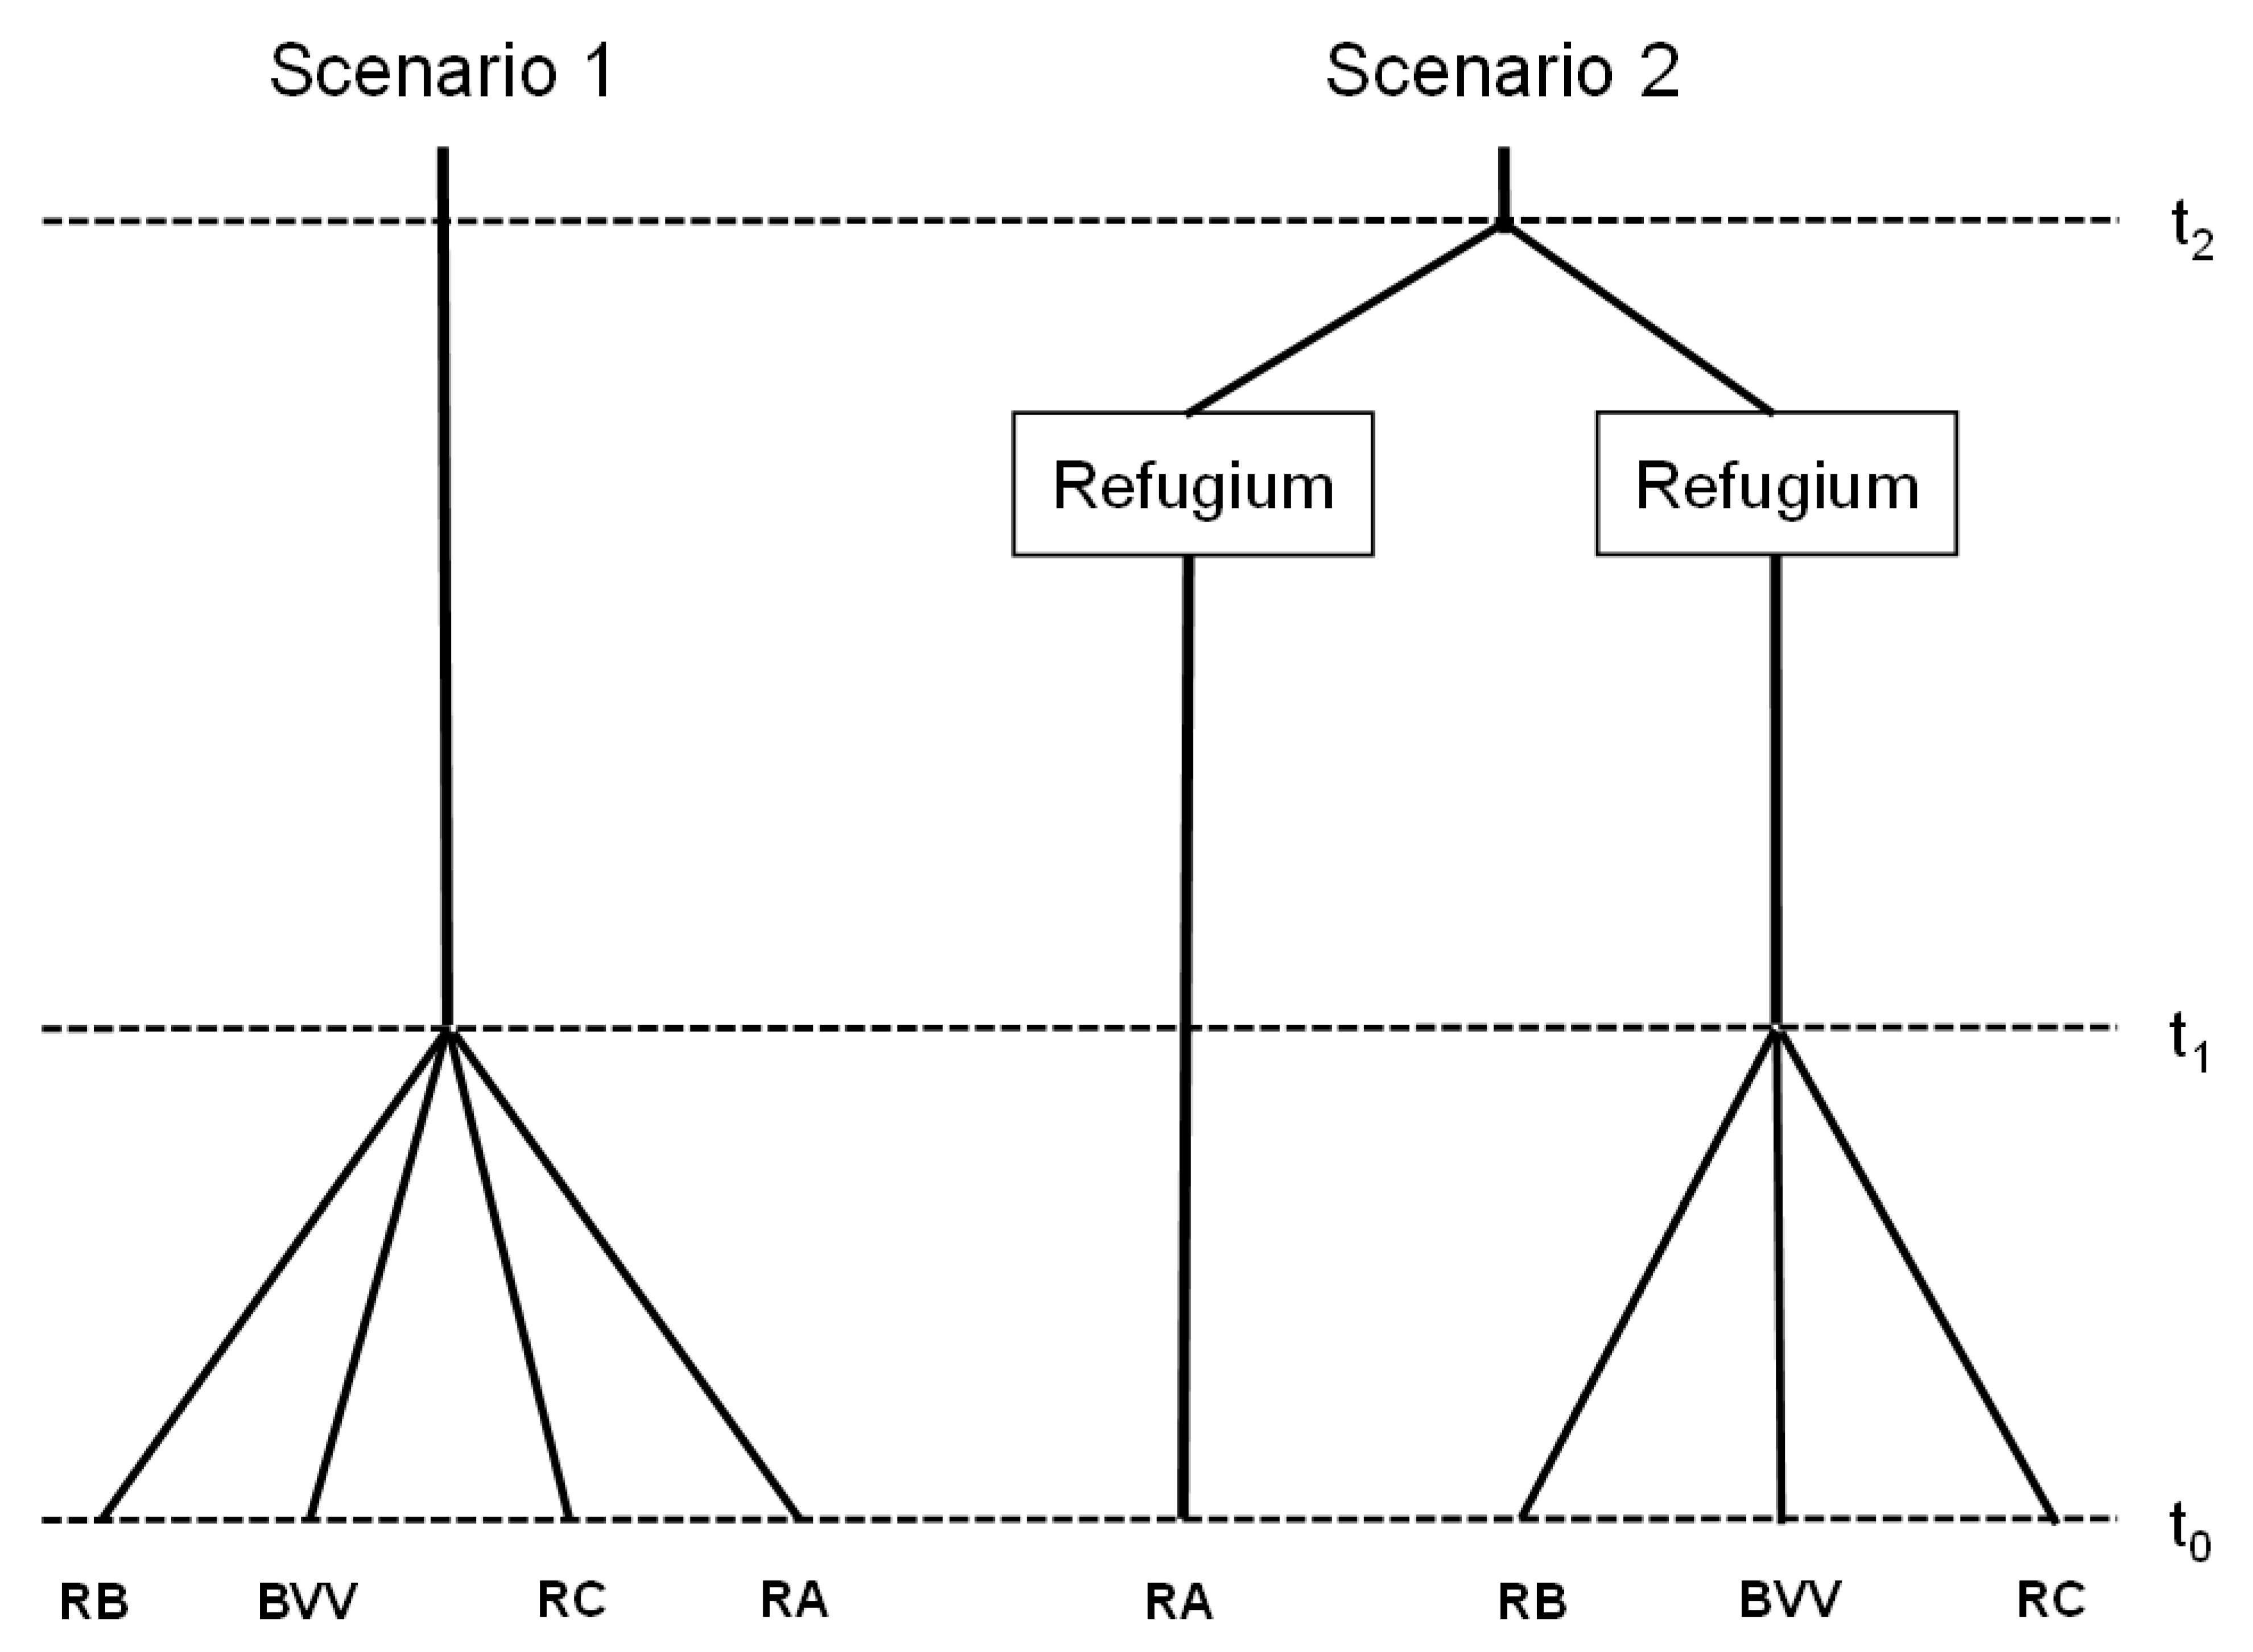
2.4. Inference of Historical Demography

We tested two demographic scenarios using Approximate Bayesian Computation (ABC) modeling as implemented in DIYABC [60]. Noting that our mitochondrial DNA phylogenetic analysis identified two distinct lineages for C. ambigua, one in the Amazon River basin and the other in the Paraguay River basin (see Results), Scenario 1 was designated as the null model, where all four populations diverged at the same time from a common ancestor with equal divergence rates (Figure 2, left). Scenario 2 assumed the Paraguay and Amazon basin lineages of C. ambigua diverged initially from each other earlier in time (t2), and then later (t1) the three populations in the Paraguay River basin diverged simultaneously from their common ancestor with equal divergence rates. Using combined mitochondrial DNA sequences, we simulated historical demography over millennial (e.g., >1000 years ago) time-scales. Each scenario contained all four extant populations at generation t0 (Figure 2, right). We conducted simulations assuming all populations diverged simultaneously from a common ancestral population.
Prior values of Ne for extant and ancestral populations ranged from a minimum of 10 individuals to a maximum of 50,000 individuals and utilized a uniform distribution (Table 3). The Ne values were based on preliminary analyses to confirm the upper boundaries of the prior values. The prior value for time-point t1 was 10–20,000 generations ago and for t2 1000–100,000 generations ago, with both time-points utilizing a uniform distribution. Mean generation time was set at 5.5 years for both species based on female longevity of 10 years, which was derived from a life-table analysis of demographic data for the Baixo Stream population of C. ambigua (C. Callil, unpublished data). To estimate the mean mutation rate, we used a Hasegawa–Kishino–Yano mutation model [61] and set the per-site per-generation mutation rate to range from a minimum rate of 1 × 10⁻⁸ to a maximum of 1 × 10⁻⁶. For each demographic scenario, two million simulations were run, and then their respective posterior probabilities were compared using logistic regression to determine the most probable scenario [62]. Finally, confidence in each scenario was assessed by evaluating Type I and Type II error rates [60]. One thousand test data sets were simulated using each scenario, respectively, and then the posterior probabilities were evaluated for the simulated data sets. The Type I error rate was calculated from the proportion of posterior probabilities of Scenario I that were lower than the posterior probabilities of Scenario II when Scenario I was the true scenario, and vice versa for Scenario II. The Type II error rate was calculated from the proportion of posterior probabilities of Scenario I that were higher than the posterior probabilities of Scenario II when Scenario I was not the true scenario, and vice versa for Scenario II.

2.5. Permits and Ethical Aspects

We obtained authorization from IBAMA, the Brazilian Institute of the Environment and Renewable Natural Resources, for the collection of zoological material in accordance with Portaria do lbama n° 332/90 and other relevant rules and regulations.

3. Results

3.1. Morphology and Distribution

The genus Castalia has thick shells of an equilateral triangular shape, the umbos are high and prominent with umbonal sculpture well developed and extending over a large part of the shell, the posterior ridge is sharp, and the anterior shell margin is well defined and ligament well developed [63]. Data from individuals collected at 70 sample sites in the upper Paraguay River basin showed that C. ambigua occurred at 5 sites (Table 1, Figure 1B, inset map) and C. inflata at 19.
Castalia inflata was associated with the lowlands, marginal shallow lakes, and oxbow lakes of the Cuiabá River in areas influenced by the spring flood pulse [22,23]. Castalia inflata (Figure 3A, top row) has an equilateral triangular shell; very inflated; high and robust; rounded anterior border; obliquely truncated posterior margin, forming an edge with a ventral border that is straight at the posterior region; umbos central, tall, large and wide; radial umbonal sculpture formed by parallel rays strongly marked, generally covering the entire surface of the shell; keel high and prominent, with a very strong back slope; shield large and flat, periostracum matte dark-brown; hinge strong, very arched and broad, with pseudocardinal and lateral teeth perpendicularly striped [64].
Castalia ambigua found exclusively in the highland streams with a fast flow and high productivity in limestone-dominated watersheds [22,23]. Castalia ambigua (Figure 3B, middle row) has an inequilaterally triangular shell; inflated; high and robust; rounded anterior border and slightly tapered; obliquely truncated posterior margin forming an edge with a ventral margin that is straight or rounded at the posterior third; umbos sub-central, lower and smaller; radial umbonal sculpture formed by strongly marked diverging rays, usually longer posteriorly; keel high and a little rounded, with oblique dorsal slope, shield small and elongated; periostracum matte brown; hinge strongly arched and wide; pseudocardinal and lateral teeth perpendicularly striped [36,64].
As noted above, at Baixo Stream in the highlands, “C. ambigua-like” individuals were observed (Figure 3C, bottom row) that exhibited morphological traits intermediate to those described for nominal C. inflata and C. ambigua.

3.2. Biometry

A total of 557 C. inflata individuals from 19 sample sites were measured, with a mean (±SE) length of 27.22 ± 5.59 mm, width of 18.69 ± 4.17 mm, and height of 24.59 ± 5.24 mm. A total of 200 C. ambigua individuals from five different sites were measured. Variation was higher for C. ambigua, with a mean length of 39.11 ± 12.47 mm, width of 19.94 ± 6.46 mm, and height of 37.76 ± 10.32 mm.
Results of principal components analysis (Figure 4) showed two distinct groups, one for each nominal species, with 92.88% of the variance explained by the first axis. Some degree of overlap among the groups is visible (Figure 3A), which may be the consequence of the morphometric variation of individuals with intermediate morphology, hereafter “C. ambigua-like” individuals. The biometrical variable that contributed most greatly to variation was width (Figure 4).

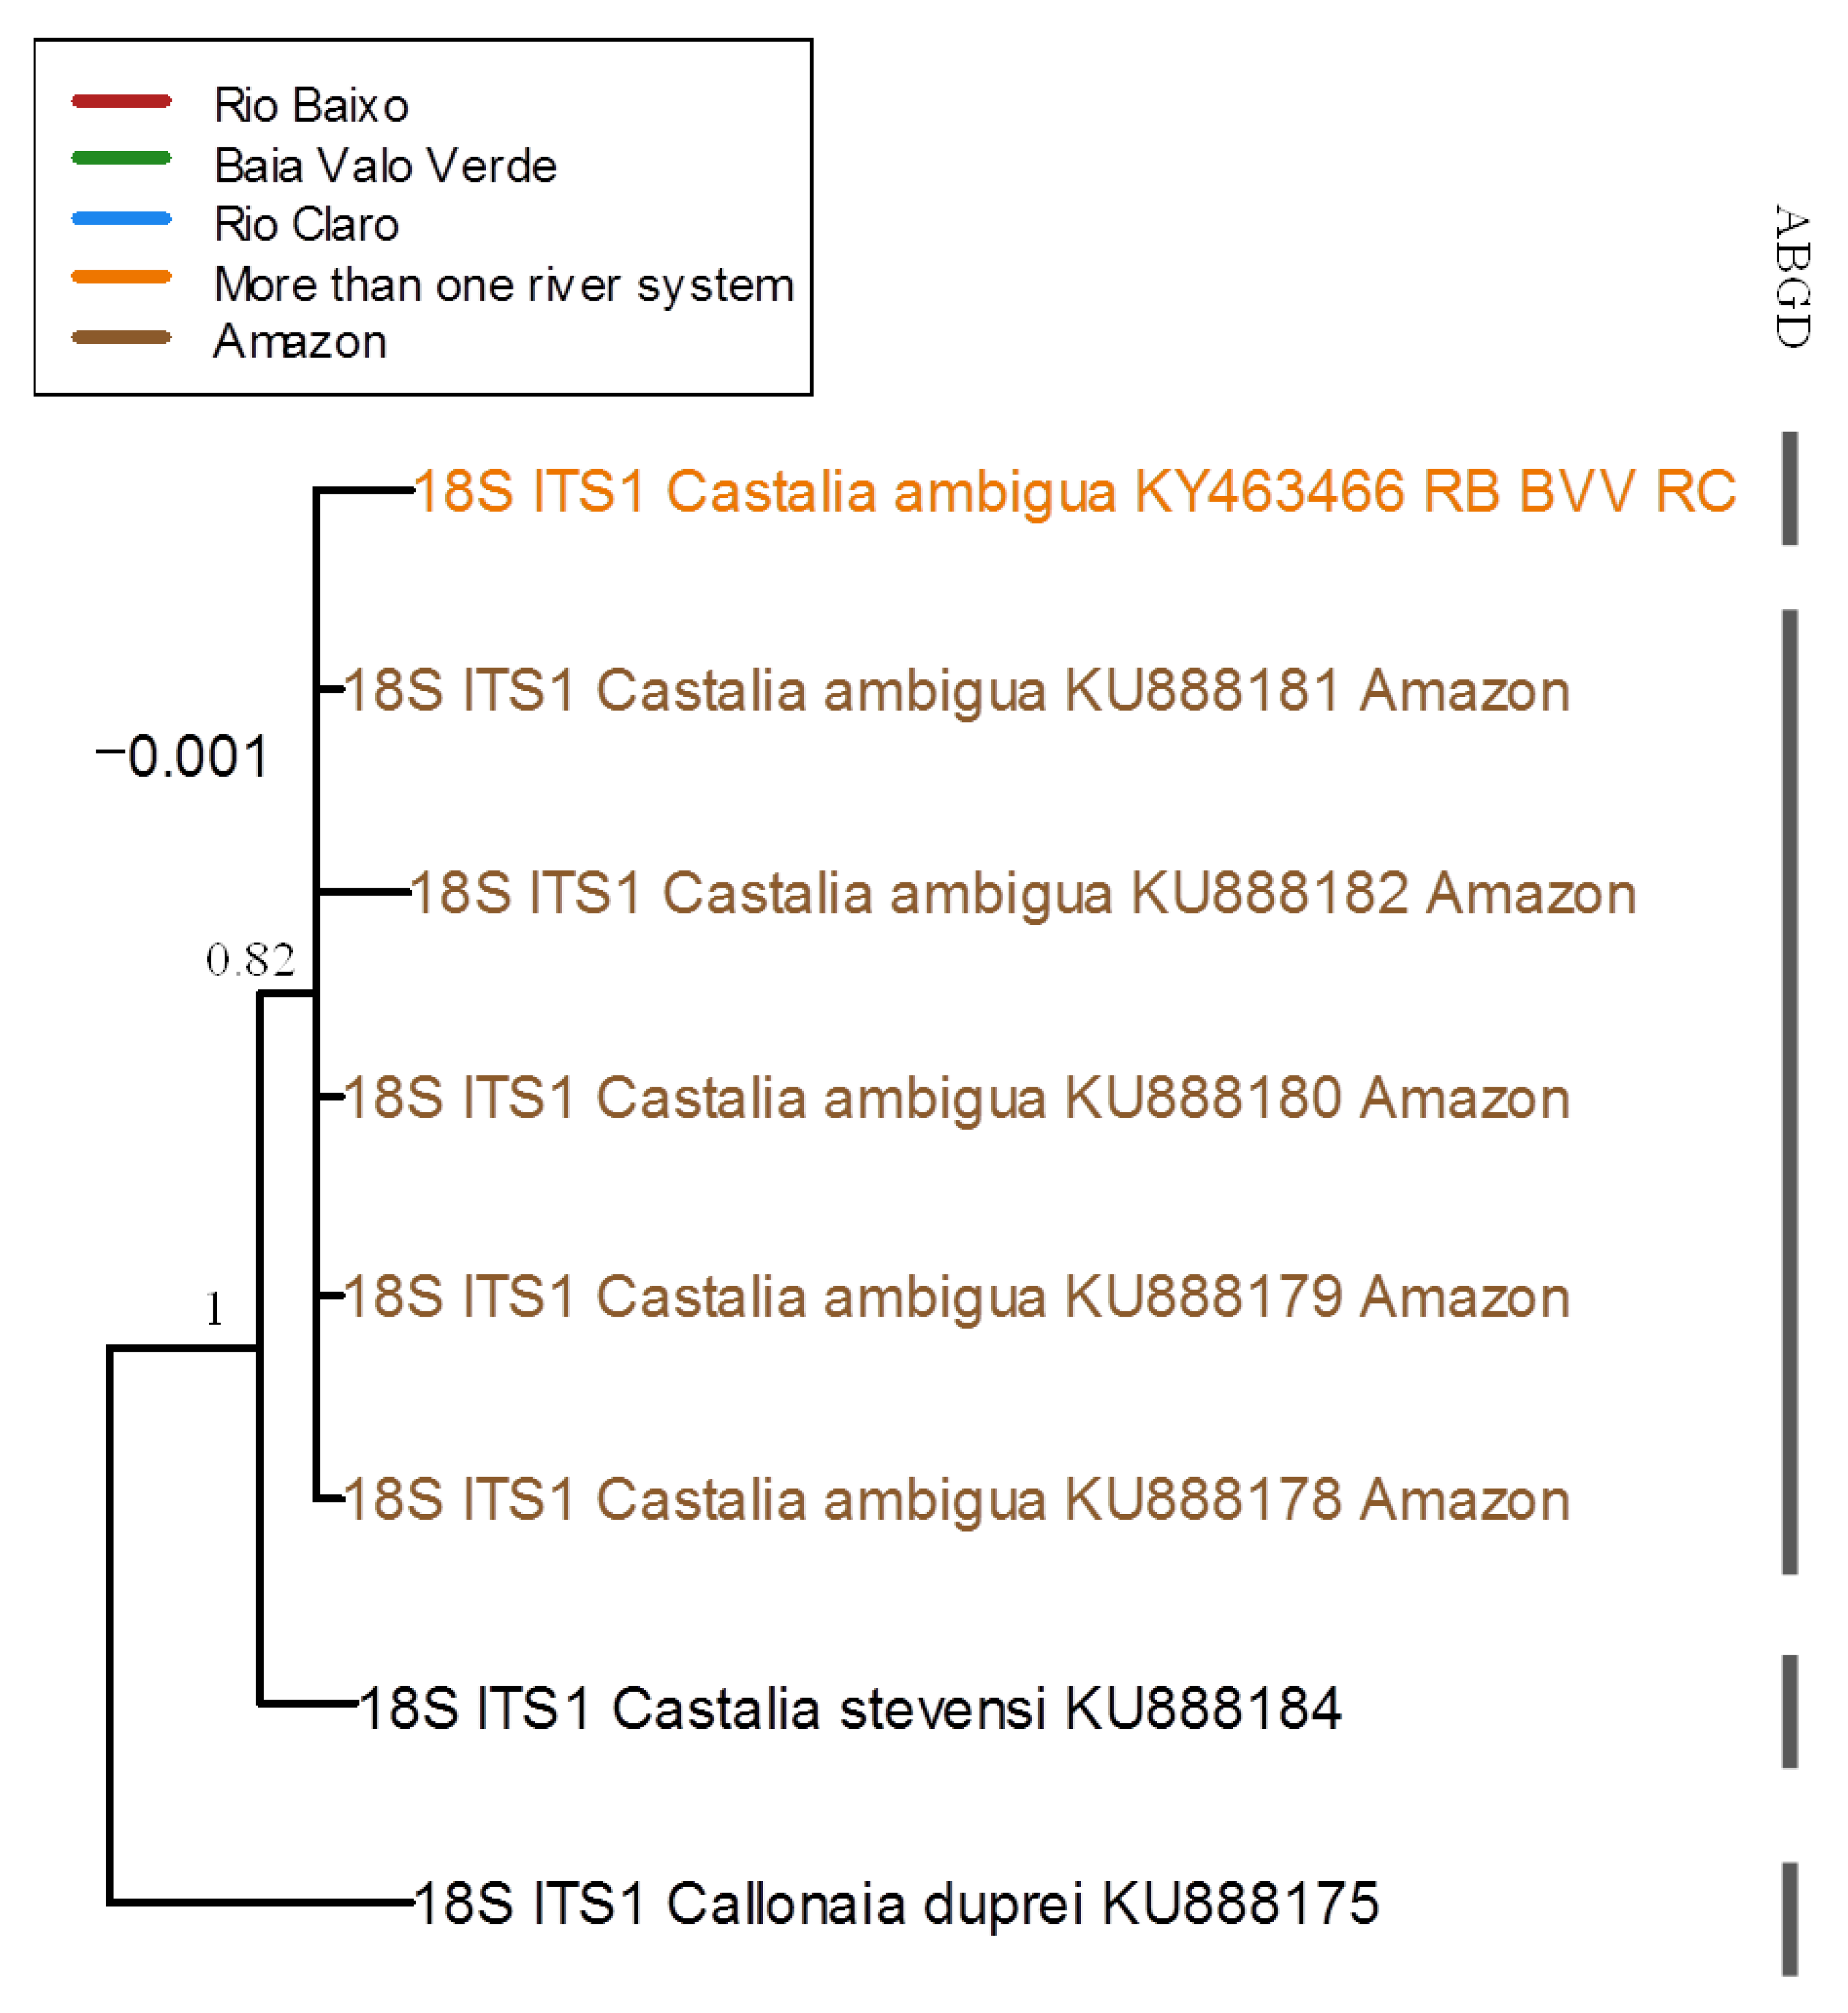
3.3. Molecular and Phylogenetic Analyses

A total of 71 samples—34 from Baixo Stream (highlands), 27 from Claro Stream (lowlands), and 10 from Valo Verde Lake (lowlands)—were sequenced at the COI gene, 19 that were morphologically C. ambigua, eight “C. ambigua-like” or intermediate, and 44 C. inflata. We considered molecular variation among C. ambigua from the Amazon River watershed [20] as a geographical outgroup. Among the sequence alignments, 25 haplotypes were identified on the basis of 25 variable nucleotides within 514 bp (Table 4). The respective haplotypes are reported as GenBank accession numbers indicated in Table 4. Metrics of genetic variation at the mitochondrial COI region (Table 5) show higher numbers of nucleotide differences (k) and nucleotide diversity (π) among C. ambigua-like than among C. ambigua or C. inflata individuals within the Paraguay River watershed despite the smaller sample size. Haplotype diversity (h) was somewhat higher in C. ambigua than in C. inflata. COI sequences for C. ambigua, C. inflata, and C. ambigua-like individuals were 91%, 92%, and 93% similar to the Callonaia duprei (Recluz, 1842), respectively, and 93%, 94%, and 95% similar to the Castalia quadrata (Sowerby, 1867) reference sequences retrieved from GenBank.
Because the COI sequences from da Cruz Santos-Neto et al. [20] are shorter than ours, after trimming ours to an equal length of 343 base pairs, some of our haplotypes became the same as others. Sequences that became identical after trimming were Cast_COI_06 with Cast_COI_07, and Cast_COI_03 with Cast_COI_04. Some sequences reported by da Cruz Santos Neto et al. [18] were found to be the same haplotype, viz. KU888238 with KU8888239, KU888236 with KU888237, KU888240 with KU888241, and KU888242 with KU888243. Considering the haplotypic distribution on a geographical basis (Figure 5A), the Claro Stream collection exhibited haplotypes Cast_COI_2, 3, 14, 15, 16, and 17, the Valo Verde Lake collection haplotypes Cast_COI_1, 2, 3, and 4, and the Baixo Stream collection haplotypes Cast_COI_3, 5, 6, 7, 8, 9, 10, 11, 12, and 13. Claro Stream and Vale Verde Lake haplotypes tended to the left of the haplotype network and Baixo Stream haplotypes to the right, reflecting geographic and elevational distributions. Most striking, the Amazon River haplotypes are at least 18 mutational steps separated from the Rio Paraguay haplotypes. Considering haplotypes on a taxonomic basis (Figure 5B), some haplotypes (Cast_COI_3, 5, and 6) were exhibited across nominal species, and C. inflata haplotypes were embedded among the C. ambigua haplotypes. That is, haplotypes Cast_COI_1, 2, 4, 14, 15, 16, and 17 were observed only in C. inflata, haplotypes Cast_COI_7, 8, 9, 10, 11 and 13 only in C. ambigua, and haplotypes Cast_COI_3, 5, 6, 7, 11, and 12 in both taxa or in their “C. ambigua-like” individuals. The C. inflata haplotypes tended toward the middle of the haplotype network, C. ambigua haplotypes to the edges, and those of “C. ambigua-like” individuals from the center to the right.
At the mitochondrial 16S rRNA region, 70 samples from the Rio Paraguay watershed were sequenced (19 of C. ambigua, 43 of C. inflata, and 8 of C. ambigua-like). We also considered variation among C. ambigua from the Amazon River watershed [20] as a geographical outgroup. Within a 443-bp sequence, 38 variable nucleotides defined 9 haplotypes in the Rio Paraguay and 7 in the Amazon River watersheds (Table 6), which have been reported as the GenBank accession numbers indicated at the right margin of the table. Our 16S rRNA sequences were 93–94% similar to the C. duprei and 96% similar to the C. quadrata reference sequences retrieved from GenBank. Metrics of genetic variation at the mitochondrial 16S rRNA region (Table 7) were lower than those for the COI region. Metrics for C. inflata were generally higher than for C. ambigua and were higher for C. inflata in the lowlands (Valo Verde Lake, Claro Stream) than at the edge of their distribution in the highlands (Baixo Stream).
Because the 16S rRNA sequences from da Cruz Santos-Neto et al. [20] are shorter than ours, after trimming ours to equal length, some of our haplotypes became the same. Identical sequences after trimming were Cast_16S_01, Cast_COI_02, and Cast_16S_04. All geographic sites within the Rio Paraguay basin exhibited multiple 16S rRNA haplotypes (Figure 6A), with the respective populations showing different haplotype frequencies. Haplotype frequencies differed across nominal taxa (Figure 6B). Most C. inflata individuals exhibited haplotype Cast_16S_2, with some individuals showing any of six haplotypes no more than three mutational steps from Cast_16S_2. Most C. ambigua individuals exhibited the Cast_16S_2 haplotype, with one individual showing the closely related Cast_16S_4. The C. ambigua-like individuals exhibited the common Cast_16S_2 haplotype and one closely related Cast_16S_5. Notably, all Amazon River haplotypes were at least 12 mutational steps removed from all Rio Paraguay haplotypes. On a taxonomic basis (Figure 6B), most C. inflata and C. ambigua-like haplotypes were among the C. ambigua haplotypes.
A 559-bp segment of the internal transcribed spacer (ITS1) of the nuclear 18S rRNA gene was sequenced in 46 individuals, including seven C. ambigua, 36 C. inflata, and three C. ambigua-like individuals. The use of software packages Clustal and Webprank resulted in the same alignment of our sequences. No variable nucleotides were observed. The sequence is reported as GenBank accession number KY463466. Gaps resulted when our Castalia 18S rRNA sequences were aligned with those of outgroup Callonaia duprei (KU888175), and four indels were coded using FastGap v1.2.
A total of 75 samples were sequenced at the nuclear 28S rRNA gene: 10 C. inflata from Valo Verde Lake, 27 C. inflata from Claro Stream, and 38 C. inflata, C. ambigua, and “C. ambigua-like” from Baixo Stream. One haplotype was observed across 441 nucleotides among all individuals and is reported as GenBank accession number KT885158.
A 354-bp segment of the histone H3NR gene was sequenced among 64 individuals, 19 C. ambigua, 37 C. inflata, and eight C. ambigua-like. The same nucleotide sequence was observed among all individuals and is reported as GenBank accession number KY474373.
For phylogenetic analysis of the COI sequence data set, the General Time Reversible (GTR) with invariable sites model was selected. For 16S sequences, the General Time Reversible (GTR) model with gamma distribution and a proportion of invariable sites [65] was selected as the most appropriate evolutionary model. For 18S ITS1, the GTR model with equal rates was found to be the most suitable. For the combined COI + 16S sequences, the most appropriate evolutionary model was the Hasegawa–Kishino–Yano (HKY) with gamma distribution and a proportion of invariable sites [61]. Phylogenetic trees constructed using Bayesian analysis, which we discuss below, showed the inferred evolutionary relationships of mussel populations that we sampled within the larger context of regional variation. Phylogenetic trees constructed using maximum likelihood (not shown) yielded trees with topologies that were virtually the same as those from the Bayesian analysis.
The phylogenetic tree showing relationships among mitochondrial COI haplotypes (Figure 7) exhibited both geographic and phylogenetic patterns. The two lower clusters included haplotypes from C. ambigua from the Amazon River basin observed by da Cruz Santos-Neto et al. [20] and are shown in brown. The large upper cluster was comprised of all of our samples from the Paraguay River basin, a cluster including a mixture of haplotypes from nominal C. ambigua, C. inflata, and C. ambigua-like individuals from all three geographic sites.
Phylogenetic analysis of mitochondrial 16S rRNA sequence haplotypes (Figure 8) clearly separated haplotypes of C. ambigua and C. inflata from those of outgroup Triplodon corrugatus (Lamarck, 1819). Haplotypes of C. ambigua from the Amazon River were clearly separated from those of all nominal Castalia species from the Paraguay drainage.
Phylogenetic analyses of combined mitochondrial COI and 16S sequences (Figure 9) showed stronger evidence of geographic than of nominal species structure. At the most basal node in the tree, the combined haplotype of the outgroup T. corrugatus sequence was basal to all others. The second node separated haplotypes of C. ambigua from the Amazon basin from all those of all nominal species from the Paraguay basin.
Phylogenetic analysis of our one observed ITS1 haplotype, those of C. ambigua from the Amazon basin [20] and outgroups C. stevensi (H.B. Baker, 1930) and Callonaia duprei (Figure 10) showed clear distinction of Castalia haplotypes from those of Callonaia. All Castalia haplotypes clustered tightly together.

3.4. Historical Demography

Scenario 2 (where populations in the Paraguay and Amazon basins differentiated before the three populations within the Paraguay basin did) was identified as the most highly supported demographic scenario by our DIYABC analysis, with a posterior probability of 0.994 (0.993–0.995), compared to Scenario 1 (all four populations diverged at the same time from a common ancestor with equal divergence rates) with a posterior probability of 0.006 (0.005–0.007). The Type I and II error rates for Scenario 2 were both <1%, which are very low, and thus when combined with the much higher posterior probability suggests that Scenario 2 is the best-supported scenario to explain the data. For Scenario 2, the median posterior distributions of Ne ranged from a high of ~32,600 for the Amazon River population to a low of ~4020 for the Valo Verde Lake population, median divergence times of populations at t1 was ~1290 generations ago (~7095 years ago) and at t2 it was ~7240 generations ago (~39,820 year ago), and the median mutation rate was 6.64 × 10⁻⁷ (Table 3).

4. Discussion

4.1. Distribution, Morphology, and Taxonomy

Due to the high number of species in the genus Castalia Lamarck (1819)—thirteen [8,66] to seventeen [3] in total—and their widespread occurrence throughout South America, the literature on distribution and identification of some member species, such as C. ambigua and C. inflata, remains confusing, with many records of occurrence uncertain [10,11] (Figure 1A). Records for C. inflata have always been common in mid-southern South America, where the type locality was described from specimens collected in the Parana River, in the province of Corrientes in Argentina. The initial records were from the lower Paraná River (von Ihering, cited in 10); small tributaries of the Paraná River (D’Orbigny) in Argentina, to the Paraguay River near the Apa River in Mato Grosso do Sul and upstream at Cáceres in Mato Grosso, both in Brazil (von Ihering, cited in 10). Recently, this species was recorded in the Paraná River in Santa Fé, Argentina [5,31]; in the La Plata River in Uruguay [11]; and at the confluence of the Apa and Paraguay rivers in Paraguay [19]. In Brazil, C. inflata was reported in the Bento Gomes River at Poconé in Mato Grosso [23,32,67], the Uruguay River at Uruguaiana in Rio Grande do Sul [33], and associated with several reaches and marginal lakes of the Cuiabá River in the Pantanal in Mato Grosso [22,34].
The occurrence of C. ambigua is better documented; the description of the type specimen is from the Amazon Basin, but there are records in other major watersheds of South America, occurring from the Magdalena River basin in Colombia to the La Plata River in Argentina [11] and the San-Miguel and Guarayos rivers in Bolivia [9]. In Brazil, this species occurs at the confluence of the Rio Negro with the Solimões River [36]; the Uraricoera and Branco River [68]; the Aripuanã River [37], Tocantins River [35]; and the Irituia River [6] in the Amazon; in the Cuiabazinho River in Mato Grosso [64], and there are records for the São Francisco River basin [11].
The distributions of the nominal taxa C. ambigua and C. inflata meet at the northern portion of the upper Paraguay River basin. In our study system, C. ambigua occurred exclusively in lotic waters with relatively high primary productivity and high conductivity (230–370 µS/cm3). Such environments occur only in the highlands, in the headwaters region of the upper basin associated with streams and rivers rich in calcium derived from calcareous springs. On the other hand, the distribution of C. inflata was linked to lowlands in silted environments, fine substrates, high concentrations of particulate organic matter, and low conductivity (35 to 70 µS/cm3), commonly in wetlands under the influence of the flood pulse, as in the Pantanal. Recent studies carried out on rivers in the Amazon hydrographic basin have shown that the shape of the shell in the Hyriini is largely associated with drainage characteristics [69].
Our morphometric data showed a variation of biometric characters (length, width, and height) from each nominal species. However, some points overlapped, reflecting a phenotypic gradient. In the upper Paraguay basin, there have been reports of the occurrence of two distinct species identified as C. ambigua and C. inflata using only conchological traits [64]. However, visual differentiation is not always effective because the shell shape is subject to marked phenotypic plasticity [25,70].

4.2. Molecular and Phylogenetic Analyses

Our field collections of Castalia species in the upper Paraguay basin revealed individuals in Baixo Stream in the uplands whose appearance was intermediate between the classical morphologies of C. ambigua and C. inflata. Hence, we screened genetic markers to characterize their molecular genetic and phylogenetic affinities. Genetic identification of tropical freshwater mussels has been approached through the amplification and sequencing of the cytochrome oxidase I (COI) gene of mitochondrial DNA and the 28S nuclear rDNA gene [71]. Because few genetic markers have been established for tropical freshwater mussels, we screened variation at three additional genes (mitochondrial 16S rRNA, nuclear 18S rRNA-ITS, and histone H3) that are sufficiently well conserved across a range of taxa that primers proving useful for PCR amplification are available.
Our morphological and mitochondrial results supported neither reproductive isolation nor reciprocal monophyly among C. ambigua and C. inflata at the upland Baixo Stream site. To explain the results, we note the occurrence of shell plasticity in unionids; the tendency for shell morphology to vary from compressed in headwaters to inflated downstream, sometimes with tubercles, has been noted in many freshwater mussel species. Reviewing the literature of his time, Ortmann [25] noted numerous examples in his own and colleagues’ work. Subsequent work [reviewed by Reference 70] showed this ecotypic pattern within the tribes Pleurobemeni (genera Fusconaia, Pleurobema, and Pleuronaia), Quadrulini (Cyclonaias, Quadrula), Lampsilini (Actinainais ligamentina, Epioblasma torulosa, Dromus, and Obovaria), and Amblemini (Ambema plicata). Using 103 amplified fragment length polymorphism (AFLP) markers, Zieritz et al. [72] showed that morphological differences in shell morphology in Unio pictorum were the result of phenotypic plasticity, and did not reflect genetic differentiation. Shell convexity in the freshwater pearl mussel Margaretifera margaretifera may be affected by thermal effects [73], suggesting that the thermal regimes in colder upland and warmer lowland sites could have affected the morphologies of mussel populations that we studied. Failure to account for shell plasticity in unionoids has resulted in the description of species or subspecies that are not supported by molecular phylogenetic analyses. Inoue et al. [74] showed that morphological differences between Obovaria jacksoniana and Villosa arkansasensis were due to ecophenotypic plasticity and suggested that these species were synonymous. Morphological plasticity is such that the four recognized Unio species in France actually include three or five valid species [75]. Our results suggest that Castalia ambigua and C. inflata within the upper Paraguay River drainage are not phylogenetically distinct, constituting a case of ecotypic variation within one lineage. Further testing of the hypothesis that these nominal species are valid would require analysis of populations across the geographic extent of the ranges of the nominal species.
Analyses of our DNA sequencing results for mitochondrial COI, 16s rRNA, and combined sequences showed phylogenetic differentiation among C. ambigua from the Paraguay and Amazon basins. We interpret the shared ancestry and subsequent differentiation as a consequence of the geological history of the region. Prior to the Miocene, a paleo-Amazon-Orinoco drainage originating in Chile and Argentina drained northward to the Caribbean Sea. The modern watershed divide between the Paraguay and Amazon systems arose approximately 30 million years ago with the initiation of tectonic activity, driving the diversification not only of fishes [76] but presumably also freshwater mussels.

4.3. Conclusions and Prospects

After examining phenotypic and genetic variation in Castalia ambigua and C. inflata in the upper Paraguay River basin, the results of our phylogenetic analyses are most consistent with the hypothesis of nominal species belonging to one evolutionary lineage. The phenotypic variation that we observed in the upper Paraguay system is consistent with the tendency of shell morphologies to vary from headwaters to lowland areas, which has long been recognized in North American freshwater mussels and may also apply to South American mussels. Supporting this interpretation, we noted a strong phylogenetic distinction among C. ambigua between the Paraguay and Amazon basins, which may be indicative of species-based differences. Broad-scale phylogeographic examination including examination of type specimens will inform defensible delineation of Castalia species and members of other lineages within the South American freshwater mussel fauna.

Author Contributions

Conceptualization, C.C. and E.H.; methodology, C.C., E.H., and J.J.; software, M.O.-H. and J.J.; validation, C.C., M.C.M., E.H., and J.J.; formal analysis, M.O.-H. and J.J.; investigation, E.H., M.O.-H., B.V.; resources, R.S., G.d.C.S.N., M.C.M. and P.M.; writing—review and editing, M.O.-H., E.H., R.S., J.J., G.d.C.S.N., M.C.M., and C.C.; visualization, M.O.-H., J.J., G.d.C.S.N.; supervision, C.C. and E.H.; project administration, E.H. and C.C.; funding acquisition, C.C. and E.H. All authors have read and agreed to the published version of the manuscript.

Funding

This research was supported by the Universidade Federal de Mato Grosso, Pro Reitoria de Pesquisa, CNPq Process number 400357/2014-3, PVE/CNPq Process no. 400357/2014-3, FAPEMAT Process no. 751046/2011, and 2011 and SECRI/UFMT Apoio a Pesquisador Visitante Internacional 2014.

Acknowledgments

The authors would like to thank Aruã Callil for shell pictures and Vinicius C. Costa Soares for laboratory support. Murray Hyde assisted in the molecular genetics laboratory and data analysis.

Conflicts of Interest

The authors declare no conflict of interest.

References

  1. Mansur, M.C.D.; Pereira, D.; Bergonci, P.E.A.; Pimpão, D.M.; Barradas, J.R.S.; Sabaj, M.H. Morphological assessment of Rheodreissena (Bivalvia: Veneroida: Dreissenidae) with an updated diagnosis of the genus, descriptions of two new species, redescription of R. lopesi, and the first account of larval brooding in New World dreissenids. Proc. Acad. Nat. Sci. Phila. 2019, 166, 1–45. [Google Scholar] [CrossRef]
  2. Jaeckel, S.G.A. Die mollusken Sudamerikas. In Biogeography and Ecology in South America; Fittkau, E.J., Illiea, J., Klinge, H., Schwabe, G.H., Sioli, H., Eds.; Dr. W. Junk n. v. Publishers: The Hague, The Netherlands, 1969; Volume 2, pp. 794–827. [Google Scholar]
  3. Pereira, D.; Mansur, M.C.D.; Duarte, L.D.S.; de Oliveira, A.S.; Pimpao, D.M.; Callil, C.T.; Ituarte, C.; Parada, E.; Peredo, S.; Darrigan, G.; et al. Bivalve distribution in hydrographic regions in South America: Historical overview and conservation. Hydrobiologia 2014, 735, 15–44. [Google Scholar] [CrossRef]
  4. Torres, S.; Cao, L.; Gregoric, D.E.G.; de Lucía, M.; Brea, F.; Darrigran, G. Distribution of the Unionida (Bivalvia, Paleoheterodonta) from Argentina and its conservation in the southern Neotropical region. PLoS ONE 2018, 13, e0203616. [Google Scholar] [CrossRef] [PubMed] [Green Version]
  5. Bonetto, A.A. Notas Sobre los Generos Castalina y Castalia en el Paraná Médio e Inferior; Direccion General de Recursos Naturales, Ministerio de Agricultura e Ganaderia: Santa Fé, Brazil, 1961. [Google Scholar]
  6. Vale, R.S.; Beasley, C.R.; Tagliaro, C.H.; Mansur, M.C.D. The glochidium and marsupium of Castalia ambigua ambigua Lamarck, 1819, from northern Brazil. Am. Malacol. Bull. 2005, 20, 43–48. [Google Scholar]
  7. Mansur, M.C.D. Lista dos Moluscos bivalves das famílias Hyriidae e Mycetopodidae para o estado do Rio Grande do Sul. Iheringia Série Zool. 1970, 39, 33–95. [Google Scholar]
  8. Graf, D.L.; Cummings, K.S. MUSSELp: The Mussel Project Website. 2015. Available online: http://mussel-project.uwsp.edu/ (accessed on 9 October 2018).
  9. D’Orbigny, A. Voyage dans L’Amerique Méridionale. Tome Cinquéme, 3a Partie: Molusques; P Bertrand: Paris, France, 1843. [Google Scholar]
  10. Ortmann, A.E. South American naiads: A contribution to the knowledge of the freshwater mussels of South America. Mem. Carnegie Mus. 1921, 8, 415–670. [Google Scholar]
  11. Bonetto, A.A. Las almejas sudamericanas de la Tribu Castaliini. Physis 1965, 25, 187–196. [Google Scholar]
  12. Rumi, A.; Gregoric, D.E.G.; Nunez, V.; Darrigan, G.A. Malacología Latinoamericana: Moluscos de agua dulce de Argentina. Rev. Biol. Trop. 2008, 56, 77–111. [Google Scholar] [CrossRef] [Green Version]
  13. Figueiras, A. La malacofauna dulceacuícola del Uruguay (Parte II). Commun. Soc. Malacol. Urug. 1965, 1, 223–270. [Google Scholar]
  14. Schade, F.H. Lista de los moluscos del Guaira (Villarrica—Paraguay) conocidos hasta el presente. Commun. Soc. Malacol. Urug. 1965, 1, 209–221. [Google Scholar]
  15. Simone, L.R.L. Land and Freshwater Molluscs of Brazil: An Illustrated Inventory of the Brazilian Malacofauna, Including Neighboring Regions of South America, Respect to the Terrestrial and Freshwater Ecosystems; FAPESP (Sao Paulo Research Foundation): Sao Paulo, Brazil, 2006. [Google Scholar]
  16. Graf, D.L.; Cummings, K.S. Review of the systematics and global diversity of freshwater mussel species (Bivalvia: Unionoida). J. Molluscan Stud. 2007, 73, 291–314. [Google Scholar] [CrossRef] [Green Version]
  17. Bogan, A.E. Mollusca-Bivalvia Checklist. Freshwater Animal Biodiversity Project. 2010. Available online: http://fada.biodiversity.be/CheckLists/Mollusca-Bivalvia.pdf (accessed on 9 October 2018).
  18. Haas, F. Superfamilia Unionacea. Das Tierreich 1969, 88, 1–663. [Google Scholar]
  19. Quintana, M.G. Catologo preliminar de la malacofauna del Paraguay. Rev. Mus. Argent. Cienc. Nat. Bernardino Rivadavia Cienc. Zool. 1982, 11, 61–158. [Google Scholar]
  20. Da Cruz Santos-Neto, G.; Beasley, C.R.; Schneider, H.; Pimpao, D.M.; Hoeh, W.R.; De Simone, L.R.L.; Tagliaro, C.H. Genetic relationships among freshwater mussel species from fifteen Amazonian rivers and inferences on the evolution of the Hyriidae (Mollusca: Bivalvia: Unionida). Mol. Phylogenet. Evol. 2016, 100, 148–159. [Google Scholar] [CrossRef]
  21. Ministerio de Agricultura y Ganaderia. Fauna Amenazada del Paraguay; Direccion de Parques Nacionales y Vida Silvestre, Fundacion Moises Bertoni: Asuncion, Paraguay, 1998. [Google Scholar]
  22. Colle, A.C.; Callil, C.T. Environmental influences on the composition and structure of the freshwater mussels in shallow lakes in the Cuiabá River floodplain. Braz. J. Biol. 2012, 72, 249–256. [Google Scholar] [CrossRef] [Green Version]
  23. Santos, R.C.L.; Callil, C.T.; Landeiro, V.L. Unraveling the effects of water–sediment conditions and spatial patterns on Unionida assemblages in seasonally connected floodplain lakes. Hydrobiologia 2020, 847, 2909–2922. [Google Scholar] [CrossRef]
  24. Junk, W.J.; Piedade, M.T.F.; Candotti, E. Água no Brasil: Excesso, escassez e problemas crescentes. Ciência Hoje 2014, 53, 52–53. [Google Scholar]
  25. Ortmann, A.E. Correlation of shape and station in fresh-water mussels (naiades). Proc. Am. Phil. Soc. 1920, 59, 268–312. [Google Scholar]
  26. Varis, O.; Tortajada, C.; Biswas, A.K. Management of Transboundary Rivers and Lakes; Springer: Berlin/Heidelberg, Germany, 2008; p. 271. [Google Scholar]
  27. Gotelli, N.; Ellison, A.M. Princípios de Estatística em Ecologia; Artmed: Porto Alegre, Brazil, 2010; 683p. [Google Scholar]
  28. R Core Team. R: A Language and Environment for Statistical Computing; R Foundation for Statistical Computing: Vienna, Austria, 2018; Available online: https://www.R-project.org (accessed on 28 November 2018).
  29. Tang, Y.; Horikoshi, M.; Li, W. Ggfortify: Unified interface to visualize statistical result of popular R packages. R J. 2016, 8, 478–489. [Google Scholar] [CrossRef] [Green Version]
  30. Naimo, T.S.; Damschen, E.D.; Rada, R.G.; Monroe, E.M. Nonlethal evaluations of the physiological health of unionid mussels: Methods for biopsy and glycogen analysis. J. N. Am. Bentholog. Soc. 1998, 17, 121–128. [Google Scholar] [CrossRef]
  31. Bonetto, A.A. Algunos Factores Ecologicos Vinculados a la Distribucion Geografica de las Nayades em el Rio Paraná y sus Afluentes; Dirección General de Recursos Naturales, Ministerio de Agricultura e Ganaderia: Santa Fé, Brazil, 1962. [Google Scholar]
  32. Serrano, M.A.; Tietbothl, R.S.; Mansur, M.C.D. Sobre a ocorrência de moluscos bivalvia no Pantanal de Mato Grosso, Brasil. Biociências 1998, 6, 131–144. [Google Scholar]
  33. Castillo, A.R.; Brasil, L.G.; Mansur, M.C.D.; Querol, E.; Querol, M.V.M.; Olivera, E.V. Moluscos bivalves da localidade de São Marcos, bacia do Médio rio Uruguai, Uruguaiana, Brasil. Biotemas 2007, 20, 73–79. [Google Scholar]
  34. Wantzen, K.M.; Callil, C.T.; Butakka, C.M.M. Benthic invertebrates of the Pantanal and its tributaries. In The Pantanal: Ecology, Biodiversity and Sustainable Management of a Large Neotropical Seasonal Wetland; Junk, W.J., Wantzen, K.M., da Cunha, C.N., da Silva, C.J., Eds.; Pensoft: Sofia, Bulgaria, 2011; pp. 127–141. [Google Scholar]
  35. Beasley, C.R. The impact of exploitation on freshwater mussel (Bivalvia: Hyriidae) in the Tocantins River Brazil. Stud. Neotrop. Fauna Environ. 2001, 36, 159–165. [Google Scholar] [CrossRef]
  36. Pimpao, D.M.; Rocha, M.S.; Fettuccia, D.C. Freshwater mussels of Catalão, confluence of Solimões and Negro rivers, state of Amazonas, Brazil. Check List 2008, 4, 395–400. [Google Scholar] [CrossRef] [Green Version]
  37. Pimpao, D.M.; Mansur, M.C.D. Chave pictórica para identificação dos bivalves do Rio Aripuanã, Amazonas, Brasil (Sphaeriidae, Hyriidae e Mycetopodidae). Biota Neotrop. 2009, 9, 1–8. [Google Scholar] [CrossRef]
  38. Folmer, O.; Black, M.; Hoeh, W.; Lutz, R.; Vrijnhoek, R. DNA primers for amplification of mitochondrial cytochrome c oxidase subunit I from diverse metazoan invertebrates. Mol. Mar. Biol. Biotechnol. 1994, 3, 294–299. [Google Scholar]
  39. Campbell, D.C.; Serb, J.M.; Buhay, J.E.; Roe, K.J.; Minton, R.L.; Lydeard, C. Phylogeny of North American amblemines (Bivalvia, Unionoida): Prodigious polyphyly proves pervasive across genera. Invert. Biol. 2005, 124, 131–164. [Google Scholar] [CrossRef]
  40. Walker, J.M.; Curole, J.P.; Wade, D.E.; Chapman, E.G.; Bogan, A.E.; Watters, G.T.; Hoeh, W.R. Taxonomic distribution and phylogenetic utility of gender-associated mitochondrial genomes in the Unionoida (Bivalvia). Malacologia 2006, 48, 265–282. [Google Scholar]
  41. Varela, E.S.; Beasley, C.R.; Schneider, H.; Sampaio, I.; Marquez-Silva, N.D.S.; Tagliaro, C.H. Molecular phylogeny of mangrove oysters (Crassostrea) from Brazil. J. Molluscan Stud. 2007, 73, 229–234. [Google Scholar] [CrossRef] [Green Version]
  42. Palumbi, S.; Martin, A.; Romano, S.; McMillian, W.O.; Stice, L.; Grabowski, G. The Simple Fool’s Guide to PCR; Privately published document compiled by S. Palumbi; Department of Zoology, University of Hawaii: Honolulu, HI, USA, 1991. [Google Scholar]
  43. Pleyte, K.A.; Duncan, S.D.; Phillips, R.B. Evolutionary relationships of the salmonid fish genus Salvelinus inferred from DNA sequences of the first internal transcribed spacer (ITS 1) of ribosomal DNA. Mol. Phylogenet. Evol. 1992, 1, 223–230. [Google Scholar] [CrossRef]
  44. Park, J.-K.; O’Foighil, D. Sphaeriid and corbiculid clams represent separate heterodont bivalve radiations into freshwater environments. Mol. Phylogenet. Evol. 2000, 14, 75–88. [Google Scholar] [CrossRef] [PubMed]
  45. Colgan, D.J.; McLaughlan, A.; Wilson, G.D.F.; Livingston, S.P.; Edgecombe, G.D.; Macaranas, J.; Cassis, G.; Gray, M.R. Histone H3 and U2 snRNA DNA sequences and arthropod molecular evolution. Aust. J. Zool. 1998, 46, 419–437. [Google Scholar] [CrossRef]
  46. Thompson, J.D.; Higgins, D.G.; Gibson, T.J. Clustal W: Improving the sensitivity of progressive multiple sequence alignment through sequence weighting, position-specific gap penalties and weight matrix choice. Nucleic Acids Res. 1994, 22, 4673–4680. [Google Scholar] [CrossRef] [PubMed] [Green Version]
  47. Löytynoja, A.; Goldman, N. webPRANK: A phylogeny-aware multiple sequence aligner with interactive alignment browser. BMC Bioinform. 2010, 11, 579. [Google Scholar] [CrossRef] [Green Version]
  48. Borschenius, F. FastGap 1.2. 2009. Available online: http://www.aubot.dk/FastGap_home.htm (accessed on 4 March 2020).
  49. Altschul, S.F.; Gish, W.; Miller, W.; Myers, E.W.; Lipman, D.J. Basic local alignment search tool. J. Mol. Biol. 1990, 215, 403–410. [Google Scholar] [CrossRef]
  50. Rozas, J.; Librado, P.; Sanchez-Delbarrio, J.C.; Messeguer, X.; Rozas, R. DnaSP; Version 5.10.00; Universita de Barcelona: Barcelona, Spain, 2009; Available online: http://www.ub.edu/dnasp/ (accessed on 6 March 2020).
  51. Leigh, J.W.; Bryant, D. POPART: Full-feature software for haplotype network construction. Meth. Ecol. Evol. 2015, 6, 1110–1116. [Google Scholar] [CrossRef]
  52. Clement, M.; Snell, Q.; Walker, P.; Posada, D.; Crandall, K. TCS: Estimating gene genealogies. Parallel Distrib. Process. Symp. Int. 2002, 2, 0184. [Google Scholar]
  53. Tanabe, A.S. Kakusan4 and Aminosan: Two programs for comparing nonpartitioned, proportional and separate models for combined molecular phylogenetic analyses of multilocus sequence data. Mol. Ecol. Resour. 2011, 11, 914–921. [Google Scholar] [CrossRef]
  54. Ronquist, F.; Teslenko, M.; Van der Mark, P.; Ayres, D.; Darling, A.; Hohna, S.; Larget, B.; Liu, L.; Suchard, M.A.; Huelsenbeck, J.P. MrBayes 3.2: Efficient Bayesian phylogenetic inference and model choice across a large model space. Syst. Biol. 2012, 61, 539–542. [Google Scholar] [CrossRef] [Green Version]
  55. Rambaut, A.; Suchard, M.A.; Xie, D.; Drummond, A.J. Tracer 1.6. 2014. Available online: http://beast.bio.ed.ac.k/tracer (accessed on 6 July 2020).
  56. Rambaut, A.; Suchard, M.A.; Xie, D.; Drummond, A.J. MCMC Trace Analysis Tool; Version 1.6.0; Institute of Evolutionary Biology, University of Edinburgh: Edinburg, Scotland, 2009; Available online: http://tree.bio.ed.ac.uk/software/tracer/ (accessed on 6 July 2020).
  57. Puillandre, N.; Lambert, A.; Brouillet, S.; Achaz, G. ABGD, automatic barcode gap discovery for primary species delimitation. Mol. Ecol. 2012, 21, 1864–1877. [Google Scholar] [CrossRef]
  58. Paradis, E.; Klaus, S.; Schwartz, R. Ape 5.0: An environment for modern phylogenetics and evolutionary analyses in R. Bioinformatics 2018, 1, 3. [Google Scholar] [CrossRef] [PubMed]
  59. Revell, L.J. Phytools: An R package for phylogenetic comparative biology (and other things). Meth. Ecol. Evol. 2012, 3, 217–223. [Google Scholar] [CrossRef]
  60. Cornuet, J.M.; Ravigne, V.; Estoup, A. Inference on population history and model checking using DNA sequence and microsatellite data with the software DIYABC (v1.0). BMC Bioinform. 2010, 11, 401. [Google Scholar] [CrossRef] [PubMed] [Green Version]
  61. Hasegawa, M.; Kishino, H.; Yano, T. Dating the human-ape split by a molecular clock of mitochondrial DNA. J. Mol. Evol. 1985, 22, 160–174. [Google Scholar] [CrossRef]
  62. Cornuet, J.M.; Santos, F.; Beaumont, M.A.; Robert, C.P.; Marin, J.M.; Baldong, D.J.; Guillemaud, T.; Estoup, A. Inferring population history with DIYABC: A user-friendly approach to approximate Bayesian computation. Bioinformatics 2008, 24, 2713–2719. [Google Scholar] [CrossRef] [Green Version]
  63. Bonetto, A.A. La Superfamília Unionacea en la cuenca Amazonica. In Atlas Simpósio Biota Amazônica 3: Limnologia; Lent, H., Ed.; CNPq: Rio de Janeiro, Brazil, 1967; pp. 63–82. [Google Scholar]
  64. Mansur, M.C.D.; Callil, C.T.; Aguiar, E.P.; Pedroso, L.M.G. Inventário dos Bivalves Límnicos do rio Cuiabá (MT, Brasil) Como Subsídio para o Reconhecimento da Integridade Ecológica; Relatório Final; Edital Fundação de Amparo a Pesquisa do Estado de Mato Grosso: Cuiaba, MT, Brazil, 2007. [Google Scholar]
  65. Rodriguez, F.J.L.; Oliver, J.L.; Marin, A.; Medina, J.R. The general stochastic model of nucleotide substitution. J. Theor. Biol. 1990, 142, 485–501. [Google Scholar] [CrossRef]
  66. Graf, D.L.; Ó Foighil, D. Molecular phylogenetic analysis of 28S rDNA supports a Gondwanan origin for Australasian Hyriidae (Mollusca: Bivalvia: Unionoida). Vie Milieu 2000, 50, 245–254. [Google Scholar]
  67. Callil, C.T.; Junk, W.J. Concentração e incorporação de mercúrio por moluscos bivalves Anodotites trapesialis (Lamarck, 1819) e Castalia ambigua (Lamarck, 1819) do Pantanal de Poconé—MT, Brasil. Biociências 1999, 72, 3–28. [Google Scholar]
  68. Mansur, M.C.D.; Valer, R.M. Moluscos bivalves do Rio Uraricoera e Rio Branco, Roraima, Brasil. Amazoniana 1992, 12, 85–100. [Google Scholar]
  69. Da Mata, L.S.; Tagliaro, C.H.; Simeone, D.; Robert, C. Shell shape variation in Amazonian freshwater mussels (Unionida: Hyriidae: Hyriini) Beasley. J. Molluscan Stud. 2019, 85, 212–223. [Google Scholar] [CrossRef]
  70. Haag, W.R. North American Freshwater Mussels: Natural History, Ecology and Conservation; Cambridge University Press: Cambridge, UK, 2012. [Google Scholar]
  71. Whelan, N.V.; Geneva, A.J.; Graf, D.L. Molecular phylogenetic analysis of tropical freshwater mussels (Mollusca: Bivalvia: Unionoida) resolves the position of Coelatura and supports a monophyletic Unionidae. Mol. Phylogenet. Evol. 2011, 61, 504–514. [Google Scholar] [CrossRef] [PubMed]
  72. Zieritz, A.; Hoffman, J.I.; Amos, W.; Aldridge, D.C. Phenotypic plasticity and genetic isolation-by-distance in the freshwater mussel Unio pictorum. Evol. Ecol. 2010, 24, 923–938. [Google Scholar] [CrossRef]
  73. Bolotov, I.N.; Makhrov, A.A.; Gofarov, M.Y.; Aksenova, O.V.; Aspholm, P.E.; Bespalaya, Y.V.; Kabakov, M.B.; Kolosova, Y.S.; Kondakov, A.V.; Ofenböck, T.; et al. Climate warming as a possible trigger of keystone mussel population decline in oligotrophic rivers at the continental scale. Sci. Rep. 2018, 8, 35. [Google Scholar] [CrossRef] [PubMed]
  74. Inoue, K.; Hayes, D.M.; Harris, J.L.; Christian, A.D. Phylogenetic and morphometric analyses reveal ecophenotypic plasticity in freshwater mussels Obovaria jacksoniana and Villosa arkansasensis (Bivalvia: Unionidae). Ecol. Evol. 2013, 3, 2670–2683. [Google Scholar] [CrossRef] [PubMed]
  75. Prie, V.; Puillandre, N. Molecular phylogeny, taxonomy, and distribution of French Unio species. Hydrobiologia 2014, 735, 95–110. [Google Scholar] [CrossRef]
  76. Lundberg, J.G.; Marshall, L.G.; Guerrero, B.H.; Malabarba, M.C.S.L.; Wesselingh, F. The stage for Neotropical fish diversification: A history of tropical South American rivers. In Phylogeny and Classification of Neotropical Fishes; Malabarba, L.R., Reis, R.E., Vari, R.P., Lucena, Z.M., Lucena, C.A.S., Eds.; Edipucrs: Porto Alegre, Brazil, 1998; pp. 13–48. [Google Scholar]
Figure 1. Locations of past and present studies of Castalia species. (A). Chronology of registered occurrences of Castalia ambigua Lamarck, 1819 and Castalia inflata d’Orbigny, 1835 in South America. Orange symbols denote C. ambigua and blue denote C. inflata. The Amazon basin is to the north, and the Paraguay basin to the south. References: Bonetto 1961 [5], Bonetto 1962 [31], Bonetto 1965 [11], Mansur 1970 [7], Serrano et al. 1998 [32], Castillo 2007 [33], Wantzen et al. 2011 [34], Colle and Callil [22], Beasley 2001 [35], Vale et al. 2005 [6], Rumi et al. 2008 [12], Pimpao et al. 2008 [36], and Pimpao and Mansur 2009 [37]. (B). Locations of occurrence and sample sites for Castalia ambigua Lamarck, 1819 (orange triangles) and Castalia inflata d’Orbigny, 1835 (blue dots) within the upper Paraguay River basin in this study. Red numerals indicate sample sites for molecular analysis: 1—Baixo Stream (both C. ambigua and C. inflata); 2—Valo Verde Lake; and 3—Claro River. Lack of shading indicates upland areas; gray shading indicates lowland areas.
Diversity 12 00481 g001aDiversity 12 00481 g001b
Figure 2. The two demographic scenarios tested for populations of C. ambigua in the Amazon River and Paraguay River basins of Brazil using DIYABC [59,60]. Each scenario assumes four extant populations at t0, where RB = Baixo Stream, BVV = Valo Verde Lake, RC = Claro Stream, and RA = Amazon River, populations, respectively, and that they diverged from each other at some point in the past. Divergence time-points t1 and t2 are displayed on right.
Diversity 12 00481 g002
Figure 3. Shell morphologies for representative C. inflata (A, top row), C. ambigua (B, middle row), and “C. ambigua-like” (C, bottom row). Bars indicate 1 cm.
Diversity 12 00481 g003
Figure 4. Ordination by principal coordinates analysis of biometrical variables of morphology designated as C. inflata (blue dots) and C. ambigua (orange dots) from the Upper Paraguay River Basin.
Diversity 12 00481 g004
Figure 5. Haplotype networks for mitochondrial COI for C. ambigua and C. inflata across the Paraguay and Amazon River basins, considered: (A). on a geographic basis, and (B). on a taxonomic basis. The relative sizes of the circles reflect the frequencies of the respective haplotypes. Hash marks indicate the number of inferred mutations among haplotypes observed. Black dots represent inferred intermediate haplotypes that were not observed in our data set. Haplotype designations include Cast for Castalia, COI for cytochrome oxidase, and a number for each unique DNA sequence.
Diversity 12 00481 g005
Figure 6. Haplotype networks for mitochondrial 16S rRNA for Castalia ambigua and C. inflata across the Paraguay and Amazon River basins, considered: (A). on a geographic basis, and (B). on a taxonomic basis. The relative sizes of the circles reflect the frequencies of the respective haplotypes. Hash marks indicate the number of inferred mutations among haplotypes observed. Black dots represent inferred intermediate haplotypes that were not observed in our data set. Haplotype designations include Cast for Castalia, 16S for 16S rRNA, and a number for each unique DNA sequence.
Diversity 12 00481 g006
Figure 7. Bayesian phylogenetic analysis showing the relationships among the COI sequence haplotypes (KY474356–KY474372) and other 4 sequences for C. ambigua (KU888238, KU888236, KU888240, and KU888242) obtained from Genbank. The outgroup was Triplodon corrugatus (KU888253). The alignment of these sequences resulted in 454-bp DNA sequence. The analysis was run for 600,000 generations to create a set of trees, of which 9002 were sampled. The Bayesian phylogenetic consensus tree had a final average standard deviation of split frequencies of 0.006727 and with a −ln likelihood of −1212.66 Branch lengths are proportional to inferred evolutionary distances. Numerals to the left of nodes indicate posterior probability support for the respective nodes. Designators for each DNA sequence include the location (RC—Claro Stream, BVV—Vale Verde Lake, RB—Baixo Stream). The distance bar is shown in units of substitutions per nucleotide site. ABGD on the right margin refers to species delimitations suggested by Automatic Barcode Gap Discovery [57].
Diversity 12 00481 g007
Figure 8. Bayesian phylogenetic analysis showing the relationships among the 16S rRNA haplotypes. In addition, seven individuals of C. ambigua (KU888207–KU888213) that were obtained from GenBank were included. The alignment of these sequences resulted in 308bp sequences. The analysis was run with a total of 500,000 generations, the final average standard deviation of split frequencies was 0.004356 with a −ln likelihood of −822.58. a total of 7501 trees were sampled. Branch lengths are proportional to inferred evolutionary distances. Numerals to the left of nodes indicate posterior probability support for the respective nodes. Designators for each DNA sequence include the location (RC—Claro Stream, BVV—Vale Verde Lake, RB—Baixo Stream). The distance bar is shown in units of substitutions per nucleotide site. ABGD on the right margin refers to species delimitations suggested by Automatic Barcode Gap Discovery [57].
Diversity 12 00481 g008
Figure 9. Bayesian phylogenetic analysis showing the relationships among individual mussels inferred from the combined mitochondrial COI and 16S rRNA DNA sequences (762 base-pairs) for C. ambigua, C. ambigua-like, C. inflata, and outgroup reference sequence for Triplodon corrugatus (KU888253). The analysis was run for 1.5 million generations to create a set of trees, of which 22,502 were sampled. The Bayesian phylogenetic consensus tree had a final average standard deviation of split frequencies of 0.002664 and with a −ln likelihood of −2122.95. Branch lengths are proportional to inferred evolutionary distances. Numerals to the left of nodes indicate posterior probability support for the respective nodes. Designators for each DNA sequence include the location (RC—Claro Stream, BVV—Vale Verde Lake, RB—Baixo Stream). The distance bar is shown in units of substitutions per nucleotide site. ABGD on the right margin refers to species delimitations suggested by Automatic Barcode Gap Discovery [57].
Diversity 12 00481 g009
Figure 10. Bayesian phylogenic analysis showing the relationships among our one 18S ITS haplotype sequence (KY463466) and other sequences for Castalia ambigua (KU888178, KU888179, KU888180, KU888182, and KU888181) obtained from Genbank. The outgroups were Castalia stevensi (KU888184) and Callonaia duprei (KU888175). The alignment of these sequences resulted in 515bp sequences. The analysis was run for 500,000 generations to create a set of trees, of which 2178 were sampled. The Bayesian phylogenetic consensus tree had a final average standard deviation of split frequencies of 0.005394 and with a −ln likelihood of −846.10. Branch lengths are proportional to inferred evolutionary distances. Numerals to the left of nodes indicate posterior probability support for the respective nodes. The distance bar is shown in units of substitutions per nucleotide site. ABGD on the right margin refers to species delimitations suggested by Automatic Barcode Gap Discovery [57].
Diversity 12 00481 g010
Table 1. Collection sites for Castalia specimens in the upper Paraguay river basin; “x” denotes the occurrence of specimens expressing the phenotype of that species.
Lake or RiverLatitudeLongitudeCastalia inflata d’Orbigny, 1835Castalia ambigua Lamarck, 1819Occurrence
1Cuiabazinho River14°32′35.48″ S55°50′53.49″ W-xHighlands
2Cuiabazinho River14°39′46.63″ S55°52′45.30″ W-xHighlands
3APM Manso14°52′16.89″ S55°47′31.27″ W-xHighlands
4Baixo Stream14°40′46.39″ S56°14′9.72″ WxxHighlands
5Cuiabá River14°49′59.78″ S56°17′53.34″ W-xHighlands
6Cuiabá River15°34′08.25″ S56°08′23.02″ Wx-Lowlands
7Valo Verde oxbow lake15°49′20.36″ S 56° 7′43.59″ Wx-Lowlands
8Cuiabá River15°52′26.66″ S56° 4′25.09″ Wx Lowlands
9Poço oxbow lake15°54′06.73″ S56°01′17.20″ Wx-Lowlands
10Paraguay River16°05′08.60″ S57°42′18.65″ Wx-Lowlands
11Corixo das Conchas oxbow lake16°28′6.075″ S55°55′49.837″ Wx-Lowlands
12Coqueiro oxbow lake16°23′19.11″ S56°18′00.57″ Wx-Lowlands
13Jacaré (Ninhal) oxbow lake16°14′08.89″ S55°59′37.10″ Wx-Lowlands
14Bento Gomes River16°19′13.49″ S56°32′36.21″ Wx-Lowlands
15Pombas oxbow lake16°26′54.07″ S55°56′45.30″ Wx-Lowlands
16Conchas oxbow lake16°27′18.80″ S55°55′46.40″ Wx-Lowlands
17Serragem oxbow lake16°29′14.80″ S56°06′31.30″ Wx-Lowlands
18Barco Velho oxbow lake16°29′18.00″ S56°11′13.15″ Wx-Lowlands
19Cuiabá River16°32′36.45″ S56°22′20.90″ Wx-Lowlands
20Oxbow lakes16°32′49.20″ S56°18′12.00″ Wx-Lowlands
21Claro Stream16°36′21.84″ S56°43′31.67″ Wx-Lowlands
22Santa Rosa oxbow lake16°40′33.20″ S56°27′45.30″ Wx-Lowlands
23Descalvado oxbow lake16°44′00.29″ S57°44′55.67″ Wx-Lowlands
Table 2. PCR primers used for amplification of genetic markers screened in this study.
Gene, Primer Primer NamePrimer Sequence (5′ to 3′)Reference
COI FLCO1490GGT CAA CAA ATC ATA AAG ATA TTG G[38]
COI FCOIFGTT CCA CAA ATC ATA AGG ATA TTG G[39]
COI RHCO700dy2 TCA GGG TGA CCA AAA AAY CA[40]
16S F16SL1987GCC TCG CCT GTT TAC CAA AAA C[41]
16S R16Sbr-HCCG GTC TGA ACT CAG ATC ACG[42]
18S ITS FITS1AAAA AAG CTT TTG TAC ACA CCG CCC GTC[43]
18S ITS RITS1BAGC TTG CTG CGT TCT TCA TCG A[43]
28S FD23FGAG AGT TCA AGA GTA CGT G[44]
28S RD4RBTGT TAG ACT CCT TGG TCC GTG T[44]
H3 FH3FATG GCT CGT ACC AAG CAG ACV GC[45]
H3 RH3RATA TCC TTR GGC ATR ATR GTG AC[45]
Table 3. Scenario 2 prior distributions of parameters and median posterior parameter values for populations of C. ambigua in the Amazon River and Paraguay River basins, Brazil.
River
Population
ParameterPrior DistributionsPosterior Distributions
Min.Max.DistributionMedian95% Credible Interval
Baixo StreamNe1050,000Uniform7660188031,200
Valo Verde LakeNe1050,000Uniform4020113015,900
Claro StreamNe1050,000Uniform28,80010,40047,100
Amazon RiverNe1050,000Uniform32,60013,50048,100
AncestralNe10100,000Uniform77,80037,70098,000
T1 (generations)1020,000Uniform12903666080
T2 (generations)1000100,000Uniform724028309750
Mutation rate (µ)1 × 10−81 × 10−6Uniform6.64 × 10−73.64 × 10−79.5 × 10−7
Table 4. Haplotypes for Castalia sp. at the mitochondrial cytochrome oxidase I (COI) gene. Haplotypes Cast_COI_01 through 17 are original data from the Paraguay River basin; C. ambigua 1 through 8 are from the Amazon River basin and were collected by da Cruz Santos-Neto et al. [20]. Numbers refer to nucleotide position.
25283134404749515255616467707385118139148154163169172
Cast COI 01GGAAGCTGGACAAGGAGGGTGAG
Cast COI 02............G..........
Cast COI 03............G..........
Cast COI 04............G..........
Cast COI 05............G..........
Cast COI 06............GA.........
Cast COI 07............GA.........
Cast COI 08............GA.........
Cast COI 09............GA.........
Cast COI 10.......A....GA.....A...
Cast COI 11....A.......GA.........
Cast COI 12............G..........
Cast COI 13............GA.........
Cast COI 14............G.........A
Cast COI 15............G..........
Cast COI 16............G..........
Cast COI 17........A...G..........
Castalia ambigua 1A.GG.....GG.G.......AG.
Castalia ambigua 2A.GG.....GG.G.......AG.
Castalia ambigua 3A.GG.....GG.G.......AG.
Castalia ambigua 4A.GG.....GG.G.......AG.
Castalia ambigua 5..G......GGGG..G.A..AG.
Castalia ambigua 6..G......GGGG..G.A..AG.
Castalia ambigua 7.T.G.TA..GGG.AA.AAA..G.
Castalia ambigua 8.T.G.TA..GGG.AA.AAA..G.
181187192193199211229253259260262265268278289295310316320328335337361
Cast COI 01AGCTTTGGATAAGGAGGTTTGTG
Cast COI 02.......................
Cast COI 03.......................
Cast COI 04.......................
Cast COI 05.............A.........
Cast COI 06.A.......C.G.......C...
Cast COI 07.A.......C.G.......C...
Cast COI 08.A.......C.G.......C...
Cast COI 09GA.......C.G.......C...
Cast COI 10.A.......C.G.......C...
Cast COI 11.A.......C.G.......C...
Cast COI 12..T....................
Cast COI 13.A.........G.A.........
Cast COI 14.A.......C.G.......C...
Cast COI 15.......................
Cast COI 16.......................
Cast COI 17.......................
Castalia ambigua 1......A...G.A.TA.C..T.A
Castalia ambigua 2......A...G.A.TA.C..T.A
Castalia ambigua 3......A...G.A.TA.C..TCA
Castalia ambigua 4......A...G.A.TA.C..TCA
Castalia ambigua 5....C.......A.TA.AC..CA
Castalia ambigua 6....C.......A.TA.AC..CA
Castalia ambigua 7...C.A.AG.G...T.A......
Castalia ambigua 8...C.A.AG.G...T.A......
376379388397406424430442451457463467491535C. ambiguaC. inflataC. ambigua-likeRio BaixoBaia Valo VerdeRio ClaroRio AmazonasAccession Number
Cast COI 01GTAAGCTTGGAAGT 1 1 KY474356
Cast COI 02.............. 23 518 KY474357
Cast COI 03.......C......18 135 KY474358
Cast COI 04.......C....A. 1 1 KY474359
Cast COI 05.......C......66416 KY474360
Cast COI 06.......C......41 5 KY474361
Cast COI 07.......C.....G2 13 KY474362
Cast COI 08.......C.A....1 1 KY474363
Cast COI 09.......C......1 1 KY474364
Cast COI 10.......C......1 1 KY474365
Cast COI 11.......C......2 24 KY474366
Cast COI 12.......C...... 11 KY474367
Cast COI 13.......C......1 1 KY474368
Cast COI 14.............. 1 1 KY474369
Cast COI 15A..G...C...... 1 1 KY474370
Cast COI 16A......C...... 1 1 KY474371
Cast COI 17.......C...... 1 1 KY474372
Castalia ambigua 1AC.G.TC.....--1 1 KU888236
Castalia ambigua 2AC.G.TC.....--1 1 KU888237
Castalia ambigua 3AC...TC.....--1 1 KU888238
Castalia ambigua 4AC...TC.....--1 1 KU888239
Castalia ambigua 5ACG..TG..T.G--1 1 KU888240
Castalia ambigua 6ACG..TG..T.G--1 1 KU888241
Castalia ambigua 7A...AT..ATG.--1 1 KU888242
Castalia ambigua 8A...AT..ATG.--1 1 KU888243
Table 5. Variation at the mitochondrial COI region for Castalia species among three sites in the upper Paraguay River basin and one site in the upper Amazon basin of Brazil.
SpeciesCollection AreanNumber of HaplotypesAverage Number of Nucleotide Differences (k)Haplotype Diversity (h)Nucleotide Diversity (π)
C. ambiguaBaixo Stream 1993.810.8650.007
C. inflataBaixo Stream 721.710.2860.003
C. ambigua-likeBaixo Stream 844.180.7500.008
C. inflataValo Verde Lake1040.930.7110.002
C. inflataClaro Stream 2761.090.5360.002
C. ambiguaAmazon River8418.290.8570.040
Table 6. Haplotypes for Castalia species at the mitochondrial 16S rRNA gene. Haplotypes Cast_16S_01 through 9 are original data for samples from the upper Paraguay River basin; C. ambigua 1 through 7 are from samples from the upper Amazon River basin [20]. Numbers refer to nucleotide position.
353683879298111119124125138149176184186191197200206211214217246258262263
Cast 16S 1AACTCACCCCGCGTATTTACTATTCC
Cast 16S 2..........................
Cast 16S 3............A.............
Cast 16S 4..........................
Cast 16S 5..............G...........
Cast 16S 6........................T.
Cast 16S 7..T.......................
Cast 16S 8..........................
Cast 16S 9...............C..........
C. ambigua 1CT.....T...T.C..C.C.C...T.
C. ambigua 2T......T...T.C..C.C.C...T.
C. ambigua 3.......T...T.C..CCC.C...T.
C. ambigua 4.......T.T.T.C..C.C.C...T.
C. ambigua 5T......T...T....C..T....T.
C. ambigua 6C......T...T....C..T....T.
C. ambigua 7TT.CAGT.T.AT.C..C...CGCCAT
265269273276280291292336390400413428C. ambiguaC. inflataC. ambigua-likeRio BaixoBaia Valo VerdeRio ClaroRio AmazonasAccession number
Cast 16S 1AGTCTTGCCTTG 7 61 KY463457
Cast 16S 2.........C..1830732320 KY463458
Cast 16S 3.......TTC.. 1 1 KY463459
Cast 16S 4.........C.T1 1 KY463460
Cast 16S 5.........C.. 11 KY463461
Cast 16S 6.........CC. 2 2 KY463462
Cast 16S 7.......T.C.. 1 1 KY463463
Cast 16S 8......A..C.. 1 1 KY463464
Cast 16S 9.........C.. 1 1 KY463465
C. ambigua 1C..ACC.A----1 1KU888207
C. ambigua 2C..ACC.A----1 1KU888208
C. ambigua 3C..ACC.T----1 1KU888209
C. ambigua 4C..ACC.T----1 1KU888210
C. ambigua 5C.CAC..A----1 1KU888211
C. ambigua 6C.CAC..A----1 1KU888212
C. ambigua 7CACTCC.A----1 1KU888213
Table 7. Variation at the mitochondrial 16S region for Castalia species among three sites in the upper Paraguay River basin (original data) and the upper Amazon River basin of Brazil [20].
SpeciesCollection AreanNumber of HaplotypesAverage Number of Nucleotide Differences (k)Haplotype Diversity (h)Nucleotide Diversity (π)
C. ambiguaBaixo Stream 1920.1050.1050.0002
C. inflataBaixo Stream710.0000.0000.0000
C. ambigua-likeBaixo Stream820.2500.2500.0006
C. inflataValo Verde Lake1031.1330.6000.0026
C. inflataClaro Stream2660.6800.4120.0015
C. ambiguaAmazon River779.3331.0000.0308
Publisher’s Note: MDPI stays neutral with regard to jurisdictional claims in published maps and institutional affiliations.

