Article

Diversity and Distribution of the Dominant Ant Genus Anonychomyrma (Hymenoptera: Formicidae) in the Australian Wet Tropics

1
Centre for Tropical Environmental and Sustainability Science, College of Science and Engineering, James Cook University, Townsville, QLD 4811, Australia
2
Department of Wildlife Ecology and Conservation, University of Florida, Gainesville, FL 32611, USA
3
Research Institute for the Environment and Livelihoods, Charles Darwin University, Darwin, NT 0909, Australia
*
Author to whom correspondence should be addressed.
Diversity 2020, 12(12), 474; https://doi.org/10.3390/d12120474
Submission received: 18 November 2020 / Revised: 6 December 2020 / Accepted: 7 December 2020 / Published: 14 December 2020
(This article belongs to the Special Issue Diversity, Biogeography and Community Ecology of Ants)

Abstract

:
Anonychomyrma is a dolichoderine ant genus of cool-temperate Gondwanan origin with a current distribution that extends from the north of southern Australia into the Australasian tropics. Despite its abundance and ecological dominance, little is known of its species diversity and distribution throughout its range. Here, we describe the diversity and distribution of Anonychomyrma in the Australian Wet Tropics bioregion, where only two of the many putative species are described. We hypothesise that the genus in tropical Australia retains a preference for cool wet rainforests reminiscent of the Gondwanan forests that once dominated Australia, but now only exist in upland habitats of the Wet Tropics. Our study was based on extensive recent surveys across five subregions and along elevation and vertical (arboreal) gradients. We integrated genetic (CO1) data with morphology to recognise 22 species among our samples, 20 of which appeared to be undescribed. As predicted, diversity and endemism were concentrated in uplands above 900 m a.s.l. Distribution modelling of the nine commonest species identified maximum temperature of the warmest month, rainfall seasonality, and rainfall of the wettest month as correlates of distributional patterns across subregions. Our study supported the notion that Anonychomyrma radiated from a southern temperate origin into the tropical zone, with a preference for areas of montane rainforest that were stably cool and wet over the late quaternary.

1. Introduction

The ubiquity, high species richness, and ecological dominance of ants make them model organisms for understanding spatial patterns of diversity and community assembly [1]. Ant distribution is tightly coupled to climate [2], so that an understanding of ant species distributions across climatic gradients provides clues as to how ectothermic species coped with climatic conditions in the past and provides important insights into how they are likely to respond to a future climate.
Anonychomyrma Donisthorpe 1947 is an ecologically dominant ant genus in relatively cool and mesic habitats of Australia and New Guinea, extending northwest into Southeast Asia and east to the Solomon Islands [3]. The genus contains 27 described species and 5 subspecies, with most of these from New Guinea [4,5]. The genus is a member of an Australian dolichoderine subgroup that is thought to be of Gondwanan origin and that most likely originated in Australia approximately 30 million years ago from an ancestor shared with southern South America through a land connection via Antarctica [6]. Anonychomyrma is particularly common in heathlands, woodlands, and open forests of temperate southern Australia ([7,8]; in both referenced articles, the genus is referred to as the nitidiceps group of Iridomyrmex) and in rainforest of subtropical and tropical mountains of Queensland and New Guinea [5,9,10]. Most species in drier habitats nest in the ground, whereas rainforest species appear to be primarily arboreal.
The Australian Wet Tropics (AWT) bioregion of northeastern Australia represents the largest remaining remnant of the Gondwanan mesothermal rainforests that once dominated Australia [11]. Two species of Anonychomyrma have been described from the region. One of these is Anonychomyrma gilberti (Forel) (Figure 1), a widely distributed species in the region where it is a dominant ant in the rainforest canopy [10,12]. The second species is Anonychomyrma malandana (Forel), which was described from Malanda on the Atherton Tablelands in 1915. Since its original description, we are aware of only one other publication documenting it, where it was commonly recorded on Mt. Windsor (Figure 2) and referred to as Anonychomyrma sp. D [9]. Despite just two described species, the AWT Anonychomyrma fauna is highly diverse, with [9] 15 species reported during ant surveys of just four of the thirteen upland subregions.
Both contemporary and historical factors drive the distribution and diversity of species and thereby, the geographic structure of biological communities [14,15]. The biogeography of the AWT is strongly driven by historic processes that occurred during climate fluctuations of the late quaternary (last ~18,000 years) when rainforests contracted and expanded several times [16,17,18,19]. As rainforests contracted to wetter uplands, many lowland species became locally extinct, leading to a substantial loss of species richness in the lowlands [20]. As a result, many vertebrate and invertebrate species that are endemic to the AWT are restricted to elevations above 300 m a.s.l. that have had historically stable climates and consistently supported rainforests throughout this period of high climatic fluctuations [21]. In addition, there is an older biogeographic barrier along the Black Mountain Corridor (BMC), just south of the Carbine uplands (Figure 2), that has possibly existed since the Pliocene more than 2.5 Ma ago [22] and did not support rainforest until ~8 ka ago [11,23]. There is evidence in multiple taxa of a phylogeographic break across the Black Mountain Corridor that structures phylogenetic diversity at interspecific as well as intraspecific levels [19,24,25], such that many species have either a northern or southern restricted distribution [24].
Biogeographic patterns in the region are also strongly influenced by contemporary climatic conditions at both regional and local scales. At a regional scale, seasonality of rainfall and temperature vary markedly among subregions [26]. Rainfall seasonality is negatively correlated with the abundance of birds in the AWT, with dry season severity creating bottlenecks in critical food resources such as insects, fruits, and nectar [26]. Similarly, there are marked seasonal fluctuations in the abundance of homopteran insects in the AWT [27], which, through their production of honeydew, provide a particularly important food resource for ants, including A. gilberti [28]. As such, honeydew-reliant ants, such as species of Anonychomyrma, might be expected to show strong biogeographic patterns in response to rainfall seasonality.
At a finer geographic scale, temperature and rainfall both vary markedly with elevation. Mean temperature in the AWT declines by approximately 1 °C per 200 m increase in elevation [29]. Elevations above 600–800 m a.s.l. receive year-round moisture via the orographic cloud layer that creates a misty and cool environment [30]. The orographic cloud layer has been linked to a significant change in ant species composition [9]. Finally, at a local scale, there are strong microclimatic gradients across vertical space from the ground to the canopy, a general feature of rainforest environments globally [31]. A recent study of ant distributions (including nine species of Anonychomyrma) in the AWT found a strong positive correlation between vertical niche breadth, and therefore exposure to microclimatic variation, and elevation range size [32], indicating that vertical microhabitat associations of ants influence climatic niches and distributional patterns along elevation gradients.
Here, we used extensive collections from five mountain ranges to document the AWT Anonychomyrma fauna and to investigate patterns of species diversity and distributions across latitude, elevation, and vertical habitat space. Like many other dolichoderine genera [3], Anonychomyrma is morphologically conservative and therefore taxonomically challenging, so we used an integrated taxonomic approach that included CO1 gene barcoding [33] to inform species boundaries. We identified the key climatic drivers of species distributions and employed species distribution modelling based on climatic niches to compare actual with potential distributions and thus identified factors that may have shaped contemporary subregional patterns of distribution. Specifically, we address the following questions:
  • How many species of Anonychomyrma can be recognised in the AWT?
  • How are the species distributed among subregions and along elevational and vertical gradients?
  • What are the patterns of species richness and endemism?
  • To what extent do species distributions correlate with contemporary climatic variables and reflect historical patterns of rainforest refugia?
We predicted that given the Gondwanan origin of Anonychomyrma and its prevalence in cool temperate Australia, most species will have montane distributions in the AWT, with high levels of diversity and endemism in the cool upland regions that have retained stable rainforest vegetation and climate conditions more reminiscent of the Gondwanan rainforest that once dominated the east coast of Australia [21]. This is the pattern for other faunal lineages of Gondwanan origin, such as Terrisswalkerius earthworms [24], rainforest possums [34], and myobatrachid frogs [35]. We also expect species distributions to be strongly influenced by the paleogeography of the AWT, with most species having restricted northern or southern distribution across the Black Mountain Corridor [23]. Finally, in addition to high temperature, we expected rainfall seasonality to be a key driver of species distributions.

2. Materials and Methods

2.1. Study Region

The Australian Wet Tropics bioregion is a World Heritage Area in far northeastern Australia covering approximately 36,000 km2 (20–15° S and 147–145° E) consisting of approximately 12,000 km2 of rainforest. Rainfall is highly seasonal, with 75–90% of the annual 2000–8000 mm rainfall occurring in the wet season between November and April. Elevations above 1000 m a.s.l. can also receive up to 66% of monthly water input from cloud stripping [30]. Rainforests of the AWT harbour a distinctive ant fauna that is highly disjunct from that of surrounding savanna [36,37]. The fauna has strong affinities with that of Indo-Malayan rainforests, containing many genera that are rainforest specialists and whose Australian distributions are restricted to North Queensland. The fauna notably lacks arid-adapted taxa, such as Iridomyrmex and Melophorus, that dominate ant communities of Australia’s open sclerophyll habitats [38]. Tropical rain forests are generally regarded as supporting the world’s richest ant faunas [39,40], but Australia’s rainforest ant fauna is relatively depauperate [36], in striking contrast to its exceptionally rich savanna fauna [41].

2.2. Ant Sampling

Collections of Anonychomyrma were assembled from three sources. The first was the study of [9], which was based on surveys at 26 of the long-term biodiversity monitoring sites established by Stephen E. Williams at James Cook University [35]. These sites were distributed across six subregions, covering the full latitudinal and elevational range of the AWT and representing approximately 94% of the available environmental space in the region [34]. The subregions spanned approximately 500 km from north to south and sites were placed approximately every 200 m along the elevation gradient as follows: Finnegan (200, 500, 600, 800 m a.s.l.), Windsor (900, 1100, 1300 m a.s.l.), Carbine (100, 400, 600, 800, 1000, 1200 m a.s.l.), Lamb (700, 900, 1100 m a.s.l.), Atherton (200, 400, 600, 800, 1000 m a.s.l.), and Spec (350, 600, 800, 1000 m a.s.l.) (Figure 2). Sampling occurred within six plots at each site separated by a distance of 200 m; only three plots were located at each of the 350 m a.s.l. site at Spec and 100 m a.s.l. site at Atherton due to limited rainforest cover. Each site was sampled using a combination of pitfall trapping, litter extractions, and baiting (both on the ground and on trees at a height of 1.5 m). At Windsor, Carbine, Atherton, and Spec, sampling was conducted on three occasions from 2011 to 2013, covering two wet seasons (November–January) and one dry season (June–September). At Finnegan and Lamb, sampling occurred only during one wet season. The study also included ants collected in pitfall traps during previous beetle surveys at the Windsor, Carbine, Atherton, and Spec sites [42].
The second source was from [32], a study involving additional surveys at 15 of the above sites: Finnegan (200, 500, 700 m a.s.l.), Windsor (900, 1100, 1300 m a.s.l.), Carbine (100, 600, 1000, 1200 m a.s.l.), and Atherton (200, 400, 600, 800, 1000 m a.s.l.). At each of these sites, either two (1 site), three (4 sites), four (4 sites), or five (6 sites) trees were sampled, totalling 60 trees. Trees were at least 50 m apart and were chosen for surveying based on size and climbing accessibility. Trees were sampled using tuna bait traps and accessed using the single-rope climbing technique. At each tree, five bait traps were set on the ground and at every 3 m above ground to the maximum accessible height of the tree, which ranged from 15 to 27 m. Traps were set in the morning and collected 2–3 h later. Finnegan, Windsor, and Carbine were surveyed from October to December 2012 and Atherton was surveyed from December 2017 to February 2018.
The third source was data from additional surveys conducted in 2018–2019. Carbine sites were resampled in February 2018 using the same methodology as [32], and from June to October 2019, but with surveys during both day and night. At each site, five trees (at least 50 m apart) were surveyed once in the daytime and once at night. Day and night surveys of the same trees were not conducted sequentially and were at least a day apart to allow resumption of normal ant activity in the tree in case of disruption. Daytime surveys started at 10:00 h, night-time surveys started at 21:00 h, and baits were collected three hours later. Ants were also opportunistically hand collected immediately adjacent to baited vials. In addition, a collection was made over five days during the same period at the Daintree Rainforest Observatory (100 m a.s.l.) placing baited vials at 25–30 m height at ten trees (accessed by the canopy crane) for one hour and conducting one-hour hand searches on the ground.

2.3. Gene Barcoding

DNA was extracted from foreleg tissue and sequences were obtained for 97 specimens of Anonychomyrma collected during the study (Table S1). DNA extraction and CO1 sequencing were conducted through the Barcode of Life Data (BOLD) System (for extraction details, see http://ccdb.ca/resources). Each sequenced specimen was assigned a unique identification code that combined the batch within which it was processed and its number within the batch (e.g., ANONC006-20), and all specimens were labelled with their respective BOLD identification numbers in the ant collection held at the CSIRO Tropical Ecosystems Research Centre in Darwin.
DNA sequences were checked and edited in MEGA 7 [43]. Sequences were aligned using the UPGMB clustering method in MUSCLE [44], and translated into (invertebrate) proteins to check for stop codons and nuclear paralogues. The aligned sequences were trimmed accordingly, resulting in 657 base pairs. A sequence from the anceps complex of Iridomyrmex (sp. A, IRIDX092-18 from [45]) was used as an outgroup for rooting the gene tree. Tree inference by maximum likelihood was conducted through the IQTREE web server (http://iqtree.cibiv.univie.ac.at/; [46]) using ultrafast bootstrap approximation [47]. IQTREE has been shown to be a robust algorithm for tree inference that compares favourably with other methods [48]. Model selection was inferred using a 3-codon partition file and linked branch lengths with the AutoMRE ‘ModelFinder’ function to find the best-fit model for tree inference [49]. Trees were viewed and edited in FigTree v1.4.3 [50] and annotated using Photoshop CS5.1.

2.4. Species Delimitation

There is no specific level of CO1 divergence that can be used to define a species, but the level of CO1 variation within ant species is typically 1–3% [51]. However, some ant species can show substantially higher variation (for example, [51,52]), and in other cases two clear species can show no CO1 differentiation (for example, [53]). Some ant species from other genera are known to have workers that are virtually identical morphologically, and they can only be separated by detailed morphometric analysis or through reproductive castes [54]. When delimiting species, we focused on morphological differentiation between sister (i.e., most closely related) CO1 clades, considering all available samples from the same collections as sequenced specimens. A full set of voucher specimens of recognised species was held at the CSIRO Tropical Ecosystems Research Centre in Darwin and a duplicate set in the ant collection at James Cook University.

2.5. Patterns of Abundance, Diversity, and Endemism

We used the total number of records in survey plots including repeat surveys (n = 525 surveys) across all sites (n = 23) as a measure of abundance. Species were then ranked by abundance to document the species abundance pattern. We excluded the Daintree subregion from all analyses of diversity as there was only one site sampled. Anonychomyrma was not recorded from the Lamb subregion and these sites were also excluded from the analysis. To assess latitudinal diversity patterns, we assessed variation in species richness among subregions by plotting the mean number of species across sites per subregion along with the total number of surveys per subregion. We likewise plotted the number of subregion endemics per subregion. To assess elevation diversity patterns, we investigated differences in species richness among elevations by pooling across the five subregions and plotting the mean number of species across plots per elevation along with the total number of surveys per elevation. We tested for a correlation in the number of species with survey effort for both subregion diversity and elevation diversity using Pearson’s product-moment correlation test. To assess the vertical distributions (foraging activity from ground to canopy) of species, we considered only the vertical (arboreal) surveys conducted by [32]. We selected species for which there were two or more survey records and ten or more sample records (as there were 5 samples per vertical height band). For each of the resultant eight species, we plotted the number of sample records in a 3-m band divided by the total number of sample records for that species, to provide a relative proportion of occurrence in each 3-m band from ground to canopy.

2.6. Species Distribution Modelling

We used species distribution models as an exploratory tool to three purposes: first, to investigate the potential climatic drivers of species distributions; second, to identify potential additional areas of suitable habitat that were not sampled in this study; and third, to explore how species-predicted distributions correlate with historical patterns of rainforest refugia. We included the Daintree subregion in our species records and conducted distribution modelling over only the rainforest regions of the AWT (~12,000 km2) as we were interested in predicting the distribution of Anonychomyrma species within their primary habitat of rainforest vegetation. Species distribution models based on species occurrences and climatic data were derived using MaxEnt, a maximum entropy algorithm, in the program MaxEnt using default settings (version 3.4.1, [55]). We acknowledge that the use of default settings in MaxEnt may not lead to the optimal model in all cases, but given the exploratory purpose of modelling here, these settings were sufficient for our stated goals [56]. MaxEnt performs well in modelling species with small sample sizes if the ecological niche (e.g., environmental tolerance) of those species is sufficiently covered by sampling and they have small geographic ranges [57,58]. However, MaxEnt can perform poorly when species with small number of records are geographically widespread or have a wide environmental tolerance that is not sufficiently covered by sampling [59,60]. For example, [57] reported increasing model performance for species with increasing sample size, but that useful models are still produced for rare and narrow range species with 5–10 records, while [58] strongly emphasised that sample size is relevant to the total area over which modelling is being conducted. They found 14 records to be a minimum for species prevalence (fraction of raster cells occupied) of 0.1 over an area that encompassed most of tropical Africa, which is a far larger area than we model here [58]. To explore the issue of sample size, we first filtered species for ≥ 5 location points (not counting repeated surveys and counting a record in a survey plot as one occurrence/location point), which resulted in a subset of nine species. The number of location points ranged from 96 (A. gilberti) to 6 (sp. H). To investigate the relationship between sample size and sample coverage of ecological niche, we looked at how much of the available environmental space of the rainforest region of the AWT was covered by each species’ location points. We regressed mean annual temperature against mean annual precipitation to create the environmental space of all survey locations and plotted each species’ location points within that plot. Species with low (< 15) numbers of points were highly concentrated in environmental space, indicating that the number of location points sufficiently captured each species’ climatic niche volume (Figure S1). As such, our species with low samples sizes were very likely to have narrow environmental niches and therefore could be modelled with the number of location records available. However, we acknowledge that caution should still be applied in interpreting the models with <15 location points [61].
We used the accuCLIM climate variables derived by [62] that were based off a distributed network of microclimate loggers in the AWT and produced using a boosted regression tree approach that statistically downscaled existing coarse weather layers to fine-scale weather layers at 250 m2 resolution for the AWT region comparable with current best-practice climate layers (e.g., ANUCLIM, [63]). These layers are highly accurate in relation to regional topography and vegetation [62]. We clipped all climate variables to rainforest extent in the AWT. We selected nine of the seventeen climate variables that were most ecologically relevant [42,64,65,66]. We looked for collinearity in variables by looking at all pairwise interactions between continuous covariates using Pearson’s correlation coefficient. Variables with an R2 value of >0.7 were considered for removal [67]. Variance inflation factors were then calculated and any variables that had a value >10 were excluded from further analysis using the package usdm in R [68]. A final set of five variables was selected as follows: maximum temperature of the warmest month, temperature seasonality, rainfall of the wettest month, rainfall seasonality, and isothermality (an indicator of temperature variability: mean diurnal temperature range divided by annual temperature range; [62]). In MaxEnt, 10 replicates were used per species model with cross validation and 1000 iterations [69]. All models presented had values for the area under the receiver operating characteristic curve (AUC) greater than 0.9 and therefore performed adequately [70]. We then calculated summed habitat suitability for the rainforest extent by summing all nine species habitat suitability scores across all pixels and standardizing each pixel’s value to a summed habitat suitability score between 0 and 1.

3. Results

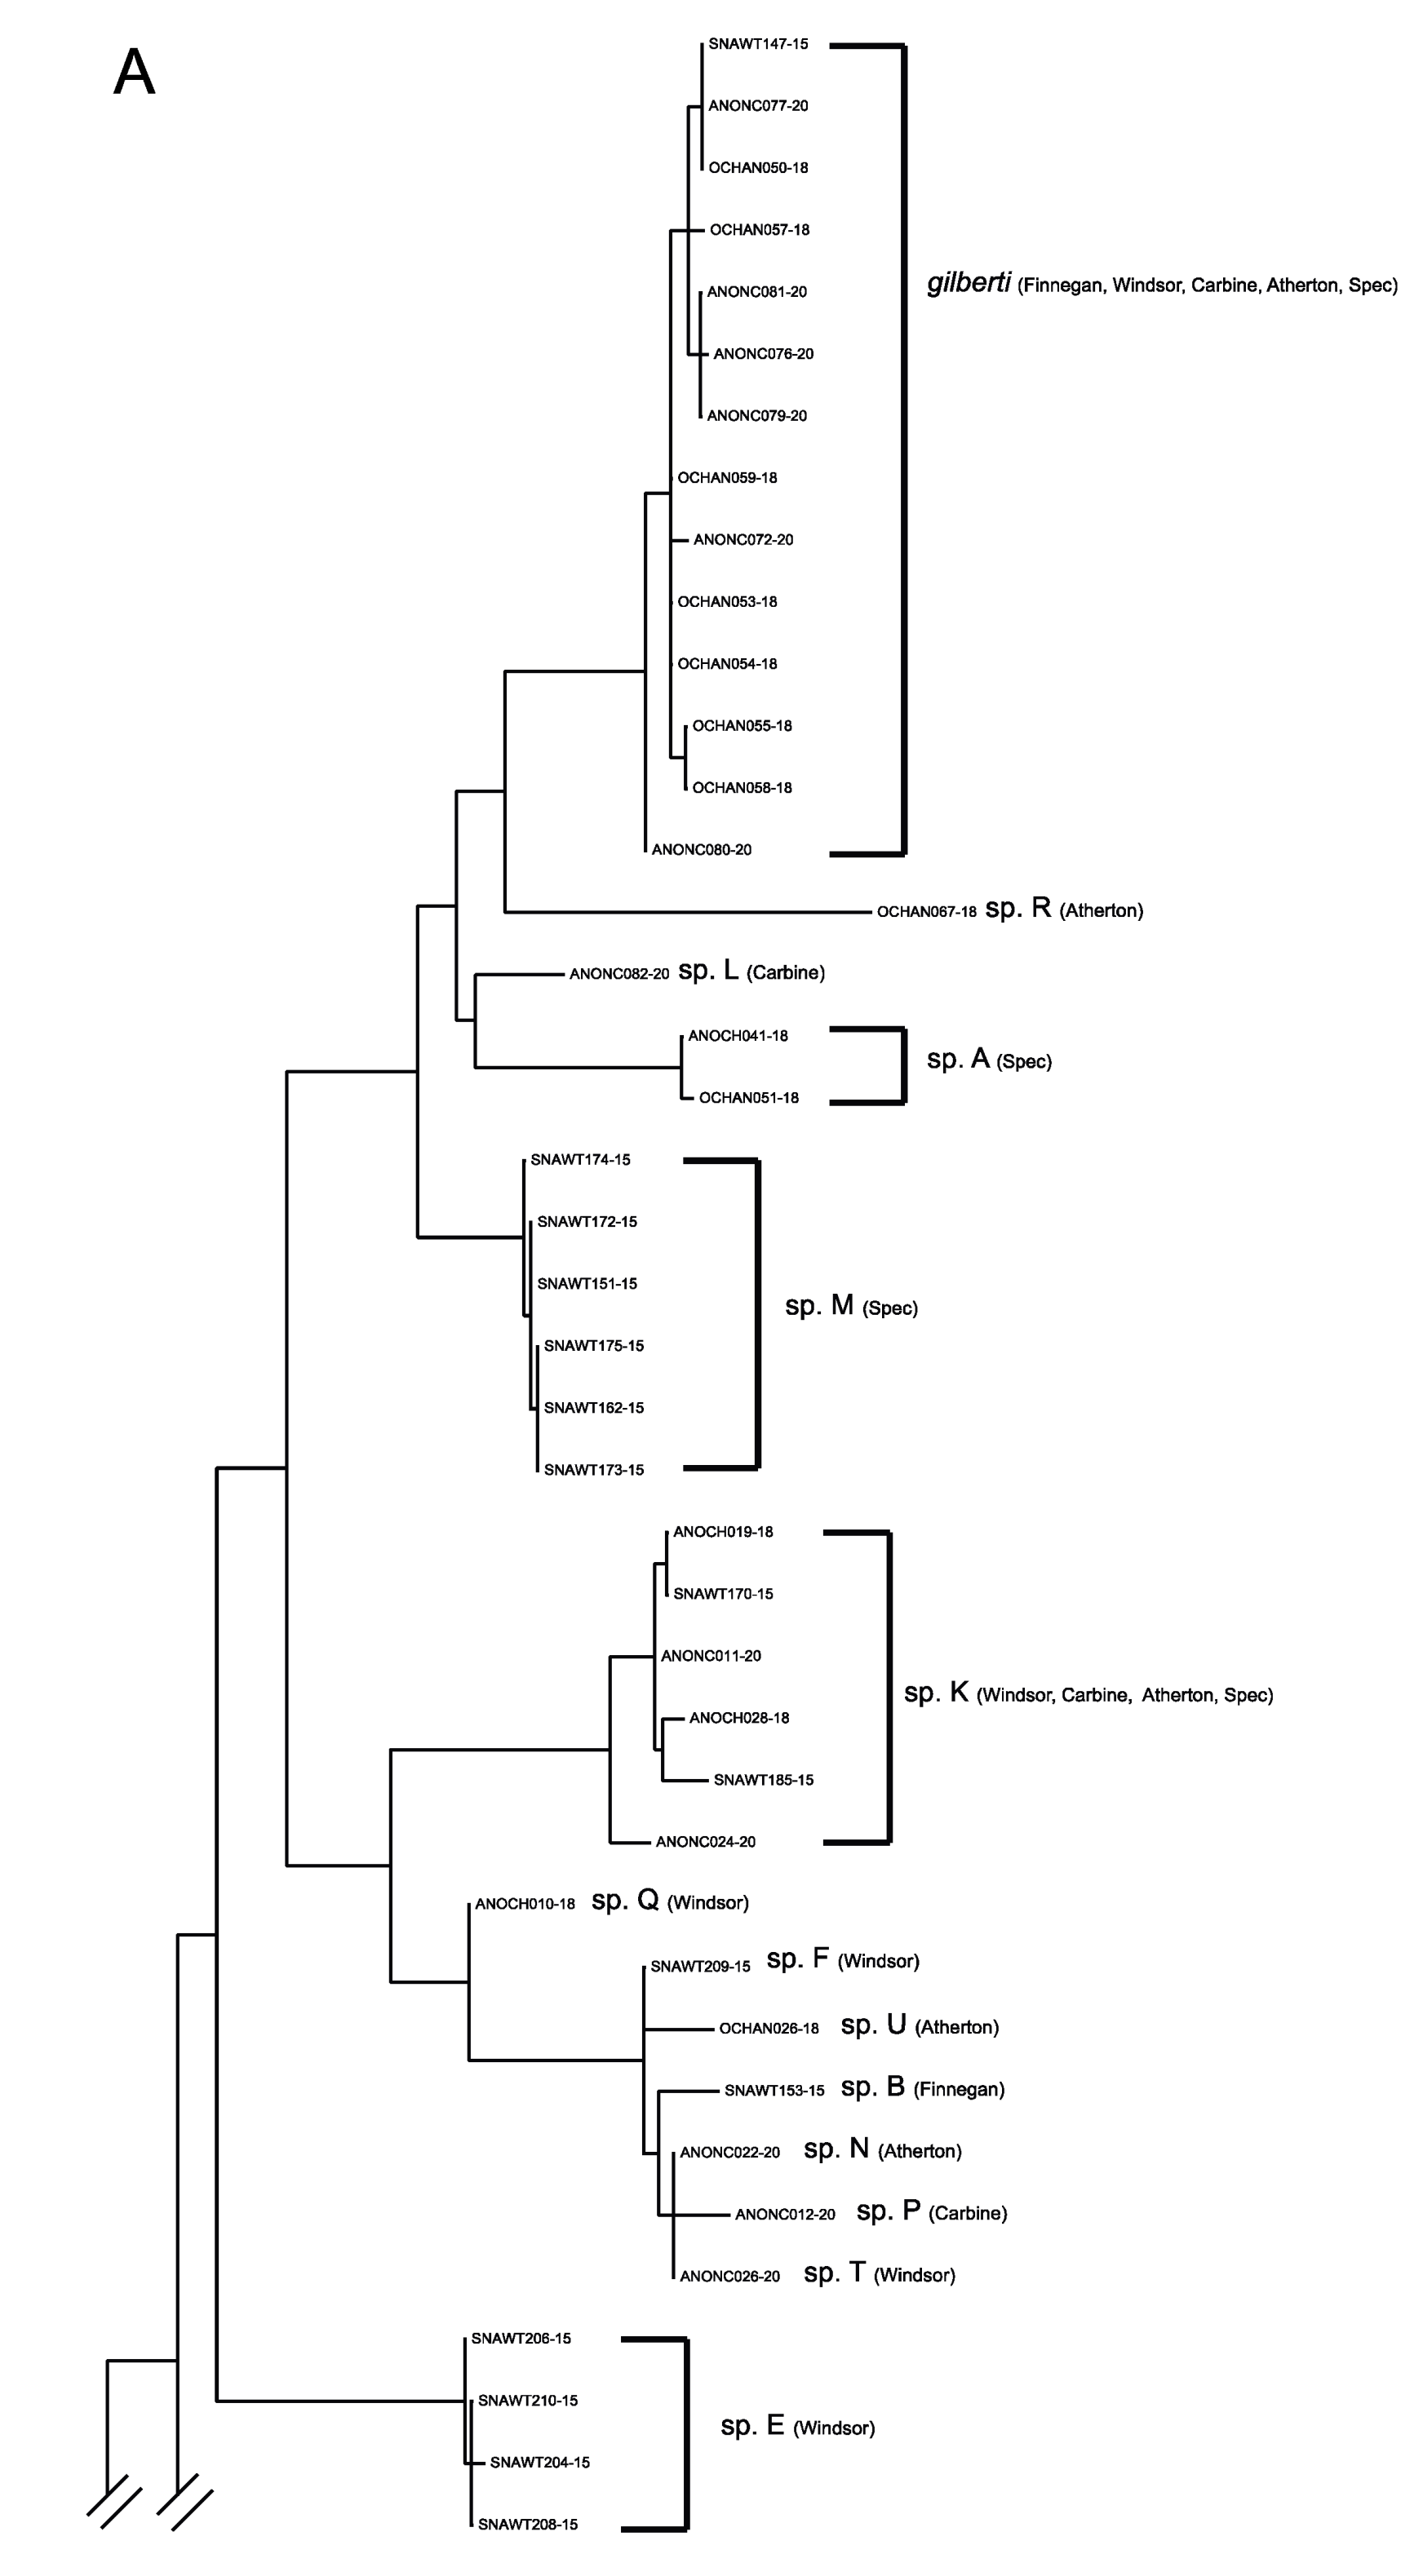
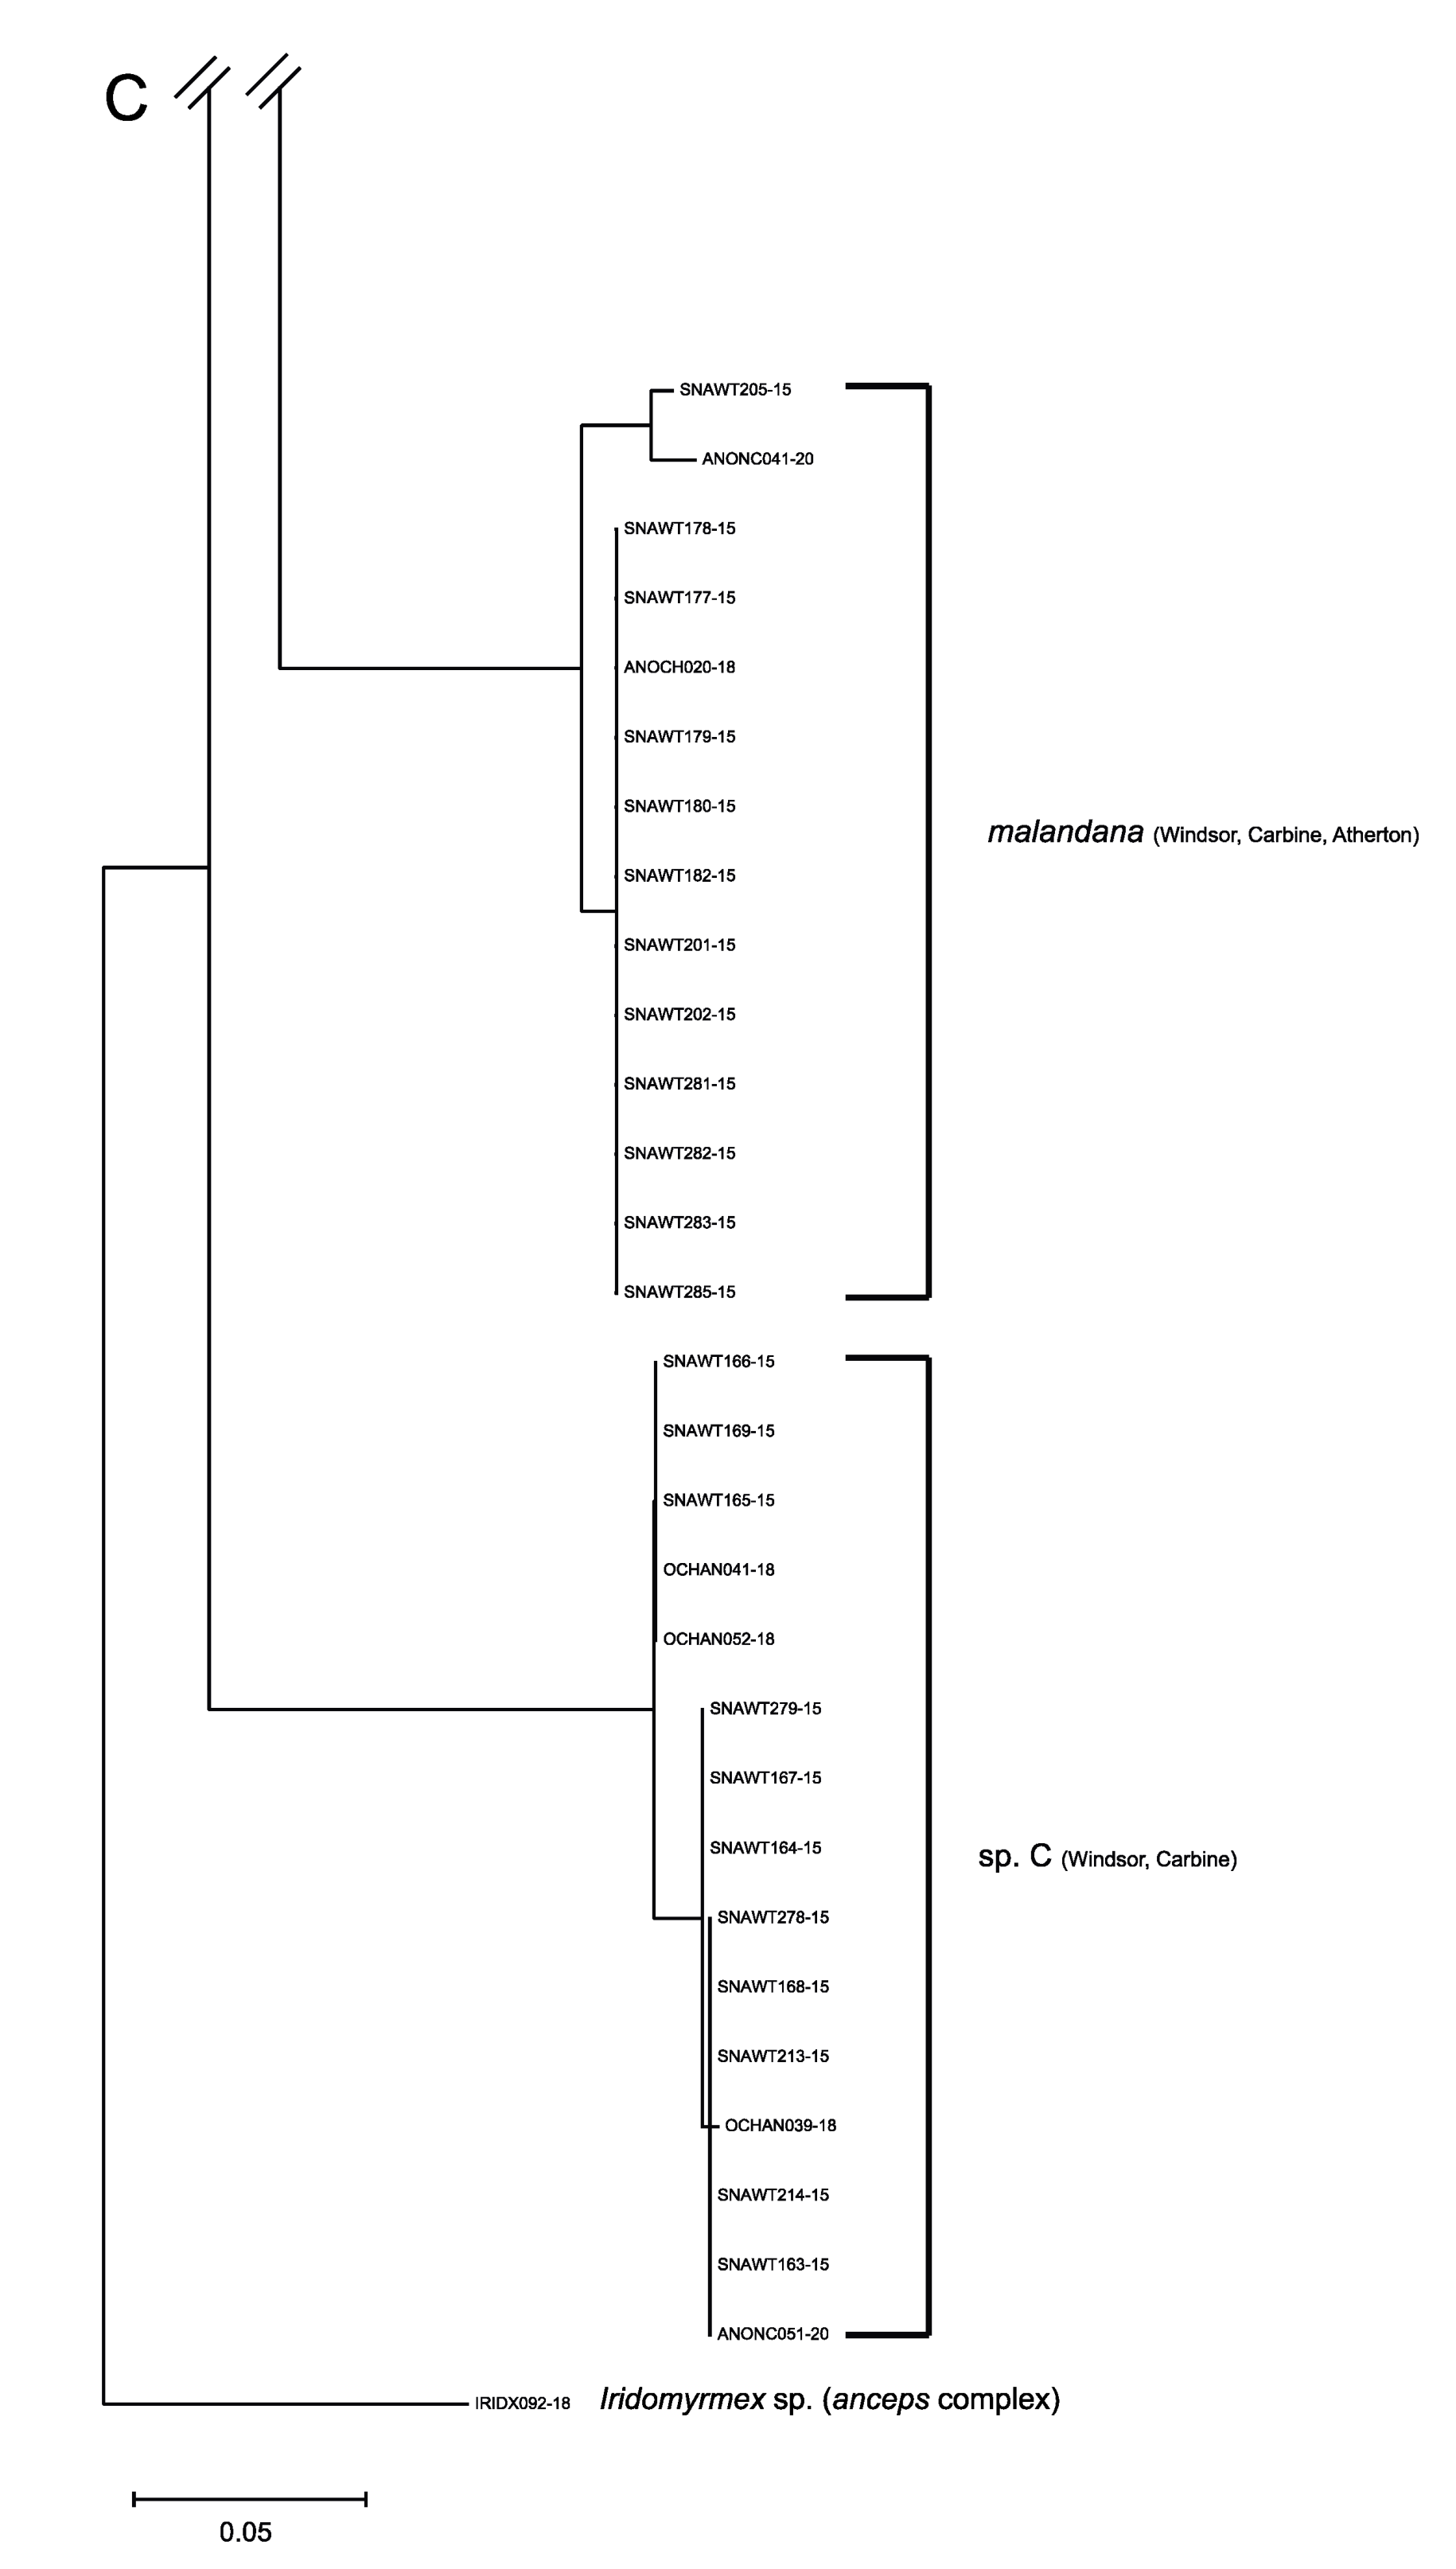
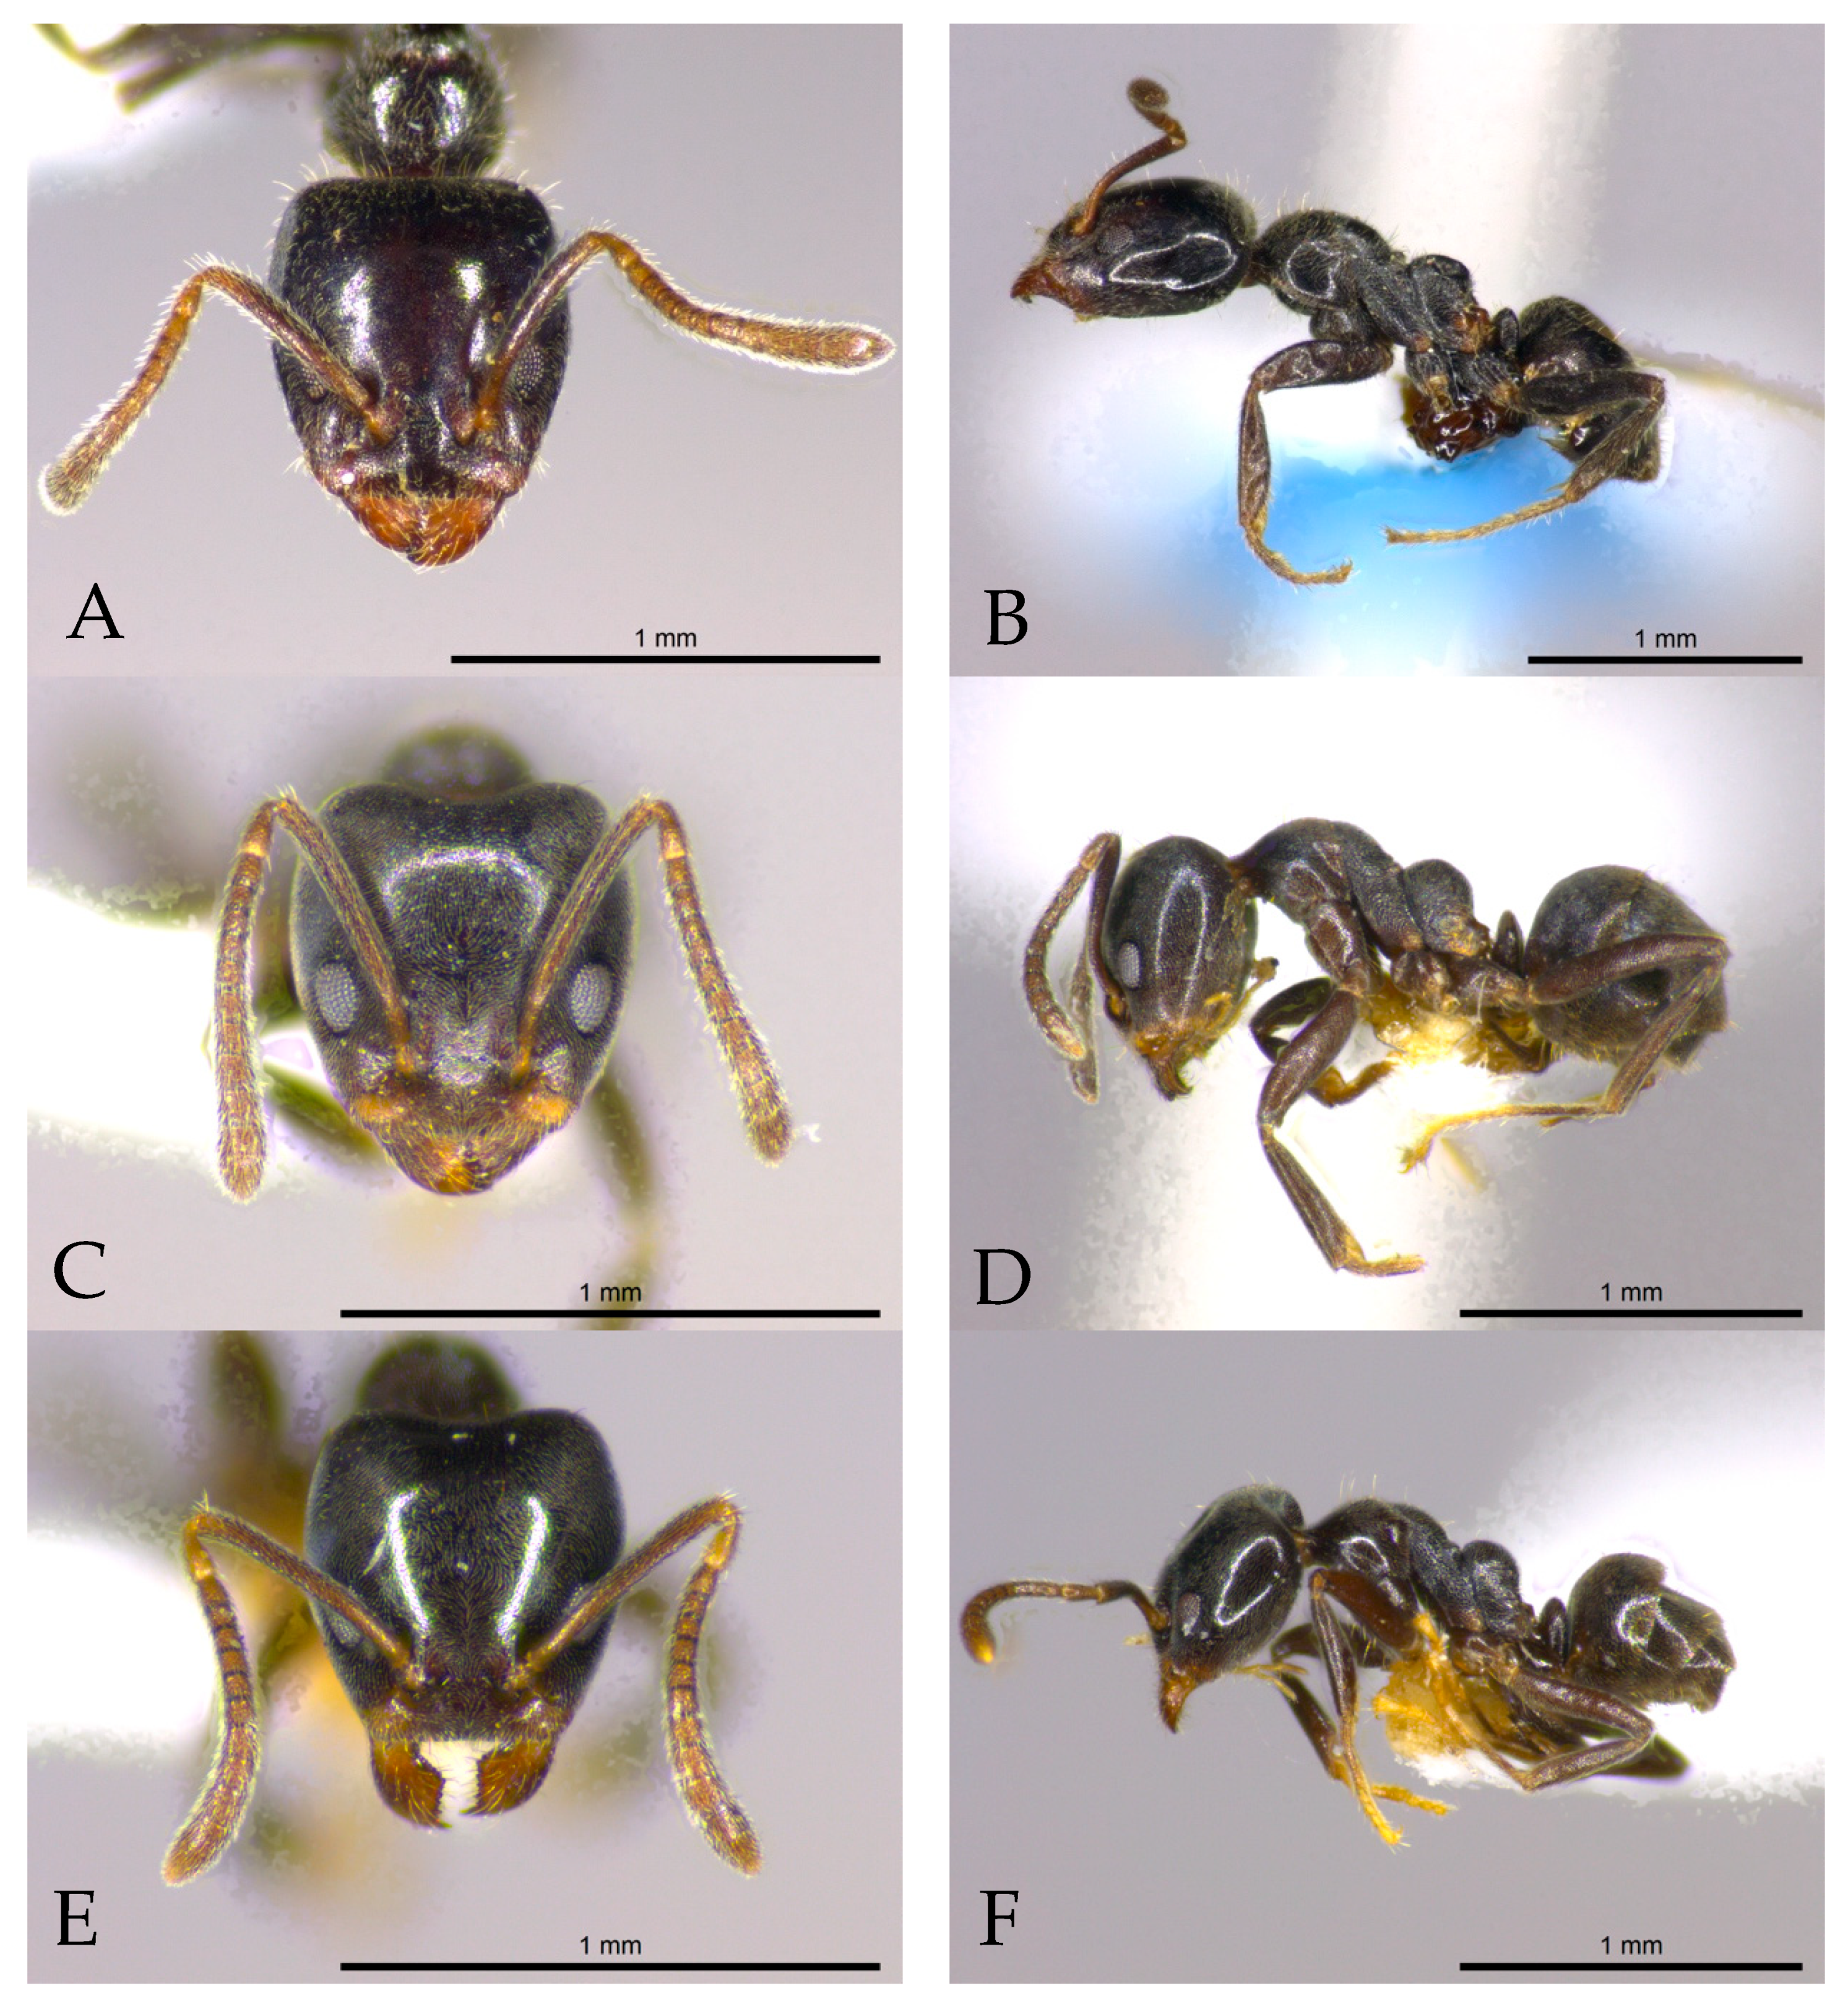
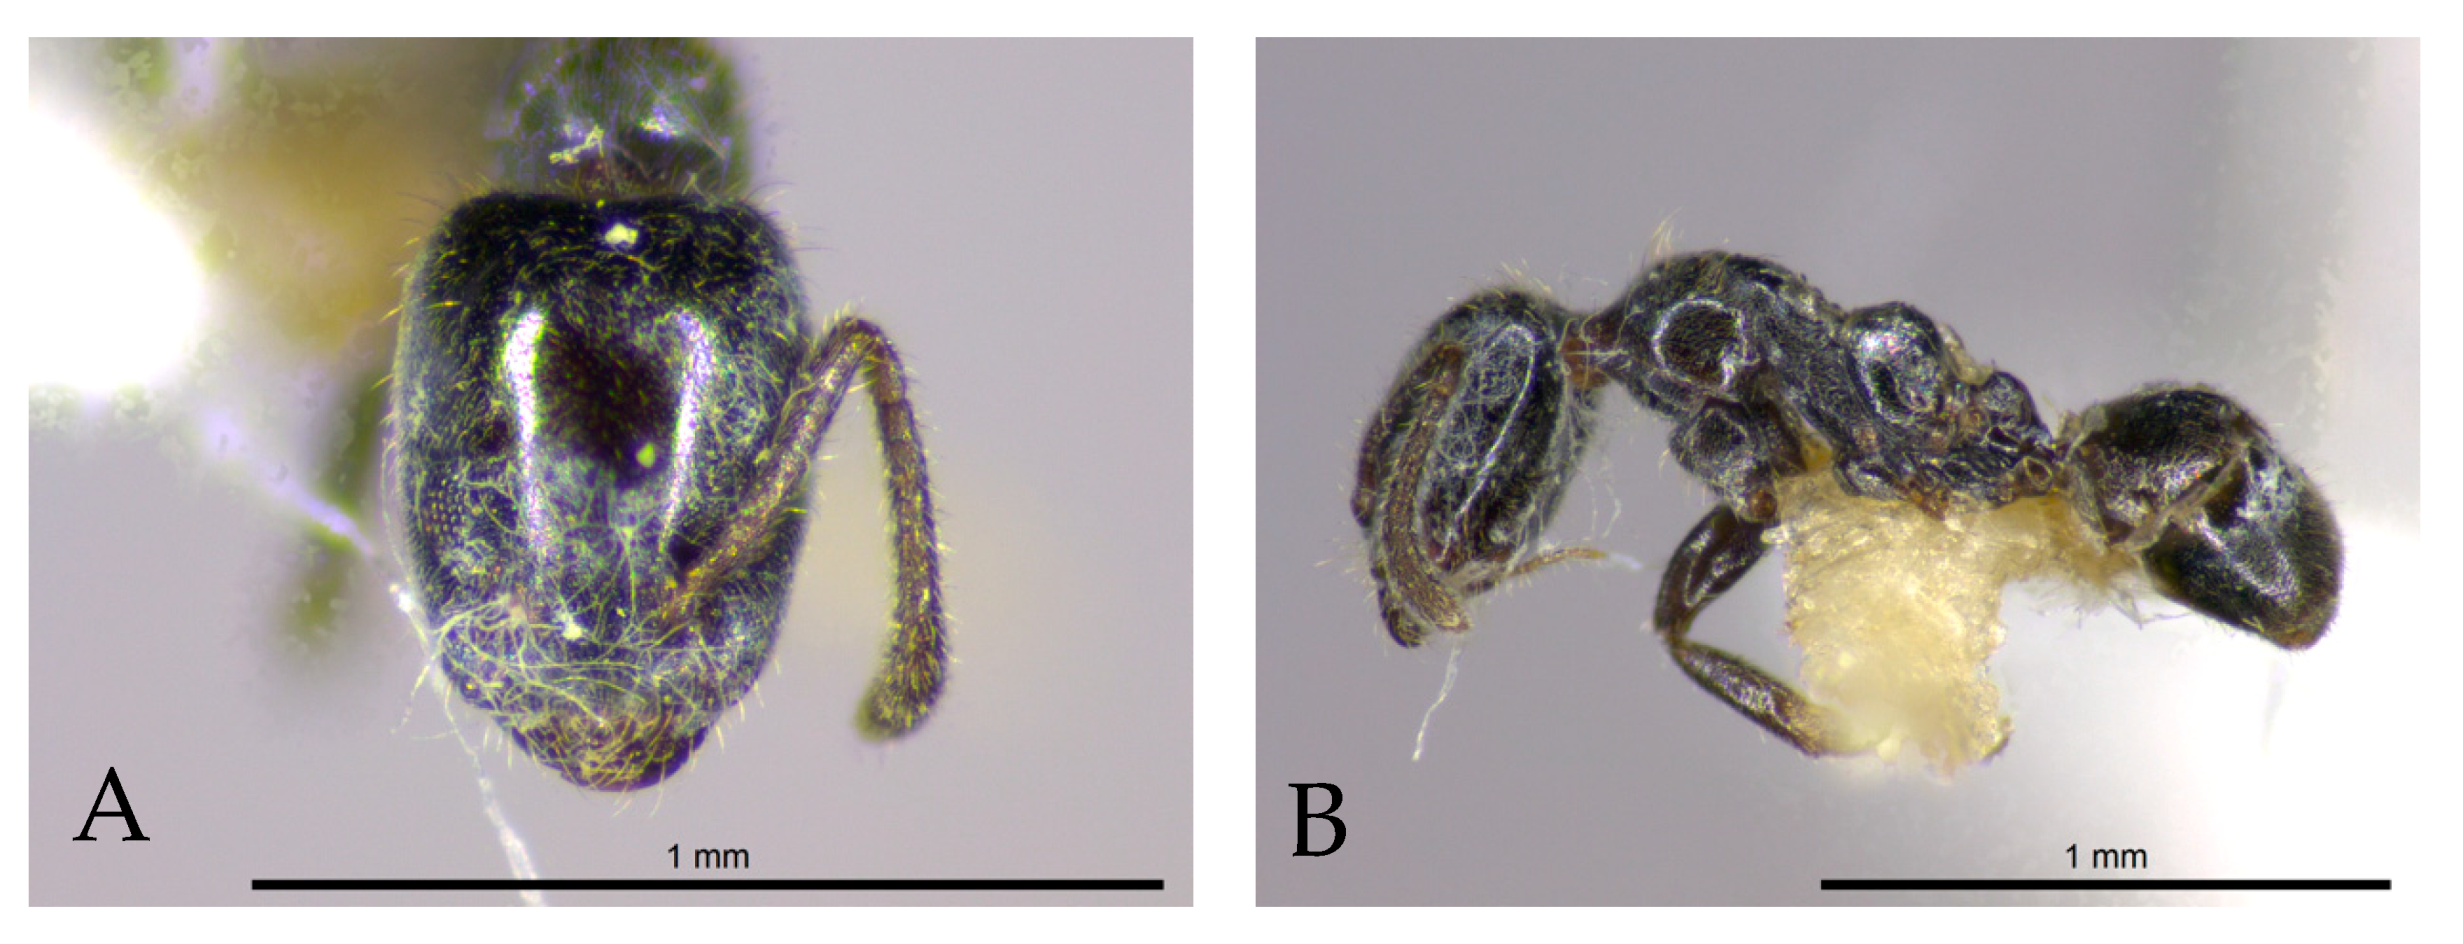
3.1. The Anonychomyrma Fauna

We recognised 22 species of Anonychomyrma (sp. A–C and E–U, along with A. gilberti and A. malandana) among our samples, nine of which were recorded at a single subregion (Table 1). All but one of our recognised species were successfully sequenced. The CO1 tree (Figure 3) indicated that species C (Figure 4A,B) was the most phylogenetically divergent, with no close relatives (13–20% divergence from other species). It was a relatively large, gracile, and somewhat polymorphic species with an angular propodeum, and was common at high elevation at Carbine and Windsor. Anonychomyrma malandana was also indicated as highly distinctive phylogenetically (> 12% divergence from all other species) as well as being highly distinctive morphologically—it was an extremely shiny species with a globose head and very long antennal scapes (Figure 4C,D). It was a high-elevation species that was common at Windsor. Species H and sp. G were also phylogenetically distinct (Figure 3), both with > 11% divergence from all other species. Species H was a small, nondescript species with a biconvex mesosoma and relatively short scapes (Figure 5A,B) and was morphologically very similar to several unrelated species (see below); it was recorded at Carbine and Windsor at the highest elevations (1200 m and 1300 m, respectively). Species G had a short, prominently rounded propodeum, and its scape and first gastric tergite atypically lacked erect hairs (Figure 5C,D). These characters were shared by the smaller sp. J (Figure 5E,F), but despite their morphological similarity (they were considered conspecific in [9]), these species were widely separated in the CO1 tree (Figure 3). They had overlapping geographic distributions at Atherton: sp. G was recorded from all five subregions, whereas sp. J was recorded exclusively from Atherton (Table 1). Species J was shown as being most closely related to sp. I (Figure 6A,B) and sp. S (Figure 6C,D; Figure 3). Compared with sp. I, sp. S had a substantially larger head with a markedly concave occipital margin, more angular occipital corners, and shorter scapes. Both species were recorded only from Atherton and only from high elevation (800 m and 1000 m; Table 1).
Thirteen of the remaining fourteen species formed two clades. The first contained A. gilberti and species A, L, M, and R, which had 6–8% mean CO1 divergence among them (Figure 3). Anonychomyrma gilberti occurred in all subregions, but the other four species were each recorded in a single subregion (Table 1). Species A, L, and M (Figure 7A–F) had the general appearance of A. gilberti (Figure 1), but without such strongly golden pubescence or deeply V-shaped occipital margin; indeed, sp. L had relatively weak pubescence and rounded occipital corners (Figure 7C,D). Species R was morphologically very different to these taxa—it was much smaller, lacked any golden pubescence, had short scapes, and the occipital margin was only feebly concave. Despite its location on the CO1 tree, it seemed to be more closely allied to members of the second clade spanning sp. P to sp. K (Figure 3). Indeed, it seemed morphologically indistinguishable from sp. N from Atherton (Figure 8A,B). All species within this second clade were similar morphologically, and CO1 divergence among them was often < 2%. Compared with sp. N, sp. T (known only from Windsor) had a more conspicuously concave occipital margin and more angular occipital corners, and in sp. P the occipital margin was even more deeply concave. Species U had a narrow head, short scapes, and a prominently rounded propodeum. The propodeum was also prominently rounded in sp. F (Figure 8C,D), but the head was markedly broader and scapes were longer. Species Q had a flattened propodeum and short scapes. Species K (Figure 8E,F) had a very similar appearance to that of sp. N (Figure 7A,B), but the two taxa were very distinct genetically (11% mean CO1 divergence).
The final sequenced species was sp. E, which had a biconvex mesosoma, broad head, and long scapes (Figure 9A,B). It occurred exclusively at Windsor (Table 1). The species that was not sequenced, sp. O, was highly distinctive—it was very small, with a narrowly rectangular head and very short scapes (Figure 10). It appeared to be closely allied to Anonychomyrma minuta (Donisthorpe) from New Guinea. It was recorded only at Atherton, at mid elevation (400, 600, and 800 m sites).

3.2. Patterns of Abundance, Diversity, and Endemism

Anonychomyrma gilberti (185 records) and sp. G (73 records) dominated the samples, collectively representing 81.3% of all species records (Figure 11). Nine species were recorded in only one survey (Figure 11). The number of species within a subregion ranged from 0 at Lamb Range to 11 at Atherton. There was no relationship between survey effort and mean number of species per either subregion (Pearson’s correlation = −0.02, p = 0.9; Figure 12A,B) or elevation (Pearson’s correlation = 0.06, p = 0.8; Figure 13). Windsor (1100–1300 m a.s.l.) had the highest mean species richness per elevational site (5.7 ± 0.7 SE; Figure 12A), and the second highest number of subregion endemics with 4 out of its 10 species (Figure 12B). Atherton (100–1000 m a.s.l.) had the highest number of subregion endemics with 7 endemics out of its total of 11 species (Figure 12B). Carbine, despite having the greatest elevation range (100–1200 m a.s.l.) and the highest survey effort, had similar mean species richness to other low diversity subregions and had only 2 endemic species out of the 8 total species recorded there (Figure 12A,B). Overall, there was high subregion endemism with 16 (72%) species recorded in only one subregion (Table 1). However, all four species (A. gilberti, A. malandana, sp. G, and sp. K) that occurred in more than two subregions had distributions spanning the BMC (Table 1). The mean number of species increased with elevation peaking at 1100 m a.s.l. and slightly declining again at 1200 and 1300 m a.s.l. (Figure 13).
All of the eight species recorded during vertical (tree) surveys nested arboreally (L. Leahy, pers. obs.), with most species foraging high into the canopy. However, there was variation in the way different species used the vertical gradient (Figure 14). Three species, A. gilberti, A. malandana, and sp. G foraged on the ground as well as arboreally. The two most commonly sampled species, A. gilberti and sp. G, were most evenly distributed in their foraging along the vertical gradient, with relatively equal foraging from ground to canopy. These two species were also the most geographically and elevationally widespread species (Table 1). Anonychomyrma malandana and sp. C also showed relatively even foraging across the vertical gradient. The less commonly sampled species showed increasing foraging concentration in the upper parts of the tree from the subcanopy (9–12 m) up to the high canopy (18–27 m; Figure 14).

3.3. Species Distribution Modelling

Maximum temperature of the warmest month was the most important predictor for seven species and the second most important predictor for the other two species modelled (Table 2). For all species, there was a negative relationship between maximum temperature of the warmest month and predicted habitat suitability, but the temperature at which habitat suitability declined (ranging from 26 °C for the high-elevation-restricted sp. H to 34 °C for the widespread A. gilberti and sp. G) and the rate of decline differed substantially (Figure S2). Rainfall of the wettest month was the second most important predictor variable for A. gilberti, sp. E, A. malandana, and sp. K, being strongly negatively related to habitat suitability in all cases (Table 2, Figure S3). Rainfall seasonality was also important in models, but generally ranked as the second or third most important variable, except for two Spec endemics, sp. A and sp. M, for which rainfall seasonality was the most important predictor. These two Spec endemic species had a positive relationship between rainfall seasonality and habitat suitability, whereas all other species had higher habitat suitability at intermediate levels of rainfall seasonality or had a negative relationship with rainfall seasonality (Figure S4).
Distribution modelling predicted that six out of nine species modelled had potential distributions limited to high elevations in either the north (Windsor and Carbine) or far south (Spec) (Figure 15). Summed rainforest habitat suitability (summing each grid cell for suitability for the nine modelled species) was highest at high elevation (Figure 15A), which was consistent with the occurrence of highest species richness (Figure 13). Species-specific habitat suitability generally matched surveyed occurrences, suggesting that actual distributions were close to the potential distributions based on climatic niches (Figure 15). However, our models indicated that highly suitable (≥0.75 probability of occurrence) environments occurred in the southern region for sp. C, sp. E, and sp. H, despite these species being recorded only in the northern subregions in our study. We note that sp. E and sp. H had <10 location points and so these models should be treated with some caution. None of the species modelled had a potential distribution restricted to the centre (Atherton or Lamb) or to the northern lowlands (Figure 15B–J). However, many of the species that were not sufficiently common for modelling were recorded from Atherton, and one species (sp. B) with one record was recorded only at Finnegan at 200 m a.s.l. (Table 1). Models predicted A. gilberti and sp. G to have the greatest potential geographic range, followed by sp. K (Figure 15). Distribution maps showed there was a high probability that these three species occur in other rainforest subregions in the AWT not surveyed here, including Bartle Frere, Bellenden Ker, Lamb, and Kirrama (Figure 15; for map of all AWT subregions, see [18]). Although sp. K had only seven location points for modelling, these were all high elevation (Table 1) and our exploration of the environmental niche space indicated a narrow environmental tolerance; we are therefore confident that sp. K is elevationally restricted despite being geographically widespread.

4. Discussion

The Australian Wet Tropics hosts a diverse Anonychomyrma fauna, whose species show strong geographic patterning. Our genetic and morphological analysis delimited 22 species from our samples, far more than previously recorded in the region. Only two of the species appeared to be described. One of these, A. gilberti, is an ecologically dominant ant in rainforest canopies throughout the region [9,10]. The other is A. malandana, which was originally described from Malanda on the Atherton Uplands, but in our samples, it was recorded in Windsor and Carbine as well (Figure 2). Our samples were from a restricted range of sites in the region and many of our species are known from just one or a few records, which suggests that many additional species likely occur in the AWT.
The distribution and diversity of Anonychomyrma within the AWT suggest that this Gondwanan genus has retained a preference for cooler climates. This is evidenced by the concentration of species at elevations above 900 m a.s.l., with only three of the 22 species being recorded at elevation below 300 m a.s.l. The uplands of Windsor and Atherton are centres of particularly high diversity and endemism. Species distribution models also supported this pattern, and summed habitat suitability showed a general trend that species had high habitat suitability in upland areas that are also the main refugial areas of long-term rainforest stability (for AWT map of paleo-geological habitat stability, see [21]). Such a preference for high elevation is in contrast to the distributional patterns of most other ant taxa in the AWT, and more broadly across the tropics, where ant diversity peaks at low to mid elevations and drops dramatically at high elevations [9,71,72,73]. A similar distributional pattern for Anonychomyrma occurs in Papua New Guinea, where six of eight species surveyed were restricted to high elevation (≥900 m a.s.l.) [5]. Similarly, in neotropical sites of Central America, several lineages of ants that have a north American temperate climate origin, such as Temnothorax [74], are restricted to montane rainforests [71].
All eight species surveyed for vertical distribution were strongly arboreal, often foraging from the understorey up into the high canopy. Only a few species were recorded also foraging on the ground. This suggests that arboreality is a strong trait in the tropical clades of Anonychomyrma in Australia. Many of the species were noted to nest arboreally in trunk cavities (L. Leahy, pers. obs.). The two most abundant species (A. gilberti and sp. G) had the broadest vertical ranges and also had the broadest geographic and elevation ranges, occurring in all subregions and at all elevations. Species with foraging restricted to the canopy tended to have more restricted subregional and elevational distributions. These findings are consistent with the general pattern for AWT ants that vertical niche breadth is positively related to elevation range size [32]. This pattern also follows the general macroecological rule that locally common species tend to be widely distributed [75].
Species distribution modelling of nine species strongly supported maximum temperature during the warmest month as an important predictor of distribution, indicating that high temperature is likely to be an important factor in limiting species distributions. The two most abundant species (A. gilberti and sp. G) were more tolerant of higher maximum temperatures, occurring in all subregions and across the full elevation range. In our modelling, the estimated maximum temperature at which predicted habitat suitability declines was based on a downscaled climatic layer specific to the AWT and was therefore more accurate than a climate layer based on the limited coverage of weather stations in the region [62,76]. However, it is important to note that climate circulation models do not account for vertical climatic gradients, whereby the canopy can experience temperatures several degrees warmer than the forest floor [31,77]. This is an important consideration because the diminutive stature of ants places them close to surface temperatures, which can be far hotter under direct solar radiation, particularly in the canopy [78]. Therefore, given the arboreal habits of Anonychomyrma, maximum temperature exposure is likely to be much higher than the predicted estimates from our species distribution models.
For several species, there was a negative relationship between habitat suitability and rainfall of the wettest month and rainfall seasonality. This could explain the relative depauperate species representation in the uplands of Carbine, where elevations above 1000 m a.s.l. have high rainfall seasonality [26] and very high rainfall during the wet season. Windsor, in comparison, which had the highest species richness, sits in the rain shadow of Carbine and therefore has less rainfall with less seasonality [26]. Similarly, Atherton, also with high species richness and endemism, has relatively low seasonality of both rainfall and temperature. Spec in the extreme south of the AWT had low species richness and may be too dry for most species as its dry seasons are substantially more severe than in the other subregions [26]. Rainfall seasonality is a strong driver of insect abundance throughout the tropics [27,79,80], including in the AWT [26]. High rainfall seasonality is likely to limit ant distributions through its effect on food availability, particularly honeydew from homopteran insects.
A number of our distribution models predicted species to occur in subregions that were not sampled in this study. Of particular note, although we did not record any Anonychomyrma species in the Lamb subregion, several species were predicted to occur there based on the availability of a suitable habitat. The absence of Anonychomyrma at Lamb was therefore likely to be at least partly an artifact of low sampling intensity at that subregion. Other subregions that had high predicted suitability, but were not sampled here, include Bartle Frere and Bellenden-Ker. These are the two highest mountain ranges in the Australian Wet Tropics and have not been systematically sampled for ants. They are centres of diversity and subregion endemism for several Wet Tropics species, including the Gondwanan plant species Eucryphia wilkei, which is endemic to elevations above 1500 m a.s.l. on Bartle Frere, and whose congeners occur only in Tasmania and Chile [35,81]. It is highly likely that the tops of these two mountains harbour additional species of Anonychomyrma.
There was limited evidence of a biogeographic barrier across the Black Mountain Corridor. Four out of six species that occurred in more than one subregion had distributions spanning north and south of the BMC. Invertebrate taxa, such as dung beetles [82], earthworms [24], flightless insects [83], and schizophoran flies [84], that show a biogeographic divide between northern and southern distributions, all have limited dispersal ability compared to ants with winged queens (such as that occurs in Anonychomyrma), which can be dispersed by wind over long distances, including across biogeographic barriers (e.g., [85]).

5. Conclusions

The biogeographic pattern of Anonychomyrma in the AWT supports the hypothesis that this genus has a Gondwanan origin and has radiated from a Australian southern temperate distribution into the tropics [6]. Anonychomyrma has persisted and diversified in rainforest areas of cool climate with only a few species reaching into the hotter lowland environments and spreading across multiple subregions [18,86,87]. This mirrors the distributional pattern of the genus in Papua New Guinea [5] and we would expect a similar pattern to occur in other parts of the genus’ tropical range.
Tropical species restricted to upland habitats with a limited geographic range are considered highly vulnerable to anthropogenic climate change [88,89]. The arboreal foraging habits of Anonychomyrma may provide some options to behaviourally regulate climate exposure, given the strong thermal gradient along trees [90,91,92]. However, the increasingly warm and more seasonal climate that is forecasted for the Australian Wet Tropics [34], along with significant predicted shifts of habitat from rainforest to drier vegetation types [65], places these Gondwanan mountain-top relics under increasing threat.

Supplementary Materials

The following are available online at https://www.mdpi.com/1424-2818/12/12/474/s1, Table S1: Collection locations of specimens from the Anonychomyrma group that were CO1-barcoded for this study, Figure S1: Environmental space occupied by nine species used in species distribution modelling based on our sampling across the AWT, Figure S2: Species distribution modelling response curves showing Anonychomyrma species responses to accuCLIM 1996–2015 Variable 05: Maximum temperature of the warmest month, Figure S3: Species distribution modelling response curves showing Anonychomyrma species responses to accuCLIM 1996–2015 Variable 13: Rainfall of the wettest month, Figure S4: Species distribution modelling response curves showing Anonychomyrma species responses to accuCLIM 1996–2015 Variable 15: Rainfall seasonality.

Author Contributions

A.N.A. conceived of the study, managed the TERC collection, undertook the analysis of the CO1 and morphological data, and contributed substantially to the writing of the paper, L.L. collected specimens in the field, conducted all other analyses, took specimen photos, and wrote the first draft of the manuscript. B.R.S. collected specimens in the field and contributed to the writing of the paper, S.E.W. provided funding for field work and contributed to the writing of the paper. All authors have read and agreed to the published version of the manuscript.

Funding

This study was supported by multiple grants from L.L.: The Explorer’s Club, Wet Tropics Management Authority, Skyrail Rainforest Foundation, Holsworth Wildlife Research Endowment—Equity Trustees Charitable Foundation, and Ecological Society of Australia. Funding from S.E.W.: National Environmental Research Program—Tropical Ecosystem Hub from the Australian Government. L.L. is also supported by a PhD scholarship from the Australian Government. Field research was conducted under permit WITK15811415 issued by the Queensland Government of Australia.

Acknowledgments

We thank the many different Aboriginal traditional owner groups on whose lands the study was conducted. We thank Somayeh Nowrouzi for collecting specimens analysed in this study and all volunteers involved in collections. We thank Stefanie K. Oberprieler for help with analysis of the CO1 data.

Conflicts of Interest

The authors declare no conflict of interest.

References

  1. Hölldobler, B.; Wilson, E.O. The Ants; Harvard University Press: Cambridge, MA, USA, 1990. [Google Scholar]
  2. Dunn, R.R.; Agosti, D.; Andersen, A.N.; Arnan, X.; Bruhl, C.A.; Cerdá, X.; Ellison, A.M.; Fisher, B.L.; Fitzpatrick, M.C.; Gibb, H.; et al. Climatic drivers of hemispheric asymmetry in global patterns of ant species richness. Ecol. Lett. 2009, 12, 324–333. [Google Scholar] [CrossRef] [PubMed]
  3. Shattuck, S.O. Review of the dolichoderine ant genus Iridomyrmex Mayr with descriptions of three new genera (Hymenoptera: Formicidae). Aust. J. Entomol. 1992, 31, 13–18. [Google Scholar] [CrossRef]
  4. AntWeb. Available online: https://www.antweb.org (accessed on 20 September 2020).
  5. Plowman, N.S.; Mottl, O.; Novotny, V.; Idigel, C.; Philip, F.J.; Rimandai, M.; Klimes, P. Nest microhabitats and tree size mediate shifts in ant community structure across elevation in tropical rainforest canopies. Ecography 2020, 43, 431–442. [Google Scholar] [CrossRef]
  6. Ward, P.S.; Brady, S.G.; Fisher, B.L.; Schultz, T.R. Phylogeny and biogeography of dolichoderine ants: Effects of data partitioning and relict taxa on historical inference. Syst. Biol. 2010, 59, 342–362. [Google Scholar] [CrossRef] [PubMed] [Green Version]
  7. Fox, M.D.; Fox, B.J. Evidence for interspecific competition influencing ant species diversity in a regenerating heathland. In Ant-Plant Interactions in Australia; Buckley, R., Ed.; Springer: Dordrecht, The Netherlands, 1982; pp. 99–110. [Google Scholar]
  8. Andersen, A.N. Patterns of ant community organization in mesic southeastern Australia. Aust. J. Ecol. 1986, 11, 87–97. [Google Scholar] [CrossRef]
  9. Nowrouzi, S.; Andersen, A.N.; Macfadyen, S.; Staunton, K.M.; VanDerWal, J.; Robson, S.K.A. Ant diversity and distribution along elevation gradients in the Australian Wet Tropics: The importance of seasonal moisture stability. PLoS ONE 2016, 11, e0153420. [Google Scholar] [CrossRef]
  10. Blüthgen, N.; Stork, N.E. Ant mosaics in a tropical rainforest in Australia and elsewhere: A critical review. Austral Ecol. 2007, 32, 93–104. [Google Scholar] [CrossRef]
  11. Schneider, C.; Moritz, C. Rainforest refugia and Australia’s Wet Tropics. Proc. R. Soc. Lond. B Biol. Sci. 1999, 266, 191–196. [Google Scholar] [CrossRef] [Green Version]
  12. Blüthgen, N.; Stork, N.; Fiedler, K. Bottom-up control and co-occurrence in complex communities: Honeydew and nectar determine a rainforest ant mosaic. Oikos 2004, 106, 344–358. [Google Scholar] [CrossRef]
  13. Williams, S.E.; Pearson, R.G.; Walsh, P.J. Distributions and biodiversity of the terrestrial vertebrates of Australia’s Wet Tropics: A review of current knowledge. Pac. Conserv. Biol. 1995, 2, 327–362. [Google Scholar] [CrossRef]
  14. Carnaval, A.C.; Moritz, C. Historical Climate Modelling Predicts Patterns of Current Biodiversity in the Brazilian Atlantic Forest. J. Biogeogr. 2008, 35, 1187–1201. [Google Scholar] [CrossRef]
  15. Davies, T.J.; Buckley, L.B.; Grenyer, R.; Gittleman, J.L. The influence of past and present climate on the biogeography of modern mammal diversity. Philos. Trans. R. Soc. B Biol. Sci. 2011, 366, 2526–2535. [Google Scholar] [CrossRef] [PubMed]
  16. Kershaw, A. Pleistocene vegetation of the humid tropics of northeastern Queensland, Australia. Palaeogeogr. Palaeoclimatol. Palaeoecol. 1994, 109, 399–412. [Google Scholar] [CrossRef]
  17. Hopkins, M.S.; Ash, J.; Graham, A.W.; Head, J.; Hewett, R. Charcoal evidence of the spatial extent of the Eucalyptus woodland expansions and rainforest contractions in North Queensland during the late Pleistocene. J. Biogeogr. 1993, 20, 357–372. [Google Scholar] [CrossRef]
  18. Williams, S.E.; Pearson, R.G. Historical rainforest contractions, localized extinctions and patterns of vertebrate endemism in the rainforests of Australia’s wet tropics. Proc. R. Soc. Lond. B Biol. Sci. 1997, 264, 709–716. [Google Scholar] [CrossRef] [Green Version]
  19. Hugall, A.; Moritz, C.; Moussalli, A.; Stanisic, J. Reconciling paleodistribution models and comparative phylogeography in the Wet Tropics rainforest land snail Gnarosophia bellendenkerensis (Brazier 1875). Proc. Natl. Acad. Sci. USA 2002, 99, 6112–6117. [Google Scholar] [CrossRef] [Green Version]
  20. Colwell, R.K.; Brehm, G.; Cardelús, C.L.; Gilman, A.C.; Longino, J.T. Global warming, elevational range shifts, and lowland biotic attrition in the wet tropics. Science 2008, 322, 258–261. [Google Scholar] [CrossRef] [Green Version]
  21. Graham, C.H.; Moritz, C.; Williams, S.E. Habitat history improves prediction of biodiversity in rainforest fauna. Proc. Natl. Acad. Sci. USA 2006, 103, 632–636. [Google Scholar] [CrossRef] [Green Version]
  22. Ponniah, M.; Hughes, J.M. The evolution of Queensland spiny mountain crayfish of the genus Euastacus. I. Testing vicariance and dispersal with interspecific mitochondrial DNA. Evolution 2004, 58, 1073–1085. [Google Scholar] [CrossRef]
  23. Moritz, C.; Hoskin, C.; MacKenzie, J.; Phillips, B.; Tonione, M.; Silva, N.; VanDerWal, J.; Williams, S.; Graham, C. Identification and dynamics of a cryptic suture zone in tropical rainforest. Proc. R. Soc. Lond. B Biol. Sci. 2009, 276, 1235–1244. [Google Scholar] [CrossRef] [PubMed] [Green Version]
  24. Moreau, C.S.; Hugall, A.F.; McDonald, K.R.; Jamieson, B.G.; Moritz, C. An ancient divide in a contiguous rainforest: Endemic earthworms in the Australian Wet Tropics. PLoS ONE 2015, 10, e0136943. [Google Scholar] [CrossRef] [PubMed] [Green Version]
  25. Moussalli, A.; Moritz, C.; Williams, S.E.; Carnaval, A.C. Variable responses of skinks to a common history of rainforest fluctuation: Concordance between phylogeography and paleo-distribution models. Mol. Ecol. 2009, 18, 483–499. [Google Scholar] [CrossRef] [PubMed]
  26. Williams, S.E.; Middleton, J. Climatic seasonality, resource bottlenecks, and abundance of rainforest birds: Implications for global climate change. Divers. Distrib. 2008, 14, 69–77. [Google Scholar] [CrossRef]
  27. Frith, C.; Frith, D. Seasonality of insect abundance in an Australian upland rainforest. Aust. J. Ecol. 1985, 10, 237–248. [Google Scholar] [CrossRef]
  28. Blüthgen, N.; Fiedler, K. Competition for composition: Lessons from nectar-feeding ant communities. Ecology 2004, 85, 1479–1485. [Google Scholar] [CrossRef] [Green Version]
  29. Shoo, L.P.; Williams, S.E.; Hero, J.-M. Climate warming and the rainforest birds of the Australian Wet Tropics: Using abundance data as a sensitive predictor of change in total population size. Biol. Conserv. 2005, 125, 335–343. [Google Scholar] [CrossRef]
  30. McJannet, D.; Wallace, J.; Reddell, P. Precipitation interception in Australian tropical rainforests: II. Altitudinal gradients of cloud interception, stemflow, throughfall and interception. Hydrol. Process. 2007, 21, 1703–1718. [Google Scholar] [CrossRef]
  31. De Frenne, P.; Zellweger, F.; Rodriguez-Sanchez, F.; Scheffers, B.R.; Hylander, K.; Luoto, M.; Vellend, M.; Verheyen, K.; Lenoir, J. Global buffering of temperatures under forest canopies. Nat. Ecol. Evol. 2019, 3, 744–749. [Google Scholar] [CrossRef]
  32. Leahy, L.; Scheffers, B.R.; Andersen, A.N.; Hirsch, B.T.; Williams, S.E. Vertical niche and elevation range size in tropical ants: Implications for climate resilience. Divers. Distrib. In press.
  33. Schlick-Steiner, B.C.; Steiner, F.M.; Moder, K.; Seifert, B.; Sanetra, M.; Dyreson, E.; Stauffer, C.; Christian, E. A multidisciplinary approach reveals cryptic diversity in Western Palearctic Tetramorium ants (Hymenoptera: Formicidae). Mol. Phylogenet. Evol. 2006, 40, 259–273. [Google Scholar] [CrossRef]
  34. Williams, S.E.; Falconi, L.; Moritz, C.; Fenker Antunes, J. State of Wet Tropics Report 2015-2016. Ancient, Endemic, Rare and Threatened Vertebrates of the Wet Tropics; Wet Tropics Management Authority: Cairns, Australia, 2016. [Google Scholar]
  35. Williams, S.E.; VanDerWal, J.; Isaac, J.; Shoo, L.P.; Storlie, C.; Fox, S.; Bolitho, E.E.; Moritz, C.; Hoskin, C.J.; Williams, Y.M. Distributions, life-history specialization, and phylogeny of the rain forest vertebrates in the Australian Wet Tropics. Ecology 2010, 91, 2493-2493. [Google Scholar] [CrossRef] [Green Version]
  36. Taylor, R. Biogeography of insects of New Guinea and Cape York Peninsula. In Bridge and Barrier: The Natural and Cultural History of Torres Strait; Walker, D., Ed.; Australian National University Press: Canberra, Australia, 1972; pp. 213–230. [Google Scholar]
  37. van Ingen, L.T.; Campos, R.I.; Andersen, A.N. Ant Community Structure along an Extended Rain Forest: Savanna Gradient in Tropical Australia. J. Trop. Ecol. 2008, 445–455. [Google Scholar] [CrossRef]
  38. Reichel, H.; Andersen, A.N. The rainforest ant fauna of Australia’s Northern Territory. Aust. J. Zool. 1996, 44, 81–95. [Google Scholar] [CrossRef]
  39. Brühl, C.A.; Gunsalam, G.; Linsenmair, K.E. Stratification of ants (Hymenoptera, Formicidae) in a primary rain forest in Sabah, Borneo. J. Trop. Ecol. 1998, 14, 285–297. [Google Scholar] [CrossRef]
  40. Longino, J.T.; Coddington, J.; Colwell, R.K. The ant fauna of a tropical rain forest: Estimating species richness three different ways. Ecology 2002, 83, 689–702. [Google Scholar] [CrossRef]
  41. Andersen, A.N. The Ants of Northern Australia: A Guide to the Monsoonal Fauna; CSIRO Publishing: Clayton, Australia, 2000. [Google Scholar]
  42. Staunton, K.M.; Robson, S.K.; Burwell, C.J.; Reside, A.E.; Williams, S.E. Projected distributions and diversity of flightless ground beetles within the Australian Wet Tropics and their environmental correlates. PLoS ONE 2014, 9, e88635. [Google Scholar] [CrossRef] [Green Version]
  43. Kumar, S.; Stecher, G.; Tamura, K. MEGA7: Molecular evolutionary genetics analysis version 7.0 for bigger datasets. Mol. Biol. Evol. 2016, 33, 1870–1874. [Google Scholar] [CrossRef] [Green Version]
  44. Edgar, R.C. MUSCLE: Multiple sequence alignment with high accuracy and high throughput. Nucleic Acids Res. 2004, 32, 1792–1797. [Google Scholar] [CrossRef] [Green Version]
  45. Andersen, A.N.; Hoffmann, B.D.; Oberprieler, S.K. Integrated morphological, CO1 and distributional analysis confirms many species in the Iridomyrmex anceps (Roger) complex of ants. Zool. Syst. 2020, 45, 219–230. [Google Scholar]
  46. Trifinopoulos, J.; Nguyen, L.-T.; von Haeseler, A.; Minh, B.Q. W-IQ-TREE: A fast online phylogenetic tool for maximum likelihood analysis. Nucleic Acids Res. 2016, 44, W232–W235. [Google Scholar] [CrossRef] [Green Version]
  47. Minh, B.Q.; Nguyen, M.A.T.; von Haeseler, A. Ultrafast approximation for phylogenetic bootstrap. Mol. Biol. Evol. 2013, 30, 1188–1195. [Google Scholar] [CrossRef]
  48. Nguyen, L.-T.; Schmidt, H.A.; Von Haeseler, A.; Minh, B.Q. IQ-TREE: A fast and effective stochastic algorithm for estimating maximum-likelihood phylogenies. Mol. Biol. Evol. 2015, 32, 268–274. [Google Scholar] [CrossRef]
  49. Chernomor, O.; Von Haeseler, A.; Minh, B.Q. Terrace aware data structure for phylogenomic inference from supermatrices. Syst. Biol. 2016, 65, 997–1008. [Google Scholar] [CrossRef] [Green Version]
  50. Rambaut, A. FigTree: Molecular Evolution, Phylogenetics and Epidemiology. Available online: http://tree.bio.ed.ac.uk/software/figtree/ (accessed on 20 May 2020).
  51. Smith, M.A.; Fisher, B.L.; Hebert, P.D. DNA barcoding for effective biodiversity assessment of a hyperdiverse arthropod group: The ants of Madagascar. Philos. Trans. R. Soc. B Biol. Sci. 2005, 360, 1825–1834. [Google Scholar] [CrossRef] [Green Version]
  52. Wild, A.L. Evolution of the Neotropical ant genus Linepithema. Syst. Entomol. 2009, 34, 49–62. [Google Scholar] [CrossRef]
  53. Schär, S.; Talavera, G.; Espadaler, X.; Rana, J.D.; Andersen Andersen, A.; Cover, S.P.; Vila, R. Do Holarctic ant species exist? Trans-Beringian dispersal and homoplasy in the Formicidae. J. Biogeogr. 2018, 45, 1917–1928. [Google Scholar] [CrossRef]
  54. Wagner, H.C.; Gamisch, A.; Arthofer, W.; Moder, K.; Steiner, F.M.; Schlick-Steiner, B.C. Evolution of morphological crypsis in the Tetramorium caespitum ant species complex (Hymenoptera: Formicidae). Sci. Rep. 2018, 8, 1–10. [Google Scholar] [CrossRef] [Green Version]
  55. Phillips, S.J.; Anderson, R.P.; Dudík, M.; Schapire, R.E.; Blair, M.E. Opening the black box: An open-source release of Maxent. Ecography 2017, 40, 887–893. [Google Scholar] [CrossRef]
  56. Merow, C.; Smith, M.J.; Silander Jr, J.A. A practical guide to MaxEnt for modeling species’ distributions: What it does, and why inputs and settings matter. Ecography 2013, 36, 1058–1069. [Google Scholar] [CrossRef]
  57. Hernandez, P.A.; Graham, C.H.; Master, L.L.; Albert, D.L. The effect of sample size and species characteristics on performance of different species distribution modeling methods. Ecography 2006, 29, 773–785. [Google Scholar] [CrossRef]
  58. van Proosdij, A.S.; Sosef, M.S.; Wieringa, J.J.; Raes, N. Minimum required number of specimen records to develop accurate species distribution models. Ecography 2016, 39, 542–552. [Google Scholar] [CrossRef]
  59. Wisz, M.S.; Hijmans, R.; Li, J.; Peterson, A.T.; Graham, C.; Guisan, A.; Group, N.P.S.D.W. Effects of sample size on the performance of species distribution models. Divers. Distrib. 2008, 14, 763–773. [Google Scholar] [CrossRef]
  60. Elith, J.; Graham, C.H.; Anderson, R.P.; Dudík, M.; Ferrier, S.; Guisan, A.; Hijmans, R.J.; Huettmann, F.; Leathwick, J.R.; Lehmann, A. Novel methods improve prediction of species’ distributions from occurrence data. Ecography 2006, 29, 129–151. [Google Scholar] [CrossRef] [Green Version]
  61. Papeş, M.; Gaubert, P. Modelling ecological niches from low numbers of occurrences: Assessment of the conservation status of poorly known viverrids (Mammalia, Carnivora) across two continents. Divers. Distrib. 2007, 13, 890–902. [Google Scholar] [CrossRef]
  62. Storlie, C.; Phillips, B.; VanDerWal, J.; Williams, S. Improved spatial estimates of climate predict patchier species distributions. Divers. Distrib. 2013, 19, 1106–1113. [Google Scholar] [CrossRef]
  63. McMahon, J.; Hutchinson, M.; Nix, H.; Ord, K. ANUCLIM User’s Guide. Version 1; Centre for Resource and Environmental Studies, Australian National University: Canberra, Australia, 1995. [Google Scholar]
  64. VanDerWal, J.; Shoo, L.P.; Johnson, C.N.; Williams, S.E. Abundance and the Environmental Niche: Environmental Suitability Estimated from Niche Models Predicts the Upper Limit of Local Abundance. Am. Nat. 2009, 174, 282–291. [Google Scholar] [CrossRef] [Green Version]
  65. Nowrouzi, S.; Bush, A.; Harwood, T.; Staunton, K.M.; Robson, S.K.; Andersen, A.N. Incorporating habitat suitability into community projections: Ant responses to climate change in the Australian Wet Tropics. Divers. Distrib. 2019, 25, 1273–1288. [Google Scholar] [CrossRef]
  66. Brandt, L.A.; Benscoter, A.M.; Harvey, R.; Speroterra, C.; Bucklin, D.; Romañach, S.S.; Watling, J.I.; Mazzotti, F.J. Comparison of climate envelope models developed using expert-selected variables versus statistical selection. Ecol. Model. 2017, 345, 10–20. [Google Scholar] [CrossRef]
  67. Dormann, C.F.; Elith, J.; Bacher, S.; Buchmann, C.; Carl, G.; Carré, G.; Marquéz, J.R.G.; Gruber, B.; Lafourcade, B.; Leitao, P.J. Collinearity: A review of methods to deal with it and a simulation study evaluating their performance. Ecography 2013, 36, 27–46. [Google Scholar] [CrossRef]
  68. Naimi, B.; Hamm, N.A.; Groen, T.A.; Skidmore, A.K.; Toxopeus, A.G. Where is positional uncertainty a problem for species distribution modelling? Ecography 2014, 37, 191–203. [Google Scholar] [CrossRef]
  69. Elith, J.; Leathwick, J.R. Species distribution models: Ecological explanation and prediction across space and time. Annu. Rev. Ecol. Evol. Syst. 2009, 40, 677–697. [Google Scholar] [CrossRef]
  70. Pearce, J.; Ferrier, S. Evaluating the predictive performance of habitat models developed using logistic regression. Ecol. Model. 2000, 133, 225–245. [Google Scholar] [CrossRef] [Green Version]
  71. Longino, J.T.; Branstetter, M.G. The truncated bell: An enigmatic but pervasive elevational diversity pattern in Middle American ants. Ecography 2019, 42, 272–283. [Google Scholar] [CrossRef]
  72. Longino, J.T.; Branstetter, M.G.; Colwell, R.K. How ants drop out: Ant abundance on tropical mountains. PLoS ONE 2014, 9, e104030. [Google Scholar] [CrossRef] [Green Version]
  73. Burwell, C.J.; Nakamura, A. Can changes in ant diversity along elevational gradients in tropical and subtropical Australian rainforests be used to detect a signal of past lowland biotic attrition? Austral Ecol. 2015, 41, 209–218. [Google Scholar] [CrossRef]
  74. Prebus, M. Insights into the evolution, biogeography and natural history of the acorn ants, genus Temnothorax Mayr (hymenoptera: Formicidae). BMC Evol. Biol. 2017, 17, 250. [Google Scholar] [CrossRef] [Green Version]
  75. Gaston, K.J.; Blackburn, T.M.; Lawton, J.H. Interspecific abundance-range size relationships: An appraisal of mechanisms. J. Anim. Ecol. 1997, 66, 579–601. [Google Scholar] [CrossRef] [Green Version]
  76. Storlie, C.; Merino-Viteri, A.; Phillips, B.; VanDerWal, J.; Welbergen, J.; Williams, S. Stepping inside the niche: Microclimate data are critical for accurate assessment of species’ vulnerability to climate change. Biol. Lett. 2014, 10, 20140576. [Google Scholar] [CrossRef] [Green Version]
  77. Scheffers, B.R.; Phillips, B.L.; Laurance, W.F.; Sodhi, N.S.; Diesmos, A.; Williams, S.E. Increasing arboreality with altitude: A novel biogeographic dimension. Proc. R. Soc. B 2013, 280, 20131581. [Google Scholar] [CrossRef]
  78. Kaspari, M.; Clay, N.A.; Lucas, J.; Yanoviak, S.P.; Kay, A. Thermal adaptation generates a diversity of thermal limits in a rainforest ant community. Glob. Chang. Biol. 2015, 21, 1092–1102. [Google Scholar] [CrossRef]
  79. Janzen, D.H.; Schoener, T.W. Differences in insect abundance and diversity between wetter and drier sites during a tropical dry season. Ecology 1968, 49, 96–110. [Google Scholar] [CrossRef]
  80. Lowman, M.D. Seasonal variation in insect abundance among three Australian rain forests, with particular reference to phytophagous types. Aust. J. Ecol. 1982, 7, 353–361. [Google Scholar] [CrossRef]
  81. Forster, P.I.; Hyland, B.P.M. Two new species of Eucryphia Cav.(Cunoniaceae) from Queensland. Austrobaileya 1997, 4, 589–596. [Google Scholar]
  82. Aristophanous, M. Understanding Patterns of Endemic Dung Beetle (Coleoptera: Scarabaeidae: Scarabaeinae) Biodiversity in the Australian Wet Tropics Rainforest: Implications of Climate Change; James Cook University: Townsville, Australia, 2014. [Google Scholar]
  83. Yeates, D.; Bouchard, P.; Monteith, G. Patterns and levels of endemism in the Australian Wet Tropics rainforest: Evidence from flightless insects. Invertebr. Syst. 2002, 16, 605–619. [Google Scholar] [CrossRef]
  84. Wilson, R.D.; Trueman, J.W.; Williams, S.E.; Yeates, D.K. Altitudinally restricted communities of Schizophoran flies in Queensland’s Wet Tropics: Vulnerability to climate change. Biodivers. Conserv. 2007, 16, 3163–3177. [Google Scholar] [CrossRef]
  85. Levins, R.; Pressick, M.L.; Heatwole, H. Coexistence Patterns in Insular Ants: In which it is shown that ants travel a lot from island to island, and what they do when they get there. Am. Sci. 1973, 61, 463–472. [Google Scholar]
  86. Pianka, E. Latitudinal Gradients in Species Diversity: A Review of Concepts. Am. Nat. 1966, 100, 33–46. [Google Scholar] [CrossRef]
  87. VanDerWal, J.; Shoo, L.P.; Williams, S.E. New approaches to understanding late Quaternary climate fluctuations and refugial dynamics in Australian wet tropical rain forests. J. Biogeogr. 2009, 36, 291–301. [Google Scholar] [CrossRef]
  88. Williams, S.E.; Bolitho, E.E.; Fox, S. Climate change in Australian tropical rainforests: An impending environmental catastrophe. Proc. R. Soc. Lond. B Biol. Sci. 2003, 270, 1887–1892. [Google Scholar] [CrossRef]
  89. Williams, S.E.; Shoo, L.P.; Isaac, J.L.; Hoffmann, A.A.; Langham, G. Towards an integrated framework for assessing the vulnerability of species to climate change. PLoS Biol. 2008, 6, e235. [Google Scholar] [CrossRef]
  90. Scheffers, B.R.; Edwards, D.P.; Macdonald, S.L.; Senior, R.A.; Andriamahohatra, L.R.; Roslan, N.; Rogers, A.M.; Haugaasen, T.; Wright, P.; Williams, S.E. Extreme thermal heterogeneity in structurally complex tropical rain forests. Biotropica 2017, 49, 35–44. [Google Scholar] [CrossRef]
  91. Scheffers, B.R.; Shoo, L.; Phillips, B.; Macdonald, S.L.; Anderson, A.; VanDerWal, J.; Storlie, C.; Gourret, A.; Williams, S.E. Vertical (arboreality) and horizontal (dispersal) movement increase the resilience of vertebrates to climatic instability. Glob. Ecol. Biogeogr. 2017, 26, 787–798. [Google Scholar] [CrossRef]
  92. Huey, R.B.; Kearney, M.R.; Krockenberger, A.; Holtum, J.A.M.; Jess, M.; Williams, S.E. Predicting organismal vulnerability to climate warming: Roles of behaviour, physiology and adaptation. Philos. Trans. Biol. Sci. 2012, 367, 1665–1679. [Google Scholar] [CrossRef] [PubMed] [Green Version]
Figure 1. Anonychomyrma gilberti, showing head (A) and lateral (B) views.
Diversity 12 00474 g001
Figure 2. Map of the Australian Wet Tropics (AWT) showing survey site locations for each subregion (naming of subregions follows [13]). Rainforest distribution is shown in green. BMC is the Black Mountain Corridor and represents a well-known biogeographic barrier for numerous taxa within the AWT.
Diversity 12 00474 g002
Figure 3. (AC) Maximum likelihood CO1 tree of 97 specimens of Anonychomyrma from the Australian Wet Tropics, with a specimen of the anceps complex of Iridomyrmex as an outgroup.
Diversity 12 00474 g003aDiversity 12 00474 g003bDiversity 12 00474 g003c
Figure 4. Head and lateral views of Anonychomyrma sp. C (A,B) and Anonychomyrma malandana (C,D).
Diversity 12 00474 g004
Figure 5. Head and lateral views of Anonychomyrma sp. H (A,B), sp. G (C,D), and sp. J (E,F).
Diversity 12 00474 g005
Figure 6. Head and lateral views of Anonychomyrma sp. I (A,B) and sp. S (C,D).
Diversity 12 00474 g006
Figure 7. Head and lateral views of Anonychomyrma sp. A (A,B), sp. L (C,D), and sp. M (E,F), which are all closely related to Anonychomyrma gilberti (Figure 1).
Diversity 12 00474 g007
Figure 8. Head and lateral views of Anonychomyrma sp. N (A,B), sp. F (C,D) and sp. K (E,F).
Diversity 12 00474 g008
Figure 9. Head and lateral views of Anonychomyrma sp. E (A,B).
Diversity 12 00474 g009
Figure 10. Head and lateral views of Anonychomyrma sp. O (A,B).
Diversity 12 00474 g010
Figure 11. Ranked abundance as total number of samples for each species from pooled data for all survey sites across five subregions in the Australian Wet Tropics.
Diversity 12 00474 g011
Figure 12. Variation in diversity and endemism among subregions. Subregions labelled from left to right along the north to south latitudinal gradient. (A) Mean (±SE) number of Anonychomyrma species per elevational site as grey bars and number of surveys per subregion as orange symbols. (B) Number of subregion endemics per subregion, and in brackets, the total species richness per subregion. Orange symbols are number of surveys per subregion.
Diversity 12 00474 g012
Figure 13. Diversity across elevation, pooling across five subregions. Mean number of Anonychomyrma species (±SE) per elevation as gray bars and number of surveys per elevation as orange symbols.
Diversity 12 00474 g013
Figure 14. Vertical distribution of Anonychomyrma species sampled in 105 surveys (out of 525 total surveys) from ground to canopy at 15 elevation sites at four subregions in the AWT. Pooled occurrence data from four subregions across the Australian Wet Tropics, with species ordered by number of survey occurrences from left to right. Each tile represents a 3-metre vertical band, coloured by proportion of total sample occurrence for each species. Numbers beneath species labels are total number of sample occurrences for that species (total samples = 3745). The maximum potential tree survey height for each species (based on occurrence in each surveyed tree) is: gilberti = 27 m, sp. G = 27 m, sp. C = 24 m, malandana = 24 m, sp. K = 24 m, sp. H = 27 m, sp. J = 21 m, sp. I = 24 m. Red represents high proportion of samples and yellow represents low proportion of samples.
Diversity 12 00474 g014
Figure 15. (A) Summed rainforest habitat suitability across all species in a grid cell based on the MaxEnt species distribution model for each species. (BJ) Modelled rainforest distributions for nine species of Anonychomyrma showing habitat suitability in the AWT bioregion. In all figures, blue is low habitat suitability, red is high habitat suitability, and grey background is the outline of the AWT region.
Diversity 12 00474 g015
Table 1. The subregion locations and elevation range (maximum–minimum elevation) and number of survey points of 22 species of Anonychomyrma in the Australian Wet Tropics, species are ordered from their north to south subregion distribution, and then by number of survey points, n indicates number of survey points. BMC position indicates the positions of each subregion north or south of the Black Mountain Corridor, a well-known biogeographic barrier. The full elevation range of rainforest habitat is shown in brackets for each subregion.
BMC Position NorthNorthNorthSouthSouth
Region FinneganWindsorCarbineAthertonSpec
(200–800)(900–1300)(100–1200)(100–1000)(350–1000)
Speciesn
gilberti96200–800900–1300100–1200100–1000350–1000
sp. G50200–800900–1300100–1200400–1000350–800
sp. B1200
sp. C22 1100–13001000–1200
malandana13 1100–130012001000
sp. E8 900–1100
sp. K7 900–11001000800800
sp. H6 13001200
sp. F1 1100
sp. Q1 900
sp. T1 1100
sp. L1 1200
sp. P1 1000
sp. J4 200–1000
sp. O4 400–800
sp. I2 800–1000
sp. N1 1000
sp. R1 600
sp. S1 1000
sp. U1 800
sp. M11 800–1000
sp. A10 350–1000
Table 2. Species distribution model outputs for nine species showing the three highest ranking environmental variables and their permutation importance in the model. AUC = area under the curve, a value between 0 and 1 indicates model performance, and higher AUC scores indicate better model fit. n = number of unique survey location points for each species. Max T hottest month = Maximum temperature of the hottest month, Rain seasonality = Rainfall seasonality, Rain wettest month = Rainfall of the wettest month, Temp seasonality = Temperature seasonality.
SpeciesnAUCVariablePermutation Importance
gilberti960.798Max T hottest month31.2
Rain wettest month21.8
Rain seasonality22.6
sp. G500.754Max T hottest month64.4
Rain seasonality12.3
Rain wettest month11.4
sp. C220.971Max T hottest month95.7
Isothermality3
Rain wettest month0.7
malandana130.958Max T hottest month82.6
Rain wettest month14.7
Rain seasonality2.4
sp. M110.992Rain seasonality48.9
Max T hottest month39.4
Rain wettest month10.5
sp. E100.948Max T hottest month72
Rain wettest month13.5
Isothermality11.9
sp. A80.971Rain seasonality73.4
Max T hottest month23.7
Temp seasonality2.8
sp. K70.892Max T hottest month95.9
Rain wettest month2.1
Isothermality1.3
sp. H60.99Max T hottest month98.7
Rain seasonality1.1
Isothermality0.2
Publisher’s Note: MDPI stays neutral with regard to jurisdictional claims in published maps and institutional affiliations.

