Article

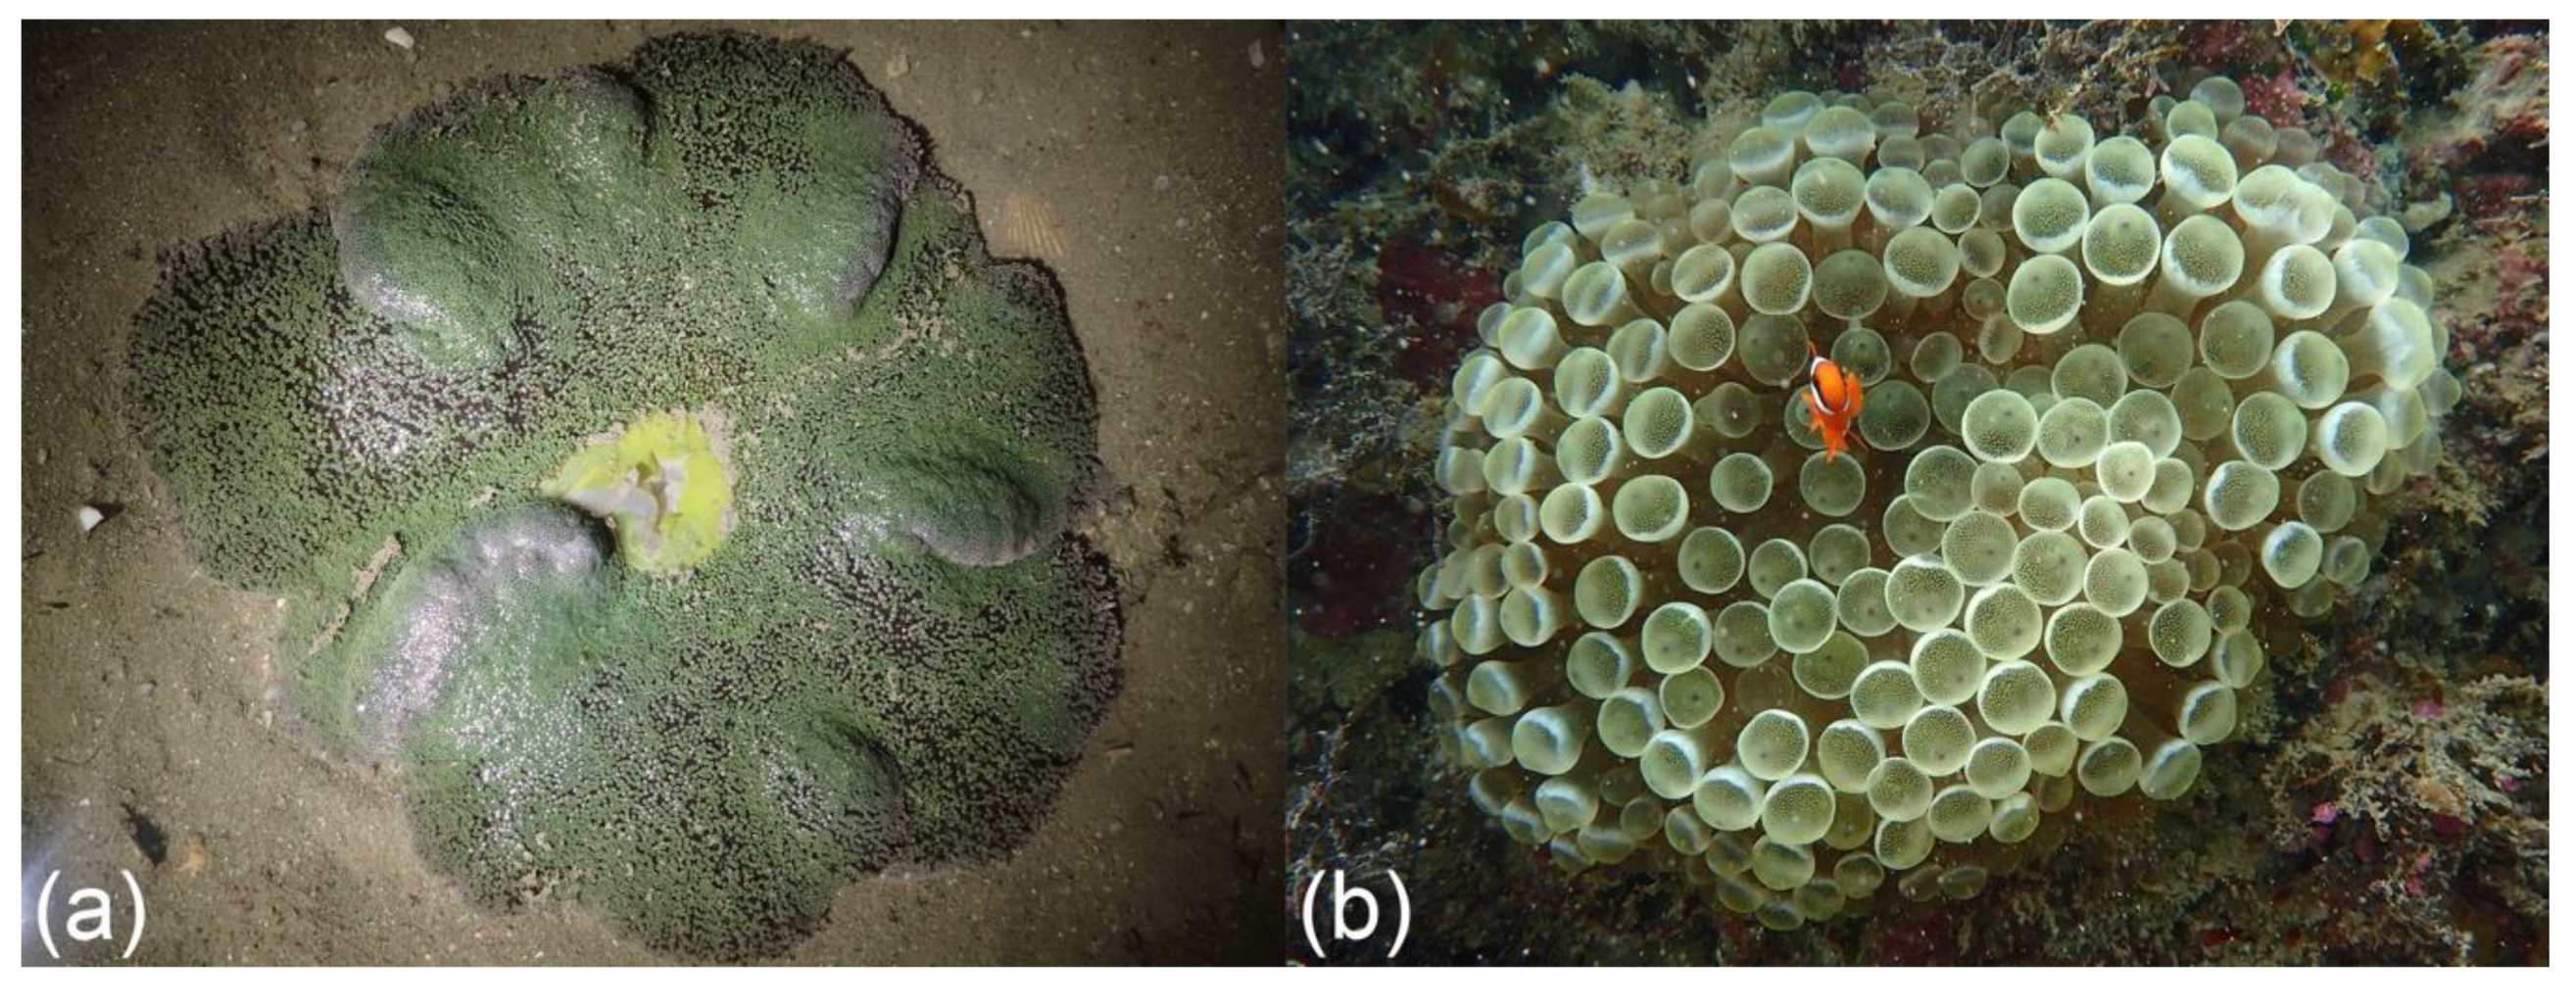
Reproduction in Urbanised Coastal Waters: Shallow-Water Sea Anemones (Entacmaea quadricolor and Stichodactyla haddoni) Maintain High Genetic Diversity and Panmixia

1
Department of Biological Sciences, National University of Singapore, 16 Science Drive 4, Singapore 117558, Singapore
2
Tropical Marine Science Institute, National University of Singapore, 18 Kent Ridge Road, Singapore 119227, Singapore
3
National Biodiversity Centre, National Parks Board, Singapore 259569, Singapore
4
Centre for Nature-Based Climate Solutions, National University of Singapore, 16 Science Drive 4, Singapore 117558, Singapore
*
Author to whom correspondence should be addressed.
Diversity 2020, 12(12), 467; https://doi.org/10.3390/d12120467
Submission received: 11 August 2020 / Revised: 27 November 2020 / Accepted: 30 November 2020 / Published: 8 December 2020
(This article belongs to the Special Issue Molecular Biodiversity of Marine Invertebrates)

Abstract

:
Sea anemones are sedentary marine animals that tend to disperse via planktonic larvae and are predicted to have high population connectivity in undisturbed habitats. We test whether two sea anemone species living in two different tidal zones of a highly disturbed marine environment can maintain high genetic connectivity. More than 1000 loci with single-nucleotide polymorphisms (SNPs) were obtained with double-digest RADseq for 81 Stichodactyla haddoni and 99 Entacmaea quadricolor individuals to test for population genetic structure. We find evidence that both species predominantly propagate via sexual reproduction, and asexual reproduction is limited. We observe panmixia that indicates the absence of effective dispersal barriers for these species living in a highly anthropogenically disturbed environment. This is positive news for both species that are also found in the aquarium trade. More fundamentally, our results suggest that inhabiting different parts of a shallow reef may not affect a species’ population connectivity nor favour asexual reproduction.

1. Introduction

The construction of artificial coastal structures and increased shipping traffic can potentially interfere with the population connectivity of marine species and are thought to have negative effects on sedentary species with limited dispersal abilities [1,2]. Fortunately, many sedentary marine species have planktonic larvae that aid in dispersal [3,4,5,6] given that they can be transported over large distances via oceanic currents before settlement [6]. Broadcast spawning in anthozoans is considered the predominant method of reproduction, used in both hermaphroditic and gonochoric species [5]. The range of pelagic larval dispersal could be dependent on factors like the influence of currents (passive distribution for longer distances). However, short-distance dispersal of pelagic larvae has been speculated to be dependent on behaviour i.e., larvae remaining close to the benthos [7]. A good example of sedentary marine organisms that use broadcast spawning for maintaining panmixia are sea anemones (Cnidaria: Anthozoa: Actiniaria) [5], but how effective is this reproductive mode when living in heavily impacted marine environments? Reduced genetic diversity [8,9] and population connectivity [10] have been detected in populations settling on artificial structures. These are thought to be due to ecological and functional differences between natural and artificial structures and/or ‘phenotype-environment’ unsuitability. Pollution in heavily impacted environments is furthermore known to cause mutations [11] with sublethal effects [12], which suggests that marine species in heavily disturbed environments could face a bleak future especially if the population connectivity is low. It would interfere with re-population and lower the capacity to recover from disturbances. A decrease in the ability of populations to adapt to rapidly changing micro-conditions might occur [13,14,15], given that higher genetic diversity increases resilience of populations and the ecosystem to disturbances [16,17,18]. Population genetic data also allow for reconstructing demographic responses such as effective population size, genetic diversity and migration rates to contemporary stressors. The data could therefore also inform conservation prioritisation and management [19]. This is particularly important for economically important and endangered species [20,21,22].
Sedentary animals such as sea anemones have reproductive strategies that are selected to increase their chances of survival [5,23,24,25]. On the one hand, most species reproduce sexually, which increases the genetic diversity and allows for adaptation in dynamic and heterogeneous environments [26]. On the other hand, asexual modes allow for quickly reproducing successful genotypes that are well-adapted to prevailing stable and homogeneous environments [27,28]. In sea anemones, sexual reproduction primarily involves broadcast spawning while asexual reproduction may occur by pedal laceration, longitudinal fission or transverse fission [29,30]. In species with a predominantly sexual mode of reproduction, highly connected populations across different spatial scales and higher genetic diversity have been observed [31,32,33]. Conversely, species with asexual reproduction typically show reduced dispersal and stronger genetic isolation [34,35,36,37], because individuals are likely to attach to the first hard surface that they encounter [38].
Recent observational studies have demonstrated that most sea anemone species reproduce sexually [5,23,39,40,41,42]. For the sea anemone Stichodactyla haddoni (Figure 1a), there is no evidence of sexual reproduction—asexuality appears to be the main mode of reproduction [42]. On the other hand, sea anemones like Entacmaea quadricolor (Figure 1b) [5,23] and S. gigantea [33] occasionally perform asexual reproduction via longitudinal fission [23,30,43]. Unfortunately, our understanding of the reproductive biology of sea anemones is poor because obtaining high-quality observational data for long-lived and slow-growing anemones is time-consuming [39,44]. In the marine environment, difficulties to directly access, track and monitor marine species in situ further challenge the studies on these animals. Genetic tools on the other hand, can provide broad insights based on studying the outcomes of reproduction. These tools also allow for readily distinguishing between individuals resulting from sexual or asexual reproduction.
Very little is known about the population genetics of sea anemones. Most published studies used enzyme electrophoresis (e.g., Actinia bermudensis [32]; A. tenebrosa [26,28,34]; Bunodosoma caissarum [32]; Epiactis spp. [45]; Metridium senile [27] or microsatellite markers (e.g., A. tenebrosa [37]; S. gigantea and Heteractis magnifica [33]), which provided limited information on population connectivity. Fortunately, the use of single nucleotide polymorphisms (SNPs) for sea anemones is in recent years becoming more popular [46,47]. Genetic markers with high levels of resolution are required especially to discern between reproductive methods. For anthozoans, this requires broad sampling of the genomes because they are known to have few DNA markers with good resolving power [48,49]. Genome-wide SNPs mined using restriction site-associated DNA sequencing methods are thus ideal for such taxa. They can be rapidly obtained even for non-model organisms as prior genomic information of the subjects is not required [50].
The present study assesses the population genetic structure of two sea anemone species living in urbanised environments using these SNP markers. Stichodactyla haddoni and E. quadricolor are shallow-water species thought to reproduce predominantly via broadcast spawning [5,41,51] and those inhabiting highly urbanised coasts such as Singapore’s are likely under chronic stress because of the extensive coastal modifications [52,53]. It would be important to know whether they can maintain population connectivity and high genetic diversity under adverse conditions. The island nation has (1) increased in land area by 30% since the 1960s through land reclamation [54,55,56,57], leading to dramatic losses of natural habitats (e.g., 60% of coral reefs; [58]); (2) hardened its coasts with seawalls that constitute 63% of the coastline [53], which could lead to fragmentation and reduced connectivity [59]; (3) extremely high turbidity due to the reclamation and dredging [58,60]; and (4) extremely high shipping traffic (i.e., 2.85 billion gross tonnage of vessel arrivals in 2019 [61]) that could also disrupt larval dispersal and reduce connectivity.
High levels of connectivity are common in species with a planktonic stage and deeply linked to its pelagic larval duration ranging from less than one day to 90 days—e.g., ascidians Ciona robusta, C. savignyi, Styela clava [62]; the gastropod Haliotis rubra [63]; reef corals Platygyra sinensis [64] and Acropora digitifera [65]; the clownfish Amphiprion polymnus [66]; the sea star Protoreaster nodosus [67]; the bicolour damselfish Stegastes partitus [68]; and mussel Mytilus edulis [69]. However, unique population migration patterns and genetic divergence due to various biological and physical characteristics have been observed even at fine scales, e.g., in the coastal cod Gadus morhua [70], Asterinidae sea stars [71], American lobster (Homarus americanus) [72] and bivalve (Brachidontes sp.) [73]—where geographic distances can be as low as 40 km. Specific habitat choices (e.g., rocky surfaces, sandy platforms, seagrass meadows) play an essential role in determining the successful spread and establishment of populations in new environments [6,74] and can influence connectivity patterns. For instance, higher rates of genetic divergence have been observed in the intertidal compared to the more stable subtidal zones [75]: intertidal species not only have smaller windows of opportunity for dispersal, but are also under stronger, divergent selection pressures (e.g., high wave energy and greater sun exposure) [76]. In this study, we test the effects of different divergent selective pressures on two species that occupy different tidal zones [75]. Stichodactyla haddoni and Entacmaea quadricolor are commonly found in the coastal environments of Singapore [77]. While S. haddoni is found primarily in the intertidal zone in soft sand, E. quadricolor mostly grows on shallow subtidal coral reefs [77,78,79]. Larvae of E. quadricolor have been observed to survive up to 59 days after spawning in in situ experiments, with peak settlement of larvae at 10 days [42], granting them time to be thoroughly mixed within Singapore waters before settlement. Further research is required to determine precisely its pelagic larval duration that can affect its connectivity patterns [5]. In addition, Australian E. quadricolor has been observed to spawn annually at the start of the year [51]. However, the spawning periods and pelagic larval duration of S. haddoni remain unknown.
Stichodactyla haddoni and E. quadricolor are two of ten sea anemones known to associate with anemonefishes [42,80]. These are thus highly sought after in the aquarium trade, with high potential for overexploitation [81]. We sought to discover the population connectivity of two shallow-water sea anemone species that live in different parts of the reef in urbanised waters and inferred the modes of reproduction of both species using genetic tools. Here, we provide the first information on genetic diversity and reproductive mode via genomic markers, which will potentially be important for managing the trade [42,82] and population assignment of confiscated animals.

2. Materials and Methods

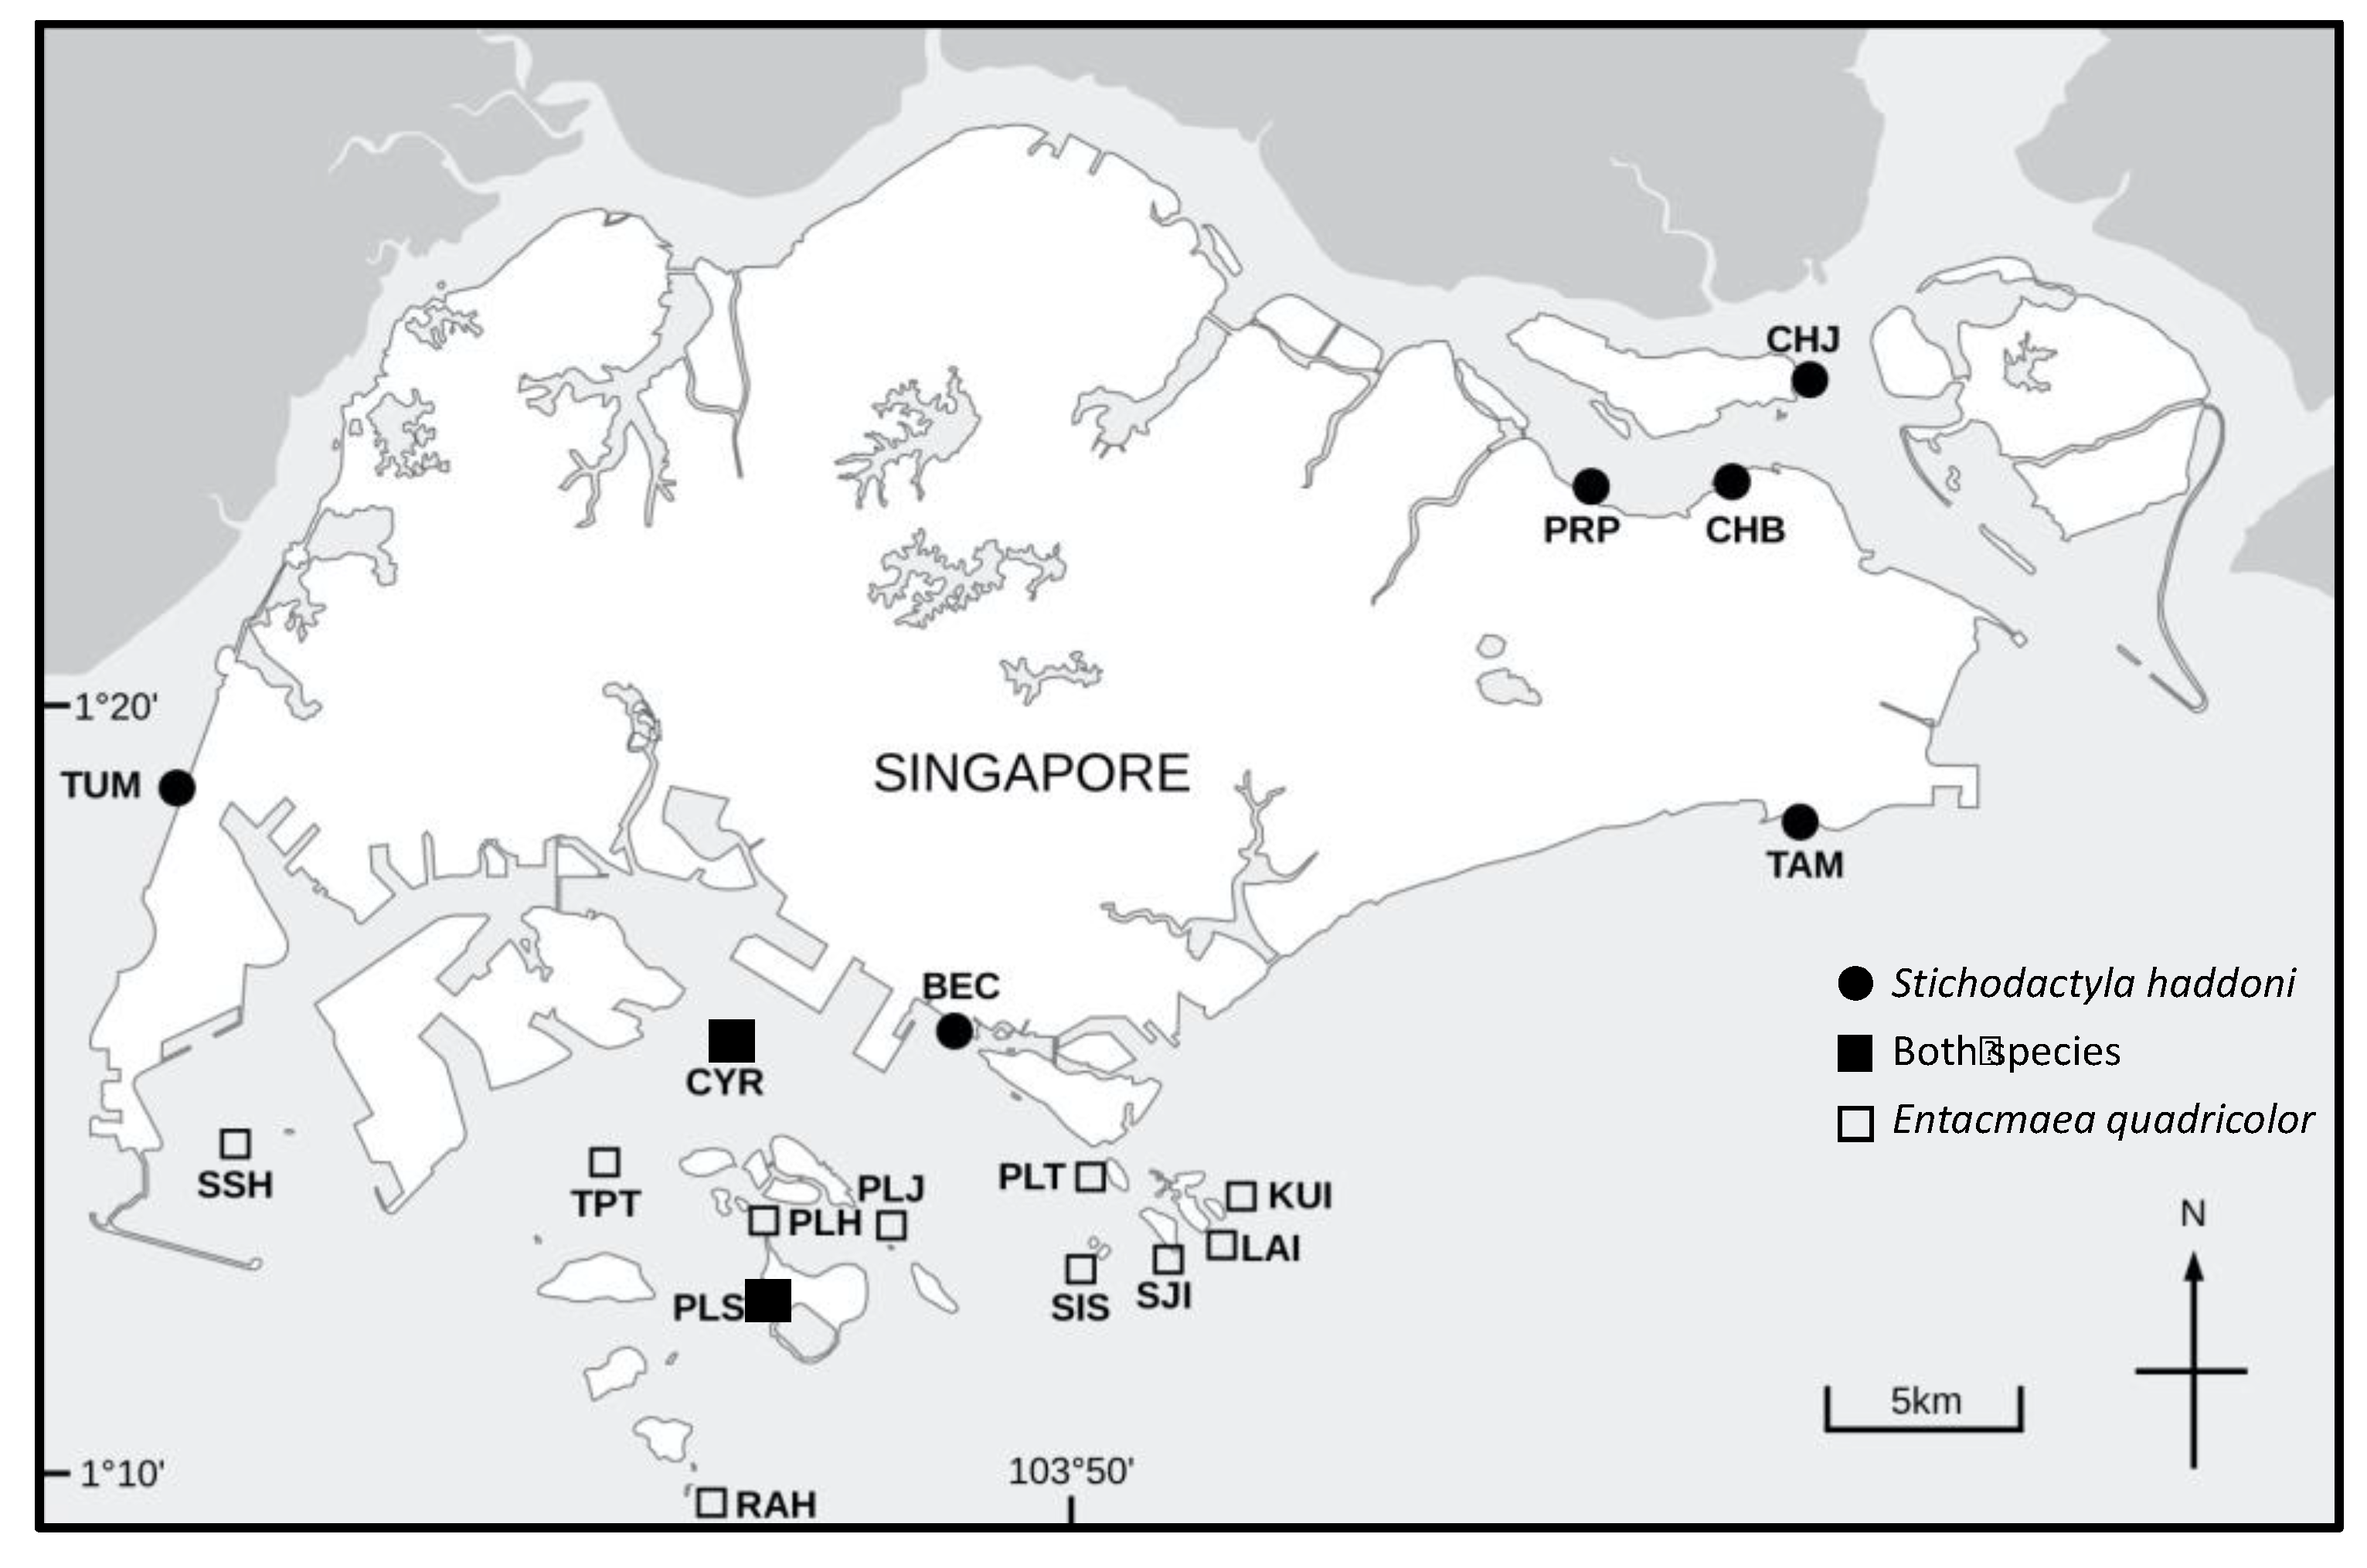
2.1. Sample Collection

Stichodactyla haddoni was sampled from the intertidal zones at eight sites (n = 86) while E. quadricolor was sampled via SCUBA from subtidal zones at 12 sites (n = 106) in Singapore (Figure 1 and Figure 2). Abbreviations for the sampling sites are defined in Figure 2, and full details of the collection sites and each sample can be found in the Supplementary Materials (Table S1). Each site was searched for three to five hours to ensure adequate sampling. Individual anemones were imaged in situ for morphological confirmation of species identity, as voucher specimens were not permitted under our collection permit (NP/RP15-088). Tissue subsamples were collected using forceps and scissors, sampling from the body column as much as possible instead of the tentacles to avoid high nematocyst and Symbiodinium densities. These were preserved in 100% molecular-grade ethanol and kept at −20 °C until further processing. At each site, a minimum of five individuals were collected and processed. Despite the increased sampling efforts, only three E. quadricolor individuals were observed at Raffles Lighthouse (RAH). However, RAH was retained as a key site that represents the southernmost offshore island of Singapore.
All laboratory processing and data analyses were performed in a similar manner for both species, unless otherwise stated.

2.2. DNA Extraction

For each sample, genomic DNA was extracted from a 1 × 1 mm piece of the tissue sample using a modified hexadecyltrimethylammonium bromide (CTAB) DNA extraction protocol [83]. Each DNA pellet was eluted in 25–45 μL of molecular grade water.

2.3. DNA Barcoding for Species Confirmation

DNA barcoding was performed to confirm species identifications and ensure that population genetic analyses would not be contaminated by misidentified species. COIII DNA barcoding was first performed for all samples to ensure that the input samples for population genomic analyses were of the same species. This marker successfully identified E. quadricolor individuals but showed limited barcoding gap at species level for the genus Stichodactyla, and was hence unable to delimit Stichodactyla species. The internal transcribed spacer 1 (ITS1) marker was thus further barcoded for S. haddoni, and 28S rRNA was also sequenced to verify the morphological identification of E. quadricolor.
The internal transcribed spacer 1 (ITS1) marker was amplified for S. haddoni using the 18SUniv.fw primer [84] with a reverse primer designed for this study (STI_ITS1rev: 5′-GCG TTC AAA GAT TCG ATG ATT CAC T-3′). To allow for multiplex sequencing on the Illumina platform, a 9-bp tag was added to the 5′-end of these primers following Meier et al. [85]. The amplification cycling profile was 95 °C for 2 min, 30 cycles of 95 °C for 30 s, 60 °C for 1 min and 72 °C for 1 min, with a final extension at 72 °C for 2 min. Each 25 μL reaction contained 1 × reaction buffer, 0.2 mM of each dNTP, 0.4 μM of each primer and 1 U BioReady rTaq polymerase and 1–2 μL extracted DNA. Successfully amplified products were pooled and purified using SureClean™ (Bioline, London, UK) following the manufacturer’s instructions, and sequenced as part of an Illumina MiSeq 2 × 251-bp run. The reads were demultiplexed, and resulting barcodes filtered for quality using the barcoding pipeline and scripts in Meier et al. [85], as described in Wang et al. [86]. MAFFT ver. 7 was used to align ITS1 sequences. Objective clustering [85] was used to obtain a cluster dendrogram of barcodes, grouping sequences based on 3–5% pairwise-distances for all successfully obtained barcodes [87].
For E. quadricolor, the primers LSUrDNAF and LSUrDNAR [88] were used to amplify the 28S rRNA. Cycling conditions included a step-up reaction of four cycles of 94 °C for 30 s, 50 °C for 1 min and 72 °C for 2 min, followed by 25 cycles of 94 °C for 30 s, 57 °C for 1 min and 72 °C for 2 min. Successfully amplified PCR products were purified using Sera-Mag™ Magnetic SpeedBeads (GE Healthcare, Chicago, IL, USA) in 18% PEG buffer (1M NaCl, 10mM Tris-HCl, 1 mM EDTA, pH 8) (hereon referred to as SeraMag-PEG). A SeraMag-PEG:DNA ratio of 0.96 was used to retain ≥300-bp fragments. The PCR products were prepared for Sanger sequencing using BigDye™ v. 3.1 (Applied Biosystems, Foster City, CA, USA), purified using PureSEQ beads following manufacturer’s instructions, and sequenced on a 3730XL DNA analyser (Applied Biosystems). Sequences were assembled, edited and translated to check for stop codons, using Geneious v. 11 [89]. BLAST searches against the GenBank database were used to check for species identification.

2.4. ddRADseq Library Preparation and Sequencing

After omitting misidentified specimens and sites with small sample sizes, 81 S. haddoni and 99 E. quadricolor samples were retained for SNP analyses. Up to four DNA extraction replicates were included for each species to assess the repeatability of our methods, aid in the identification of biological clones and optimise bioinformatic pipeline parameters [90,91]. These were from BEC (STI063R), CHB (STI115R), CYR (STI129R), LAI (ANE083R), KUI (ANE039R), PLH (ANE055R), SJI (ANE077, a resample of ANE075). DNA quality and approximate quantity assessments were made using 1% agarose gels and the Qubit® dsDNA BR Assay kit with a Qubit Fluorometer (Invitrogen™, Carlsbad, CA, USA).
SNPs were randomly subsampled from across each genome using the ddRADseq method following the protocol in Tay et al. [67], with some modifications. Briefly, approximately 100 ng of DNA from each sample was simultaneously digested with restriction enzymes and ligated to Illumina-compatible adapters [92] at 37 °C for four hours, followed by an additional step of 65 °C for 20 min to inactivate EcoRI-HF and DNA ligase. This reduces the formation of chimeric DNA fragments that would become false loci. Each reaction contained 11.5 U EcoRI-HF, 2.3 U MspI, 10 × T4 DNA ligase buffer, 50 mM NaCl, 0.385 μM P1E adapter, 0.385 μM P2M adapter, 185 U T4 DNA ligase and 0.05 mg/mL bovine serum albumin. The products were pooled, as they could be identified by the different indexes and barcodes (Table S1), and purified using a 1.2 SeraMag-PEG:DNA ratio. A narrow selection for 400-bp fragments was performed on the adapter-ligated products using the PippinPrep (2% dye-free cassette, EF Marker E v2), and purified again using SeraMag-PEG. Each pool of 46–48 samples was assigned a specific Illumina index (details in Table S1), and triplicate PCRs were performed per pool to amplify successfully ligated DNA fragments. Each 25 μL reaction contained 1 × Q5 reaction buffer, 800 μM dNTPs, 0.5 μM of each PCR primer and 0.2 U Q5® HF DNA polymerase (New England Biolabs, Ipswich, MA, USA). The PCR cycling protocol was 98 °C for 1 min, 12 cycles of 98 °C for 10 s, 68 °C for 30 s and 72 °C for 30 s, ending with 72 °C for 10 min. Products from each set of triplicates were pooled, purified using the SeraMag-PEG and quantified using the Qubit® dsDNA HS Assay kit before combining into a final pool. All 187 libraries were sequenced across three lanes of Illumina Hi-Seq 4000 platform (2 × 151 bp), with a 40% spike of whole-genome sequencing DNA libraries to increase the base diversity (Table S1).

2.5. Population Genomic Analyses

2.5.1. Single-Nucleotide Polymorphism Data

Read quality was assessed using FastQC v. 0.11.2 [93], and processed using STACKS v. 1.24 [94]. Read 1 of each sequencing run was demultiplexed using process_radtags, and trimmed to 134 bp according to read quality for each run. Reads for each individual were filtered for potentially chimeric sequences that may have been generated during the adapter-ligation step, by removing the reads that contained the restriction enzyme recognition sites (using a custom bash script from [67]). Loci were assembled and SNPs were called using the de novo pipeline in STACKS separately for each anemone species. To assess the sensitivity of the resulting SNP sets to SNP calling parameter settings, nine combinations of different settings were tested (Table S2). Parameter settings incorporated the recommendations by Paris et al. [95]. For each individual, putative loci were assembled from the reads that were demultiplexed and filtered in ustacks. A reference catalogue of consensus loci was created from across 18 S. haddoni and 22 E. quadricolor individuals, selected at random, as there were not closely related whole genomes available for mapping. Potential contaminants were identified and removed from this library by matching against genomes of likely contaminants from five datasets (bacteria, human, pomacentrid fishes, Symbiodinium sp., viruses) via BLAST (accession numbers can be found in Table S3). A low E-value of 10−1 was used to conservatively remove even the poor matches that may represent contaminants. To define the locus set per sample, the putative loci assembled in ustacks were then matched to the reference catalogue using sstacks, while SNPs were called using the module populations. The final SNP sets produced by STACKS were put through further filtering to ensure data robustness. Minor alleles that may have technical errors, were removed using PLINK/SEQ (0.09) (minor allele count, MAC = 3–206 for Entacmaea quadricolor, and 3–174 for Stichodactyla haddoni) (accessed from https://atgu.mgh.harvard.edu/plinkseq/download.shtml). Clones were identified through pairwise-similarity analyses [96] and removed to avoid overrepresentation by particular genotypes [46]. Missing data were filtered using vcftools (0.1.15, v4.1) [97], excluding individuals with more than 10% missing data. We also generated a dataset that excluded loci failing the Hardy–Weinberg equilibrium test (p < 0.05) with vcftools. Finally, potential outliers were identified using BayeScan v 2.1 [98] (False detection rate, FDR = 0.05) and removed. All file format conversions were performed using PGDSpider 2.1.0.2 [99].

2.5.2. Population Genomic Structure and Diversity Analyses

Genetic diversity indices such as expected and observed heterozygosities (HS and HO), inbreeding coefficient (GIS) and pairwise FST values were estimated using GENODIVE 2.0b27 [100].
Signatures of genetic divergence among the sampled locations were first assessed using a principal components analysis (PCA), population model-free approach, to analyse relatedness via identity-by-descent measures as implemented in SNPRelate [101]. This was performed across all combinations of SNP assembly parameters, to assess the robustness of the biological results across the different SNP calling parameter combinations. Subsequent analyses were performed on just one batch per species (sti_b1.10miss and ane_b3.10miss; Table S4) which maximised the number of SNPs retained, while ensuring that replicates were more than 98.79% and 94.21% identical for S. haddoni and E. quadricolor respectively (Tables S5 and S6). Other assessments of genetic structure performed include (1) STRUCTURE [102] and StrAuto [103]. Global ancestry can be estimated and underlying genetic structure among the individuals based on allelic frequencies can also be detected through analysing ten runs each per model of K genetic clusters from one to ten [104]. Individuals are assigned to genetic clusters probabilistically based on the assumptions of Hardy–Weinberg equilibrium between alleles and linkage equilibrium between loci [102,104]. To determine the most likely model of genetic clusters, the Evanno method [105] was implemented in the web version of STRUCTURE HARVESTER v0.6.94 [106]. CLUMPP 1.1.2 [90] was used to match the ten sets of genetic clustering results, and the final subpopulation assignment probabilities were visualised using DISTRUCT 1.1 [107]. (2) An analysis of molecular variance (AMOVA) based on an infinite allele model (Fs-analogue) with 10,000 permutations, with the sampling locations defined as groups, and (3) pairwise FST values was calculated using AMOVA FS with 999 permutations in GENODIVE. While large samples sizes (more than six) were previously thought to be necessary to accurately infer FST values, small sample sizes can still be accurate if a large number of bi-allelic genetic markers is used (recommended number of SNP loci >1000; lowest SNP count here = 1196) [108].

3. Results

3.1. DNA Barcoding for Species Confirmation

Forty-five ITS1 barcodes were successfully obtained for S. haddoni, which included samples from all sampling sites (Table S7), after removing contaminating signals and samples with low coverage. One sample (STI020) matched one of two extraction negatives and one PCR negative passed the threshold. These were discarded before the clustering analysis was conducted. Objective clustering was performed and used for species identification as no ITS1 sequences were available on BLAST (Figure S1). Reads that were confirmed to be S. haddoni were used for analysis.
28S DNA barcodes for 100 E. quadricolor specimens (excluding all replicates other than ANE077) matching by at least 99% to E. quadricolor on GenBank were considered to be positively identified. The remaining six (ANE017, ANE025, ANE044, ANE049, ANE050, ANE052) had a 99% match to Heteractis magnifica, and in situ images further confirmed them to likely be misidentified (Figure 1, Figure S2). These were excluded from subsequent ddRADseq library preparations (Table S1).
All DNA barcodes obtained have been deposited in GenBank (Accession numbers 28S: MT05328-075433, ITS1: MT101752-101798).

3.2. Population Genomic Analyses

3.2.1. Quality Filtering of Data and SNP Calling

A total of 763,762,623 reads were obtained across all three sequencing runs, with most samples represented by at least 106 reads (Table S1). Coverage of putative loci for S. haddoni ranged from 14 to 134 reads (mostly >50) under the parameter settings m = 3, M = 2, N = 4 (batch 1, Table S8). For E. quadricolor, coverage ranged from 32 to 224 reads (mostly >50) under the parameter settings of m = 7, M = 2, N = 4 (batch 3, Table S8).
More than 90% of the SNPs called were retained for both species, after filtering for potential contaminants. These data have been deposited in the GenBank SRA (Accession numbers: SAMN15566063, SAMN15566064, SAMN15566065). Outlier analyses identified two loci potentially under directional selection for both species (i.e., outlier loci) (Figure S3).
The pairwise allelic similarity analysis to identify and remove potential clone-mates found high repeatability across all the sample replicate pairs (≥98.79% match for S. haddoni and ≥94.21% match for E. quadricolor, Table S6). No clones were identified among the Stichodactyla samples. Three pairs of potential clones were identified for E. quadricolor, each from the same corresponding sites, Kusu Island (KUI), Terembu Pempang Tengah (TPT) and Sisters Island (SIS) (Table S6). Clonality in these pairs was further confirmed using in situ pictures of the individual anemones to ensure that they were not due to repeated sampling of the same individuals. ANE022 (TPT) and ANE024 (TPT) were confirmed to be different individuals and hence likely biological clone mates, while the two other pairs (ANE036 (KUI)-ANE095 (KUI) and ANE008 (SIS)-ANE079 (SIS)) were unconfirmed as there were no clear images. An additional pair, ANE065 (SIS) and ANE088 (Pulau Tekukor, PLT), was only 92.09% similar, lower than the percentage similarity of replicates (94.21%), but it remained possible that they might be biological clone mates from different sites as there was a large gap in percentage similarity between the ANE065-ANE088 pair and all other anemone pairwise comparisons (Figure S4 and Table S6). Replicate samples and potential clone-mates were removed for downstream analyses.
After filtering for minor alleles, missing data and clones/replicates, 1853 to 2289 SNPs were retained for S. haddoni, while 2758 to 4073 SNPs were retained for E. quadricolor (Table S4). The final set of samples analysed included 69 to 78 S. haddoni, and 89 to 93 E. quadricolor individuals which passed all filtering criteria. As all batches of SNP datasets with different parameter settings produced similar biological interpretations, we present results based on the smallest SNP datasets (sti_b1.10miss and ane_b3.10miss) (Table S4). Outlier frequencies per sampling site were also plotted (Figure S5).

3.2.2. Population Genomic Structure

Genetic panmixia was apparent for both species across all genetic clustering analyses as no clustering of individuals was observed in both PCA and STRUCTURE analyses for both species (K = 1; Figure 3 and Figure 4, Figure S6). Dataset that excluded loci failing the Hardy–Weinberg equilibrium test also yielded the same result; hence, results presented were of datasets that included such loci.
Although the amount of variation captured in the first two PCs in both species was low (≤2.58%, Figure 3), the PCAs performed across all the datasets showed similar panmictic patterns. A tighter clustering of individuals was always observed for E. quadricolor as compared to S. haddoni. Interestingly, three individuals from Pulau Semakau (PLS) and one individual from Cyrene reefs (CYR) appeared to be diverging from the main genetic cluster of S. haddoni (Figure 3 and Figure 4), and they were from the only offshore sites sampled for this species.
The pattern of genetic panmixia was also reflected in the partitioning of genetic variation, as most of the genetic variation (>0.818) was found within individuals, compared to the variation between populations which was the lowest (<0.003) for both species (Table S9). Similarly, low pairwise FST values were observed for both species, with only one pair of sites for S. haddoni being significant after Bonferroni correction (Table 1). This appears to be driven by four individuals, which appear to have slightly more distant genotypes as reflected in the PCA and STRUCTURE plots (Figure 3 and Figure 4).

3.2.3. Diversity and Reproduction

Our analyses suggested higher genetic diversity among S. haddoni individuals than E. quadricolor in Singapore. Pairwise allelic similarity analyses found one possible pair of biological clones, which indicated the possibility of clonal reproduction in E. quadricolor. Stichodactyla haddoni individuals were all genetically distinct, and no clones were discovered. Even with removal of these potential clone-mate pairs, diversity indices remained higher in S. haddoni compared to E. quadricolor (expected heterozygosity (HS) S. haddoni HS = 0.282 vs. E. quadricolor HS = 0.239; Table 2). This was also reflected in the overall lower inbreeding-coefficients (GIS) of S. haddoni (0.118) compared to E. quadricolor (0.201).

4. Discussion

Population connectivity is thought to be crucial for the long-term survival of a species, but it can be compromised by anthropogenic stressors. This study used genomic tools to understand the population demographics and assess the reproductive modes of sea anemones in a small but highly disturbed marine environment. While recent studies have suggested that urbanised sites with artificial surfaces might provide new niches and function as ‘marine stepping-stones’ that aid in population connectivity [69], such surfaces provide new environments for all species, native species and non-native invasive species alike [109]. Artificial surfaces such as seawalls that are ubiquitous along Singapore’s coastline, could aid the colonisation and serve to connect populations for marine organisms like molluscs [110], crustaceans, polychaetes [111] and hard corals [57,112]. Seawalls serving as a ‘stepping-stone’ remains to be tested for sea anemone species that naturally prefer coral-dominated or sandy substrates, and not hard surfaces like seawalls [79]. At a small geographic scale such as in Singapore, connectivity depends heavily on the pelagic larval duration, which is undetermined for both species here, but enough to maintain connected populations. Here, we find near-genetic panmixia and high genetic diversity are maintained in both species that live in environments with constant anthropogenic stress and inhabiting different tidal zones. Similar population genomic signatures have previously been described for Singapore’s waters in other species belonging to very different taxa (e.g., the knobbly seastar Protoreaster nodosus and coral Platygyra sinensis [64,67]). The results of the present study thus add to the emerging pattern that having a planktonic dispersive stage is sufficient for maintaining panmixia in marine waters that are exposed to high levels of anthropogenic disturbances.
Effective dispersal of planktonic life stages is likely driven by the prevailing hydrodynamics. Unfortunately, the spawning periods for both anemone species in Singapore are unknown, but E. quadricolor and other scleractinian corals are known to spawn at the start of the year between January and April in eastern Australia [51,113]. If the anemones in Singapore were to spawn at a similar time, the high levels of connectivity observed would be driven by hydrodynamics and possibly chemical cues from the mass larval exchange among the southern islands of Singapore following coral spawning during the same period from March to April [114,115,116]. The general westward flow of currents in the southern islands of Singapore and semi-diurnal tides caused by strong hydrodynamic pressure gradients result in mixing between the low intertidal and subtidal zones of Singapore’s reefs. This provides planktonic larvae with time and opportunity to mix thoroughly within Singapore’s waters before settlement. This may explain the high connectivity of the sea anemone populations [88,116,117].
Kelly and Palumbi [75] previously found stronger population structuring in the intertidal compared to subtidal species, which they linked to the harsher intertidal environment. The present study, however, finds no such differences in the population genomic patterns of S. haddoni and E. quadricolor despite inhabiting largely the high intertidal and shallow subtidal areas, respectively. This suggests that the mixing of surface water provides sufficient opportunities for the planktonic larvae to travel between sites [88]. In addition, there may be some overlap in their distribution, as some E. quadricolor individuals may be visible at intertidal areas during (extremely) low tides, possibly due to the vertical compression of habitats along Singapore’s coasts [118,119].
It is remarkable that even though there was no evidence for spatial structuring by site, there appeared to be some structuring at the individual level for S. haddoni. Three individuals from PLS and one from CYR seemed to be diverging from the main genetic cluster (Figure 2 and Figure 3). These were collected from offshore sites away from the samples forming the main cluster of S. haddoni. This might be due to the arrival of recent immigrants from genetically distinct populations in Malaysian or Indonesian waters. These waters may harbour the intermediate genotypes that were not observed in our study. An alternative interpretation would be early signs for sympatric speciation. To test these hypotheses, further sampling across time focusing on the offshore sites in Singapore and beyond national boundaries are needed.
Overall, it appears that broadcast spawning is a good predictor for a species’ population genetics in Singapore waters [64,67]. The genetic diversity was found to be high in both study species here (e.g., compare expected heterozygosity values in Table 2 to other sea anemone species in [46]), and also in other broadcast spawning species at this spatial scale [64,67]. This is surprising given decades of anthropogenic disturbances in Singapore’s waters, including extensive land reclamation that has decimated entire populations and thus created genetic bottlenecks depressing diversity [52,53,120,121]. In addition, this study is a first attempt to predict sexual reproduction modes for sea anemone species based on genomic information. Higher genetic diversity and lower inbreeding coefficients in S. haddoni could have resulted from its tendency to reproduce only via sexual reproduction, while E. quadricolor likely reproduces both asexually and sexually. However, further studies focused on genetic diversity and its relation to reproduction methods would be important for comparing genetic diversity between other marine species, especially in larger scales and across biogeographical regions. The high genetic diversity in both species could possibly confer higher genetic resilience against potential anthropogenic disturbances. Being able to predict genetic diversity based on reproductive mode is thus also important for the management of sea anemone population and health.
Although asexual reproduction was not detected for S. haddoni, two pairs of clones were found in E. quadricolor which is consistent with the previous observations of clonal reproduction in E. quadricolor [5,23]. Scott [42] also suggested that S. haddoni only reproduces via broadcast spawning while E. quadricolor can reproduce via both broadcast spawning and asexual reproduction (longitudinal fission). Species that rely solely (or dominantly) on sexual reproduction can maintain and renew populations, but do so during short breeding seasons [23,39,40,41,51]. Since S. haddoni lives at a higher intertidal zone, the need for dispersal via broadcast spawning could conceivably be greater than that of the more submerged E. quadricolor where opportunities to disperse far are not limited by tide immersions.
DNA barcoding was used in the present study to confirm morphological identifications. We detected several misidentifications based on morphology (Figure S2). Such misidentifications by parataxonomists are not uncommon [122,123], and the present study provides further evidence for the importance of species confirmation via DNA barcoding in taxonomically challenging groups such as actiniarians. Such taxa may not have sufficient taxonomic expertise available, or could consist of many cryptic species complexes. For anthozoans, including sea anemones, there is low interspecific variability in the universal barcoding gene COI [48,124]. Therefore, 28S rDNA was here used to successfully distinguish E. quadricolor from closely related species found in this region (i.e., H. magnifica). Stichodactyla haddoni is often morphologically confused with S. gigantea and especially S. tapetum [77]. The genes COIII and 28S were used in preliminary tests but were unable to resolve species-level differences between closely related Stichodactyla species. Based on the ITS1 marker used here, S. mertensii and S. haddoni were clearly distinguishable (Figure S1). Even though there were two apparent clusters of S. haddoni (7.6% difference), these differences were not detected in the SNP data and PCA clusters and could be due to paralogy. While S. tapetum (STI102) clustered amongst other S. haddoni individuals, this individual could have been misidentified (i.e., S. haddoni juvenile that was mistaken as S. tapetum), or that there was low inter-specific variability between S. haddoni and S. tapetum. Since variable rates of evolution in other intronic regions (ITSII) have been shown for actiniarians generally [125], only additional sequencing of other Stichodactyla species would allow the determination of the absence/presence of a barcoding gap for this marker, and its usefulness for species identification in this group. As a precaution, STI102 was excluded from subsequent analyses. Nevertheless, the large pairwise difference between S. mertensii and S. haddoni (12%) suggests that ITS1 has potential for distinguishing Stichodactyla species.
In conclusion, this study represents the first fine-scale population genomics study and direct comparison of two sea anemone species in an environment that is heavily impacted by human activities. The species inhabit different habitats and tidal zones but we find support for the hypothesis that primarily broadcast spawning species like S. haddoni and E. quadricolor have highly connected populations at small spatial scales even under adverse conditions. High connectivity for broadcast spawners from different clades and living in different habitats is good news for managers, as these populations are more likely to be able to recover naturally from disturbances. Analysing more than 1000 genome-wide SNP markers, we were able to infer population connectivity and also the reproductive strategies of S. haddoni and E. quadricolor using genetic tools. Only E. quadricolor was found to also propagate asexually. Where it might not be feasible to directly observe reproduction in species that have undetermined breeding modes and sporadic temporal breeding seasons, genetic tools play a critical role in the assessment of reproductive modes here. There remains a need to explore genetic structuring between intertidal and subtidal populations of other marine taxa in relation to differential wave action and emersion gradients, which can affect larval retention and thus local adaptation [84].

Supplementary Materials

The following are available online at https://www.mdpi.com/1424-2818/12/12/467/s1. Figure S1: Cluster dendrogram of Stichodactyla haddoni, S. mertensii (STI134) and S. tapetum (STI102) based on the ITS1 barcodes. The numbers at each node indicates the percentage pairwise difference. Figure S2: (a) Images of Heteractis magnifica and (b) Entacmaea quadricolor. Figure S3: BayeScan analysis outputs for (a) Stichodactyla haddoni and (b) Entacmaea quadricolor that were selected for downstream analyses, where FDR = 0.05. Dots labelled with numbers that fall to the right of the line are loci or SNPs identified as potential outliers. Figure S4: Histogram of pairwise genetic similarity for (a) sti_b1.10miss (b) ane_b3.10miss. ANE065-ANE088 pair (*) and the gap for potential clonemates (bracket) are indicated in (b). Figure S5: Outlier loci frequencies per site (a) sti_b1.10miss (b) ane_b3.10miss. Figure S6: (a) sti_b1.10miss lnPK graph, (b) sti_b1.10miss deltaK graph, (c) ane_b3.10miss lnPK graph, (d) ane_b3.10miss deltaK graph.

Author Contributions

Conceptualisation, W.W.R.C., Y.C.T. and D.H.; data curation, W.W.R.C.; formal analysis, W.W.R.C., Y.C.T. and D.H.; funding acquisition, Y.C.T., H.P.A., K.T., D.H. and R.M.; investigation, W.W.R.C., Y.C.T. and D.H.; methodology, W.W.R.C., Y.C.T. and D.H.; resources, D.H. and R.M.; visualisation, W.W.R.C., Y.C.T. and D.H.; writing—original draft, W.W.R.C., Y.C.T. and D.H.; writing—review and editing, H.P.A., K.T., L.M.C. and R.M. All authors have read and agreed to the published version of the manuscript.

Funding

This study was funded by the National Parks Board Research Grant R-347-000-242-490 and the National Research Foundation, Prime Minister’s Office, Singapore under its Marine Science R&D Programme (MSRDP-P03).

Acknowledgments

We greatly appreciate Yap Wei Liang Nicholas for expertise on sea anemone biology and identification, and Pwa Keay Hoon, Ip Yin Cheong and Gan Su Xuan for help in the field and laboratory, with special thanks to Chang Jia Jin Marc and Chan Yong Kit Samuel.

Conflicts of Interest

The authors declare no conflict of interest.

References

  1. Keller, L.F.; Waller, D.M. Inbreeding effects in wild populations. Trends Ecol. Evol. 2002, 17, 230–241. [Google Scholar] [CrossRef]
  2. Goodsell, P.J. Diversity in fragments of artificial and natural marine habitats. Mar. Ecol. Prog. Ser. 2009, 384, 23–31. [Google Scholar] [CrossRef] [Green Version]
  3. Cowen, R.K.; Lwiza, K.M.; Sponaugle, S.; Paris, C.B.; Olson, D.B. Connectivity of marine populations: Open or closed? Science 2000, 287, 857–859. [Google Scholar] [CrossRef] [PubMed] [Green Version]
  4. Pineda, J.; Hare, J.A.; Sponaugle, S.U. Larval transport and dispersal in the coastal ocean and consequences for population connectivity. Oceanography 2007, 20, 22–39. [Google Scholar] [CrossRef]
  5. Scott, A.; Harrison, P.L. Broadcast spawning of two species of sea anemone Entacmaea quadricolor and Heteractis crispa that host anemonefish. Invertebr. Reprod. Dev. 2007, 50, 163–171. [Google Scholar] [CrossRef]
  6. Cowen, R.K.; Sponaugle, S. Larval dispersal and marine population connectivity. Ann. Rev. Mar. Sci. 2009, 1, 443–466. [Google Scholar] [CrossRef] [Green Version]
  7. Shanks, A.L. Pelagic larval duration and dispersal distance revisited. Biol. Bull. 2009, 216, 373–385. [Google Scholar] [CrossRef] [Green Version]
  8. Fauvelot, C.; Bertozzi, F.; Costantini, F.; Airoldi, L.; Abbiati, M. Lower genetic diversity in the limpet Patella caerulea on urban coastal structures compared to natural rocky habitats. Mar. Biol. 2009, 156, 2313–2323. [Google Scholar] [CrossRef] [Green Version]
  9. Fauvelot, C.; Costantini, F.; Virgilio, M.; Abbiati, M. Do artificial structures alter marine invertebrate genetic makeup? Mar. Biol. 2012, 159, 2797–2807. [Google Scholar] [CrossRef]
  10. Marshall, D.J.; Monro, K.; Bode, M.; Keough, M.J.; Swearer, S. Phenotype–environment mismatches reduce connectivity in the sea. Ecol. Lett. 2010, 13, 128–140. [Google Scholar] [CrossRef]
  11. Hummel, H.; Patarnello, T. Genetics and pollution. In Genetics and Evolution of Aquatic Organisms; Chapman & Hall: London, UK, 1994; pp. 425–434. [Google Scholar]
  12. Guzmán, H.M.; Holst, I. Effects of chronic oil-sediment pollution on the reproduction of the Caribbean reef coral Siderastrea sidereal. Mar. Pollut. Bull. 1993, 26, 276–282. [Google Scholar] [CrossRef]
  13. van Oppen, M.J.; Gates, R.D. Conservation genetics and the resilience of reef-building corals. Mol. Ecol. 2006, 15, 3863–3883. [Google Scholar] [CrossRef]
  14. Lowe, W.H.; Allendorf, F.W. What can genetics tell us about population connectivity? Mol. Ecol. 2010, 19, 3038–3051. [Google Scholar] [CrossRef] [PubMed]
  15. Pandolfi, J.M.; Connolly, S.R.; Marshall, D.J.; Cohen, A.L. Projecting coral reef futures under global warming and ocean acidification. Science 2011, 333, 418–422. [Google Scholar] [CrossRef] [PubMed] [Green Version]
  16. Nevo, E.; Noy, R.; Lavie, B.; Beiles, A.; Muchtar, S. Genetic diversity and resistance to marine pollution. Biol. J. Linn. Soc. Lond. 1986, 29, 139–144. [Google Scholar] [CrossRef]
  17. Hughes, A.R.; Stachowicz, J.J. Genetic diversity enhances the resistance of a seagrass ecosystem to disturbance. Proc. Natl. Acad. Sci. USA 2004, 101, 8998–9002. [Google Scholar] [CrossRef] [PubMed] [Green Version]
  18. Ehlers, A.; Worm, B.; Reusch, T.B. Importance of genetic diversity in eelgrass Zostera marina for its resilience to global warming. Mar. Ecol. Prog. Ser. 2008, 355, 1–7. [Google Scholar] [CrossRef]
  19. Beger, M.; Selkoe, K.A.; Treml, E.; Barber, P.H.; Von Der Heyden, S.; Crandall, E.D.; Toonen, R.J.; Riginos, C. Evolving coral reef conservation with genetic information. Bull. Mar. Sci. 2014, 90, 159–185. [Google Scholar] [CrossRef] [Green Version]
  20. Mills, L.S.; Allendorf, F.W. The one-migrant-per-generation rule in conservation and management. Conserv. Biol. 1996, 10, 1509–1518. [Google Scholar] [CrossRef]
  21. Monkkonen, M.; Reunanen, P. On critical thresholds in landscape connectivity: A management perspective. Oikos 1999, 84, 302–305. [Google Scholar] [CrossRef]
  22. Drechsler, M.; Frank, K.; Hanski, I.; O’Hara, R.B.; Wissel, C. Ranking metapopulation extinction risk: From patterns in data to conservation management decisions. Ecol. Appl. 2003, 13, 990–998. [Google Scholar] [CrossRef]
  23. Dunn, D.F. The clownfish sea anemones: Stichodactylidae (Coelenterata: Actiniaria) and other sea anemones symbiotic with pomacentrid. Trans. Am. Philos. Soc. 1981, 71, 1–115. [Google Scholar] [CrossRef]
  24. Fautin, D.G.; Allen, G.R. Field Guide to Anemonefishes and Their Host Sea Anemones; Sea Challengers: Monterey, CA, USA; Western Australian Museum: Perth, Australia, 1992. [Google Scholar]
  25. Riemann-Zürneck, K. How sessile are sea anemones? A review of free-living forms in the Actiniaria Cnidaria: Anthozoa. Mar. Ecol. 1998, 19, 247–261. [Google Scholar] [CrossRef]
  26. Ayre, D.J. Localised adaptation of sea anemone clones: Evidence from transplantation over two spatial scales. J. Anim. Ecol. 1995, 64, 186–196. [Google Scholar] [CrossRef]
  27. Hoffmann, R.J. Variation in contributions of asexual reproduction to the genetic structure of populations of the sea anemone Metridium senile. Evolution 1986, 40, 357–365. [Google Scholar] [CrossRef]
  28. Ayre, D.J.; Read, J.; Wishart, J. Genetic subdivision within the eastern Australian population of the sea anemone Actinia tenebrosa. Mar. Biol. 1991, 109, 379–390. [Google Scholar] [CrossRef]
  29. Chia, F.S. Sea anemone reproduction: Patterns and adaptive radiations. In Coelenterate Ecology and Behavior; Springer: Boston, MA, USA, 1976; pp. 261–270. [Google Scholar]
  30. Bocharova, E.S.; Kozevich, I.A. Modes of reproduction in sea anemones (Cnidaria Anthozoa). Biol. Bull. 2011, 38, 849–860. [Google Scholar] [CrossRef]
  31. Hunt, A.; Ayre, D.J. Population structure in the sexually reproducing sea anemone Oulactis muscosa. Mar. Biol. 1989, 102, 537–544. [Google Scholar] [CrossRef]
  32. Russo, C.A.M.; Solé-Cava, A.M.; Thorpe, J.P. Population structure and genetic variation in two tropical sea anemones (Cnidaria Actinidae) with different reproductive strategies. Mar. Biol. 1994, 119, 267–276. [Google Scholar] [CrossRef]
  33. Gatins, R. Fine-Scale Population Structure of Two Anemones (Stichodactyla gigantea and Heteractis magnifica) in Kimbe Bay Papua New Guinea. Master’s Thesis, King Abdullah University of Science and Technology, Thuwal, Saudi Arabia, 2014. [Google Scholar]
  34. Black, R.; Johnson, M.S. Asexual viviparity and population genetics of Actinia tenebrosa. Mar. Biol. 1979, 53, 27–31. [Google Scholar] [CrossRef]
  35. Waller, R.G. Deep-water Scleractinia (Cnidaria: Anthozoa): Current knowledge of reproductive processes. In Cold-Water Corals and Ecosystems; Springer: Berlin/Heidelberg, Germany, 2005; pp. 691–700. [Google Scholar]
  36. Sherman, C.D.; Ayre, D.J. Fine-scale adaptation in a clonal sea anemone. Evolution 2008, 62, 1373–1380. [Google Scholar] [CrossRef] [PubMed]
  37. Veale, A.J.; Lavery, S.D. The population genetic structure of the waratah anemone (Actinia tenebrosa) around New Zealand. N. Z. J. Mar. Freshw. Res. 2012, 46, 523–536. [Google Scholar] [CrossRef]
  38. Jackson, J.B.C. Modes of dispersal of clonal benthic invertebrates: Consequences for species’ distributions and genetic structure of local populations. Bull. Mar. Sci. 1986, 39, 588–606. [Google Scholar]
  39. Fautin, D.G.; Allen, G.R. Anemonefishes and Their Host Sea Anemones: A Guide for Aquarists and Divers; Western Australian Museum: Perth, Australia, 1997. [Google Scholar]
  40. Scott, A.; Harrison, P.L. Synchronous spawning of host sea anemones. Coral Reefs 2005, 24, 208. [Google Scholar] [CrossRef]
  41. Scott, A.; Francisco, B. Observations on the feeding behaviour of resident anemonefish during host sea anemone spawning. Coral Reefs 2006, 25, 451. [Google Scholar] [CrossRef]
  42. Scott, A. Sea anemones. In Marine Ornamental Species Aquaculture; John Wiley & Sons Ltd.: Hoboken, NJ, USA, 2017; pp. 437–456. [Google Scholar]
  43. Sebens, K.P. Morphological variability during longitudinal fission of the intertidal sea anemone Anthopleura elegantissima (Brandt). Pac. Sci. 1983, 37, 121–132. [Google Scholar]
  44. Holbrook, S.J.; Schmitt, R.J. Growth reproduction and survival of a tropical sea anemone (Actiniaria): Benefits of hosting anemonefish. Coral Reefs 2005, 24, 67–73. [Google Scholar] [CrossRef]
  45. Edmands, S.; Potts, D.C. Population genetic structure in brooding sea anemones (Epiactis spp.) with contrasting reproductive modes. Mar. Biol. 1997, 127, 485–498. [Google Scholar] [CrossRef]
  46. Reitzel, A.M.; Herrera, S.; Layden, M.J.; Martindale, M.Q.; Shank, T.M. Going where traditional markers have not gone before: Utility of and promise for RAD sequencing in marine invertebrate phylogeography and population genomics. Mol. Ecol. 2013, 22, 2953–5970. [Google Scholar] [CrossRef] [Green Version]
  47. Bellis, E.S.; Howe, D.K.; Denver, D.R. Genome-wide polymorphism and signatures of selection in the symbiotic sea anemone Aiptasia. BMC Genom. 2016, 17, 160. [Google Scholar] [CrossRef] [Green Version]
  48. Shearer, T.L.; Van Oppen, M.J.H.; Romano, S.L.; Wörheide, G. Slow mitochondrial DNA sequence evolution in the Anthozoa (Cnidaria). Mol. Ecol. 2002, 11, 2475–2487. [Google Scholar] [CrossRef] [PubMed]
  49. Huang, D.; Meier, R.; Todd, P.A.; Chou, L.M. Slow mitochondrial COI sequence evolution at the base of the metazoan tree and its implications for DNA barcoding. J. Mol. Evol. 2008, 66, 167–174. [Google Scholar] [CrossRef] [PubMed]
  50. Andrews, K.R.; Good, J.M.; Miller, M.R.; Luikart, G.; Hohenlohe, P.A. Harnessing the power of RADseq for ecological and evolutionary genomics. Nat. Rev. Genet. 2016, 17, 81. [Google Scholar] [CrossRef] [PubMed] [Green Version]
  51. Scott, A.; Harrison, P.L. Gametogenic and reproductive cycles of the sea anemone Entacmaea quadricolor. Mar. Biol. 2009, 156, 1659. [Google Scholar] [CrossRef]
  52. Todd, P.A.; Chou, L.M. A tale of survival: Labrador Park, Singapore. Coral Reefs 2005, 24, 391. [Google Scholar] [CrossRef]
  53. Lai, S.; Loke, L.H.; Hilton, M.J.; Bouma, T.J.; Todd, P.A. The effects of urbanisation on coastal habitats and the potential for ecological engineering: A Singapore case study. Ocean. Coast. Manag. 2015, 103, 78–85. [Google Scholar] [CrossRef]
  54. Chia, L.S.; Khan, H.; Chou, L.M. The Coastal Environmental Profile of Singapore; ICLARM Technical Reports 21; International Center for Living Aquatic Resources Management: Manila, Philippines, 1988; pp. 1–92. [Google Scholar]
  55. Yong, K.Y.; Lee, S.L.; Karunaratne, G.P. Coastal reclamation in Singapore: A review. Urban coastal area management: The experience of Singapore. ICLARM Conf. Proc. 1991, 25, 59–67. [Google Scholar]
  56. Tan, K.S.; Acerbi, E.; Lauro, F.M. Marine habitats and biodiversity of Singapore’s coastal waters: A review. Reg. Stud. Mar. Sci. 2016, 8, 340–352. [Google Scholar] [CrossRef]
  57. Chou, L.M.; Huang, D.; Tan, K.S.; Toh, T.C.; Goh, B.P.; Tun, K. Chapter 24—Singapore. In World Seas: An Environmental Evaluation, 2nd ed.; Academic Press: Cambridge, MA, USA, 2019; pp. 539–558. [Google Scholar]
  58. Chou, L.M. Marine habitats in one of the world’s busiest harbours. In The Environment in Asia Pacific Harbours; Springer: Dordrecht, The Netherlands, 2006; pp. 377–391. [Google Scholar]
  59. Mashayekhi, S.; Columbus, J.T. Genetic diversity of Allium munzii (Amaryllidaceae), a rare southern California species and implication for its conservation. Biochem. Syst. Ecol. 2015, 59, 91–99. [Google Scholar] [CrossRef]
  60. Browne, N.K.; Precht, E.; Last, K.S.; Todd, P.A. Photo-physiological costs associated with acute sediment stress events in three near-shore turbid water corals. Mar. Ecol. Prog. Ser. 2014, 502, 129–143. [Google Scholar] [CrossRef] [Green Version]
  61. MPA Port Statistics. 2020. Available online: https://www.mpa.gov.sg/web/portal/home/maritime-singapore/port-statistics (accessed on 13 April 2020).
  62. Bhattachan, P.; Qiao, R.; Dong, B. Identification and population genetic comparison of three ascidian species based on mtDNA sequences. Ecol. Evol. 2020, 10, 3758–3768. [Google Scholar] [CrossRef] [PubMed] [Green Version]
  63. Miller, A.D.; van Rooyen, A.; Rašić, G.; Ierodiaconou, D.A.; Gorfine, H.K.; Day, R.; Wong, C.; Weeks, A.R. Contrasting patterns of population connectivity between regions in a commercially important mollusc Haliotis rubra: Integrating population genetics genomics and marine LiDAR data. Mol. Ecol. 2016, 25, 3845–3864. [Google Scholar] [CrossRef] [PubMed]
  64. Tay, Y.C.; Noreen, A.M.E.; Chou, L.M.; Todd, P.A. Genetic connectivity of the broadcast spawning reef coral Platygyra sinensis on impacted reefs, and the description of new microsatellite markers. Coral Reefs 2015, 34, 301–311. [Google Scholar] [CrossRef]
  65. Thomas, L.; Underwood, J.N.; Adam, A.A.; Richards, Z.T.; Dugal, L.; Miller, K.J.; Gilmour, J.P. Contrasting patterns of genetic connectivity in brooding and spawning corals across a remote atoll system in northwest Australia. Coral Reefs 2020, 39, 55–60. [Google Scholar] [CrossRef]
  66. Jones, G.P.; Planes, S.; Thorrold, S.R. Coral reef fish larvae settle close to home. Curr. Biol. 2005, 15, 1314–1318. [Google Scholar] [CrossRef] [PubMed] [Green Version]
  67. Tay, Y.C.; Chng, M.W.P.; Sew, W.W.G.; Rheindt, F.E.; Tun, K.P.P.; Meier, R. Beyond the Coral Triangle: High genetic diversity and near panmixia in Singapore’s populations of the broadcast spawning sea star Protoreaster nodosus. R. Soc. Open Sci. 2016, 3, 160253. [Google Scholar] [CrossRef] [PubMed] [Green Version]
  68. Villegas-Sánchez, C.A.; Rivera-Madrid, R.; Arias-González, J.E. Small-scale genetic connectivity of bicolor damselfish (Stegastes partitus) recruits in Mexican Caribbean reefs. Coral Reefs 2010, 29, 1023–1033. [Google Scholar] [CrossRef]
  69. Coolen, J.W.; Boon, A.R.; Crooijmans, R.; Van Pelt, H.; Kleissen, F.; Gerla, D.; Beermann, J.; Luttikhuizen, P.C. Marine stepping-stones: Connectivity of Mytilus edulis populations between offshore energy installations. Mol. Ecol. 2020, 29, 686–703. [Google Scholar] [CrossRef] [Green Version]
  70. Jorde, P.E.; Knutsen, H.; Espeland, S.H.; Stenseth, N.C. Spatial scale of genetic structuring in coastal cod Gadus morhua and geographic extent of local populations. Mar. Ecol. Prog. Ser. 2007, 343, 229–237. [Google Scholar] [CrossRef] [Green Version]
  71. Barbosa, S.S.; Klanten, S.O.; Puritz, J.B.; Toonen, R.J.; Byrne, M. Very fine-scale population genetic structure of sympatric asterinid sea stars with benthic and pelagic larvae: Influence of mating system and dispersal potential. Biol. J. Linn. Soc. Lond. 2013, 108, 821–833. [Google Scholar] [CrossRef] [Green Version]
  72. Benestan, L.; Gosselin, T.; Perrier, C.; Sainte-Marie, B.; Rochette, R.; Bernatchez, L. RAD genotyping reveals fine-scale genetic structuring and provides powerful population assignment in a widely distributed marine species, the American lobster (Homarus americanus). Mol. Ecol. 2015, 24, 3299–3315. [Google Scholar] [CrossRef]
  73. Maas, D.L.; Prost, S.; Bi, K.; Smith, L.L.; Armstrong, E.E.; Aji, L.P.; Toha, A.H.A.; Gillespie, R.G.; Becking, L.E. Rapid divergence of mussel populations despite incomplete barriers to dispersal. Mol. Ecol. 2018, 27, 1556–1571. [Google Scholar] [CrossRef] [PubMed] [Green Version]
  74. Wort, E.J.; Chapman, M.A.; Hawkins, S.J.; Henshall, L.; Pita, A.; Rius, M.; Williams, S.T.; Fenberg, P.B. Contrasting genetic structure of sympatric congeneric gastropods: Do differences in habitat preference, abundance and distribution matter? J. Biogeogr. 2019, 46, 369–380. [Google Scholar] [CrossRef]
  75. Kelly, R.P.; Palumbi, S.R. Genetic structure among 50 species of the northeastern Pacific rocky intertidal community. PLoS ONE 2010, 5, e8594. [Google Scholar] [CrossRef] [PubMed] [Green Version]
  76. Schmidt, P.S.; Rand, D.M. Adaptive maintenance of genetic polymorphism in an intertidal barnacle: Habitat-and life-stage-specific survivorship of MPI genotypes. Evolution 2001, 55, 1336–1344. [Google Scholar] [CrossRef] [PubMed]
  77. Fautin, D.G.; Tan, R.; Yap, N.W.L.; Hee, T.S.; Crowther, A.; Goodwill, R.; Sanpanich, K.; Tay, Y.C. Sea anemones (Cnidaria: Actiniaria) of Singapore: Shallow-water species known also from the Indian subcontinent. Raffles Bull. Zool. 2015, 31, 44–59. [Google Scholar]
  78. Richardson, D.L.; Harriott, V.J.; Harrison, P.L. Distribution and abundance of giant sea anemones (Actiniaria) in subtropical eastern Australian waters. Mar. Freshw. Res. 1997, 48, 59–66. [Google Scholar] [CrossRef]
  79. Scott, A.; Harasti, D.; Davis, T.; Smith, S.D. Southernmost records of the host sea anemone Stichodactyla haddoni and associated commensal shrimps in a climate change hotspot. Mar. Biol. 2014, 45, 145–146. [Google Scholar] [CrossRef]
  80. Titus, B.M.; Benedict, C.; Laroche, R.; Gusmão, L.C.; Van Deusen, V.; Chiodo, T.; Meyer, C.P.; Berumen, M.L.; Bartholomew, A.; Yanagi, K.; et al. Phylogenetic relationships among the clownfish-hosting sea anemones. Mol. Phylogenet. Evol. 2019, 139, 106526. [Google Scholar] [CrossRef]
  81. Shuman, C.S.; Hodgson, G.; Ambrose, R.F. Population impacts of collecting sea anemones and anemonefish for the marine aquarium trade in the Philippines. Coral Reefs 2005, 24, 564–573. [Google Scholar] [CrossRef]
  82. Nakajima, Y.; Nishikawa, A.; Iguchi, A.; Sakai, K. Gene flow and genetic diversity of a broadcast-spawning coral in northern peripheral populations. PLoS ONE 2010, 5, e11149. [Google Scholar] [CrossRef] [PubMed] [Green Version]
  83. Doyle, J.; Doyle, J. CTAB DNA extraction in plants. Phytochem. Bull. 1987, 19, 11–15. [Google Scholar]
  84. Stoletzki, N.; Schierwater, B. Genetic and color morph differentiation in the Caribbean sea anemone Condylactis gigantea. Mar. Biol. 2005, 147, 747–754. [Google Scholar] [CrossRef]
  85. Meier, R.; Wong, W.; Srivathsan, A.; Foo, M. $1 DNA barcodes for reconstructing complex phenomes and finding rare species in specimen-rich samples. Cladistics 2016, 32, 100–110. [Google Scholar] [CrossRef]
  86. Wang, W.Y.; Srivathsan, A.; Foo, M.; Yamane, S.K.; Meier, R. Sorting specimen-rich invertebrate samples with cost-effective NGS barcodes: Validating a reverse workflow for specimen processing. Mol. Ecol. Res. 2018, 18, 490–501. [Google Scholar] [CrossRef] [PubMed]
  87. Meier, R.; Shiyang, K.; Vaidya, G.; Ng, P.K. DNA barcoding and taxonomy in Diptera: A tale of high intraspecific variability and low identification success. Syst. Biol. 2006, 55, 715–728. [Google Scholar] [CrossRef] [PubMed] [Green Version]
  88. Chen, M.; Murali, K.; Khoo, B.C.; Lou, J.; Kumar, K. Circulation modelling in the Strait of Singapore. J. Coast. Res. 2005, 21, 960–972. [Google Scholar] [CrossRef]
  89. Kearse, M.; Moir, R.; Wilson, A.; Stones-Havas, S.; Cheung, M.; Sturrock, S.; Buxton, S.; Cooper, A.; Markowitz, S.; Duran, C.; et al. Geneious Basic: An integrated and extendable desktop software platform for the organization and analysis of sequence data. Bioinformatics 2012, 28, 1647–1649. [Google Scholar] [CrossRef] [PubMed]
  90. Jakobsson, M.; Rosenberg, N.A. CLUMPP: A cluster matching and permutation program for dealing with label switching and multimodality in analysis of population structure. Bioinformatics 2007, 23, 1801–1806. [Google Scholar] [CrossRef] [Green Version]
  91. Recknagel, H.; Jacobs, A.; Herzyk, P.; Elmer, K.R. Double-digest RAD sequencing using Ion Proton semiconductor platform (ddRADseq-ion) with nonmodel organisms. Mol. Ecol. Res. 2015, 15, 1316–1329. [Google Scholar] [CrossRef]
  92. Peterson, B.K.; Weber, J.N.; Kay, E.H.; Fisher, H.S.; Hoekstra, H.E. Double digest RADseq: An inexpensive method for de novo SNP discovery and genotyping in model and non-model species. PLoS ONE 2012, 7, e37135. [Google Scholar] [CrossRef] [PubMed] [Green Version]
  93. Andrews, S. A Quality Control Tool for High Throughput Sequence Data; FastQC: Cambridge, UK, 2010; Available online: http://www.bioinformatics.babraham.ac.uk/projects/fastqc/ (accessed on 11 June 2020).
  94. Catchen, J.; Hohenlohe, P.A.; Bassham, S.; Amores, A.; Cresko, W.A. Stacks: An analysis tool set for population genomics. Mol. Ecol. 2013, 22, 3124–3140. [Google Scholar] [CrossRef] [PubMed] [Green Version]
  95. Paris, J.R.; Stevens, J.R.; Catchen, J.M. Lost in parameter space: A road map for stacks. Methods Ecol. Evol. 2017, 8, 1360–1373. [Google Scholar] [CrossRef]
  96. Bongaerts, P.; Riginos, C.; Brunner, R.; Englebert, N.; Smith, S.R.; Hoegh-Guldberg, O. Deep reefs are not universal refuges: Reseeding potential varies among coral species. Sci. Adv. 2017, 3, e1602373. [Google Scholar] [CrossRef] [Green Version]
  97. Danecek, P.; Auton, A.; Abecasis, G.; Albers, C.A.; Banks, E.; DePristo, M.A.; Handsaker, R.E.; Lunter, G.; Gabor, T.M.; Sherry, S.T.; et al. The variant call format and VCFtools. Bioinformatics 2011, 27, 2156–2158. [Google Scholar] [CrossRef]
  98. Foll, M. BayeScan v2. 1 user manual. Ecology 2012, 20, 1450–1462. [Google Scholar]
  99. Lischer, H.E.L.; Excoffier, L. PGDSpider: An automated data conversion tool for connecting population genetics and genomics programs. Bioinformatics 2012, 28, 298–299. [Google Scholar] [CrossRef] [Green Version]
  100. Meirmans, P.G.; Van Tienderen, P.H. GENOTYPE and GENODIVE: Two programs for the analysis of genetic diversity of asexual organisms. Mol. Ecol. 2004, 4, 792–794. [Google Scholar] [CrossRef]
  101. Zheng, X.; Levine, D.; Shen, J.; Gogarten, S.M.; Laurie, C.; Weir, B.S. A high-performance computing toolset for relatedness and principal component analysis of SNP data. Bioinformatics 2012, 28, 3326–3328. [Google Scholar] [CrossRef] [Green Version]
  102. Pritchard, J.K.; Stephens, M.; Donnelly, P. Inference of population structure using multilocus genotype data. Genetics 2000, 155, 945–959. [Google Scholar]
  103. Chhatre, V.E.; Emerson, K.J. StrAuto: Automation and parallelization of STRUCTURE analysis. BMC Bioinform. 2017, 18, 192. [Google Scholar] [CrossRef] [PubMed] [Green Version]
  104. Raj, A.; Stephens, M.; Pritchard, J.K. fastSTRUCTURE: Variational inference of population structure in large SNP data sets. Genetics 2014, 197, 573–589. [Google Scholar] [CrossRef] [PubMed] [Green Version]
  105. Evanno, G.; Regnaut, S.; Goudet, J. Detecting the number of clusters of individuals using the software structure: A simulation study. Mol. Ecol. 2005, 14, 2611–2620. [Google Scholar] [CrossRef] [PubMed] [Green Version]
  106. Earl, D.A. Structure Harvester: A website and program for visualizing STRUCTURE output and implementing the Evanno method. Conserv. Genet. Resour. 2012, 4, 359–361. [Google Scholar] [CrossRef]
  107. Rosenberg, N.A. Distruct: A program for the graphical display of population structure. Mol. Ecol. 2004, 4, 137–138. [Google Scholar]
  108. Willing, E.M.; Dreyer, C.; Van Oosterhout, C. Estimates of genetic differentiation measured by FST do not necessarily require large sample sizes when using many SNP markers. PLoS ONE 2012, 7, e42649. [Google Scholar] [CrossRef] [PubMed] [Green Version]
  109. Fowler, A.M.; Jørgensen, A.M.; Coolen, J.W.; Jones, D.O.; Svendsen, J.C.; Brabant, R.; Rumes, B.; Degraer, S. The ecology of infrastructure decommissioning in the North Sea: What we need to know and how to achieve it. ICES J. Mar. Sci. 2020, 77, 1109–1126. [Google Scholar] [CrossRef]
  110. Tan, W.T.; Loke, L.H.; Yeo, D.C.; Tan, S.K.; Todd, P.A. Do Singapore’s seawalls host non-native marine molluscs? Aquat. Invasions 2018, 13, 365–378. [Google Scholar] [CrossRef]
  111. Loke, L.H.; Bouma, T.J.; Todd, P.A. The effects of manipulating microhabitat size and variability on tropical seawall biodiversity: Field and flume experiments. J. Exp. Mar. Biol. Ecol. 2017, 492, 113–120. [Google Scholar] [CrossRef]
  112. Ng, C.S.L.; Chen, D.; Chou, L.M. Hard coral assemblages on seawalls in Singapore. Contrib. Mar. Sci. 2012, 2012, 75–79. [Google Scholar]
  113. Wilson, J.R.; Harrison, P.L. Spawning patterns of scleractinian corals at the Solitary Islands, a high latitude coral community in eastern Australia. Mar. Ecol. Prog. Ser. 2003, 260, 115–123. [Google Scholar] [CrossRef] [Green Version]
  114. Guest, J.R.; Baird, A.H.; Goh, B.P.L.; Chou, L.M. Multispecific synchronous coral spawning in Singapore. Coral Reefs 2002, 21, 422–423. [Google Scholar] [CrossRef]
  115. Guest, J.R.; Baird, A.H.; Goh, B.P.L.; Chou, L.M. Seasonal reproduction in equatorial reef corals. Invertebr. Reprod. Dev. 2005, 48, 207–218. [Google Scholar] [CrossRef]
  116. Tay, Y.C.; Todd, P.A.; Rosshaug, P.S.; Chou, L.M. Simulating the transport of broadcast coral larvae among the Southern Islands of Singapore. Aquat. Biol. 2012, 15, 283–297. [Google Scholar] [CrossRef] [Green Version]
  117. Pang, W.C. Modelling tidal and monsoon driven currents in the Singapore Strait. Singap. Marit. Port J. 2003, 2003, 151–162. [Google Scholar]
  118. Heery, E.C.; Hoeksema, B.W.; Browne, N.K.; Reimer, J.D.; Ang, P.O.; Huang, D.; Friess, D.A.; Chou, L.M.; Loke, L.H.L.; Saksena-Taylor, P.; et al. Urban coral reefs: Degradation and resilience of hard coral assemblages in coastal cities of East and Southeast Asia. Mar. Poll. Bull. 2018, 135, 654–681. [Google Scholar] [CrossRef] [PubMed]
  119. Chow, G.S.E.; Chan, Y.K.S.; Jain, S.S.; Huang, D. Light limitation selects for depth generalists in urbanised reef coral communities. Mar. Environ. Res. 2019, 147, 101–112. [Google Scholar] [CrossRef] [PubMed]
  120. Goossens, B.; Chikhi, L.; Ancrenaz, M.; Lackman-Ancrenaz, I.; Andau, P.; Bruford, M.W. Genetic signature of anthropogenic population collapse in orang-utans. PLoS Biol. 2006, 4, e25. [Google Scholar] [CrossRef] [Green Version]
  121. Poquita-Du, R.C.; Quek, Z.B.R.; Jain, S.S.; Schmidt-Roach, S.; Tun, K.; Heery, E.C.; Chou, L.M.; Todd, P.A.; Huang, D. Last species standing: Loss of Pocilloporidae corals associated with coastal urbanization in a tropical city state. Mar. Biodivers. 2019, 49, 1727–1741. [Google Scholar] [CrossRef]
  122. Ewers, C.; Wares, J.P. Examining an outlier: Molecular diversity in the Cirripedia. Integr. Comp. Biol. 2012, 52, 410–417. [Google Scholar] [CrossRef] [Green Version]
  123. Huang, H.; Chen, Z.; Wei, Z.; Bu, R.; Wu, Z. DNA barcoding revises a misidentification on mossy frog: New record and distribution extension of Theloderma corticale Boulenger, 1903 (Amphibia: Anura: Rhacophoridae). Mitochondrial DNA Part A 2018, 29, 273–280. [Google Scholar] [CrossRef] [PubMed]
  124. Flot, J.F.; Dahl, M.; André, C. Lophelia pertusa corals from the Ionian and Barents seas share identical nuclear ITS2 and near-identical mitochondrial genome sequences. BMC Res. Notes 2013, 6, 144. [Google Scholar] [CrossRef] [PubMed] [Green Version]
  125. Dohna, T.A.; Kochzius, M. Obstacles to molecular species identification in sea anemones (Hexacorallia: Actiniaria) with COI a COI intron and ITS II. Mar. Biodivers. 2016, 46, 291–297. [Google Scholar] [CrossRef]
Figure 1. (a) Stichodactyla haddoni and (b) Entacmaea quadricolor.
Diversity 12 00467 g001
Figure 2. Sampling locations of Stichodactyla haddoni and Entacmaea quadricolor. BEC—Berlayer Creek, CHB—Changi Beach, CHJ—Chek Jawa, CYR—Cyrene Reefs, LAI—Lazarus Island, KUI—Kusu Island, PLH—Pulau Hantu, PLJ—Pulau Jong, PLS—Pulau Semakau, PLT—Pulau Tekukor, PRP—Pasir Ris Park, RAL—Raffles Lighthouse, SIS—Sisters Island, SJI—St Johns Island, SSH—Sultan Shoal, TAM—Tanah Merah, TPT—Terembu Pempang Tengah, TUM—Tuas Merawang Beacon.
Diversity 12 00467 g002
Figure 3. Principal coordinates analysis (PCA) of (a) Stichodactyla haddoni (sti_b1.10miss) and (b) Entacmaea quadricolor (ane_b3.10miss). Sampling sites are indicated with different colours. Four diverging individuals are circled.
Diversity 12 00467 g003
Figure 4. STRUCTURE plots of S. haddoni (sti_b1.10miss) and E. quadricolor (ane_b3.10miss) suggest a single genetic cluster across all the sampling localities in Singapore. Sites are arranged in a west-to east-ward order starting from Tuas Merawang (TUM) for S. haddoni, and Sultan Shoal (SSH) for E. quadricolor. The four diverging individuals are indicated with arrows.
Diversity 12 00467 g004
Table 1. Pairwise-comparison of sites and corresponding FST values (above the diagonal) and p-values (below the diagonal) of (a) S. haddoni (sti_b1.10miss) and (b) E. quadricolor (ane_b3.10miss). Significant p-values after Bonferroni correction are indicated with an asterisk (*).
(a)CHJPRPTUMPLSTAMBECCHBCYR
CHJ--0.006−0.0010.0040.0060.00200.001
PRP0.11--0.0060.013−0.003−0.0030.0030.007
TUM0.560.043--0.009−0.007−0.0040.0050.003
PLS0.2430.020.023--0.0020.0050.0120.006
TAM0.1630.6780.9550.394--−0.016−0.002−0.003
BEC0.3620.8050.8720.1721--−0.0020.002
CHB0.5340.2430.030.003*0.7310.698--0.002
CYR0.3770.0460.1530.0580.770.2910.137--
(b)PLHSISPLJTPTKUIRALSJIPLSSSHLAIPLTCYR
PLH--00.004−0.0020−0.001−0.004−0.0030.0020.0040.0020
SIS0.529--0.0030.002−0.002−0.0040.0060.0030.0070.0030.0030.001
PLJ0.0590.216--0.003−0.001−0.0020.0010.0020.0050.0060.0060.001
TPT0.840.2040.16--−0.002−0.005−0.007−0.003−0.002−0.0060−0.005
KUI0.4430.7110.5460.699--−0.008−0.002−0.0190.0020.001−0.007−0.005
RAL0.590.6750.6970.790.887--−0.008−0.0120.002−0.0090.002−0.002
SJI0.7960.140.4720.920.5670.92--−0.006−0.001−0.0020.0030
PLS0.7650.260.3250.7610.9220.86--−0.005−0.002−0.005−0.005
SSH0.3040.0440.0820.7450.3160.3880.5240.873--−0.0020.0040.001
LAI0.1490.2680.0730.8980.4090.8890.7110.6810.65--0.002−0.006
PLT0.280.2390.0470.4550.9840.4120.2560.9030.1440.277--−0.003
CYR0.5340.4010.3230.9350.9230.6270.4920.8380.4690.950.763--
Table 2. Number of samples prepared for ddRADseq sequencing (n) per site and species and genetic diversity indices of Stichodactyla haddoni (sti_b1.10miss) and Entacmaea quadricolor (ane_b3.10miss), where Num = number of alleles observed, Eff_num = effective number of alleles in a population weighted for their frequencies, Ho = observed heterozygosity where 0 represents that all individuals are homozygous and 1 represents that all individuals are heterozygous, HS = expected heterozygosity, Ht = total heterozygosity, H’t = total heterozygosity corrected for bias from sampling limited populations, Gis = inbreeding coefficient; analogous to Wright’s inbreeding-coefficient, FIS.
PopulationnNumEff_numHoHsHtH’tGis
S. haddoniCHJ81.6921.40.2410.2720.272---0.113
PRP91.7521.4140.2410.2760.276---0.127
TUM71.8511.4290.240.2760.276---0.131
PLS101.8111.4260.2320.2780.278---0.165
TAM71.6871.3930.2260.2710.271---0.167
BEC61.7451.4120.2340.2770.277---0.153
CHB171.8871.4220.2290.2680.268---0.145
CYR81.8381.4240.2370.2740.274---0.135
Overall811.9891.3880.2350.2740.2740.2740.142
E. quadricolorPLH121.8061.3640.1980.2380.238---0.17
SIS131.781.3670.2040.2420.242---0.158
PLJ81.7041.3510.1830.2360.236---0.225
TPT171.8421.3630.1730.2370.237---0.268
KUI91.7361.360.2070.2410.241---0.14
RAL31.5041.3310.1990.2450.245---0.186
SJI41.5621.3290.190.2340.234---0.189
PLS81.5981.3330.1750.2330.233---0.25
SSH81.6841.3470.1790.2350.235---0.241
LAI51.6451.360.210.2470.247---0.15
PLT81.6951.350.1950.2370.237---0.174
CYR71.6971.3520.1960.2380.238---0.176
Overall9921.20.1920.2390.2380.2380.194
Publisher’s Note: MDPI stays neutral with regard to jurisdictional claims in published maps and institutional affiliations.

