Article

Seascape Configuration Leads to Spatially Uneven Delivery of Parrotfish Herbivory across a Western Indian Ocean Seascape

by
Linda Eggertsen
1,2,*,
Whitney Goodell
3,4,
César A. M. M. Cordeiro
5,6,
Thiago C. Mendes
7,
Guilherme O. Longo
8,
Carlos E. L. Ferreira
6 and
Charlotte Berkström
1,9,*
1
Department of Ecology, Environment and Plant Sciences, Stockholm University, S-106 91 Stockholm, Sweden
2
Universidade Federal do Sul da Bahia, Campus Sosígenes Costa, Centro de Formação em Ciências Ambientais, Porto Seguro 45810-000, Brazil
3
Exploration Technology Lab, National Geographic Society, Washington, DC 20036, USA
4
Pristine Seas, National Geographic Society, Washington, DC 20036, USA
5
Programa de Pós-Graduação em Ecologia, Universidade Federal do Rio de Janeiro, Rio de Janeiro 68020, RJ, Brazil
6
Laboratório de Ecologia e Conservação de Ambientes Recifais, Universidade Federal Fluminense, Outeiro de São João Batista-s/n, Rio de Janeiro 24020-005, Brazil
7
Instituto do Mar, Universidade Federal de São Paulo, Santos 11070−100, Brazil
8
Marine Ecology Laboratory, Department of Oceanography and Limnology, Universidade Federal do Rio Grande do Norte, Natal 59014-002, Brazil
9
Department of Aquatic Resources, Institute of Coastal Research, Swedish University of Agricultural Sciences, Skolgatan 6, SE-742 42 Öregrund, Sweden
*
Authors to whom correspondence should be addressed.
Diversity 2020, 12(11), 434; https://doi.org/10.3390/d12110434
Submission received: 14 August 2020 / Revised: 2 October 2020 / Accepted: 27 October 2020 / Published: 18 November 2020
(This article belongs to the Special Issue Biodiversity and Ecology of Herbivorous Fish)

Abstract

:
Spatial configuration of habitat types in multihabitat seascapes influence ecological function through links of biotic and abiotic processes. These connections, for example export of organic matter or fishes as mobile links, define ecosystem functionality across broader spatial scales. Herbivory is an important ecological process linked to ecosystem resilience, but it is not clear how herbivory relates to seascape configuration. We studied how herbivory and bioerosion by 3 species of parrotfish were distributed in a multi-habitat tropical seascape in the Western Indian Ocean (WIO). We surveyed the abundance of three species with different life histories—Leptoscarus vaigiensis (seagrass species), Scarus ghobban (juvenile-seagrass/adults-reefs) and Scarus rubroviolaceus (reef species) —in seagrass meadows and on reefs and recorded their selectivity of feeding substrate in the two habitats. Herbivory rates for L. vaigiensis and S. ghobban and bioerosion for S. rubroviolaceus were then modelled using bite rates for different size classes and abundance and biomass data along seascape gradients (distance to alternative habitat types such as land, mangrove and seagrass). Bioerosion by S. rubroviolaceus was greatest on reefs far from seagrass meadows, while herbivory rates by S. ghobban on reefs displayed the opposite pattern. Herbivory in seagrass meadows was greatest in meadows close to shore, where L. vaigiensis targeted seagrass leaves and S. ghobban the epiphytes growing on them. Our study shows that ecological functions performed by fish are not equally distributed in the seascape and are influenced by fish life history and the spatial configuration of habitats in the seascape. This has implications for the resilience of the system, in terms of spatial heterogeneity of herbivory and bioerosion and should be considered in marine spatial planning and fisheries management.

1. Introduction

Herbivory is a key ecological process in coral reef and seagrass ecosystems, with the potential to shape benthic community composition and primary productivity [1,2,3,4,5,6]. In these systems, macro herbivores such as fish and sea urchins are the main herbivores based on their abundance and functional diversity [7,8,9]. The spatial distribution of nominally herbivorous fishes in coastal systems can have strong effects on algal and plant communities [1,10,11], sediment loads [12] and can consequently influence ecosystem functioning [13,14] and recovery from disturbances such as fishing and coral bleaching. The distribution of herbivorous fish in the seascape is influenced by environmental characteristics on the scale of habitat patches (e.g., structural habitat complexity and food availability) as well as on larger spatial scales across mosaics of different patch types (e.g., distance to other key habitats and/or patch arrangement) [6,15,16,17,18,19]. For example, in the Caribbean, reefs located close to mangroves demonstrate higher herbivory rates compared to more distant ones, due to ontogenetic habitat shifts of parrotfish juveniles from mangrove nurseries [10,20,21]. Proximity to mangroves seems to have less effect on parrotfish grazing rates on the epilithic algal matrix (EAM) on Indo-Pacific reefs [22,23]. This suggests a lack of dependency on mangroves as a nursery habitat for these species, or indicates that the spatial scales of ontogenetic migrations are larger than the spatial gradients investigated in earlier studies [22]. However, the importance of seascape configuration for multi-habitat species linked to effects on ecosystem functioning, has received little attention [10,21,22,24,25,26,27]. In terrestrial environments, effects of landscape configuration and habitat connectivity on ecosystem functions and services are more well-described [28].
Herbivorous fish perform important ecological functions, contributing to the resilience of coastal systems by top-down control of epiphytes and macroalgae [29,30], which are strong competitors of corals and seagrasses [31,32]. Even though this importance is particularly pronounced on coral reefs, epiphytic algae growing on seagrass have profound impacts on seagrass growth through shading, especially in turbid areas with little light [31,33]. By grazing directly on the seagrass leaves, herbivorous fish increase turn-over rates of seagrass material, which creates positive feedback loops through decreased epiphyte loads [10,34]. Consequently, the overfishing of herbivorous fish such as parrotfish (Labridae, Scarinae), rabbitfish (Siganidae) and surgeonfish (Acanthuridae) may lower the resilience of these systems [5,30,32,35]. Coral reefs and seagrasses with increased resilience have a greater capacity to recover from disturbances to their original states [36,37].
Parrotfish comprise a diverse group of herbivores, including browsers, grazers, scrapers and excavators [38,39] and constitute an important link between microorganisms, detritus, plant material and higher trophic levels [40,41,42]. Ecological effects of feeding include mediating coral-algal interactions and clearing settlement space for coral recruits by removing the EAM [5,11,43,44,45]. By feeding on the reef matrix, excavating and scraping species also play important roles in reef erosion and sediment production and transport [14,17,46]. Furthermore, grazing and scraping parrotfish that crop off the EAM contribute to decreasing sediment loads that otherwise can accumulate in high quantities, caught in taller turf algae [12,47]. High sediment content usually deters herbivorous fish and can result in negative effects on reef health such as favouring of algal growth and inhibition of coral larval settlement [12,48,49]. Parrotfish are also important grazers in seagrass systems, e.g., the Atlantic genus Sparisoma and the Indo-Pacific genera Leptoscarus and Calotomus, that feed on seagrass leaves and/or the epiphytes growing on them [42,50,51,52].
In some cases, biomass and functional group richness of herbivorous fish have been used as proxies for spatial mapping resilience of coral reef ecosystems, with areas of elevated biomass indicating a higher resilience [24,53]. This may also be a useful approach for seagrass-dominated seascapes, since the distribution of fish in seagrass meadows changes according to seascape configuration and seagrass meadow characteristics [10,54,55]. By understanding how biomass of herbivorous fish is distributed in the seascape, it may be possible to indicate areas more susceptible to phase shifts and areas of higher resilience. Coastal systems are increasingly subjected to anthropogenic stressors such as coastal development, climate change and overfishing [32]. Anthropogenic-induced nutrient loads often benefit macroalgae and epiphytes and may induce phase shifts to turf or macroalgal-dominated states in coastal areas [4,9,31]. Detailed knowledge about the role of herbivorous fishes in ecosystem function and resilience is therefore highly valuable for proper management of these systems, since some of these species may help prevent phase shifts [2]. Similarly, information on the spatial distribution of herbivorous fish is crucial for our understanding of how different species influence the benthic communities and consequently, reef and seagrass ecosystem functioning in multi-habitat seascapes [2,19,24,56]. Previous studies on the effects of proximity and the spatial arrangement of habitats on fish species in the seascape have found that habitats located at close distances to each other have an elevated fish species diversity [54,57] with implications for some ecological functions [22,23].
This study investigated patterns of abundance, foraging behaviour and substrate selectivity of three species of parrotfish that are common and widespread in the seagrass-reef seascapes of the Western Indian Ocean (WIO). To date, most studies on this subject have been conducted in the Caribbean and the Pacific, while less is known about parrotfish feeding in the WIO. In the WIO, Scarus rubroviolaceus, Scarus ghobban and Leptoscarus vaigiensis represent three species with different life histories: reef-associated during all life stages (S. rubroviolaceus), seagrass-associated during early life stages and reef-associated as an adult (S. ghobban) and seagrass-associated during all life stages (L vaigiensis). It has previously been suggested that habitat connectivity influences herbivory rates on coral reefs in the Pacific [23] and here we further investigate: [i] how seascape configuration (distance between different habitats) and habitat characteristics structure the distribution of herbivorous species with different life histories; and [ii] the foraging ecology of S. rubroviolaceus, S. ghobban and L. vaigiensis in the WIO. We then discuss how their spatial distribution and functional roles regarding feeding may contribute to ecosystem functioning in a multi-habitat seascape.

2. Materials and Methods
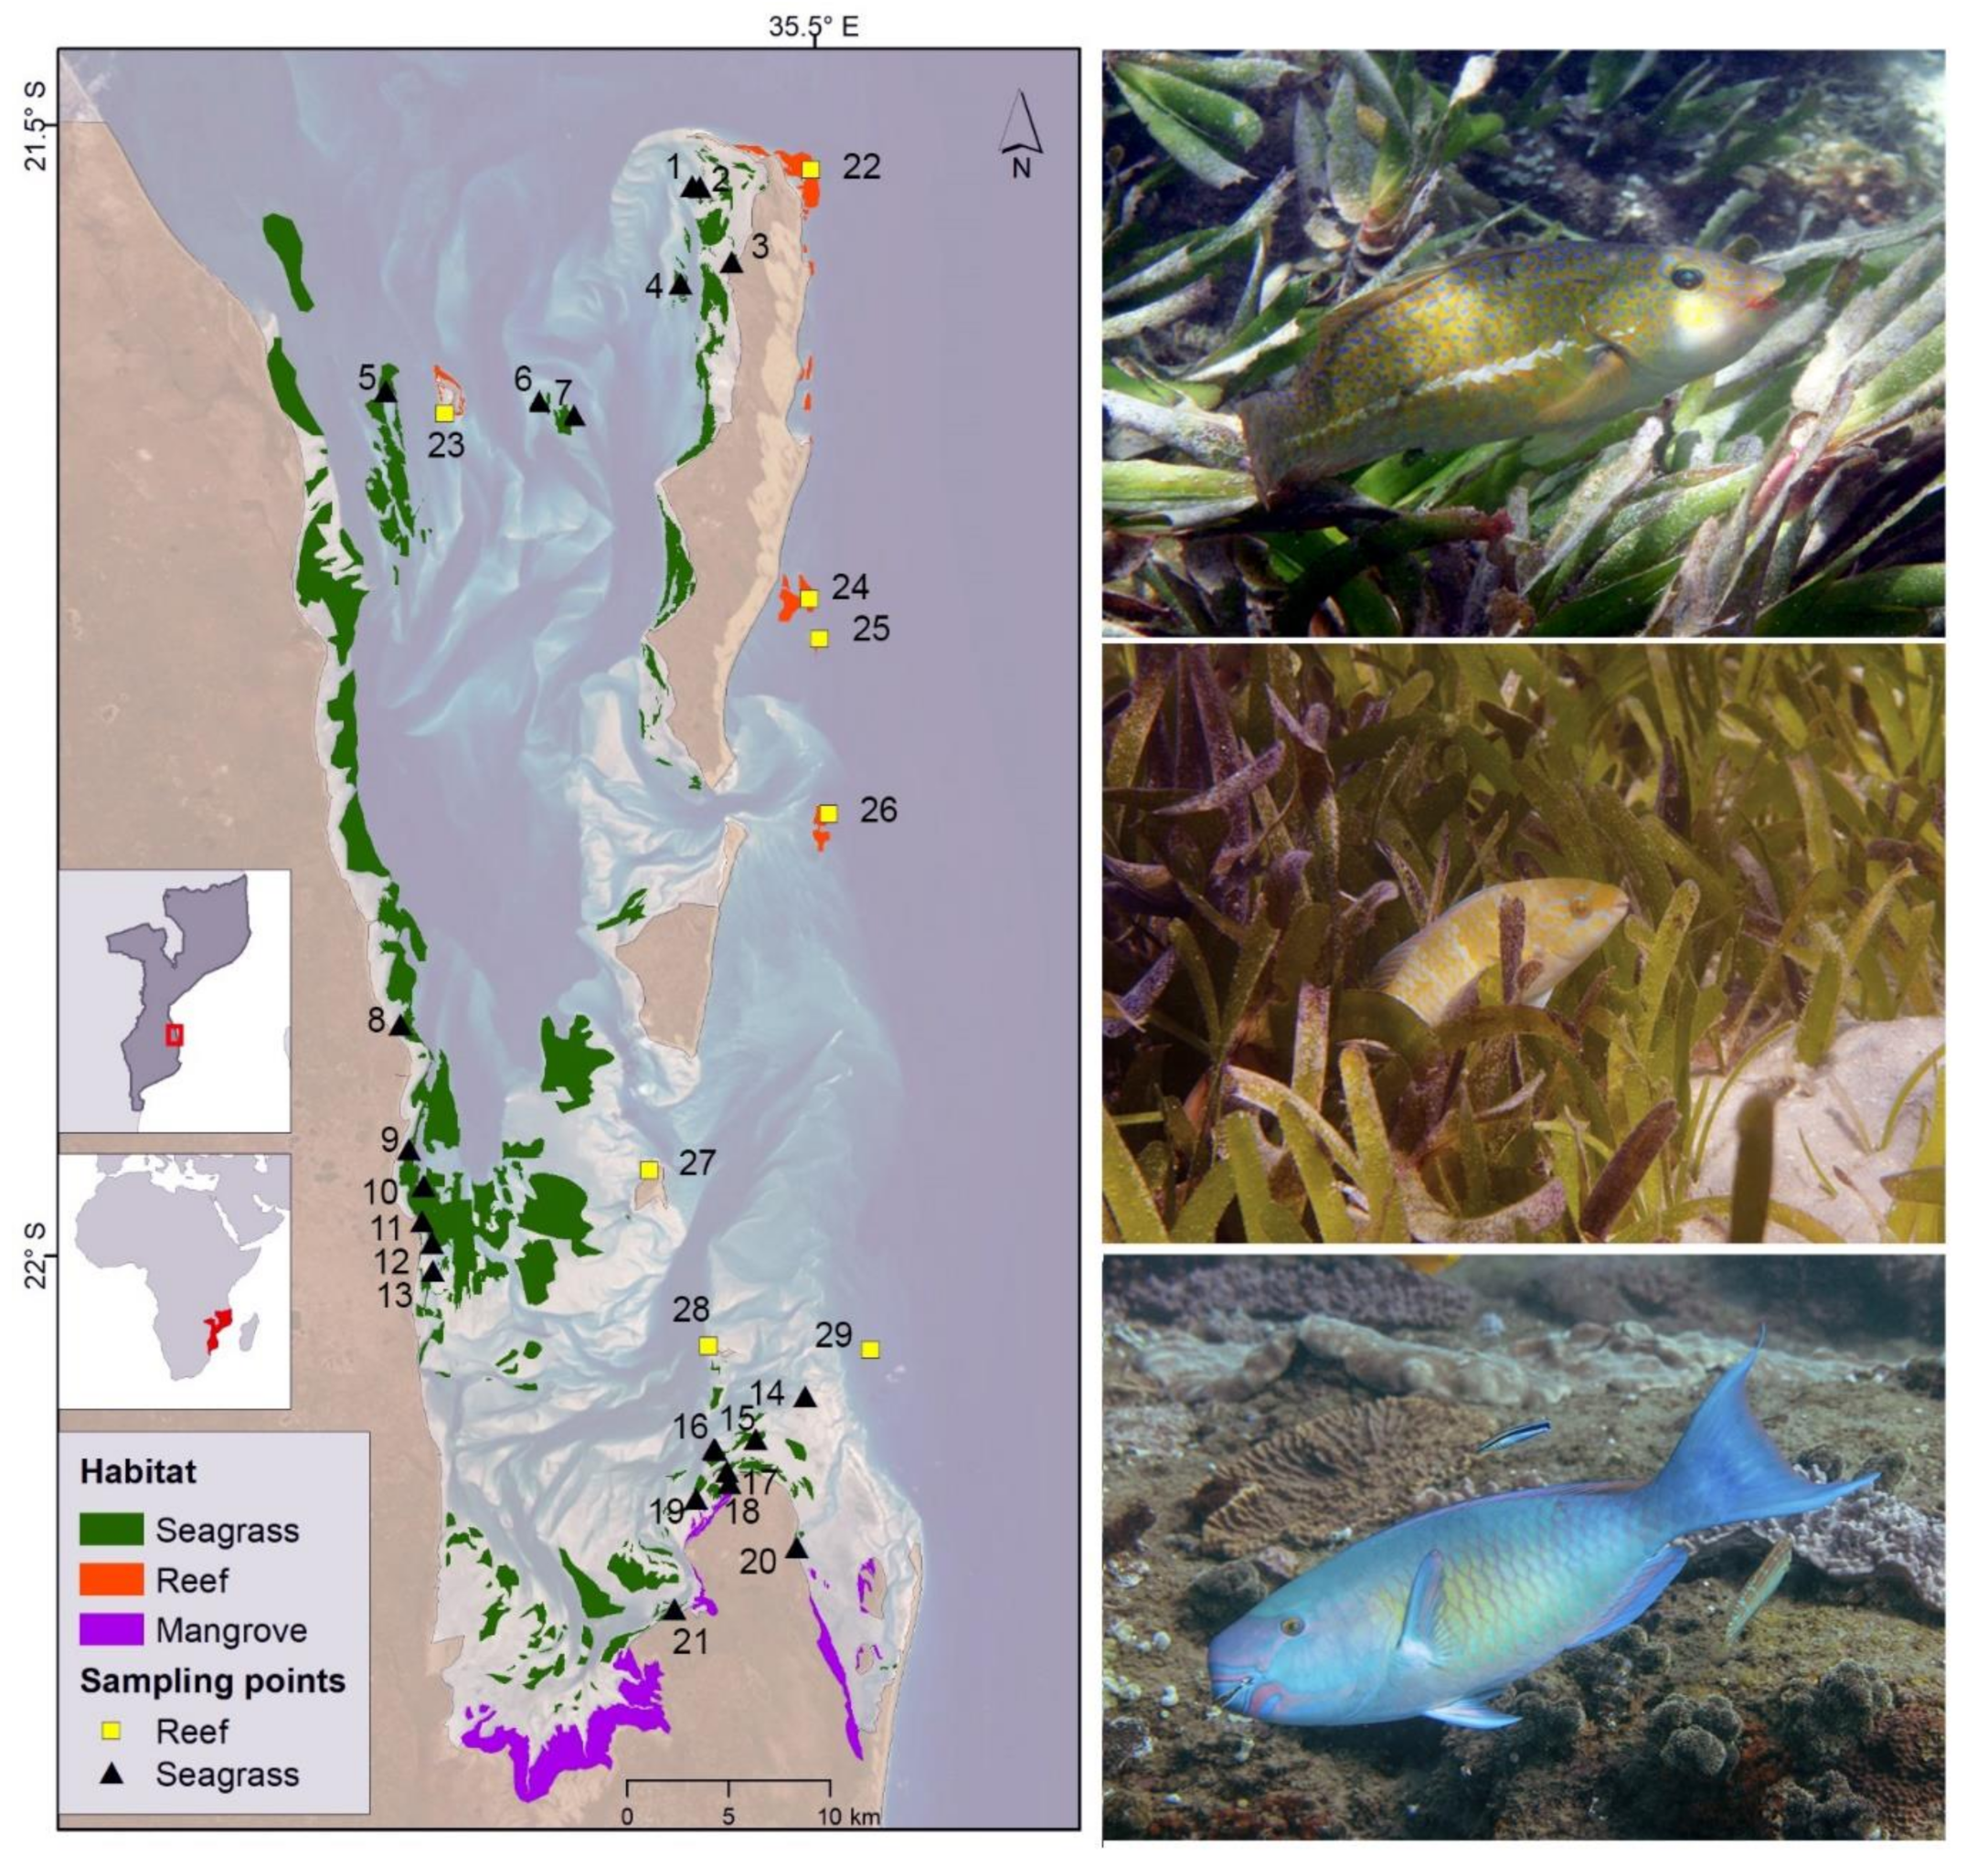
2.1. Study Site

This study was performed in the Bazaruto Archipelago, Mozambique (21.5° S, 35.4° E), which comprises five offshore islands and a peninsula bordering an extensive shallow area of seagrass beds (mainly Thalassodendron ciliatum, Thalassia hemprichii and Cymodocea spp.), sandbanks and tidal channels (Figure 1). Reefs are primarily submerged fringing and patch reefs on the seaward side of the offshore islands, isolated from each other by stretches of sand [58]. The reefs and seagrass beds are subjected to strong tidal currents and all reefs located on the east (seaward) side of the islands are exposed to ocean swells [58]. Most reefs are located at about 10 m depth, but three (23, 28 and the backreef area of 26) are shallower (1–5 m deep) (Figure 1). While most reefs in the study area are within a no-take marine reserve that has been in place since the 1970’s, seagrass areas and tidal channels are the primary fishing ground for the coastal communities [59,60].
The blue-barred parrotfish Scarus ghobban Forsskål, 1775 and the ember parrotfish Scarus rubroviolaceus Bleeker, 1847 are among the larger species of parrotfish in the Bazaruto Archipelago (maximum size ca. 90 cm, [61,62]. They are relatively common and broadly distributed among reef systems in the Indo-Pacific [14,63,64,65]. Scarus ghobban resides in seagrass beds as juveniles and then migrates to reef habitats as it grows [62]. Scarus rubroviolaceus spends all life stages on reefs [62] and is an important bioeroder, especially the larger individuals [14,66,67,68]. The marbled parrotfish Leptoscarus vaigiensis (Quoy and Gaimard, 1824) resides in seagrass meadows during all life stages [69]. The most common parrotfishes in the seagrass meadows in the Bazaruto Archipelago are L. vaigiensis and juvenile S. ghobban [70]. These two species are widespread in coastal areas throughout the region and are frequently targeted in the artisanal fishery [59,65,71,72,73]. However, there is limited knowledge of feeding behaviour by L. vaigiensis (but see [69,71,74]) and S. ghobban in the WIO. Furthermore, little is known about how grazing patterns of S. ghobban are related to ontogenetic habitat shifts.
The reefs within the Bazaruto Archipelago Marine Park boundaries can be considered near-pristine, with healthy coral cover, abundant fish populations and no (or limited) extractive activity [60,75]. Parrotfish of all size ranges are common [75]. This is important because parrotfish diet and ecological function related to foraging vary with size [76,77,78,79].

2.2. Fish and Habitat Surveys

Data on fish and benthos in seagrass meadows and on the reefs in the Bazaruto Archipelago were collected during January–March 2016 and February–April 2017. We assessed parrotfish abundance with replicated underwater visual censuses (UVCs) in eight reefs and 19 seagrass meadows (minimum of seven replicates within each site). Sites were chosen based on logistics and location in the seascape regarding distances between habitats in order to sample along a gradient of distances between seagrass and coral reef. In total, 154 reef and 204 seagrass surveys were conducted (Figure 1). Each UVC was a strip transect 25 m long and 2 m wide in seagrass habitats and 4 m wide in reef habitats. In the seagrass, each UVC was georeferenced with a handheld GPS device, kept in a buoy. This was not possible for the reef surveys, where an average location was marked from the boat. A diver swam along the transect line at a constant speed laying out the transect tape, identifying all species to lowest taxonomic level and estimating the size (total length, TL) to the nearest cm of all fish within the width of the transect [80]. Transects in seagrass habitats were narrower due to the dense refuge potential of the habitat and cryptic nature of the fish therein. Data on the three focal species of parrotfish was then extracted from the full dataset. Parrotfish life phase (juvenile, initial phase (IP), or terminal phase (TP) was recorded based on colour pattern [62]. Leptoscarus vaigiensis is one of the few species of parrotfish that does not change sex [62] and as males and females are similar in appearance, they were simply classified as “juveniles” or “adults”. Estimated biomass of each observed individual was calculated from length data using the allometric length–weight conversion W = a × TLb, where parameters a and b are species-specific constants obtained from FishBase [62].
The benthic community composition on reef sites was evaluated along each UVC by taking photographs of a 50 × 50 cm steel bar quadrat placed every 5 m along the transect tape (5 photos per UVC). Each photo was later analyzed with the photoQuad software [81]. In each photo, the benthic taxa underlying each of 30 random points for each frame were identified to highest possible taxonomic resolution and subsequently grouped into functional categories. Substrates were categorized into the following groups: “Ascidians”, “Articulate Coralline Algae (ACA)”, “Crustose Coraline Algae (CCA)”, “Epilithic algal matrix (EAM) on carbonate”, “EAM on rock”, “Hard coral”, “Macroalgae”, “Soft Coral”, “Sponges”, “Zoanthidae”, “Sand”, “Rock”, “Coral rubble” and “Other”. The latter included items not comprised in any of the former categories, such as bivalves and feather hydroids and constituted <1% of total coverage.
Seagrass habitat characteristics were quantified at two random locations along the transect, one in the first half of the transect and one in the second half. Within a 50 × 50 cm quadrat, the height of the three tallest observed individual plants was measured, from which average maximum canopy height was calculated. Percent cover of each seagrass species present was visually estimated, to derive total seagrass cover and seagrass species composition. Depth was recorded with a dive computer at the start of each UVC.

2.3. Spatial Metrics

Seascape variables for each of the reef and seagrass UVCs were derived from a categorical habitat map of the Bazaruto Archipelago, constructed in ArcMap (version 10.5) [70]. Details on how the map was constructed can be found in [70,75]. Distances to adjacent habitats (land, mangroves, seagrass and reefs) from each UVC in the seagrass and from each reef site were obtained with the “Generate near table” tool in the ArcMap toolbox, measured from the edge of each habitat in ArcMap. If the line crossed land, the line was instead manually traced, simulating the shortest route between the surveys and the habitat through the tidal channels.

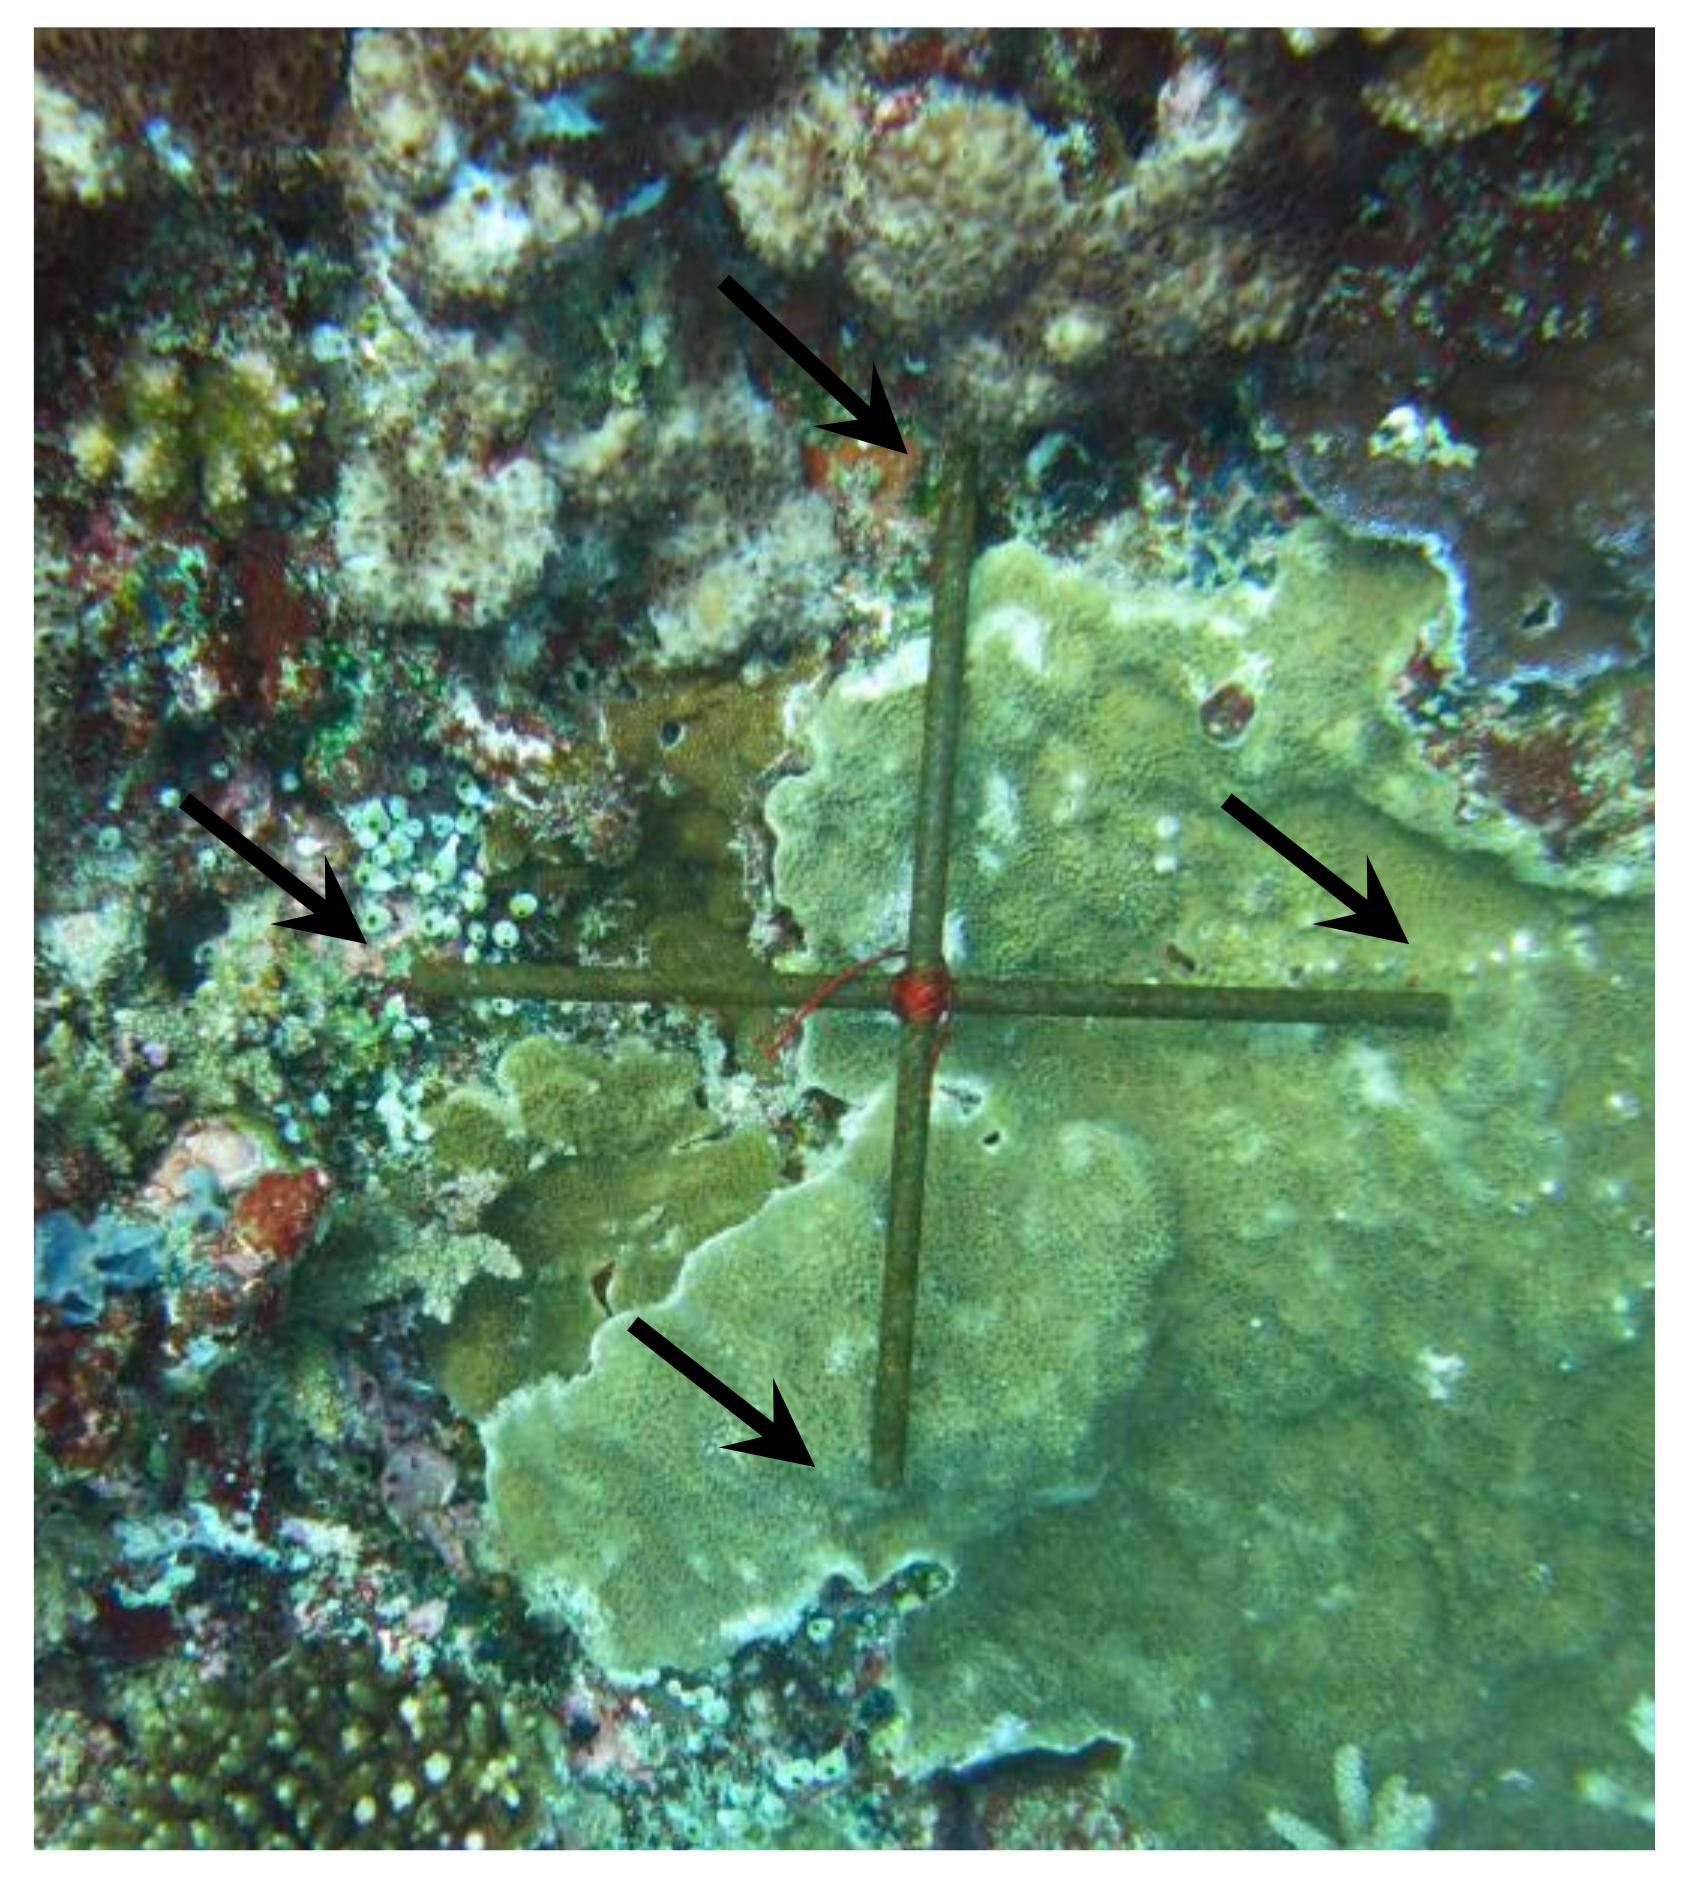
2.4. Bite Rate and Substrate Selectivity

Bite rates of parrotfishes were observed on seven different reefs (28, 29, 26, 24, 22, 23 and 27, Figure 1) and in five different seagrass meadows (21, 16, 19, 5 and 11, Figure 1) during daylight hours (07:00–15:30). Observations in seagrass meadows were done while snorkelling, as were those on shallow reef sites (<2 m). Observations on deeper reefs (>2 m) were conducted with SCUBA. In both habitats, a parrotfish was haphazardly chosen and observed for 3 minutes by a single diver/snorkeler. The number of bites and the substrate type of each bite was recorded. We also recorded the presence of feeding scars. This was done at the point of the last bite of the 3 min observation period for each fish. Fish size (TL) was estimated to the closest centimetre and life phase was registered (juvenile, IP, or TP). If a fish was lost before the end of the 3-minute period, the time passed was recorded to allow bite standardization per minute. Observations less than one minute were not included in bite rate estimates. In the seagrass meadows, bite rates were recorded for 27 L. vaigiensis individuals between 4 and 27 cm (juveniles and IP/TP phase) and 21 S. ghobban individuals between 5 and 28 cm (juveniles and IP phase). On the reefs, data were collected for 58 S. ghobban individuals between 12 and 75 cm (56 IP and 2 TP individuals) and 44 S. rubroviolaceus individuals between 18 and 90 cm (33 IP and 12 TP individuals), while observations of bite scars were recorded for 36 S. rubroviolaceus and 46 S. ghobban because some individuals were lost before the 3 min observation period ended.
To assess feeding selectivity on the reef sites on a small spatial scale, a 25 × 25 cm steel-bar cross was placed on the substrate with the intersection point at the location of the last bite of the observation period (Appendix B, Figure A2). The substrate beneath the end of each of the four arms and where the last bite was taken was recorded. This allowed a description of the relative availability of other substrates in the immediate area of a bite.
We calculated herbivory in a spatial context in the seagrass habitat, i.e., bites per minute per square meter at each site, using average fish abundance at each site. This was obtained by multiplying average fish abundance at each site with average bite rate per species, divided in two size classes, ≤15 and >15 cm. This method does not consider variation in feeding rate due to meadow edge effects [74], but since the UVCs were spread out in the seagrass patches, the data include variation generated by fine scale variation in seagrass and epiphyte characteristics.
To investigate potential spatial variation in bite and bioerosion rates by S. rubroviolaceus on the reefs in the seascape, bioerosion rate per year and m2 at the different reefs were calculated. Bioerosion was calculated separately for each size class of S. rubroviolaceus (16–30, 31–45 and >45 cm), as in [82], using the following approach:
Volume removed per year [cm3 ind−1 year−1] = average bites ind−1 year −1 × average proportion of bites leaving scars × average bite scar volume
Average bite scar volume for the different size classes of S. rubroviolaceus was obtained from [61], since this was not estimated for all recorded bite scars in our study. Volume removed per year was converted to calcium carbonate mass removed per year by using a value of coral density for corals in the Maldives (1.44 g cm3, [83], since no value was available from Mozambique. Calcium carbonate mass removed at each reef per year and per m2 was then obtained by multiplying average S. rubroviolaceus abundance per size class with the estimate of calcium carbonate mass removed per year for each size class and adding bioerosion for the different size classes. This is intended to be used as a relative measurement of bioerosion to illustrate potential differences in rates attributable to seascape and within-habitat variables.

2.5. Data Analyses

To characterize fish distribution, fish substrate selectivity and fish feeding behaviour across the seascape we conducted the following four quantitative analyses. The spatial distribution of S. rubroviolaceus, S. ghobban and L. vaigiensis in the seascape, abundances on reefs and in seagrass meadows were investigated with redundancy analysis (RDA), a direct gradient analysis using Bray–Curtis dissimilarity matrix. Both seascape and within-habitat variables were used as predictors. For the reef surveys, seascape variables included distance to seagrass meadows and distance to mangroves. For seagrass fish data, the predictor variables were distance to reef, distance to mangroves and distance to land. Within-habitat variables for the reef consisted of depth and percent benthic cover and for the seagrass habitats consisted of percent seagrass cover and canopy height. All predictor variables were obtained on UVC level, except distance from reefs to seagrass meadows and to mangroves. For this, an average distance value for each reef site was used, as spatial coordinates were obtained for reef site rather than individual UVC start point. Data were transformed using the Hellinger transformation to decrease the importance of zeros [84].
Bite rates (response variable) were standardized per minute and tested using linear models (ANOVA). The effect of individual fish size was considered in all models, included as a covariable. To address differences in bite rates among co-occurring species (independent variable) in different habitats (independent variable), we used a model accounting for the interaction among the independent variables (habitat x species). For species occurring in a single habitat, we tested only differences in bite rates between species (independent factor). All data were Log10 + 1 transformed to meet assumptions of normal distribution using Shapiro–Wilks’ test and the homoscedasticity of variances was evaluated with the Levenes’ test. Finally, the coefficients were summarized from models applying the anova function (“statistics” package) in R [85].
Feeding substrate selectivity for S. ghobban and S. rubroviolaceus on coral reefs was assessed by using the Strauss’s Linear Index, Li (Li = ripi), where ri corresponds to percentage of bites given in the item i and pi is the relative benthic cover of the item i [86]. Each fish was used as a replicate and benthic cover pi, obtained with the cross method, was used in the analysis. Feeding substrate selectivity related to availability was tested only on reefs and not in seagrass meadows, since cover epiphytes on seagrass blades could not be quantified accurately from quadrat methods.
Bite rate in the different seagrass meadows were modelled with Generalized Additive Models (GAMs), using the same predictors as in the RDAs (seagrass canopy height, seagrass cover, distance to reef, distance to land and distance to mangroves) and each UVC as a replicate. The number of bites for both species was log transformed to meet assumptions of normal distribution. When the estimated degrees of freedom (edf) indicated a linear relationship, the variable was kept in the model without smoother.
Mass of bioeroded material was modelled with GAMs to understand which of the predictor variables (distance to mangroves, distance to seagrass, depth and complexity) significantly influenced bioerosion, using each UVC as a replicate (the distance variables were measured on reef site level). Distance to land was not included since all reefs were positioned at similar distances to land. Data were log-transformed to meet assumptions of normality. Bite rates for S. ghobban on the reefs were modelled with linear models since relationships between predictors and bite rate were linear. Each reef site (n = 18) was used as level of replication, pooling all UVCs per reef site and using average biomass and abundance, since data were not normally distributed despite transformations. Bite rate was square root-transformed to meet assumptions of normality.
Model fitting was done following Akaike’s information criterion (AIC) [87]. The GAMs were performed with the ‘mgvc’ package using restricted maximum likelihood (REML) as smoothing parameter estimation method [88] and the linear models with the ‘lme4’ package. All statistical analyses were performed in R (version 3.3.1) [85].

3. Results

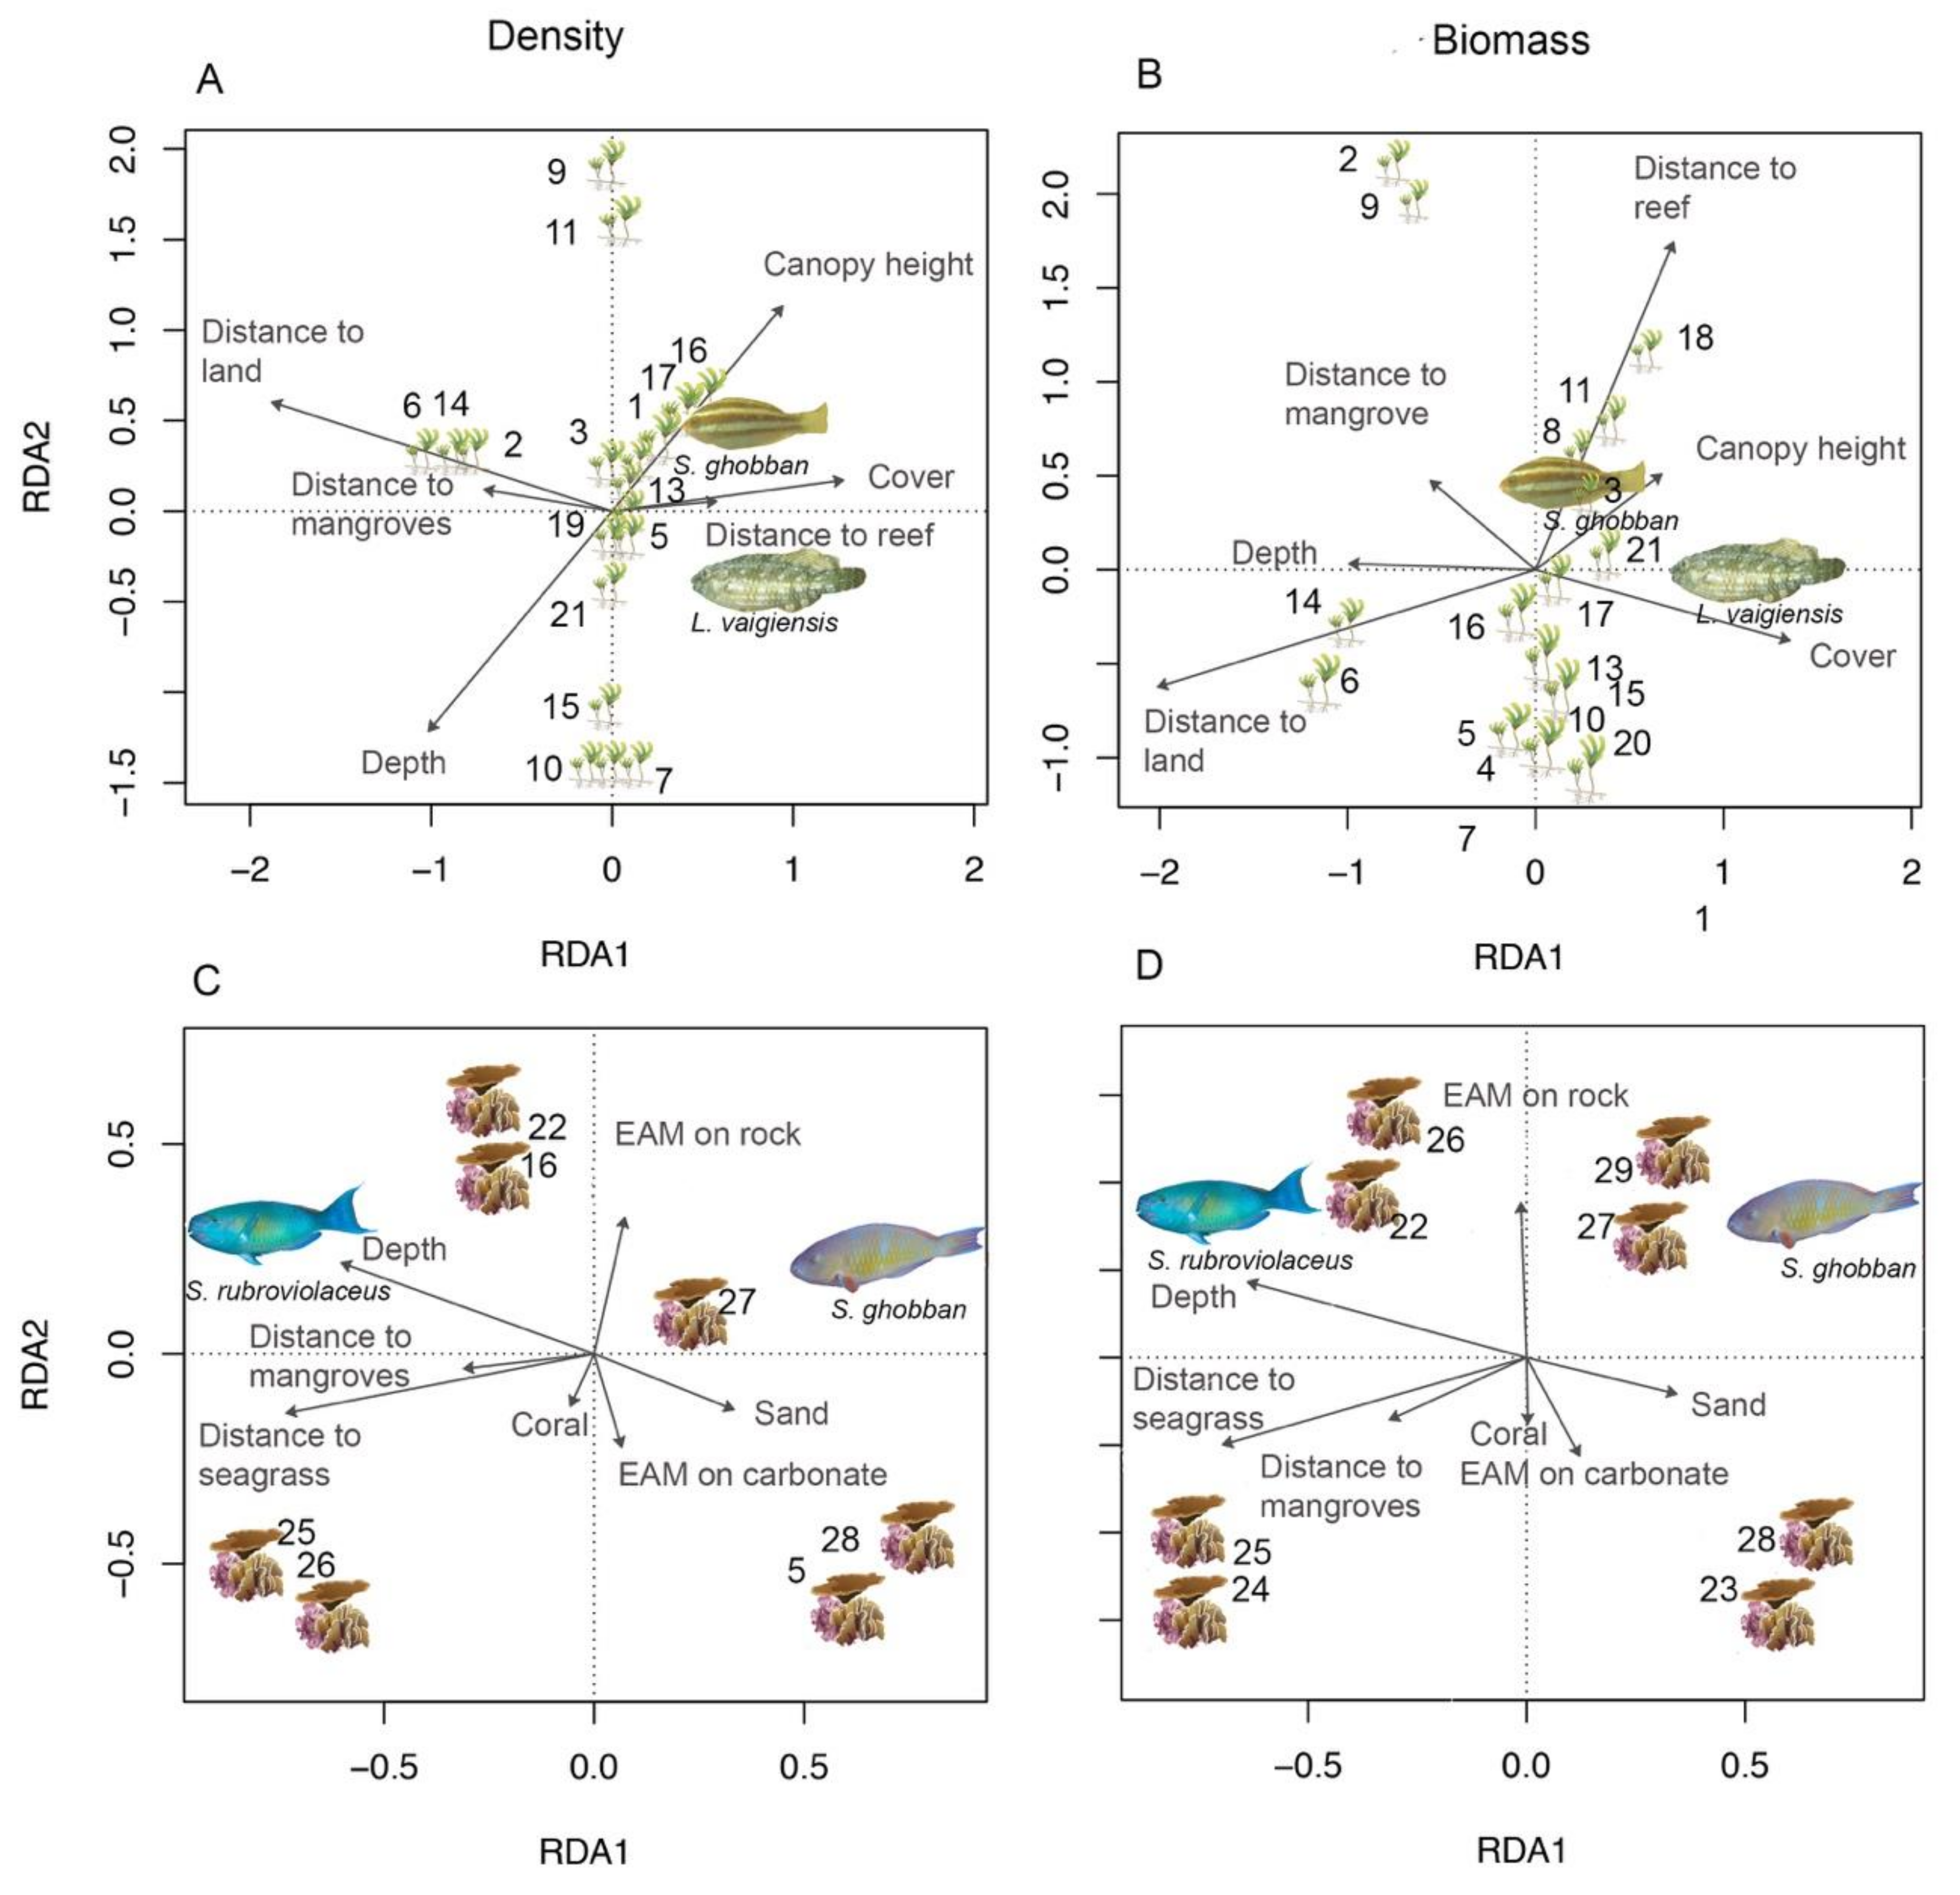
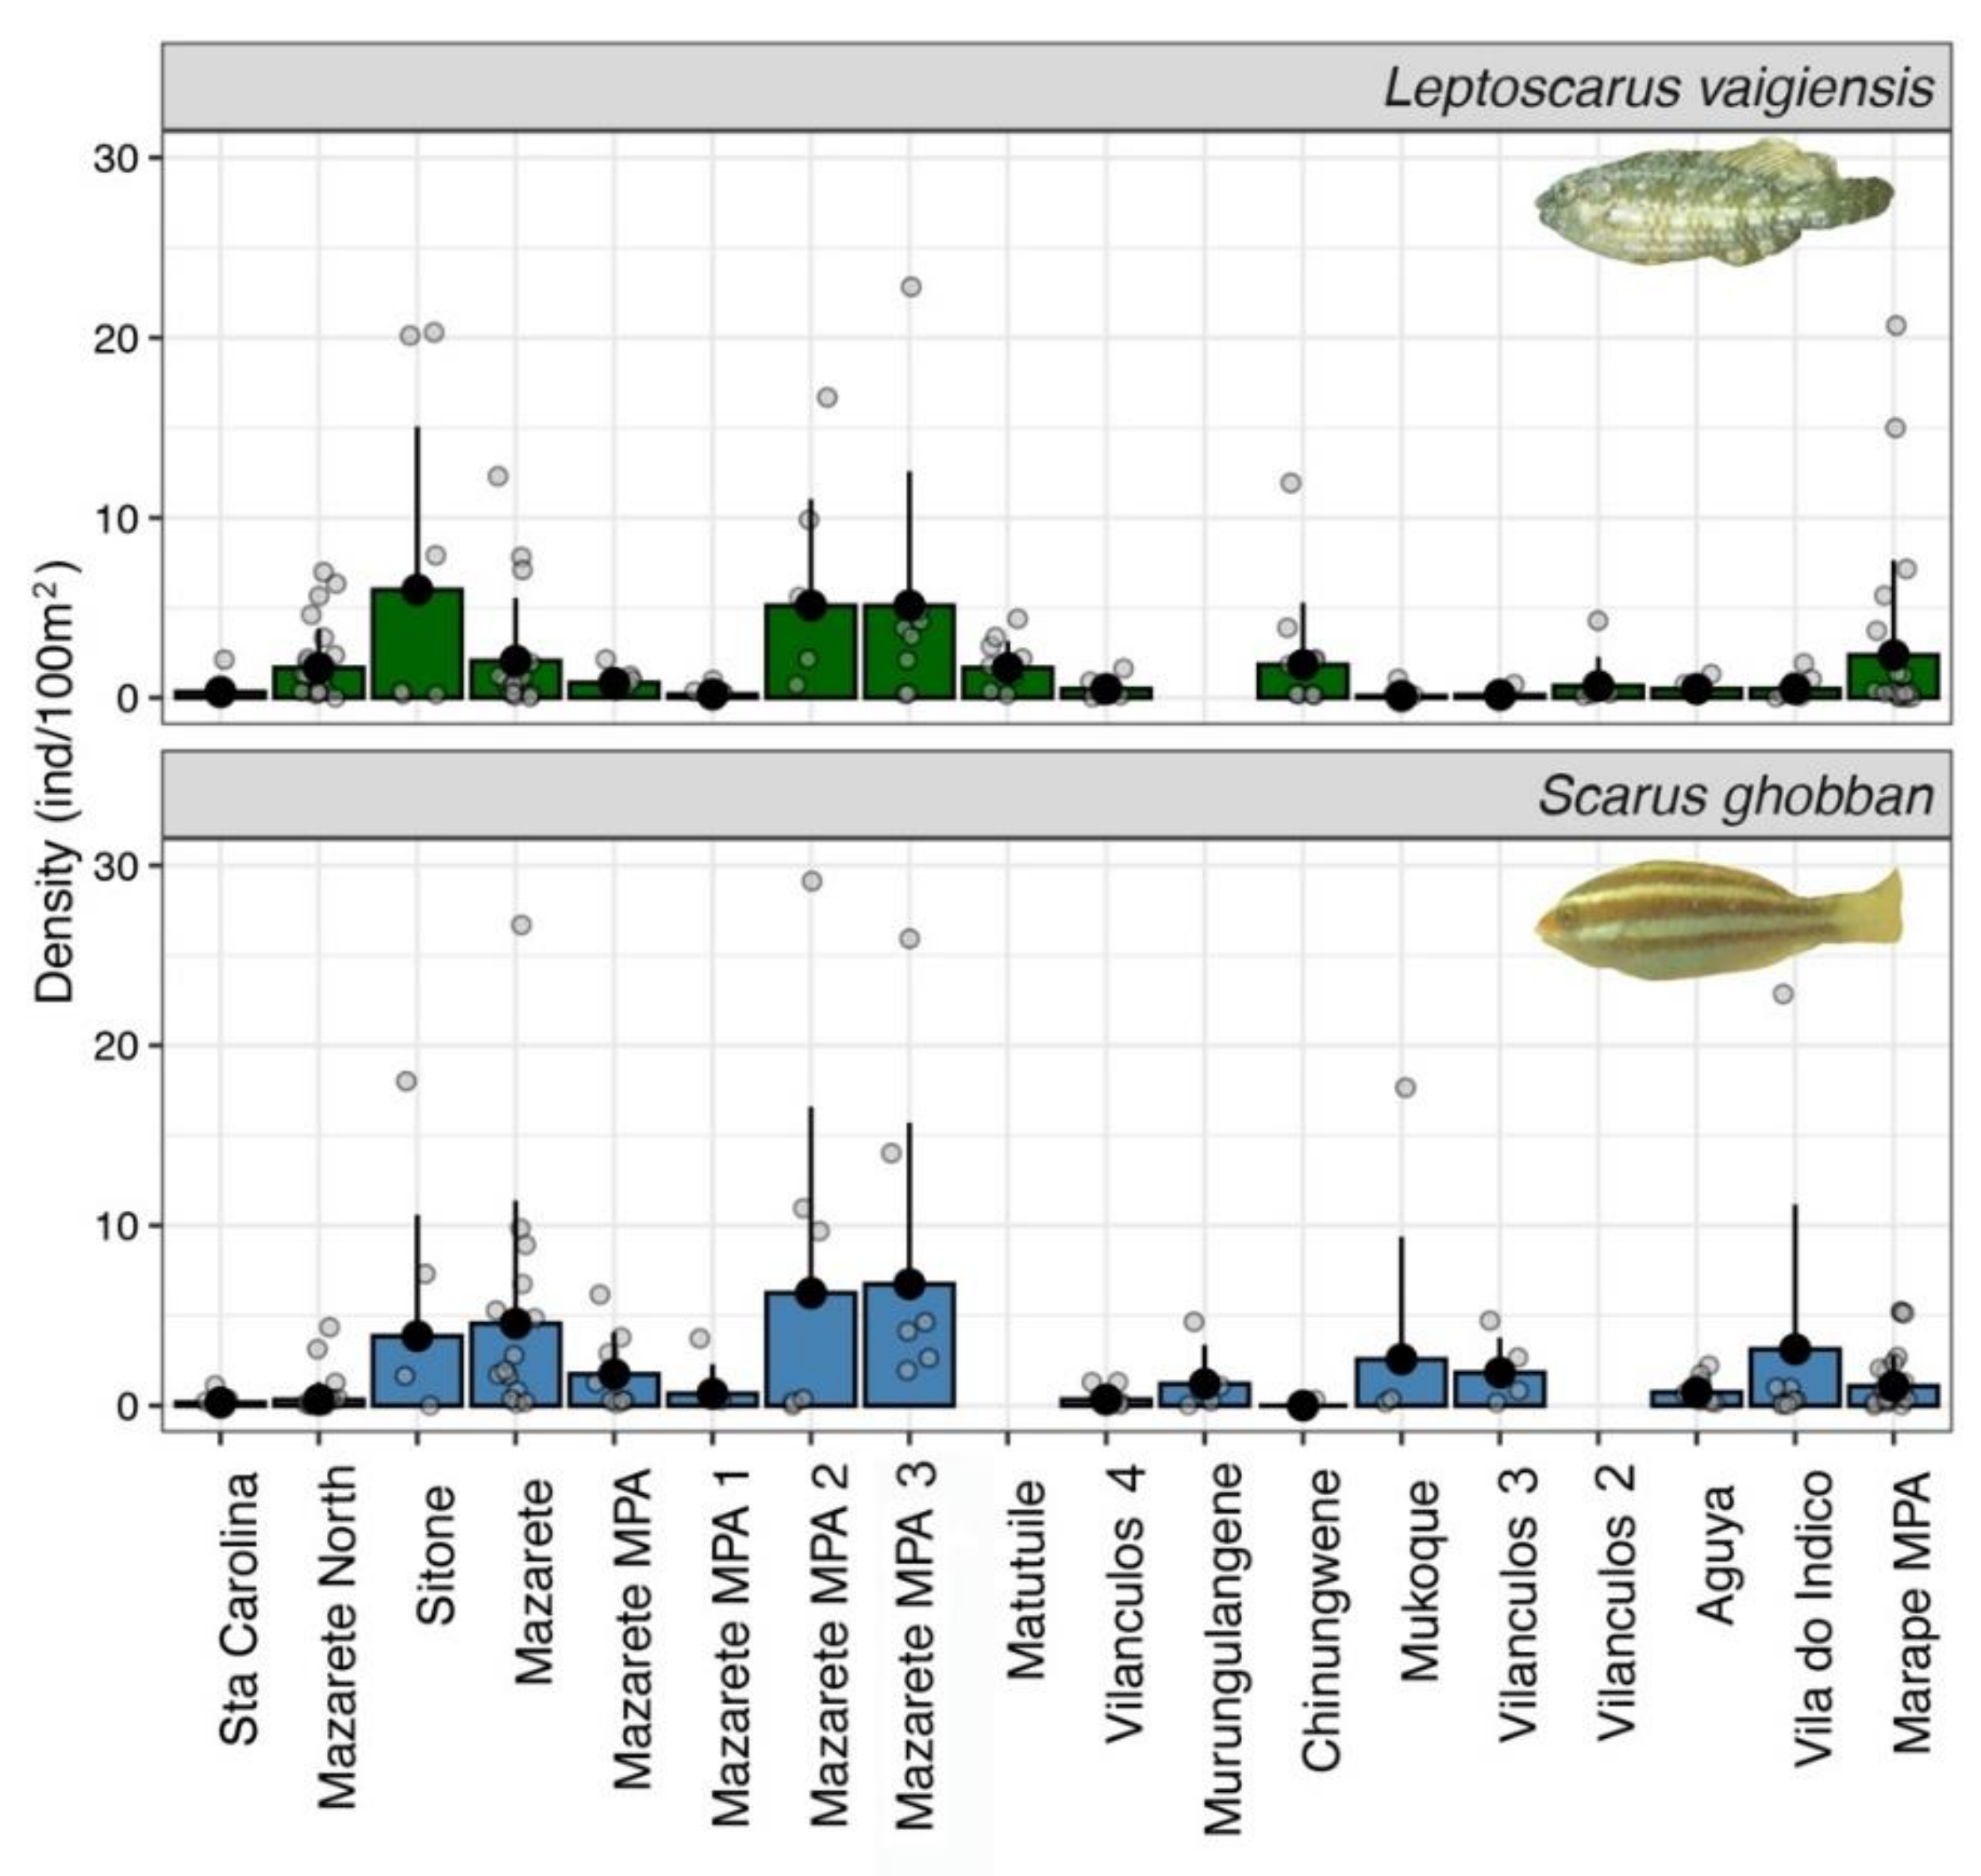
3.1. Fish Abundance and Biomass Patterns

All S. ghobban fish observed in the seagrass meadows were juvenile, except on one occasion when a group of larger individuals (<15 cm) was recorded. Densities of both S. ghobban and L. vaigiensis were highly variable among seagrass meadows, with S. ghobban being slightly more numerous at all sites compared to L. vaigiensis (1.7 ± 0.43 and 1.6 ± 0.27 ind m−2 respectively, Appendix B, Figure A3). The two species were observed swimming together in mixed-species groups. Distance to land was the most influential variable for both S. ghobban and L. vaigiensis density and biomass, with higher abundances at sites closer to land (RDA, adjusted R2 for abundance = 0.583 and for biomass 0.538, Figure 2A,B). High seagrass cover and sites far from reefs had higher densities and biomass of both S. ghobban and L. vaigiensis, whereas canopy height was only influential for densities of juvenile S. ghobban (Figure 2A,B). Shallower depths had higher abundance and biomass of both species.
In reef habitats, depth and distance to seagrass beds were the two most important variables explaining abundance and biomass of S. ghobban and S. rubroviolaceus (RDA, adjusted R2 = 0.877 and 0.877 respectively Figure 2C,D). However, these species showed contrasting results, with S. rubroviolaceus exhibiting higher densities in deeper sites farther from the seagrass meadows (e.g., site 25: 1.43 ± 0.57 and 26: 1.21± 0.36 SE ind 100 m2), while S. ghobban occurred in higher densities on shallow sites closer to seagrass meadows and with higher sand cover (e.g., site 23: 3.90 ± 1.30 and 28: 1.64 ± 0.58 SE ind 100 m2). Both species showed high abundances and biomass on two of the rocky reefs [27,29] (Appendix B, Figure A4). Initial and terminal phases was observed of both species, but no juveniles.

3.2. Habitat Structure

3.2.1. Reefs

The benthic community was dominated by EAM (42.9% ± 2.5 SE) (on rock or carbonate structure) and hard corals. Hard coral cover on the surveyed reefs ranged between 0.2 and 49% (Appendix A and Appendix B, Figure A1 and Figure A5). Sites with highest hard coral cover included 23, 24 and 26 while 22, 28 and 29 were mainly rocky reefs. Depth varied between 1 ± 0.1 and 11 m ± 1.2 SE (Appendix A, Table A1).

3.2.2. Seagrass Meadows

Seagrass cover for each seagrass meadow ranged between 5 ± 0 SE and 88 cm ± 5.9 SE % and tallest seagrass height between 8.5 ± 0 and 41.1 cm ± 18.8 SE (Appendix A, Table A1). Thalassodendron ciliatum was the tallest species, but not all meadows composed of T. ciliatum were taller than meadows composed of Cymodocea spp. or T. hemprichii (Appendix A, Table A1). Depth was always less than 3 m.

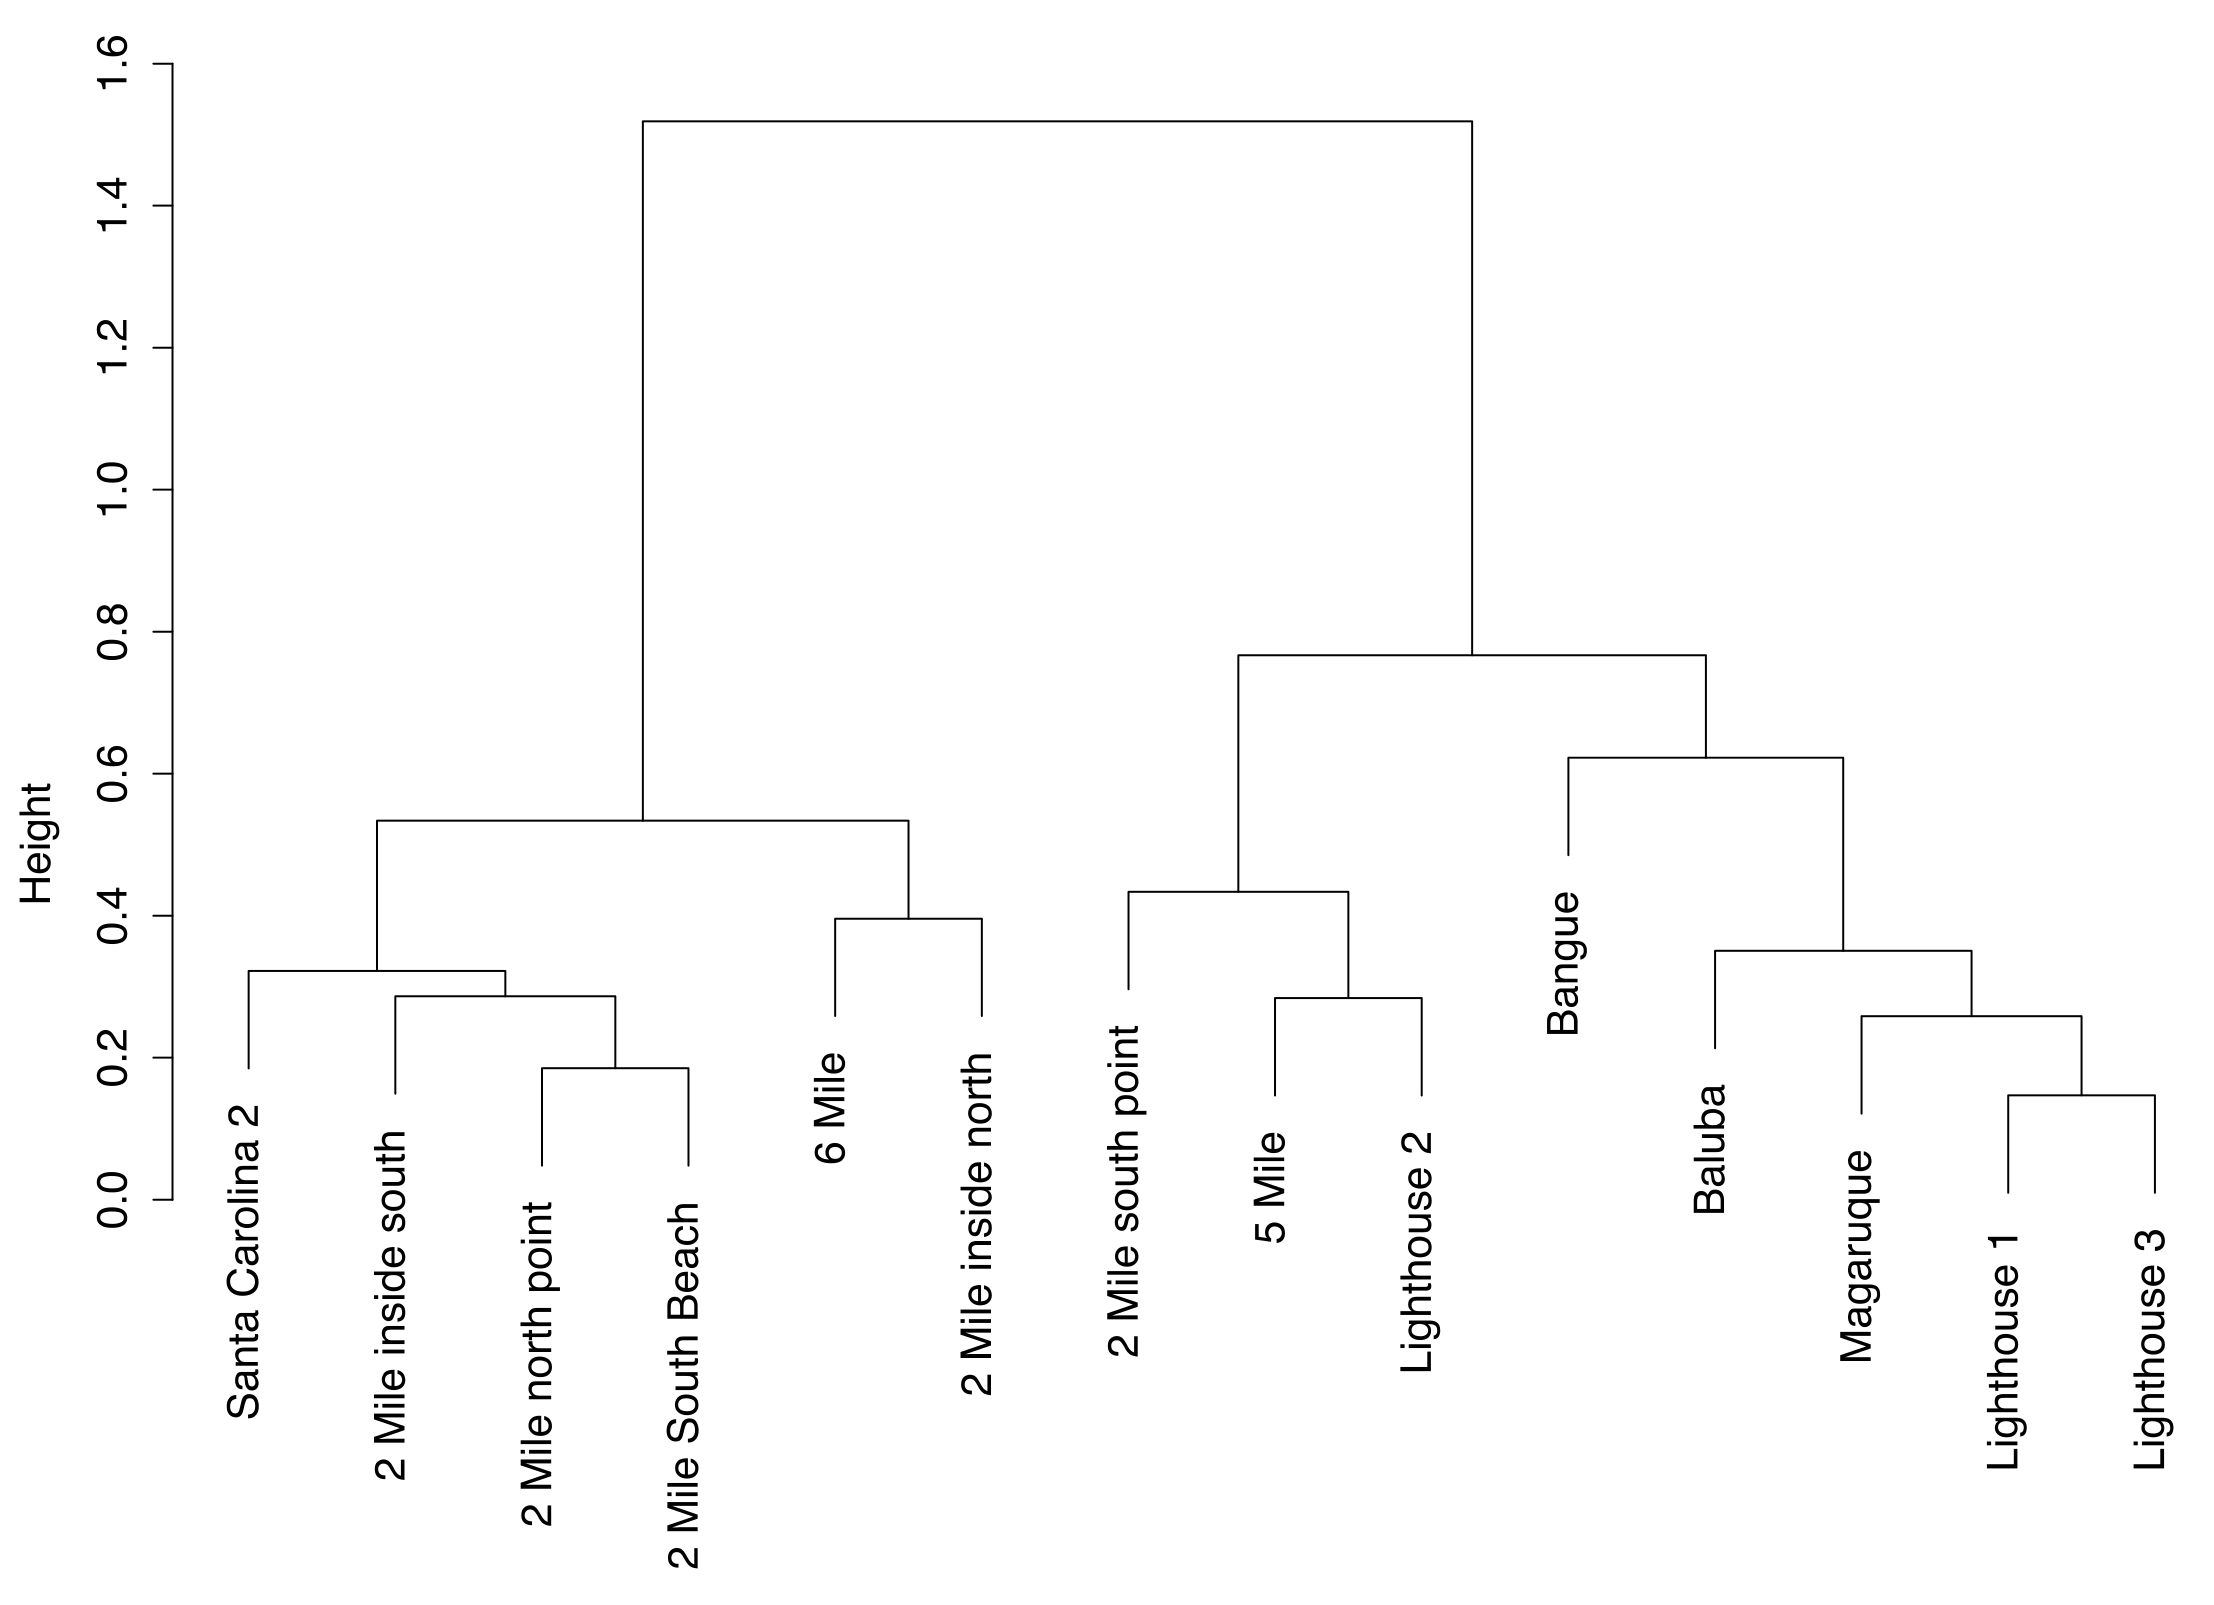
3.3. Spatial Metrics

Distances from reef survey locations to the closest seagrass meadow varied between 0.3 and 11.6 km and between 6.9 and 64.7 km from mangroves in the seascape. The seagrass meadow survey locations occurred 3–13.2 km from the closest reef, 0.2–63.7 km to the closest mangrove and >0.1–4.8 km to the closest land feature (Appendix A, Table A1).

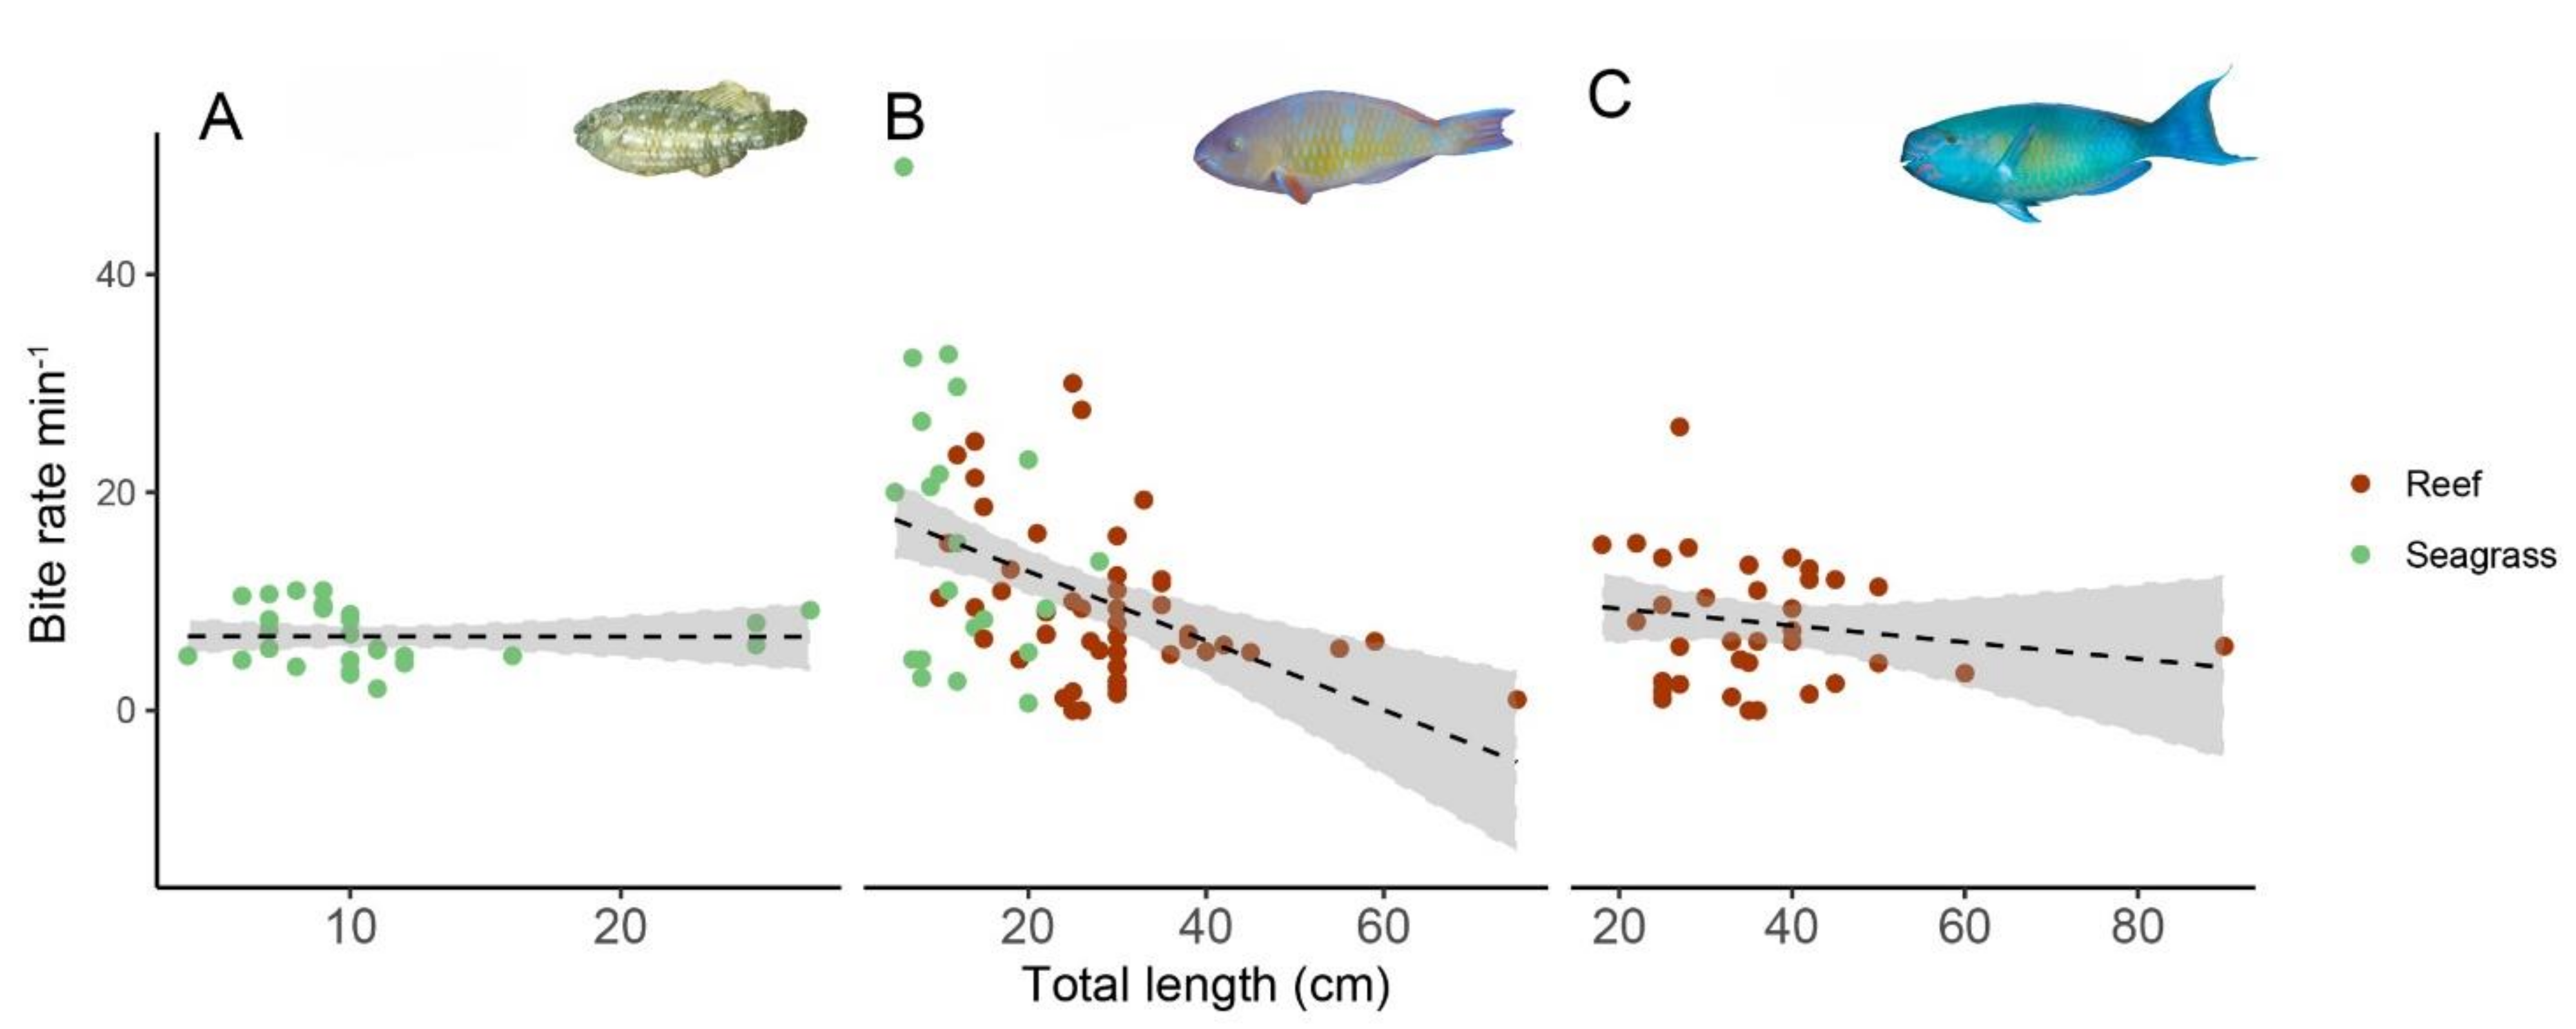
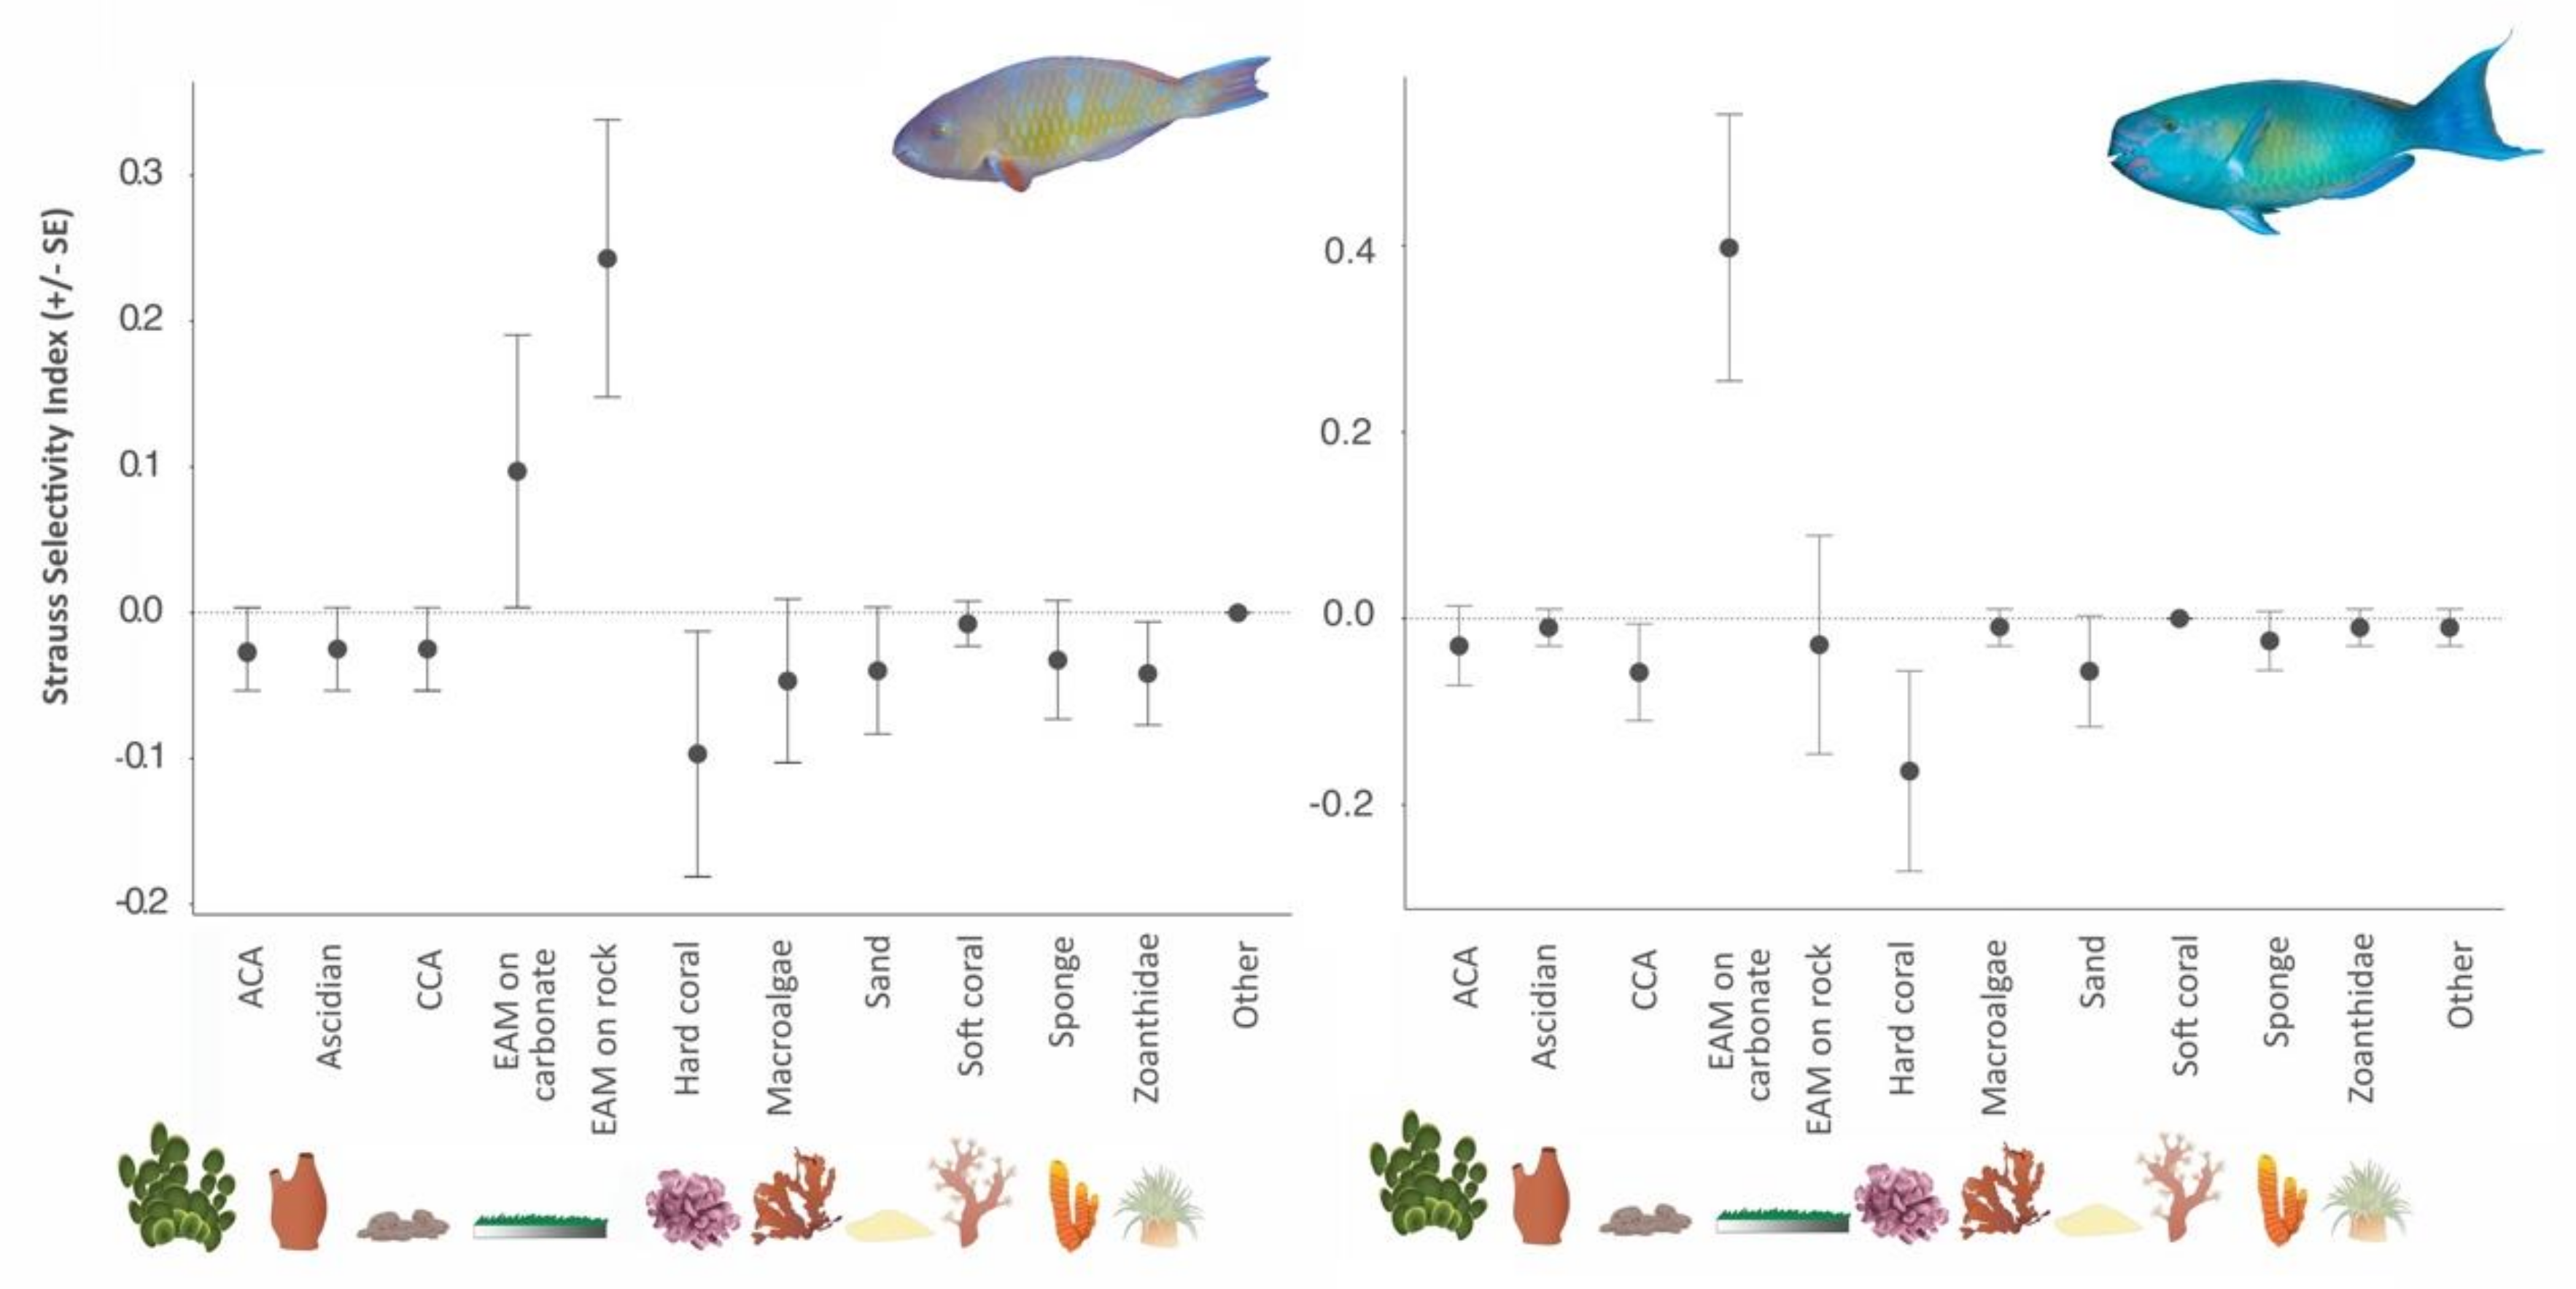
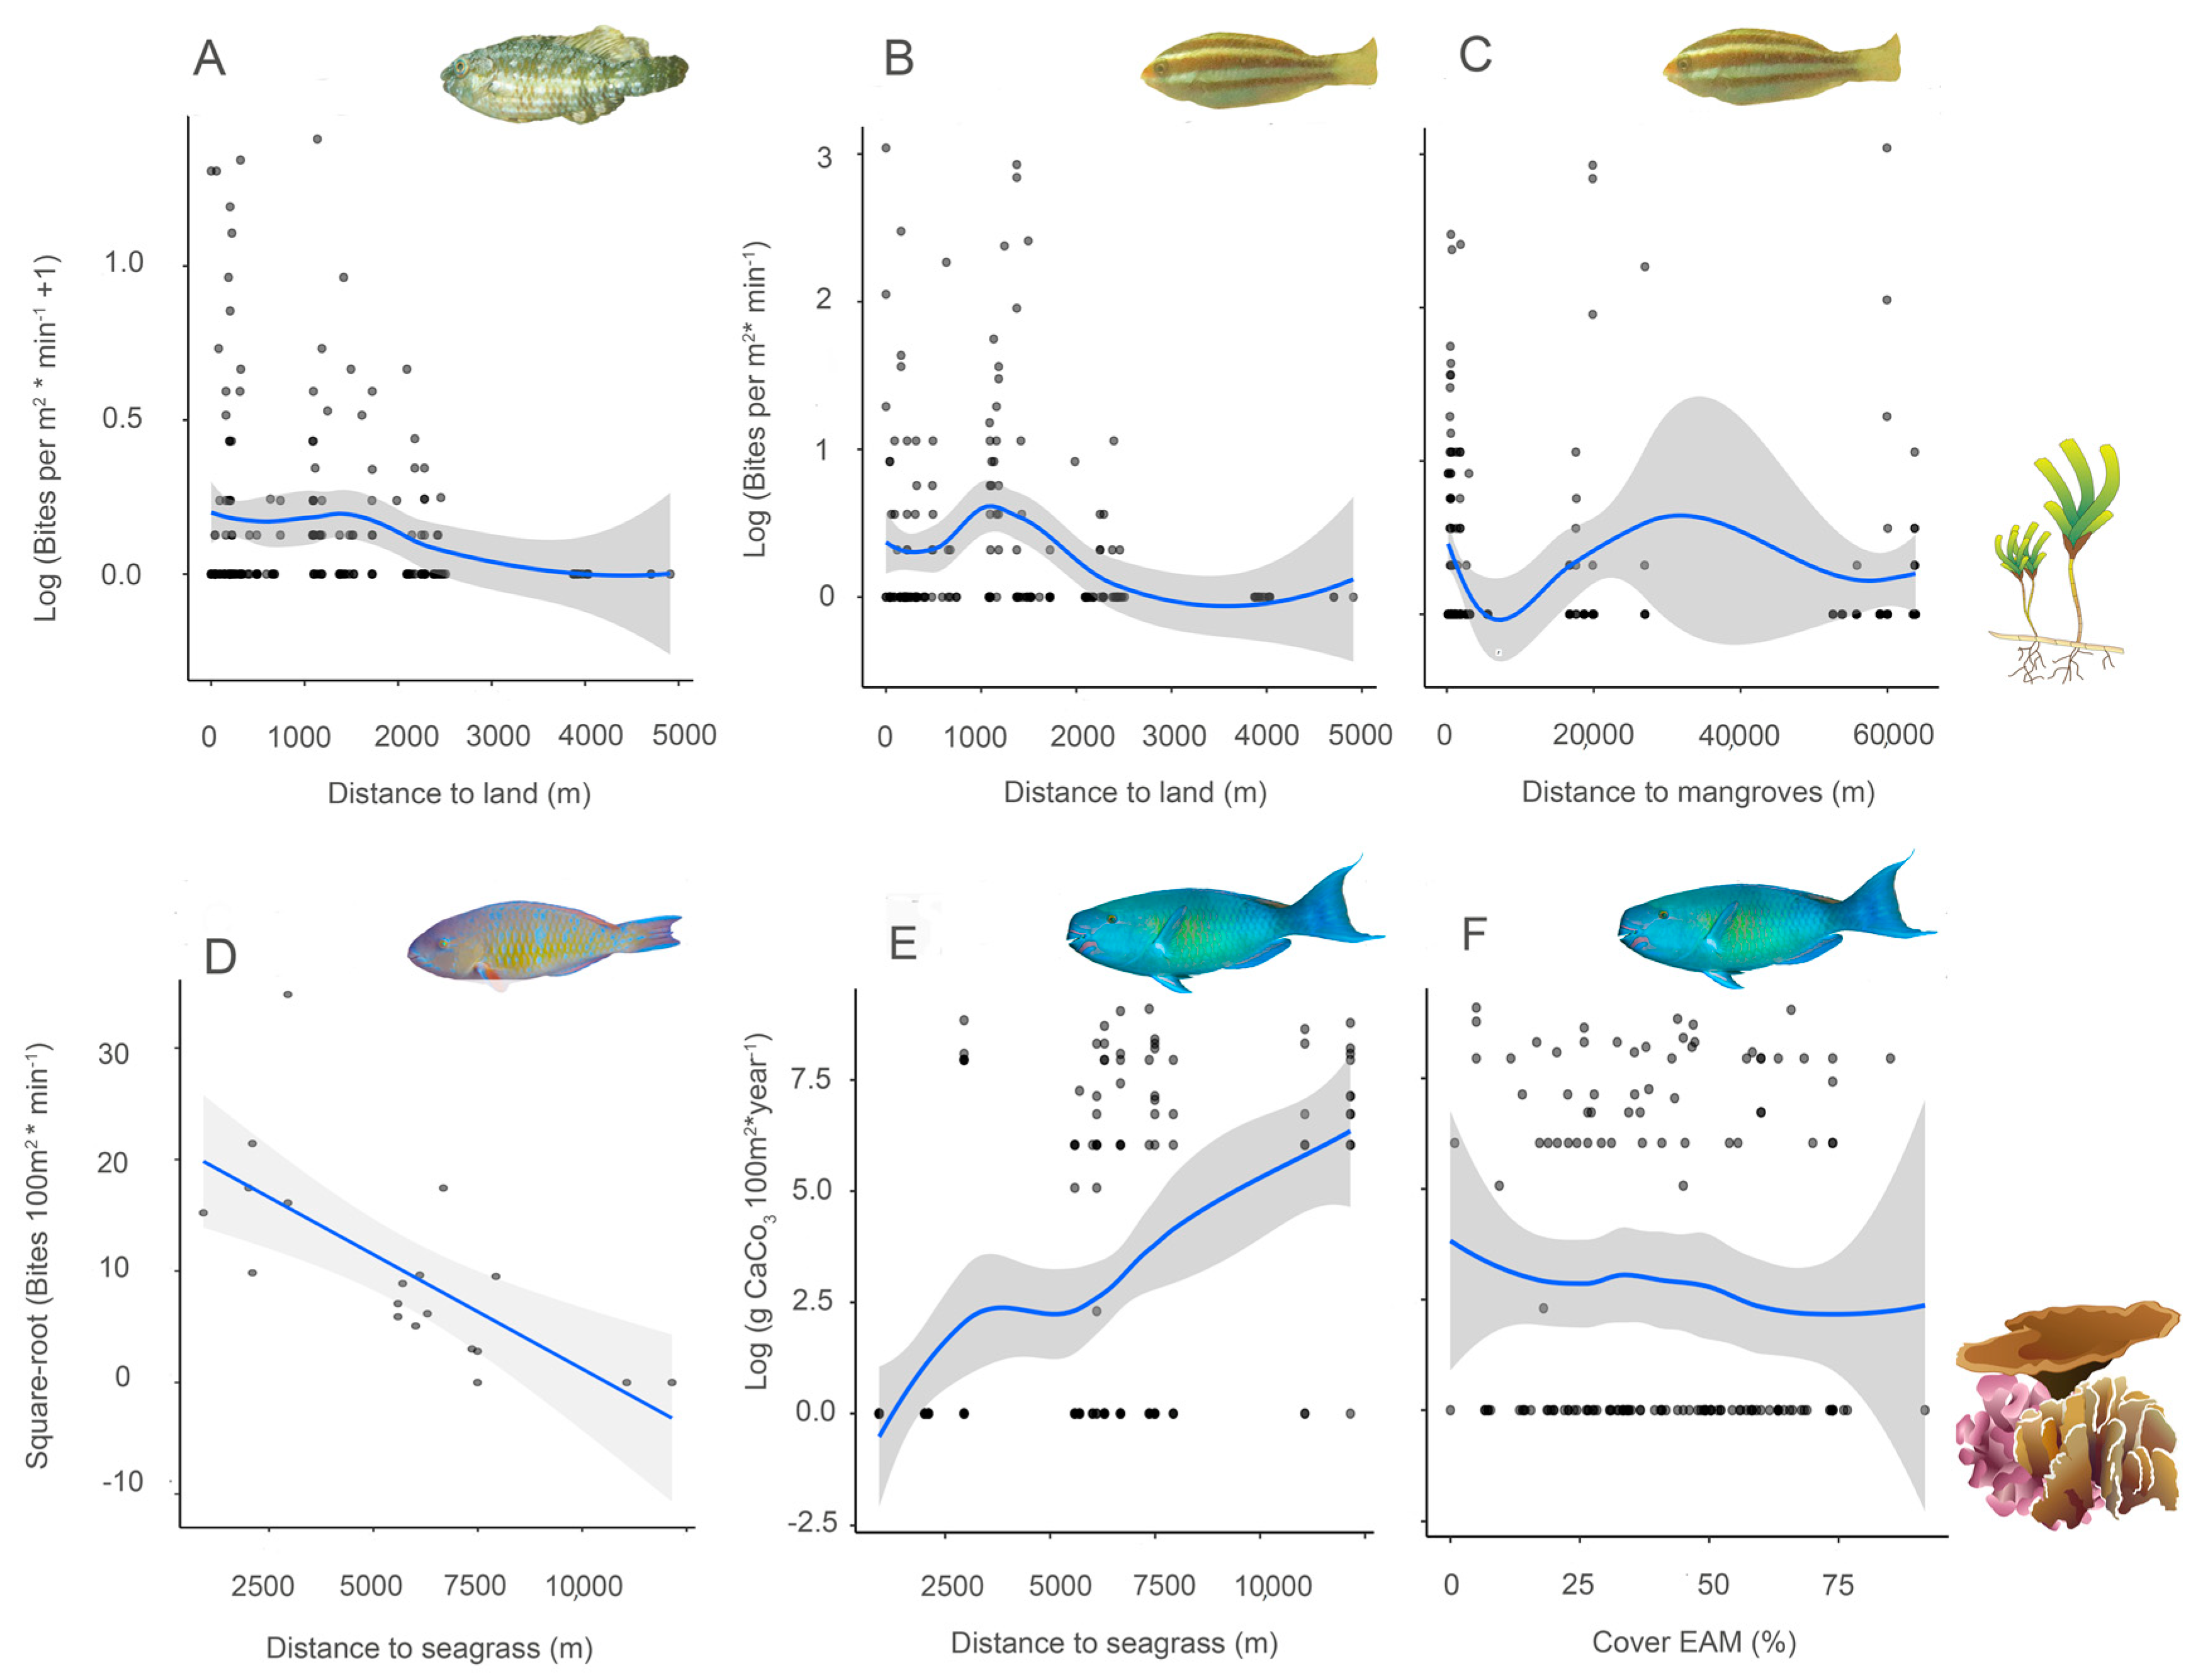
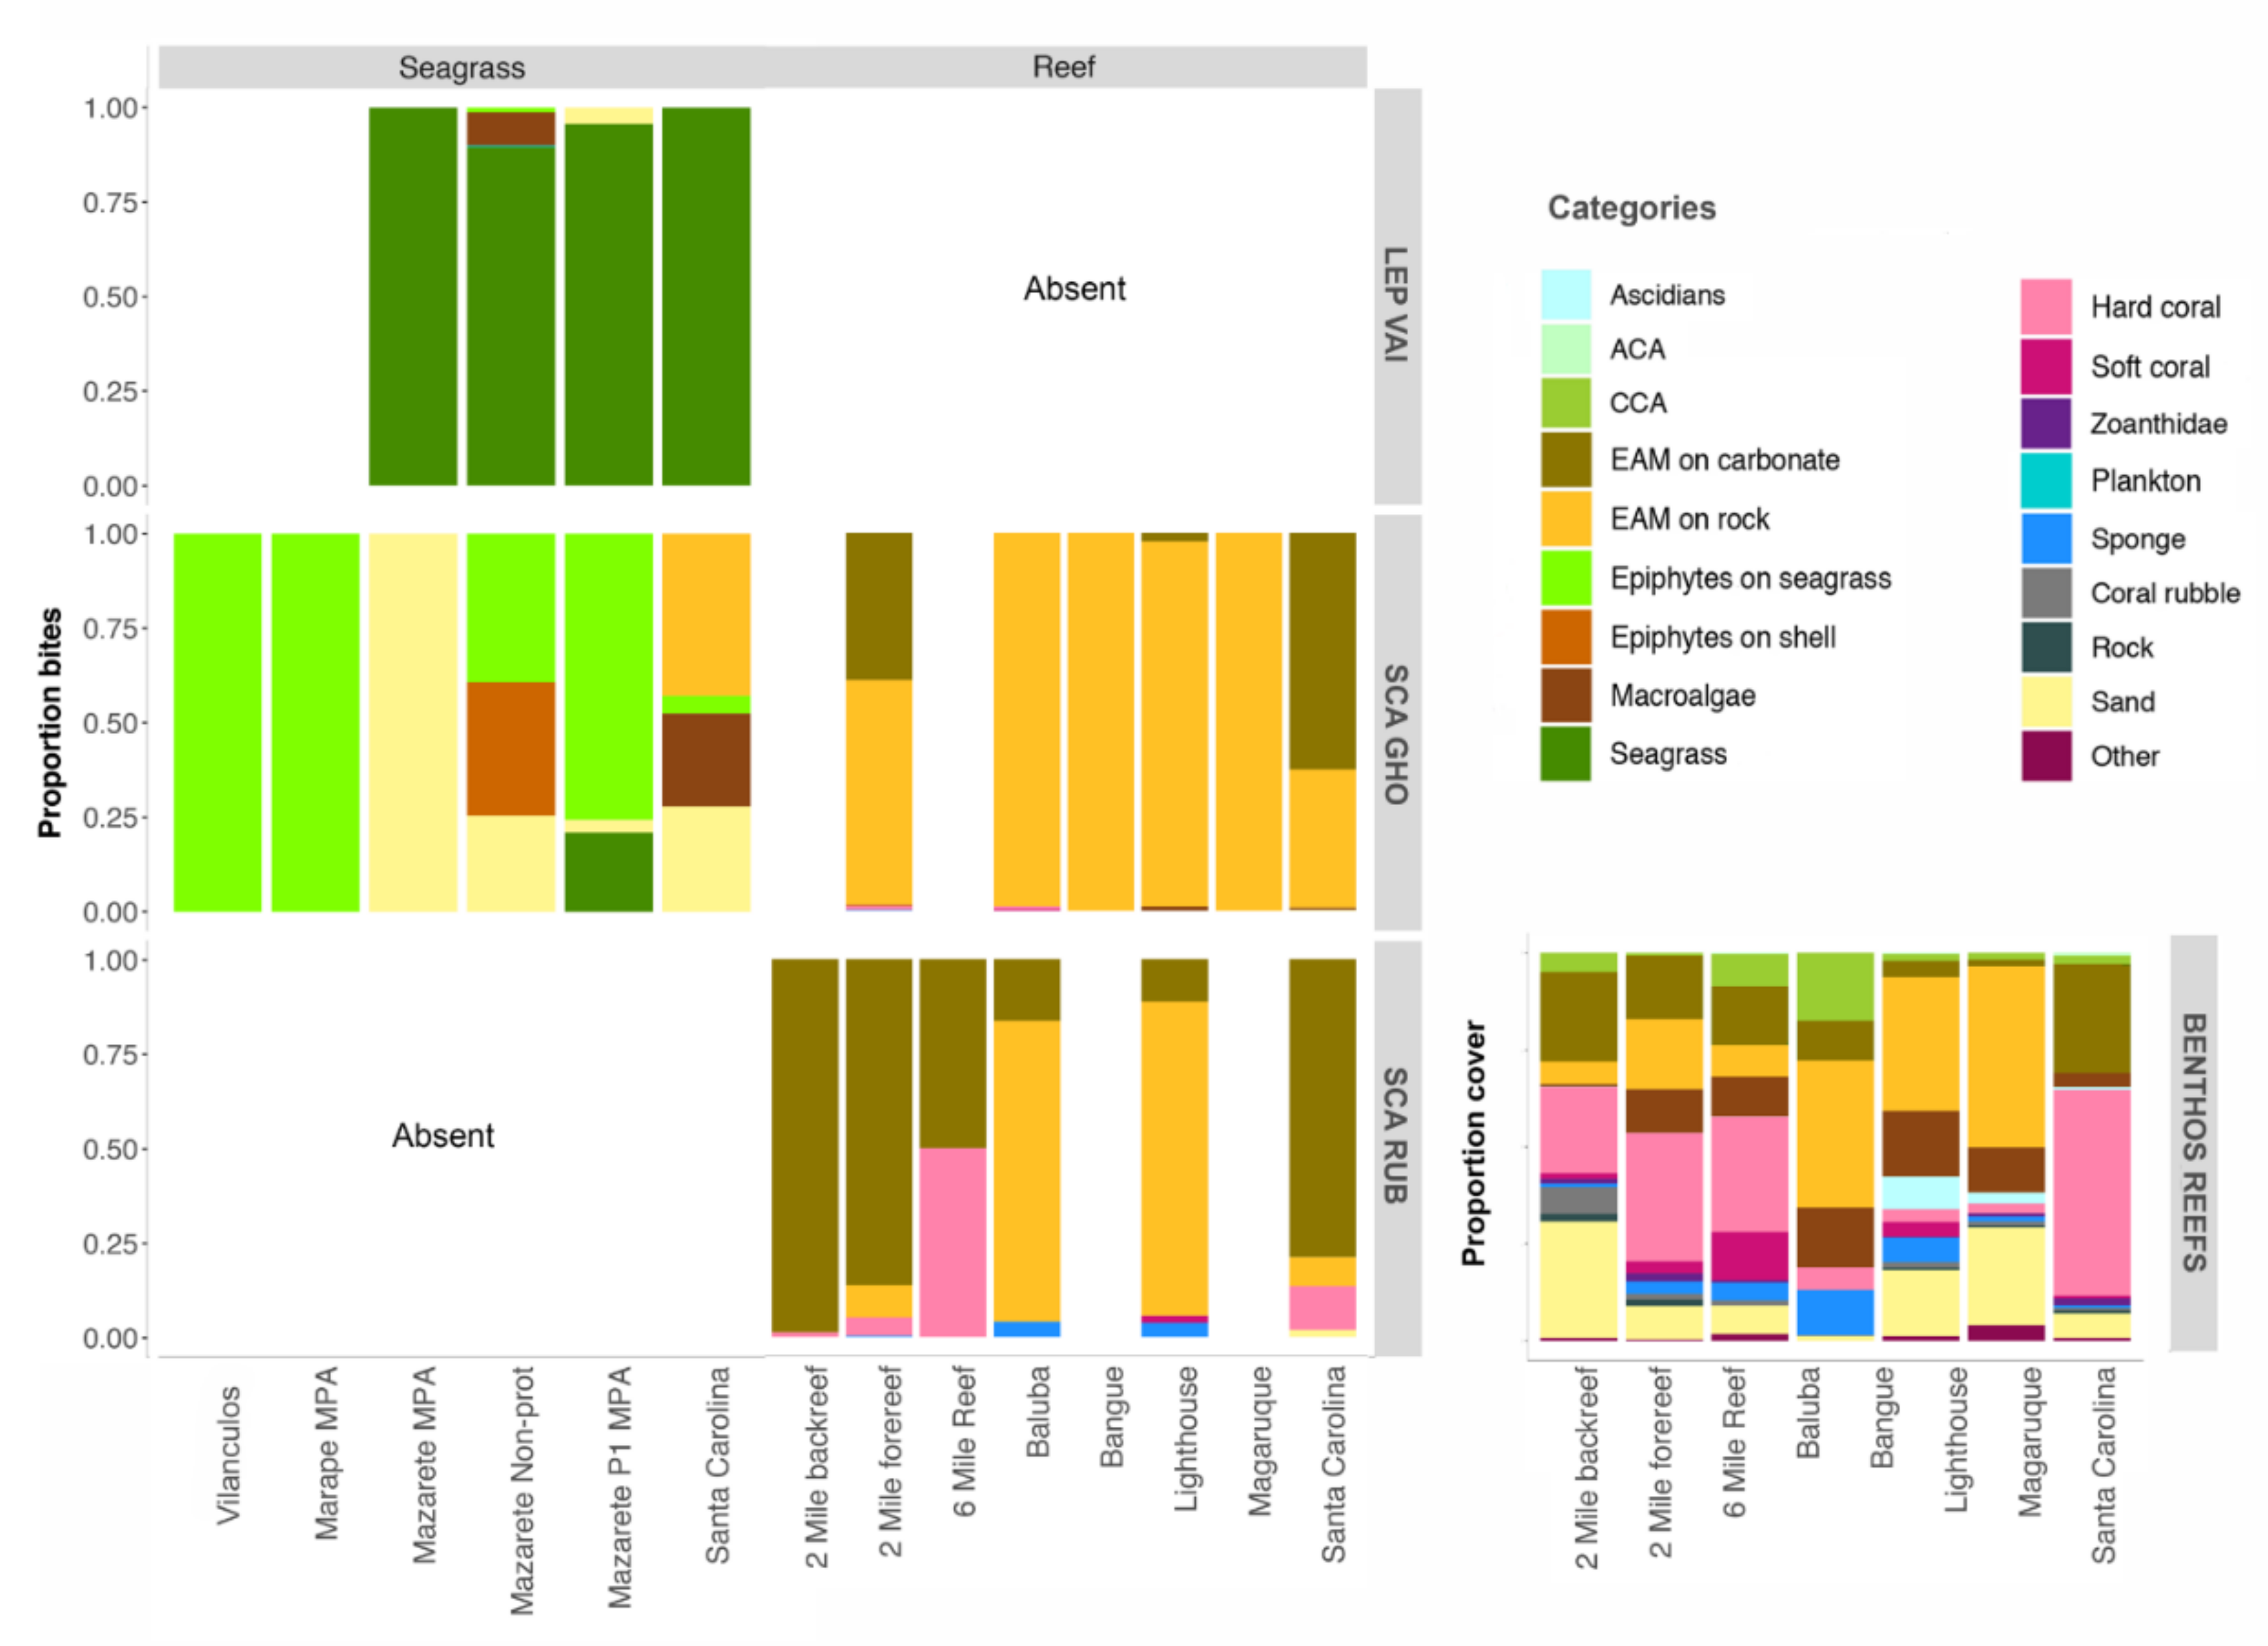
3.4. Bite Rate and Food Selectivity

In the seagrass, S. ghobban displayed significantly higher bite rates, irrespective of size, compared to L. vaigiensis (ANOVA; species-F1,45 = 9.22, p = 0.004; size-F1,45 = 0.47, p = 0.49) (Figure 3). There were no differences in bite rates between S. ghobban and S. rubroviolaceus on the reefs (F1,84 = 0.04, p = 0.84), although bite rate decreased with size (F1,84 = 5.16, p = 0.03) as an artefact of the influence of S. ghobban in the conjunct analysis. Bite rate decreased significantly with size for S. ghobban in both habitats (size-F1,67 = 11.8, p = 0.001; habitat-F1,67 = 0.05, p = 0.82; size * habitat-F1,67 = 0.36, p = 0.55), but not for the other two species (Figure 3. S. rubroviolaceus: F1,34 = 0.10, p = 0.695; L. vaigiensis: F1,25 = 0.16, p = 0.899) (Figure 3).
In seagrass meadows, S. ghobban was observed grazing primarily on the epiphytes or organic material trapped on the epiphytes growing on the seagrass leaves (Appendix B, Figure A5). They were observed to execute a series of rapid picks located at one spot on the seagrass leaf, but similar to the individuals on the reefs, no bite marks were recorded. S. ghobban was also observed picking at the biofilm growing on the sediment/sand, or on other hard substrates such as bivalves and empty shells. In contrast, L. vaigiensis grazed almost exclusively on the seagrass leaves, always leaving large, distinct and round bite marks (Appendix B, Figure A5 and Figure A6). This species was observed to feed on blades with few epiphytes.
On the reefs, both S. ghobban and S. rubroviolaceus fed primarily on the EAM (Appendix B, Figure A5), but the former selected EAM on rocky substrate (Strauss selectivity index, 0.51 ± 0.35 SE) and the latter EAM on carbonate substrate (Strauss selectivity index, 0.47 ± 0.34 SE, Figure 4). Differences in substrate selection were observed between parrotfish species: for example, only S. rubroviolaceus fed on live hard coral (Appendix B, Figure A5). Nineteen percent of the S. rubroviolaceus (n = 44) left bite scars and all such individuals were larger than 34 cm. Of the individuals >34 cm, 40.1% left bite scars. Both IP and TP individuals left bite scars (Appendix B, Figure A7). No S. ghobban were observed leaving bite scars, regardless of size.

3.5. Grazing and Bioerosion

Seagrass meadows in which the highest bite rates occurred were subjected to 0.81 bites min−1 * m−2 by L. vaigiensis and 4.43 bites min−1 * m−2 by S. ghobban (Table 1). Distance to land significantly influenced the number of bites by both L. vaigiensis (GAMs, p < 0.05) and S. ghobban juveniles (Figure 5). Distance to mangroves also had a significant influence on the number of bites by S. ghobban juveniles (GAMs, p < 0.05).

4. Discussion

We show that proximity to different seascape features such as land or seagrass meadows influences abundance and biomass and, consequently, the intensity of ecological functions performed by feeding parrotfish throughout a Western Indian Ocean (WIO) seascape. We found that abundance and biomass of the three studied parrotfish species varied depending on seascape configuration, but not along the same environmental gradients as one another. For example, the distance from a reef to the closest seagrass meadows had opposite effects on the distributions of S. ghobban and S. rubroviolaceus on reefs. Scarus rubroviolaceus exhibited higher densities in deeper sites farther from the seagrass meadows, while S. ghobban occurred in higher densities on shallow sites closer to seagrass meadows and with higher sand cover. Other studies have also found that herbivorous fish are distributed along certain environmental gradients across the seascape, resulting in spatially variable herbivory pressure [6,10] and differences in ecosystem functions [22]. Since the three studied species showed distinctive feeding modes and substrate selections, we conclude that the functional roles of these species differ, with implications for the spatial patterns of herbivory and bioerosion across the seascape. The variation in distribution patterns can, to some extent, be linked to the life history traits of the studied species, similar to patterns observed in Caribbean seascapes related to use of nursery habitats [21,25]. Ontogenetic migrations to reefs in proximity of nursery habitats demand less energy and constitute a lower risk of exposure to predators [89]. Adult habitats in vicinity of suitable nurseries would therefore be preferable compared to adult habitats far from nurseries, with implications for fish distribution and herbivory [90]. However, in the WIO, few species of parrotfish use mangroves as nurseries and seagrass meadows may instead drive these patterns [91,92]. In our study, the negative relationship between adult S. ghobban abundance on reefs and increasing distance to seagrass meadows likely reflects this species’ dependence on seagrass meadows as a nursery. In contrast, there was a positive tendency of increased abundance of the non-nursery species S. rubroviolaceus with increasing distance to seagrass meadows. This indicates that reefs far from seagrass meadows are subjected to higher rates of bioerosion. If this relates to a different quality of nutritional resources or of water quality (i.e., turbidity) remains to be clarified. In either case, these results add to the growing body of literature that demonstrates the importance of linking seascape configuration and species life history to predict reef fish distribution and ultimately ecological function [22,23,25,93]. This study is, to our knowledge, the first study to examine these patterns in the WIO.
Effects on ecosystem function due to the presence of nursery habitats depend on the ecological traits of the species utilising these habitats. Our study shows that the three parrotfish species feed on different substrates, suggesting niche partitioning and thus a variation in effects exerted on benthic communities and seagrass systems, including on the epiphytic community on seagrass leaves. Some studies have investigated these links in the Indo-Pacific [22,23] and further studies providing detailed ecological knowledge on functional ecology of nursery species is needed to understand the relationships between ecosystem function on reefs and presence of reef fish nurseries such as seagrass meadows and mangroves. In the Bazaruto archipelago, the proximity of seagrass meadows to reefs may have little effect on EAM cover since S. ghobban did not leave bite scars on the EAM on the reefs when feeding. Similarly, biomass of S. ghobban did not influence EAM cover on reefs in an Australian seascape [23]. Instead, in our study, reefs situated near seagrass meadows were exposed to lower bioerosion rates by S. rubroviolaceus compared to reefs far from seagrass meadows. The implications of these patterns for ecosystem function should be a subject for future studies.
The differences in substrate selectivity between the two parrotfish species on the reef are supported by previous studies on stable isotopes and jaw morphology [38,79]. The selection of EAM on carbonate by S. rubroviolaceus is probably related to this species targeting endolithic algae growing under the matrix [42,94]. Endolithic algae likely contribute more to the diet of large S. rubroviolaceus individuals than to that of smaller individuals, suggested by the observation that only larger individuals left bite marks. Considering that larger individuals of S. rubroviolaceus (>34 cm) exhibited a disproportionally higher bioerosion rate, maintaining fish communities with large individuals is critical for ecosystem functioning [67,68,77]. Larger specimens produce and transport more sediments between reef zones compared to smaller ones, a process that is important for reef dynamics and island building processes [14,46,95].
The blue-barred parrotfish, S. ghobban, never left any visible bite marks, suggesting that this species feeds on epiphytic microalgae, small invertebrates and material trapped within the EAM and/or that they crop the EAM, independent of what substrate the EAM is growing on. Smaller S. ghobban (in both habitats) were also observed taking bites on bare sand, possibly targeting cyanobacteria, epiphytic microalgae and diatoms growing on the surface [42]. Trapped material in the EAM is usually composed of inorganic (sediment) and organic (microalgae and detritus) particles and while several studies have shown that sediments can impede feeding by herbivorous fishes [96,97], detritus can be highly nutritious [98,99], as well as sediment colonised by bacteria and diatoms [42]. Scarus ghobban was very abundant on reefs located on the southern region of the archipelago, which are subjected to turbid conditions as a result of their proximity to mangroves [58]. Scarus ghobban likely plays an important role in the sediment cycle in the more turbid areas, similar to patterns observed on the Great Barrier Reef, where scraping parrotfish are more common on the more turbid inner shelf [100].
The difference observed in the bite rates of L. vaigiensis and S. ghobban is related, not only to their feeding on different resources, but also to differences in their nutritional ecology. L. vaigiensis predominantly ingests seagrass leaves while S. ghobban, demonstrating a high feeding rate, most likely ingests protein-rich epiphytic flora and fauna growing on seagrass leaves and macroalgae [42,79]. Although both parrotfish species foraged together in small groups, our observations suggest they are affecting the seagrasses differently and therefore partitioning their niches and their ecological functions. Both species may, however, contribute to seagrass health by the removal of epiphytes [3,29,31] and increased turn-over of plant material induced by grazing directly on the seagrass leaves, creating positive feedback loops [34]. Linking spatial distribution of herbivorous fish to seagrass health and vulnerability to stresses can provide valuable information to management of seagrass-dominated seascapes. Since abundances of both L. vaigiensis and juvenile S. ghobban were negatively correlated with distance to land, seagrass meadows close to land were exposed to high grazing pressure (0.81 bites × min−1 × m−2 and 4.43 bites × min−1 × m−2, respectively) (Appendix A, Table A1). The number of bites by juvenile S. ghobban was also correlated with distance to mangroves, suggesting that this habitat influences grazing rates. Mangroves may influence grazing rates by exporting organic material adding to the biofilm growing on seagrass leaves that the juvenile S. ghobban were grazing on. Although feeding activity varies throughout the day (e.g., [68]), these numbers give an indication of herbivory rates and show that there can be large differences in herbivory rates in different seagrass meadows depending on their geographical location in the seascape. Due to extensive fishing in the seagrass meadows, larger individuals of L. vaigiensis were rare. A less fished area may be subjected to a higher grazing pressure due to fish sizes being more normally distributed within the population. For the same reason, the observed patterns of size structure of S. ghobban may also be skewed towards smaller individuals in the Bazaruto Archipelago.
However, the ecosystem effects due to the patterns and processes observed in this study remain to be tested. To verify the ecosystem effects observed and modelled in this study, monitoring of bite scar recovery on reefs and in seagrass habitats, as well as measuring of seagrass growth related to parrotfish herbivory are highly encouraged. Monitoring of bite scars can generate insights on ecosystem function by parrotfish herbivory. This needs to be tested in the field since bite scar recovery may differ both between reefs and on small spatial scales, with regard to the succession of algal turfs and the presence of coral recruits [76,101].
In conclusion, the spatial configuration of a seascape together with habitat characteristics influences parrotfish distribution patterns and consequently, the ecological functions and services they provide. Parrotfish utilising both reef and non-reef habitats as nursery or feeding grounds are important mobile links between habitats, linking food webs across a seascape and contributing to ecological connectivity and ecosystem resilience [21,102,103]. Disentangling these relationships across spatial scales that reflect life-history movements increases our understanding of ecological function across multi-habitat seascapes, how these overlaps with anthropogenic activities and how ontogenetic migrations may influence ecological services. With this information, fisheries managers can design spatial protection efforts that acknowledge the spatial heterogeneity of fish distributions and thus of ecological functions. This allows for marine spatial planning that emphasizes ecological resilience, a key component of planning for future environmental uncertainties such as climate change and coastal development.

Author Contributions

Conceptualization, L.E., C.B., C.E.L.F., G.O.L., T.C.M.; Methodology, L.E., G.O.L. and T.C.M.; Formal Analysis, C.A.M.M.C., L.E. and T.C.M.; Investigation, L.E., W.G., C.A.M.M.C.; Resources, C.B.; Data Curation, L.E., C.A.M.M.C.; Writing—Original Draft Preparation, L.E.; Writing—Review and Editing, L.E., W.G., T.C.M., C.A.M.M.C., C.B., G.O.L. and C.E.L.F.; Visualization, L.E.; Supervision, C.B. and C.E.L.F.; Project Administration, L.E.; Funding Acquisition, C.B. All authors have read and agreed to the published version of the manuscript.

Funding

This research was funded by The Swedish Research Council Vetenskapsrådet, grant number E0344801” and “2015-05902”.

Acknowledgments

We would like to thank R. Gustafsson for assistance in the field as well as our skipper Orlando. We would also like to thank Guillaume van Wyk and The Sanctuary, especially Hugh Brown and Pambele. Tomas Manasse, Ricardina Matusse and the Parque Nacional de Bazaruto for thorough support in the field. We are grateful to Salomão Bandeira and Damboia Cossa for support in Mozambique. G.O.L. is grateful to a research productivity scholarship provided by the Brazilian National Council for Scientific and Technological Development (CNPq; 310517/2019-2).

Conflicts of Interest

The authors declare no conflict of interest

Appendix A.—Reef Characteristics

Figure A1. Cluster dendrogram grouping the reefs with regard to benthic cover. Reefs with a higher proportion of hard coral cover are grouped in the left cluster and the rockier reefs in the right cluster.
Diversity 12 00434 g0a1
Table A1. Spatial metrics and habitat characteristics of the surveyed reefs and seagrass meadows ± standard error. Numbers in parentheses refer to numbers in Figure 1.
Reef
SiteAverage Depth [m]Coral Cover [%] EAM Cover [%] Distance to Seagrass [m] Distance to Mangroves [m]
2 Mile forereef (26)9.3 ± 1.231.5 ± 4.339.5 ± 3.5626532,187
2 Mile backreef (26)4.8 ± 1.926.4 ± 6.329.9 ± 4.2538132,266
5 Mile (25)10.1 ± 0.821.2 ± 2.9 31.2 ± 1.8999941,755
6 Mile (24)8.3 ± 1.529.7 ± 3.126.5 ± 4.41155043,671
Baluba (29)11.0 ± 1.26.5 ± 0.671.0 ± 7.845469309
Bangue (28)1.1 ± 0.10 ± 043.7 ± 5.02746923
Lighthouse (22)7.7 ± 1.33.3 ± 0.741.8 ± 4.7191064,655
Magaruque (27)6.3 ± 0.61.2 ± 0.558.6 ± 3.7303015,684
St Carolina (23)1.9 ± 0.743.2 ± 5.643.4 ± 6.6209954,090
Seagrass
Average Depth [m]Dominant Seagrass SpeciesCanopy Height [cm]Seagrass Cover [%]Distance to land [m]Distance to Mangrove [m]Distance to Reef [m]
Aguya (1)1.3 ± 0.2T. ciliatum17.6 ± 4.735.3 ± 18.02233 ± 5663,729 ± 5110,909 ± 44
Canal de Deus 1 (6)2.4 ± 0.4Cymodocea spp8.5 ± 05 ± 04774 ± 11852,575 ± 175455 ± 119
Canal de Deus 2 (7)2.4 ± 0.1Cymodocea spp9 ± 027.5 ± 54026 ± 853,825 ± 634788 ± 9
Chinungwene (20)0.9 ± 0.2T. hemprichii14.8 ± 6.633.8 ± 17.1177 ± 261058 ± 8810,175 ± 95
Marape MPA (21)1.0 ± 0.1T. hemprichii19.4 ± 6.639.1 ± 17.3203 ± 731026 ± 29913,218 ± 200
Matutuile (4)1.8 ± 0.1Cymodocea spp and T. hemprichii23 ± 6.480.3 ± 17.42247 ± 5258,991 ± 507991 ± 40
Mazarete MPA 2 (17)0.9 ± 0.2Cymodocea spp and T. hemprichii14 ± 3.137.1 ± 16.5190 ± 36598 ± 626338 ± 52
Mazarete MPA 1 (18)0.9 ± 0.2T. hemprichii16.8 ± 7.163.8 ± 20.041 ± 0172 ± 06842 ± 0
Mazarete (19)1.1 ± 0.5Cymodocea spp and T. hemprichii11.8 ± 4.427.4 ± 13.01139 ± 43484 ± 567366 ± 213
Mazarete North (15)1.0 ± 0.3Cymodocea spp and T. hemprichii9.2 ± 2.114.5 ± 5.71888 ± 1992864 ± 2434997 ± 72
Mukoque (9)1.2 ± 0.2T. ciliatum39.9 ± 8.552.9 ± 22.91404 ± 5119,888 ± 4110,218 ± 3
Murungulangene (2)1.3 ± 0.2T. ciliatum11.3 ± 1.232.9 ± 14.32365 ± 4763,731 ± 5010,048 ± 0
Palumba (14)1.1 ± 0.3Halodule uninervis12.5 ± 4.410.6 ± 7.53913 ± 385557 ± 303822 ± 30
Sitone (3)1.3 ± 0.4Cymodocea spp/T. hemprichii17 ± 4.041.3 ± 24.416 ± 2859,959 ± 545521 ± 74
St Carolina (23)0.8 ± 0.2T. ciliatum29.9 ± 5.078.3 ± 2.62468 ± 2655791 ± 412915 ± 28
Vila do Indico (8)1.5 ± 0.3T. ciliatum23.7 ± 7.774.9 ± 21.3821 ± 47024,322 ± 365012,240 ± 1647
Vilanculos 1 (10)2.3 ± 0.4T. ciliatum35.7 ± 6.982.1 ± 4.5195 ± 118,696 ± 3210,566 ± 10
Vilanculos 3 (12)1.0 ± 0.2T. ciliatum31 ± 14.688 ± 5.9491 ± 6417,588 ± 3910,290 ± 56
Vilanculos 4 (13)0.9 ± 0.1T. ciliatum41.1 ± 18.875 ± 16.0690 ± 4016,718 ± 3610,026 ± 43

Appendix B.—Fish Data

Figure A2. The steel-bar cross used to characterize the benthic cover at parrotfish bites. The intersection point was placed at the bite and substrate underneath the intersection point and at each end of the arms were noted, in order to characterize bite selectivity. Each arm is 25 cm.
Diversity 12 00434 g0a2
Figure A3. Density L. vaigiensis and S. ghobban in seagrass meadows in the Bazaruto seascape. Seagrass survey sites are ordered by distance to closest reef.
Diversity 12 00434 g0a3
Figure A4. Biomass of S. ghobban and S. rubroviolaceus at the surveyed reefs ordered by distance to seagrass meadows.
Diversity 12 00434 g0a4
Figure A5. Proportion observed bite substrates of L. vaigiensis, S. ghobban and S. rubroviolaceus on reefs and in seagrass meadows on all survey sites. “Mazarete non- prot” corresponds to non-protected seagrass meadow.
Diversity 12 00434 g0a5
Figure A6. Bite marks of L. vaigiensis on seagrass leaves.
Diversity 12 00434 g0a6
Figure A7. Bite marks of S. rubroviolaceus on reef substrate.
Diversity 12 00434 g0a7

References

  1. Lewis, S.M. The Role of Herbivorous Fishes in the Organization of a Caribbean Reef Community. Ecol. Monogr. 1986, 56, 183–200. [Google Scholar] [CrossRef]
  2. Nyström, M.; Folke, C. Spatial Resilience of Coral Reefs. Ecosystems 2001, 4, 406–417. [Google Scholar] [CrossRef]
  3. Valentine, J.F.; Duffy, J.E. The Central Role of Grazing in Seagrass Ecology. In Seagrasses: Biology, Ecology and Conservation; Larkum, A.W.D., Orth, R.J., Duarte, C.M., Eds.; Springer: Dordrecht, The Netherlands, 2006; pp. 463–501. [Google Scholar]
  4. Burkepile, D.E.; Hay, M.E. Herbivore Vs. Nutrient Control of Marine Primary Producers: Context-Dependent Effects. Ecology 2006, 87, 3128–3139. [Google Scholar] [CrossRef] [Green Version]
  5. Burkepile, D.E.; Hay, M.E. Herbivore species richness and feeding complementarity affect community structure and function on a coral reef. Proc. Natl. Acad. Sci. USA 2008, 105, 16201–16206. [Google Scholar] [CrossRef] [PubMed] [Green Version]
  6. Vergés, A.; Vanderklift, M.A.; Doropoulos, C.; Hyndes, G.A. Spatial Patterns in Herbivory on a Coral Reef Are Influenced by Structural Complexity but Not by Algal Traits. PLoS ONE 2011, 6, e17115. [Google Scholar] [CrossRef] [PubMed] [Green Version]
  7. Jones, G.P.; Andrew, N.L. Herbivory and patch dynamics on rocky reefs in temperate Australasia: The roles of fish and sea urchins. Austral Ecol. 1990, 15, 505–520. [Google Scholar] [CrossRef]
  8. McClanahan, T.; Nugues, M.; Mwachireya, S. Fish and sea urchin herbivory and competition in Kenyan coral reef lagoons: The role of reef management. J. Exp. Mar. Biol. Ecol. 1994, 184, 237–254. [Google Scholar] [CrossRef]
  9. McCook, L.J. Macroalgae, nutrients and phase shifts on coral reefs: Scientific issues and management consequences for the Great Barrier Reef. Coral Reefs 1999, 18, 357–367. [Google Scholar] [CrossRef]
  10. Swindells, K.L.; Murdoch, R.J.; Bazen, W.D.; Harman, N.W.; Unsworth, R.K. Habitat Configuration Alters Herbivory across the Tropical Seascape. Front. Mar. Sci. 2017, 4. [Google Scholar] [CrossRef] [Green Version]
  11. Rasher, D.B.; Hoey, A.S.; Hay, M.E. Consumer diversity interacts with prey defenses to drive ecosystem function. Ecology 2013, 94, 1347–1358. [Google Scholar] [CrossRef] [Green Version]
  12. Bonaldo, R.M.; Bellwood, D.R. Spatial variation in the effects of grazing on epilithic algal turfs on the Great Barrier Reef, Australia. Coral Reefs 2010, 30, 381–390. [Google Scholar] [CrossRef]
  13. Ledlie, M.H.; Graham, N.A.J.; Bythell, J.C.; Wilson, S.K.; Jennings, S.; Polunin, N.V.C.; Hardcastle, J. Phase shifts and the role of herbivory in the resilience of coral reefs. Coral Reefs 2007, 26, 641–653. [Google Scholar] [CrossRef]
  14. Morgan, K.; Kench, P.S. Parrotfish erosion underpins reef growth, sand talus development and island building in the Maldives. Sediment. Geol. 2016, 341, 50–57. [Google Scholar] [CrossRef]
  15. Henderson, C.; Olds, A.D.; Lee, S.Y.; Gilby, B.; Maxwell, P.; Connolly, R.M.; Stevens, T. Marine reserves and seascape context shape fish assemblages in seagrass ecosystems. Mar. Ecol. Prog. Ser. 2017, 566, 135–144. [Google Scholar] [CrossRef]
  16. Dorenbosch, M.; Grol, M.G.G.; Nagelkerken, I.; Van Der Velde, G. Different Surrounding Landscapes may Result in Different Fish Assemblages in East African Seagrass Beds. Hydrobiologia 2006, 563, 45–60. [Google Scholar] [CrossRef]
  17. Hoey, A.S.; Bellwood, D.R. Cross-shelf variation in browsing intensity on the Great Barrier Reef. Coral Reefs 2010, 29, 499–508. [Google Scholar] [CrossRef]
  18. Pittman, S.; Caldow, C.; Hile, S.; Monaco, M. Using Seascape Types to Explain the Spatial Patterns of Fish in the Mangroves of SW Puerto Rico. Mar. Ecol. Prog. Ser. 2007, 348, 273–284. [Google Scholar] [CrossRef] [Green Version]
  19. Streit, R.P.; Cumming, G.S. Patchy delivery of functions undermines functional redundancy in a high diversity system. Funct. Ecol. 2019, 33, 1144–1155. [Google Scholar] [CrossRef]
  20. Mumby, P.J.; Edwards, A.J.; Arias-Gonzàlez, E.; Lindeman, K.C.; Blackwell, P.G.; Gall, A. Mangroves enhance the biomass of coral reef fish communities in the Caribbean. Nature 2004, 427, 533–536. [Google Scholar] [CrossRef] [Green Version]
  21. Harborne, A.R.; Nagelkerken, I.; Wolff, N.H.; Bozec, Y.-M.; Dorenbosch, M.; Grol, M.G.G.; Mumby, P.J. Direct and indirect effects of nursery habitats on coral-reef fish assemblages, grazing pressure and benthic dynamics. Oikos 2016, 125, 957–967. [Google Scholar] [CrossRef]
  22. Martin, T.S.H.; Olds, A.D.; Olalde, A.B.H.; Berkström, C.; Gilby, B.L.; Schlacher, T.A.; Butler, I.R.; Yabsley, N.A.; Zann, M.; Connolly, R.M. Habitat proximity exerts opposing effects on key ecological functions. Landsc. Ecol. 2018, 33, 1273–1286. [Google Scholar] [CrossRef] [Green Version]
  23. Yabsley, N.A.; Olds, A.D.; Connolly, R.M.; Martin, T.S.H.; Gilby, B.L.; Maxwell, P.S.; Huijbers, C.M.; Schoeman, D.S.; Schlacher, T.A. Resource type influences the effects of reserves and connectivity on ecological functions. J. Anim. Ecol. 2015, 85, 437–444. [Google Scholar] [CrossRef] [Green Version]
  24. Knudby, A.; Jupiter, S.D.; Roelfsema, C.M.; Lyons, M.B.; Phinn, S.R. Mapping Coral Reef Resilience Indicators Using Field and Remotely Sensed Data. Remote. Sens. 2013, 5, 1311–1334. [Google Scholar] [CrossRef] [Green Version]
  25. Claydon, J.A.B.; Calosso, M.; De Leo, G.A.; Peachey, R. Spatial and demographic consequences of nursery-dependence in reef fishes: An empirical and simulation study. Mar. Ecol. Prog. Ser. 2015, 525, 171–183. [Google Scholar] [CrossRef] [Green Version]
  26. Nagelkerken, I.; Dorenbosch, M.; Verbeck, W.C.E.P.; Cocheret de la Moriniere, E.; van der Velde, G. Day-night shifts of fishes between shallow-water biotopes of a Caribbean bay, with emphasis on the nocturnal feeding of Haemulidae and Lutjanidae. Mar Ecol. 2000, 194, 55–64. [Google Scholar] [CrossRef] [Green Version]
  27. Meyer, J.L.; Schultz, E.T. Migrating haemulid fishes as a source of nutrients and organic matter on coral reefs. Limnol Oceanogr. 1985, 30, 146–156. [Google Scholar] [CrossRef] [Green Version]
  28. Mitchell, M.G.E.; Bennett, E.M.; Gonzalez, A. Linking Landscape Connectivity and Ecosystem Service Provision: Current Knowledge and Research Gaps. Ecosystems. 2013, 16, 894–908. [Google Scholar] [CrossRef]
  29. Montfrans, J.; Wetzel, R.L.; Orth, R.J. Epiphyte-Grazer Relationships in Seagrass Meadows Consequences for Seagrass Growth and Production I. Estuaries 1984, 7, 289–309. [Google Scholar] [CrossRef]
  30. Hughes, T.P.; Rodrigues, M.J.; Bellwood, D.R.; Ceccarelli, D.; Hoegh-Guldberg, O.; McCook, L.; Moltschaniwskyj, N.; Pratchett, M.S.; Steneck, R.S.; Willis, B. Phase Shifts, Herbivory and the Resilience of Coral Reefs to Climate Change. Curr. Biol. 2007, 17, 360–365. [Google Scholar] [CrossRef] [Green Version]
  31. Hauxwell, J.; Cebrián, J.; Valiela, I. Eelgrass Zostera marina loss in temperate estuaries: Relationship to land-derived nitrogen loads and effect of light limitation imposed by algae. Mar. Ecol. Prog. Ser. 2003, 247, 59–73. [Google Scholar] [CrossRef] [Green Version]
  32. Bellwood, D.R.; Hughes, T.P.; Folke, C.; Nyström, M. Confronting the coral reef crisis. Nature 2004, 429, 827–833. [Google Scholar] [CrossRef] [PubMed]
  33. Hughes, A.; Bando, K.; Rodriguez, L.; Williams, S. Relative effects of grazers and nutrients on seagrasses: A meta-analysis approach. Mar. Ecol. Prog. Ser. 2004, 282, 87–99. [Google Scholar] [CrossRef] [Green Version]
  34. Maxwell, P.S.; Ekl, J.S.; Katwijk, M.M.; Van Brien, K.R.O. The fundamental role of ecological feedback mechanisms for the adaptive management of seagrass ecosystems—A review. Biol. Rev. 2016, 92, 1521–1538. [Google Scholar] [CrossRef] [Green Version]
  35. Thyresson, M.; Nyström, M.; Crona, B. Trading with Resilience: Parrotfish Trade and the Exploitation of Key-Ecosystem Processes in Coral Reefs. Coast. Manag. 2011, 39, 396–411. [Google Scholar] [CrossRef]
  36. Scheffer, M.; Carpenter, S.; Foley, J.A.; Folke, C.; Walker, B. Catastrophic shifts in ecosystems. Nature 2001, 413, 591–596. [Google Scholar] [CrossRef]
  37. Hughes, T.P.; Bellwood, D.R.; Folke, C.; Steneck, R.S.; Wilson, J. New paradigms for supporting the resilience of marine ecosystems. Trends Ecol. Evol. 2005, 20, 380–386. [Google Scholar] [CrossRef] [PubMed]
  38. Bellwood, D.R.; Choat, J.H. A functional analysis of grazing in parrotfishes (family Scaridae): The ecological implications. Environ. Biol. Fishes 1990, 28, 189–214. [Google Scholar] [CrossRef]
  39. Bonaldo, R.; Hoey, A.S.; Bellwood, D.R. The Ecosystem Roles of Parrotfishes on Tropical Reefs. Oceanogr. Mar. Biol. 2014, 52, 81–132. [Google Scholar]
  40. Wilson, S.K.; Bellwood, D.R.; Choat, J.H.; Furnas, M.J. Detritus in the Epilithic Algal Matrix and Its Use by Coral Reef Fishes. Oceanogr. Mar. Biol. Annu. Rev. 2003, 41, 279–309. [Google Scholar]
  41. Choat, J.H.; Robbins, W.D.; Clements, K.D. The trophic status of herbivorous fishes on coral reefs. Mar. Biol. 2004, 145, 445–454. [Google Scholar] [CrossRef]
  42. Clements, K.D.; German, D.P.; Piché, J.; Tribollet, A.; Choat, J.H. Integrating ecological roles and trophic diversification on coral reefs: Multiple lines of evidence identify parrotfishes as microphages. Biol. J. Linn. Soc. 2016, 120, 729–751. [Google Scholar] [CrossRef]
  43. Hunte, W.; Wittenberg, M. Effects on eutrophication and sedimentation on juvenile corals. Mar Biol. 1992, 631, 625–631. [Google Scholar] [CrossRef]
  44. Birrell, C.L.; McCook, L.J.; Willis, B.L. Effects of algal turfs and sediment on coral settlement. Mar. Pollut. Bull. 2005, 51, 408–414. [Google Scholar] [CrossRef]
  45. Mumby, P.J. The Impact of Exploiting Grazers (Scaridae) on the Dynamics of Caribbean Coral Reefs. Ecol. Appl. 2006, 16, 747–769. [Google Scholar] [CrossRef] [Green Version]
  46. Perry, C.T.; Kench, P.S.; Leary, M.J.O.; Morgan, K.M. Linking reef ecology to island building: Parrotfish identified as major producers of island-building sediment in the Maldives. Geology 2015, 43, 503–506. [Google Scholar] [CrossRef]
  47. Goatley, C.H.R.; Bellwood, D.R. Sediment suppresses herbivory across a coral reef depth gradient. Biol. Lett. 2012, 8, 1016–1018. [Google Scholar] [CrossRef]
  48. Goatley, C.H.R.; Bellwood, D.R. Ecological Consequences of Sediment on High-Energy Coral Reefs. PLoS ONE 2013, 8, e77737. [Google Scholar] [CrossRef]
  49. Airoldi, L. The effects of sedimentation on rocky coast assemblages. Oceanogr. Mar. Biol. 2003, 41, 161–236. [Google Scholar]
  50. Lobel, P.S.; Ogden, J.C. Foraging by the herbivorous parrotfish Sparisoma radians. Mar. Biol. 1981, 64, 173–183. [Google Scholar] [CrossRef]
  51. Locham, A.G.; Kaunda-Arara, B.; Wakibia, J.G.; Muya, S. Diet and niche breadth variation in the marbled parrotfish, Leptoscarus vaigiensis, among coral reef sites in Kenya. Afr. J. Ecol. 2015, 53, 560–571. [Google Scholar] [CrossRef]
  52. Lee, C.-L.; Huang, Y.-H.; Chen, C.-H.; Lin, H.-J. Remote underwater video reveals grazing preferences and drift export in multispecies seagrass beds. J. Exp. Mar. Biol. Ecol. 2016, 476, 1–7. [Google Scholar] [CrossRef]
  53. Cheal, A.J.; Emslie, M.; MacNeil, M.A.; Miller, I.; Sweatman, H. Spatial variation in the functional characteristics of herbivorous fish communities and the resilience of coral reefs. Ecol. Appl. 2013, 23, 174–188. [Google Scholar] [CrossRef] [Green Version]
  54. Henderson, C.J.; Gilby, B.L.; Lee, S.Y.; Stevens, T. Contrasting effects of habitat complexity and connectivity on biodiversity in seagrass meadows. Mar. Biol. 2017, 164, 117. [Google Scholar] [CrossRef]
  55. Pittman, S.J.; McAlpine, C.A.; Pittman, K.M. Linking fish and prawns to their environment: A hierarchical landscape approach. Mar. Ecol. Prog. Ser. 2004, 283, 233–254. [Google Scholar] [CrossRef]
  56. Bierwagen, S.L.; Heupel, M.R.; Chin, A.; Simpfendorfer, C.A. Trophodynamics as a Tool for Understanding Coral Reef Ecosystems. Front. Mar. Sci. 2018, 5. [Google Scholar] [CrossRef] [Green Version]
  57. Olds, A.D.; Pitt, K.A.; Connolly, R.M.; Maxwell, P.S. Primacy of seascape connectivity effects in structuring reef fish assemblages. Mar. Ecol. Prog. Ser. 2012, 462, 191–203. [Google Scholar] [CrossRef] [Green Version]
  58. Everett, B.I.; Van der Elst, R.P.; Schleyer, M.H. A Natural History of the Bazaruto Archipelago, 1st ed.; Everett, B.I., Van der Elst, R.P., Schleyer, M.H., Eds.; South African Association for Marine Biological Research: Durban, South Africa, 2008; pp. 1–126. [Google Scholar]
  59. D’Agata, C. Social and Ecological Factors Influencing Small-Scale Fisheries in the Bay of Bazaruto, Mozambique. Master’s Thesis, Stockholm University, Stockholm, Sweden, 2016. [Google Scholar]
  60. Díaz, P.; Luís, L.; Mafambissa, M.; Uetimane, A.; Madeira, P.D.; Chambal, E.M. Parque Nacional de Arquipélago de Bazaruto (PNAB). Plano de Maneio 2016–2025 de uma área de Conservação Marinha, Província de Inhambane, Moçambique; Ministério da Terra, Ambiente e Desenvolvimento Rural (MITADER): Maputo, Mozambique, 2016; Volume 1. (In Portuguese) [Google Scholar]
  61. Taquet, M.; Diringer, A. Fishes of the Indian Ocean and Red Sea, 2nd ed; Editions Quae: Versailles Cedex, France, 2012; p. 224. [Google Scholar]
  62. Froese, R.; Pauly, D. FishBase. World Wide Web Electronic Publication Version (12/2019). 2019. Available online: www.fishbase.org (accessed on 2 November 2020).
  63. Maggs, J.Q.; Floros, C.; Pereira, M.A.M.; Schleyer, M.H. Short Communication: Rapid Visual Assessment of Fish Communities on Selected Reefs in the Bazaruto Archipelago. West Indian Ocean J. Mar. Sci. 2010, 9, 115–134. [Google Scholar]
  64. McClanahan, T.R.; Graham, N.A.J.; Maina, J.M.; Chabanet, P.; Bruggemann, J.; Polunin, N.V.C. Influence of instantaneous variation on estimates of coral reef fish populations and communities. Mar. Ecol. Prog. Ser. 2007, 340, 221–234. [Google Scholar] [CrossRef]
  65. Grandcourt, E.M. Demographic characteristics of a selection of exploited reef fish from the Seychelles: Preliminary study. Mar. Freshw. Res. 2002, 53, 123–130. [Google Scholar] [CrossRef]
  66. Howard, K.G.; Claisse, J.T.; Clark, T.B.; Boyle, K.S.; Parrish, J.D. Home range and movement patterns of the Redlip Parrotfish (Scarus rubroviolaceus) in Hawaii. Mar. Biol. 2013, 160, 1583–1595. [Google Scholar] [CrossRef]
  67. Ong, L.; Holland, K.N. Bioerosion of coral reefs by two Hawaiian parrotfishes: Species, size differences and fishery implications. Mar. Biol. 2010, 157, 1313–1323. [Google Scholar] [CrossRef]
  68. Yarlett, R.T.; Perry, C.T.; Wilson, R.W.; Philpot, K.E. Constraining species—Size class variability in rates of parrotfish bioerosion on Maldivian coral reefs: Implications for regional-scale bioerosion estimates. Mar. Ecol. Prog. Ser. 2018, 590, 155–169. [Google Scholar] [CrossRef]
  69. Gullström, M.; Castro, M.D.L.T.; Bandeira, S.O.; Björk, M.; Dahlberg, M.; Kautsky, N.; Rönnbäck, P.; Öhman, M.C. Seagrass Ecosystems in the Western Indian Ocean. Ambio 2002, 31, 588–596. [Google Scholar] [CrossRef] [PubMed]
  70. Eggertsen, L. Identification and Implications of Fish Nurseries in Tropical and Subtropical Seascapes. Ph.D. Thesis, Stockholm University, Stockholm, Sweden, 15 March 2019. [Google Scholar]
  71. Torre-Castro, M.; Eklöf, J.S.; Rönnbäck, P.; Björk, M. Seagrass Importance in Food Provisioning Services: Fish Stomach Content as a Link between Seagrass Meadows and Local Fisheries. West. Indian Ocean J Mar Sci. 2008, 7, 95–110. [Google Scholar] [CrossRef] [Green Version]
  72. Jiddawi, N.; Öhman, M.C. Marine Fisheries in Tanzania. Ambio 2002, 31, 518–527. [Google Scholar] [CrossRef] [PubMed]
  73. Cinner, J.E.; McClanahan, T.R.; Graham, N.A.J.; Pratchett, M.S.; Wilson, S.K.; Raina, J.-B. Gear-based fisheries management as a potential adaptive response to climate change and coral mortality. J. Appl. Ecol. 2009, 46, 724–732. [Google Scholar] [CrossRef]
  74. Gullström, M.; Bodin, M.; Nilsson, P.; Öhman, M. Seagrass structural complexity and landscape configuration as determinants of tropical fish assemblage composition. Mar. Ecol. Prog. Ser. 2008, 363, 241–255. [Google Scholar] [CrossRef] [Green Version]
  75. Berkström, C.; Eggertsen, L.; Goodell, W.; Cordeiro, C.A.M.M.; Lucena, M.B.; Gustafsson, R.; Bandeira, S.; Jiddawi, N.; Ferreira, C.L. Thresholds in seascape connectivity: The spatial arrangement of nursery habitats structure fish communities on nearby reefs. Ecography 2020, 43, 882–896. [Google Scholar] [CrossRef]
  76. Bonaldo, R.M.; Bellwood, D.R. Dynamics of parrotfish grazing scars. Mar. Biol. 2009, 156, 771–777. [Google Scholar] [CrossRef]
  77. Lokrantz, J.; Nystrom, M.; Thyresson, M.; Johansson, C. The non-linear relationship between body size and function in parrotfishes. Coral Reefs 2008, 27, 967–974. [Google Scholar] [CrossRef]
  78. Plass-Johnson, J.G.; McQuaid, C.D.; Hill, J.M. The effects of tissue type and body size onδ13C andδ15N values in parrotfish (Labridae) from Zanzibar, Tanzania. J. Appl. Ichthyol. 2015, 31, 633–637. [Google Scholar] [CrossRef]
  79. Plass-Johnson, J.G.; McQuaid, C.D.; Hill, J.M. Stable isotope analysis indicates a lack of inter- and intra-specific dietary redundancy among ecologically important coral reef fishes. Coral Reefs 2012, 32, 429–440. [Google Scholar] [CrossRef]
  80. Brock, R.E. A critique of the visual census method for assessing coral reef fish populations. Bull. Mar. Sci. 1982, 32, 269–276. [Google Scholar]
  81. Trygonis, V.; Sini, M. photoQuad: A dedicated seabed image processing software and a comparative error analysis of four photoquadrat methods. J. Exp. Mar. Biol. Ecol. 2012, 424, 99–108. [Google Scholar] [CrossRef]
  82. Boström, C.; Jackson, E.L.; Simenstad, C.A. Seagrass landscapes and their effects on associated fauna: A review. Estuar. Coast. Shelf Sci. 2006, 68, 383–403. [Google Scholar] [CrossRef]
  83. Morgan, K.; Kench, P. Skeletal extension and calcification of reef-building corals in the central Indian Ocean. Mar. Environ. Res. 2012, 81, 78–82. [Google Scholar] [CrossRef]
  84. Legendre, P.; Gallagher, E.D. Ecologically meaningful transformations for ordination of species data. Oecologia 2001, 129, 271–280. [Google Scholar] [CrossRef]
  85. Team R DC. R: A Language and Environment for Statistical Computing; R Foundation for Statistical Computing: Vienna, Austria, 2008. [Google Scholar]
  86. Strauss, R.E. Reliability Estimates for Ivlev’s Electivity Index, the Forage Ratio and a Proposed Linear Index of Food Selection. Trans. Am. Fish. Soc. 1979, 108, 344–352. [Google Scholar] [CrossRef]
  87. Burnham, K.; Anderson, D. Model Selection and Multimodel Inference: A Practical Information-Theoretic Approach, 2nd ed.; Springer: Fort Collins, CO, USA, 2002; p. 485. [Google Scholar]
  88. Wood, S.N.; Pya, N.; Säfken, B.; Wood, S.N.; Pya, N.; Säfken, B. Smoothing Parameter and Model Selection for General Smooth Models. J. Am. Stat. Assoc. 2016, 111, 1548–1575. [Google Scholar] [CrossRef]
  89. Ecological Connectivity among Tropical Coastal Ecosystems; Nagelkerken, I. (Ed.) Springer: Heidelberg, Germany, 2009. [Google Scholar]
  90. Mumby, P. Connectivity of reef fish between mangroves and coral reefs: Algorithms for the design of marine reserves at seascape scales. Biol. Conserv. 2006, 128, 215–222. [Google Scholar] [CrossRef]
  91. Dorenbosch, M.; Grol, M.; Christianen, M.; Nagelkerken, I.; Van Der Velde, G. Indo-Pacific seagrass beds and mangroves contribute to fish density and diversity on adjacent coral reefs. Mar. Ecol. Prog. Ser. 2005, 302, 63–76. [Google Scholar] [CrossRef] [Green Version]
  92. Lugendo, B.R.; Pronker, A.; Cornelissen, I.; De Groene, A.; Nagelkerken, I.; Dorenbosch, M.; Van Der Velde, G.; Mgaya, Y.D. Habitat utilisation by juveniles of commercially important fish species in a marine embayment in Zanzibar, Tanzania. Aquat. Living Resour. 2005, 18, 149–158. [Google Scholar] [CrossRef]
  93. Mellin, C.; Andréfouët, S.; Ponton, D. Spatial predictability of juvenile fish species richness and abundance in a coral reef environment. Coral Reefs 2007, 26, 895–907. [Google Scholar] [CrossRef]
  94. Nicholson, G.M.; Clements, K.D. Resolving resource partitioning in parrotfishes (Scarini) using microhistology of feeding substrata. Coral Reefs 2020, 1–15. [Google Scholar] [CrossRef]
  95. Goatley, C.H.; Bellwood, D.R. Biologically mediated sediment fluxes on coral reefs: Sediment removal and off-reef transportation by the surgeonfish Ctenochaetus striatus. Mar. Ecol. Prog. Ser. 2010, 415, 237–245. [Google Scholar] [CrossRef]
  96. Bellwood, D.R.; Fulton, C.J. Sediment-mediated suppression of herbivory on coral reefs: Decreasing resilience to rising sea-levels and climate change? Limnol. Oceanogr. 2008, 53, 2695–2701. [Google Scholar] [CrossRef]
  97. Tebbett, S.B.; Goatley, C.H.R.; Bellwood, D.R. Fine sediments suppress detritivory on coral reefs. Mar. Pollut. Bull. 2017, 114, 934–940. [Google Scholar] [CrossRef] [PubMed]
  98. Crossman, D.J.; Choat, H.J.; Clements, K.D.; Hardy, T.; McConochie, J. Detritus as food for grazing fishes on coral reefs. Limnol. Oceanogr. 2001, 46, 1596–1605. [Google Scholar] [CrossRef]
  99. Purcell, S.; Bellwood, D. Spatial patterns of epilithic algal and detrital resources on a windward coral reef. Coral Reefs 2001, 20, 117–125. [Google Scholar] [CrossRef]
  100. Hoey, A.S.; Bellwood, D.R. Cross-shelf variation in the role of parrotfishes on the Great Barrier Reef. Coral Reefs 2007, 27, 37–47. [Google Scholar] [CrossRef]
  101. Carlson, P.M.; Davis, K.; Warner, R.R.; Caselle, J.E. Fine-scale spatial patterns of parrotfish herbivory are shaped by resource availability. Mar Ecol Prog Ser. 2017, 165–176. [Google Scholar] [CrossRef] [Green Version]
  102. Berkström, C.; Gullström, M.; Lindborg, R.; Mwandya, A.W.; Yahya, S.A.; Kautsky, N.; Nyström, M. Exploring ‘knowns’ and ‘unknowns’ in tropical seascape connectivity with insights from East African coral reefs. Estuar. Coast. Shelf Sci. 2012, 107, 1–21. [Google Scholar] [CrossRef]
  103. Lundberg, J.; Moberg, F. Mobile Link Organisms and Ecosystem Functioning: Implications for Ecosystem Resilience and Management. Ecosystems 2003, 6, 0087–0098. [Google Scholar] [CrossRef]
Figure 1. The Bazaruto archipelago showing the study sites and main habitats. Seagrass sites: 1 = Aguya, 2 = Murungulangene, 3 = Sitone, 4 = Matutuile, 5 = Santa Carolina, 6,7 = Canal de Deus 1 and 2, 8 = Vila do Indico, 9 = Mukoque, 10−13 = Vilanculos 1 -4, 14 = Palumba, 15 = Mazarete north, 16 = Mazarete MPA3, 17 = Mazarete MPA 2, 18 = Mazarete MPA 1, 19 = Mazarete, 20 = Chinungwene and 21 = Marape MPA. Reef sites: 22 = Lighthouse, 23 =Santa Carolina, 24 = Six Mile, 25 = Five Mile, 26 = 2 Mile, 27 = Magaruque, 28 = Bangue and 29 = Baluba reef. To the left are the studied species Leptoscarus vaigiensis (terminal phase), Scarus ghobban (initial phase) and Scarus rubroviolaceus (terminal phase). Photo credits C. Berkström and L Eggertsen.
Diversity 12 00434 g001
Figure 2. Redundancy ordination plots showing the influence of variables on the density and biomass of three parrotfish species; (A,B) in seagrass meadows (L. vaigiensis and juvenile S. ghobban) and (C,D) on reefs (S. ghobban and S. rubroviolaceus). Length of arrow indicate variable strength. The different survey sites are numbered as in Figure 1. R2 values (A) =0.583, (B) =0.538, (C) =0.877, (D) = 0.895.
Diversity 12 00434 g002
Figure 3. Bite rates of (A) L. vaigiensis, (B) S. ghobban and (C) S. rubroviolaceus as a function of fish size (TL). Shadowed areas indicate a 95% confidence interval and the broken line average bite rate per minute. Each dot represents an individual fish.
Diversity 12 00434 g003
Figure 4. Strauss selectivity index plots showing food item preference for S. ghobban and S. rubroviolaceus on reefs. Positive values indicate preference and negative values avoidance of an item. Dots represent averages and bars standard error. Symbols courtesy of the Integration and Application Network, University of Maryland.
Diversity 12 00434 g004
Figure 5. Relationships between significant variables and the number of bites of (A) L. vaigiensis and (BD) S. ghobban. (E,F) shows bioeroded mass CaCo3 of S. rubroviolaceus in relation to distance to seagrass (p = 0.06) and cover epilithic algal matrix (EAM) (p < 0.05). (A,B,E,F) are modelled with Generalized Additive Models (GAMs) and (D) with linear regression. Upper panels show seagrass habitats and lower panels reefs.
Diversity 12 00434 g005
Table 1. Bite rates per m2 per minute and hour in the seagrass sites. Numbers in parentheses refers to the numbers in Figure 1.
Seagrass SiteL. vaigiensisS. ghobban
Bites m−2 min−1Biomass g m−2Bites m−2 min−1Biomass g m−2
Aguya (1)0.0340.0000.2820.000
Chinungwene (20)0.2470.188 ± 0.0000.0000.000
Canal de Deus 1 (6)0.0000.0000.0000.000
Canal de Deus 2 (7)0.0000.0000.0000.000
Marape MPA (21)0.3211.319 ± 0.0980.4232.400 ± 0.043
Matutuile (4)0.2292.302 ± 0.3780.0000.000
Mazarete (19)0.2450.116 ± 0.0271.7160.062 ± 0.015
Mazarete MPA 1 (18)0.0110.050 ± 0.0270.1250.026 ± 0.009
Mazarete MPA 2 (17)0.6920.304 ± 0.0512.3510.140 ± 0.024
Mazarete North (15)0.2250.265 ± 0.0500.1250.008 ± 0.007
Mazarete MPA 3 (16)0.6931.485 ± 0.2142.4730.580 ± 0.151
Mukoque (9)0.0150.020 ± 0.0204.4351.290 ± 0.185
Murungulangene (2)0.0000.0000.0000.021 ± 0.013
Palumba (14)0.0000.0000.0000.000
Santa Carolina (23)0.0471.124 ± 1.1240.0630.071 ± 0.071
Sitone (3)0.8100.039 ± 0.0123.7620.088 ± 0.010
Vila do Indico (8)0.0680.403 ± 0.2560.8930.494 ± 0.145
Vilanculos 2 (11)0.0220.059 ± 0.0590.6900.120 ± 0.041
Vilanculos 3 (12)0.0900.281 ± 0.1060.0000.000
Vilanculos 4 (13)0.0670.110 ± 0.0560.1250.045 ± 0.036
Number of bites per hour and per m2 by S. ghobban on the reefs was significantly influenced by distance to seagrass meadows (linear model, p < 0.05) (Figure 5). Bioerosion by S. rubroviolaceus was significantly influenced by EAM cover (GAMs, p < 0.05) (Figure 5). Distance to seagrass meadows showed only a near-significant (GAMs, p = 0.07) influence on bioerosion.
Publisher’s Note: MDPI stays neutral with regard to jurisdictional claims in published maps and institutional affiliations.

